Essay

Comprehensive Geophysical Measurement in Seismic Safety Evaluation: A Case Study of East Lake High-Tech Development Zone, China

1
Institute of Seismology, CEA, Wuhan 430071, China
2
Hubei Key Laboratory of Earthquake Early Warning, Wuhan 430071, China
3
Hubei Earthquake Administration, Wuhan 430071, China
4
Wuhan Institute of Earthquake Engineering Co., Ltd., Wuhan 430071, China
*
Author to whom correspondence should be addressed.
Sustainability 2022, 14(10), 6307; https://0-doi-org.brum.beds.ac.uk/10.3390/su14106307
Submission received: 22 April 2022 / Revised: 17 May 2022 / Accepted: 17 May 2022 / Published: 22 May 2022

Abstract

:
Wuhan East Lake High-tech Development Zone is a National Innovation Demonstration Zone where several major projects are under construction. For the seismic safety evaluation of the zone, it is urgent to find out basic data such as stratigraphic structure, geometric characteristics of buried faults, and overburden thickness. In this study, seismic reflection and microtremor surveys are adopted in seismic safety evaluation in urban areas for the first time. Combined with borehole data, the overburden thickness and buried faults in the target area are detected and analyzed. The results are as follows: ① The seismic reflection detection is carried out for the possible hidden locations of the Xiangfan-Guangji Fault and Macheng-Tuanfeng Fault in the target area, and the obtained high-resolution seismic reflection profiles can be used to precisely divide the stratigraphic structure and preliminarily find out the geometric characteristics such as the strike, tendency, and the buried depth of the upper breakpoint of the buried faults. ② A microtremor survey is carried out in key regions of the target area, and the obtained velocity structure imaging can provide a perspective window into the urban underground space structure and accurately determine overburden thickness and the depth of strongly and moderately weathered bedrock. Comprehensive geophysical measurements can better realize the acquisition of basic data such as the stratigraphic structure of complex regions and characteristics of urban buried faults, which provides an important basis for seismic fortification. At the same time, the combined application of geophysical methods avoids the detection of the blind area and provides a guarantee for urban safety and sustainable development. Furthermore, the study has reference value for seismic safety evaluation in similar areas of the world. If comprehensive geophysical measurement can be popularized, its economic and scientific value will be immeasurable.

1. Introduction

Seismic safety evaluation is closely related to the sustainable development of the national economy and the safety of people’s lives and property. According to the Law of the People’s Republic of China on Protecting Against and Mitigating Earthquake Disasters, seismic safety shall be evaluated for major construction and construction projects that may induce serious secondary disasters. The requirements for fortification against earthquakes, which shall be drawn up on the basis of the results of seismic safety evaluation, shall be fulfilled [1]. Regional seismic safety evaluation is a multidisciplinary research work of seismology, geology, geotechnics, and earthquake engineering in urban areas [2], mainly including environmental assessment of seismic activities in engineering sites and neighborhoods, evaluation of seismic geological environment, fault activity identification, seismic risk analysis, determination of ground motion parameters, evaluation of seismic geological disasters [3], etc. The research can provide a more accurate and reliable basis for seismic fortification than the zonation map of seismic ground motion parameters can [4], and at the same time, it can make an objective evaluation of potential seismic and geological disasters [5]. The annual investment of about 1.2 billion yuan by the Chinese government for earthquake damage mitigation has effectively avoided earthquake disasters in the fault zone and the resulting secondary disasters, saving countless lives and property, and its economic benefits are incalculable. It is clearly stated in the national standard for Evaluation of Seismic Safety for Engineering Sites (GB17741-2005) that the geophysical method, the geochemical method, geological drilling, and the chronometric method should be adopted for investigation in overburden areas if the activity era of the known major faults cannot be determined by the data available. Thus, it is particularly important to conduct geophysical measurements in target areas. In this way, not only overburden thickness and stratigraphic structure but also the spreading and geometric characteristics of buried faults will be obtained, which can provide rich geophysical data for regional seismic safety evaluation.
A proper geophysical method should be selected for data acquisition based on the actual situation due to the limitations of the urban field environment and the influence of interference factors. At present, the major geophysical exploration methods adopted in seismic safety evaluation include seismic exploration, electrical prospecting, high-precision magnetic survey, etc. Seismic exploration and electrical prospecting are more frequently used [3]. In recent years, microtremor surveys have also become a hot spot in urban exploration. Seismic exploration is widely used in seismic safety evaluation for its high accuracy and accurate reflection of the geological structure, and especially for its key role in the discrimination of active faults [6]. In addition, due to its large range of exploration depth and high resolution, it has become the dominant tool for geophysical exploration in major engineering surveys, in both the preliminary and detailed survey stages [7]. In urban areas where seismic exploration cannot be carried out, microtremor surveys, with the advantage of being free from the restrictions of terrain and obstacles, make up for the deficiency of seismic data in obtaining velocity structure of strata and stratigraphic classification. In recent years, with seismic exploration, a series of achievements have been made in the survey of site engineering, geological conditions, and buried faults. Lin Song et al. [8,9,10] identified the geometric features of the Danjiang Fault, Liangyun Fault, and Baihe-Gucheng Fault through seismic reflection and analyzed the stress structure of the region. Liu Baojin et al. [11] exposed explicitly the developmental characteristics of the Pengzhou buried fault in the frontal area of Longmen Shan through the high-resolution seismic reflection profiles. In northeastern Hungary, 39 two-dimensional reflection seismic profiles are used to delineate and evaluate underground geothermal resources [12]. Microtremor survey [13,14,15,16,17] is also one of the hot spots of research in the field of engineering physical prospecting at present. Through a microtremor survey, Xu Peifen et al. [18] analyzed the stratigraphic structure and buried fault characteristics, Zhang Wei et al. [19] rapidly identified overburden thickness and karst development characteristics, and many other scholars have made great achievements in solving engineering geological problems [20].
The East Lake High-tech Development Zone, the target area of this study, is located in Wuhan City, with a complex tectonic environment. In addition, it belongs to a historically earthquake-prone area [21]. Therefore, it is particularly important to identify the characteristics of the stratigraphic structure and the location and geometric structure of the buried faults in the region for seismic safety evaluation. However, there are many interference factors in urban areas, leading to difficulty in carrying out geophysical work. Despite the fact that drilling is direct, its disadvantages, such as noise and environmental pollution, are inevitable. In addition, the engineering geological profiles obtained by drilling are mostly point information [22]. The combination of geophysical measurements is conducive to obtaining abundant geological information from lines and planes at the same time. Despite the fact that there are multiple geophysical methods, the general cement or asphalt-hardened pavement in urban areas makes it exceptionally difficult to obtain data by the high-density electrical method because electrodes can not be inserted into the pavement, and neither can deep stratigraphic structure information be obtained with ground-penetrating radar due to the depth limit. In our study, geophysical measurements by seismic reflection and microtremor surveys were carried out on hardened pavement in the target area and neighborhood. Seismic reflection data measurement was conducted efficiently and intactly through exciting random seismic waves with strong anti-interference ability by the vibrator vehicle; microtremor data collection was conducted by using sound frequency such as background noise or vibration information such as vibration noise in key areas where the vibrator vehicle can not get in or the vibration has an impact on construction facilities. Through processing and inversion of the original data, high-resolution seismic reflection profiles and velocity structure profiles were obtained, which provide important information such as buried fault structures and stratigraphic structures for seismic safety evaluation and seismic fortification of major engineering construction in the region. Therefore, based on the results of the comprehensive geophysical measurement, risks such as the uneven settlement of major urban projects and damage or even collapse of building structures by an earthquake can be reduced, thus reducing property and life loss and protecting urban sustainable development.

2. Geological Background of the Region

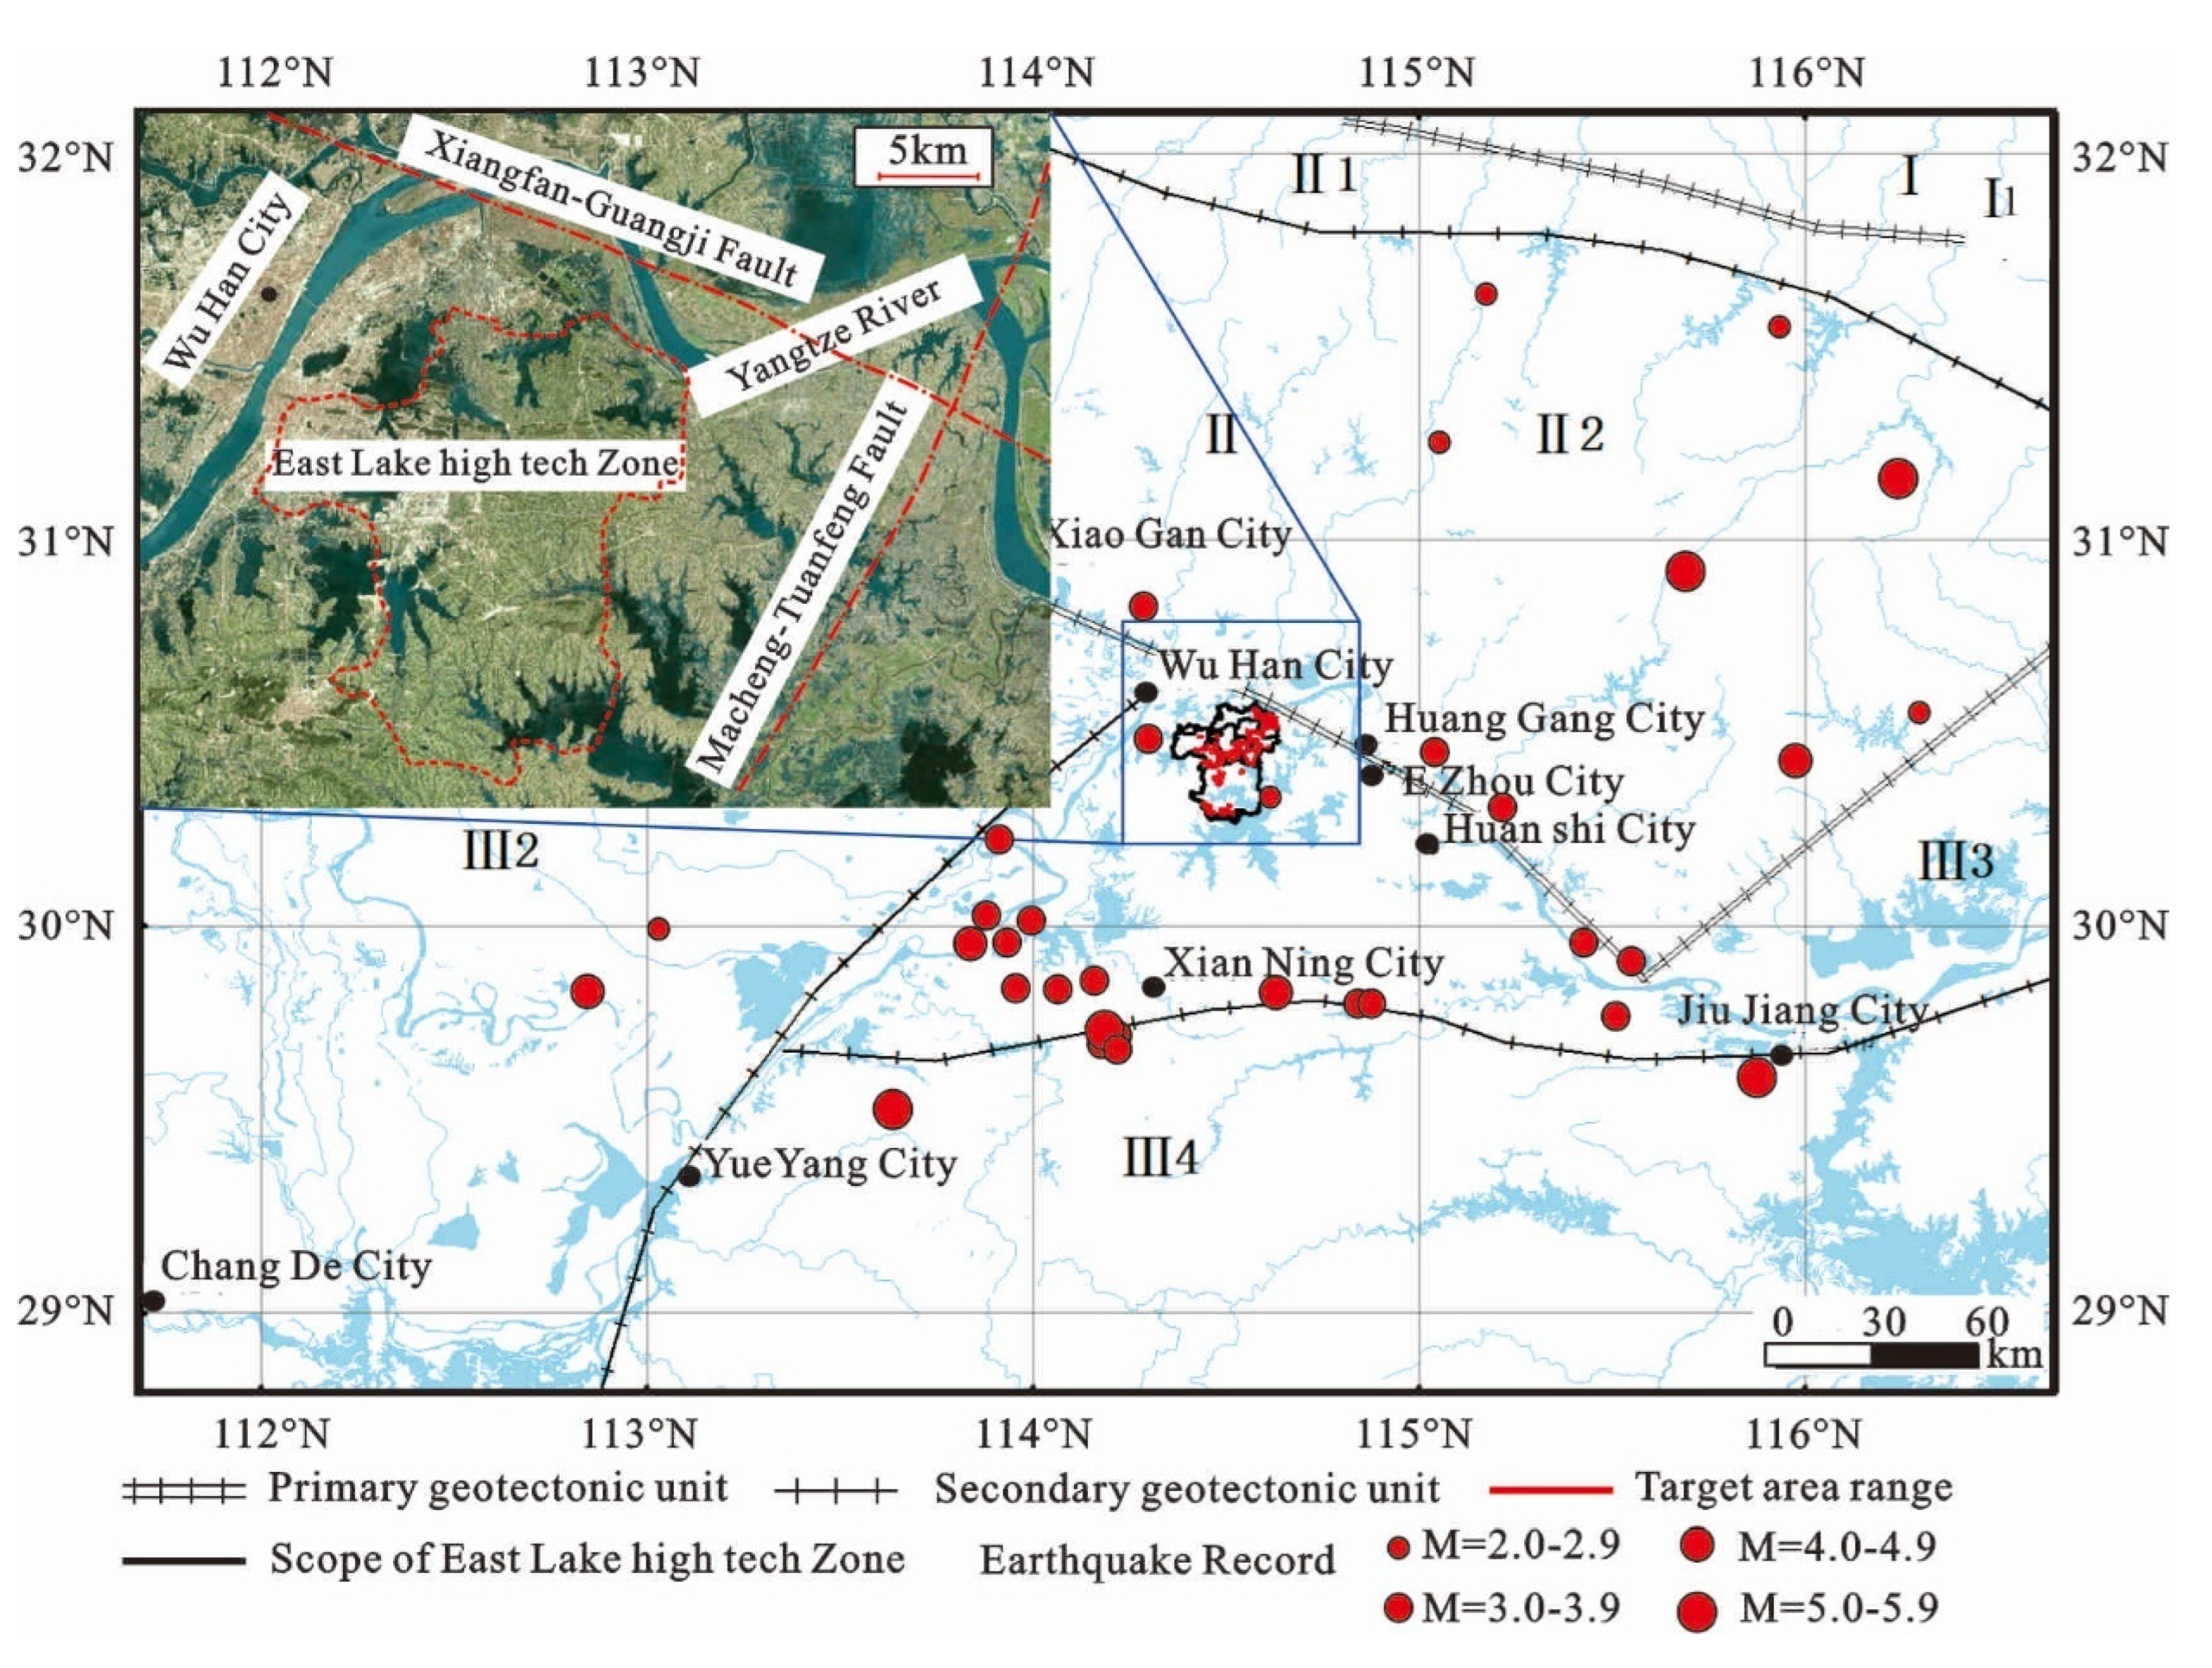
2.1. Geological Structure Zonation

East Lake High-tech Development Zone is located in the adjacent part of two tectonic units, Tongbai-Dabie Fault Uplift, and Lower Yangzi Platform Fold Belt. Bounded by the north-west Xiangfan-Guangji Fault, which crosses the zone obliquely, its southern side belongs to the Lower Yangtze Platform Fold Belt (Figure 1). The tectonic zonation can be further subdivided into the Macheng-Xinzhou Depression, the Wuhan Platform Margin Fold Belt, and the Liangzi Lake Fault. The Macheng-Xinzhou Depression is a terrestrial red basin that developed during the Cretaceous period. Its main body is controlled by the Macheng-Tuanfeng Fault, and its strike is NNE. The Wuhan Platform Margin Fold Belt is bordered by the southern edge of the Qinling-Dabie Fault Uplift, showing a series of inverted folds to the south. The Liangzi Lake Fault is a terrestrial basin formed since the Late Triassic consisting of the following two sets of strata: the Upper Triassic-Jurassic and the Cretaceous-Paleocene, and its basement is Paleo-Mesozoic sedimentary cover. The fault is transformed and controlled by the Macheng-Tuanfeng Fault, with an NNE spreading diagonal in the region.

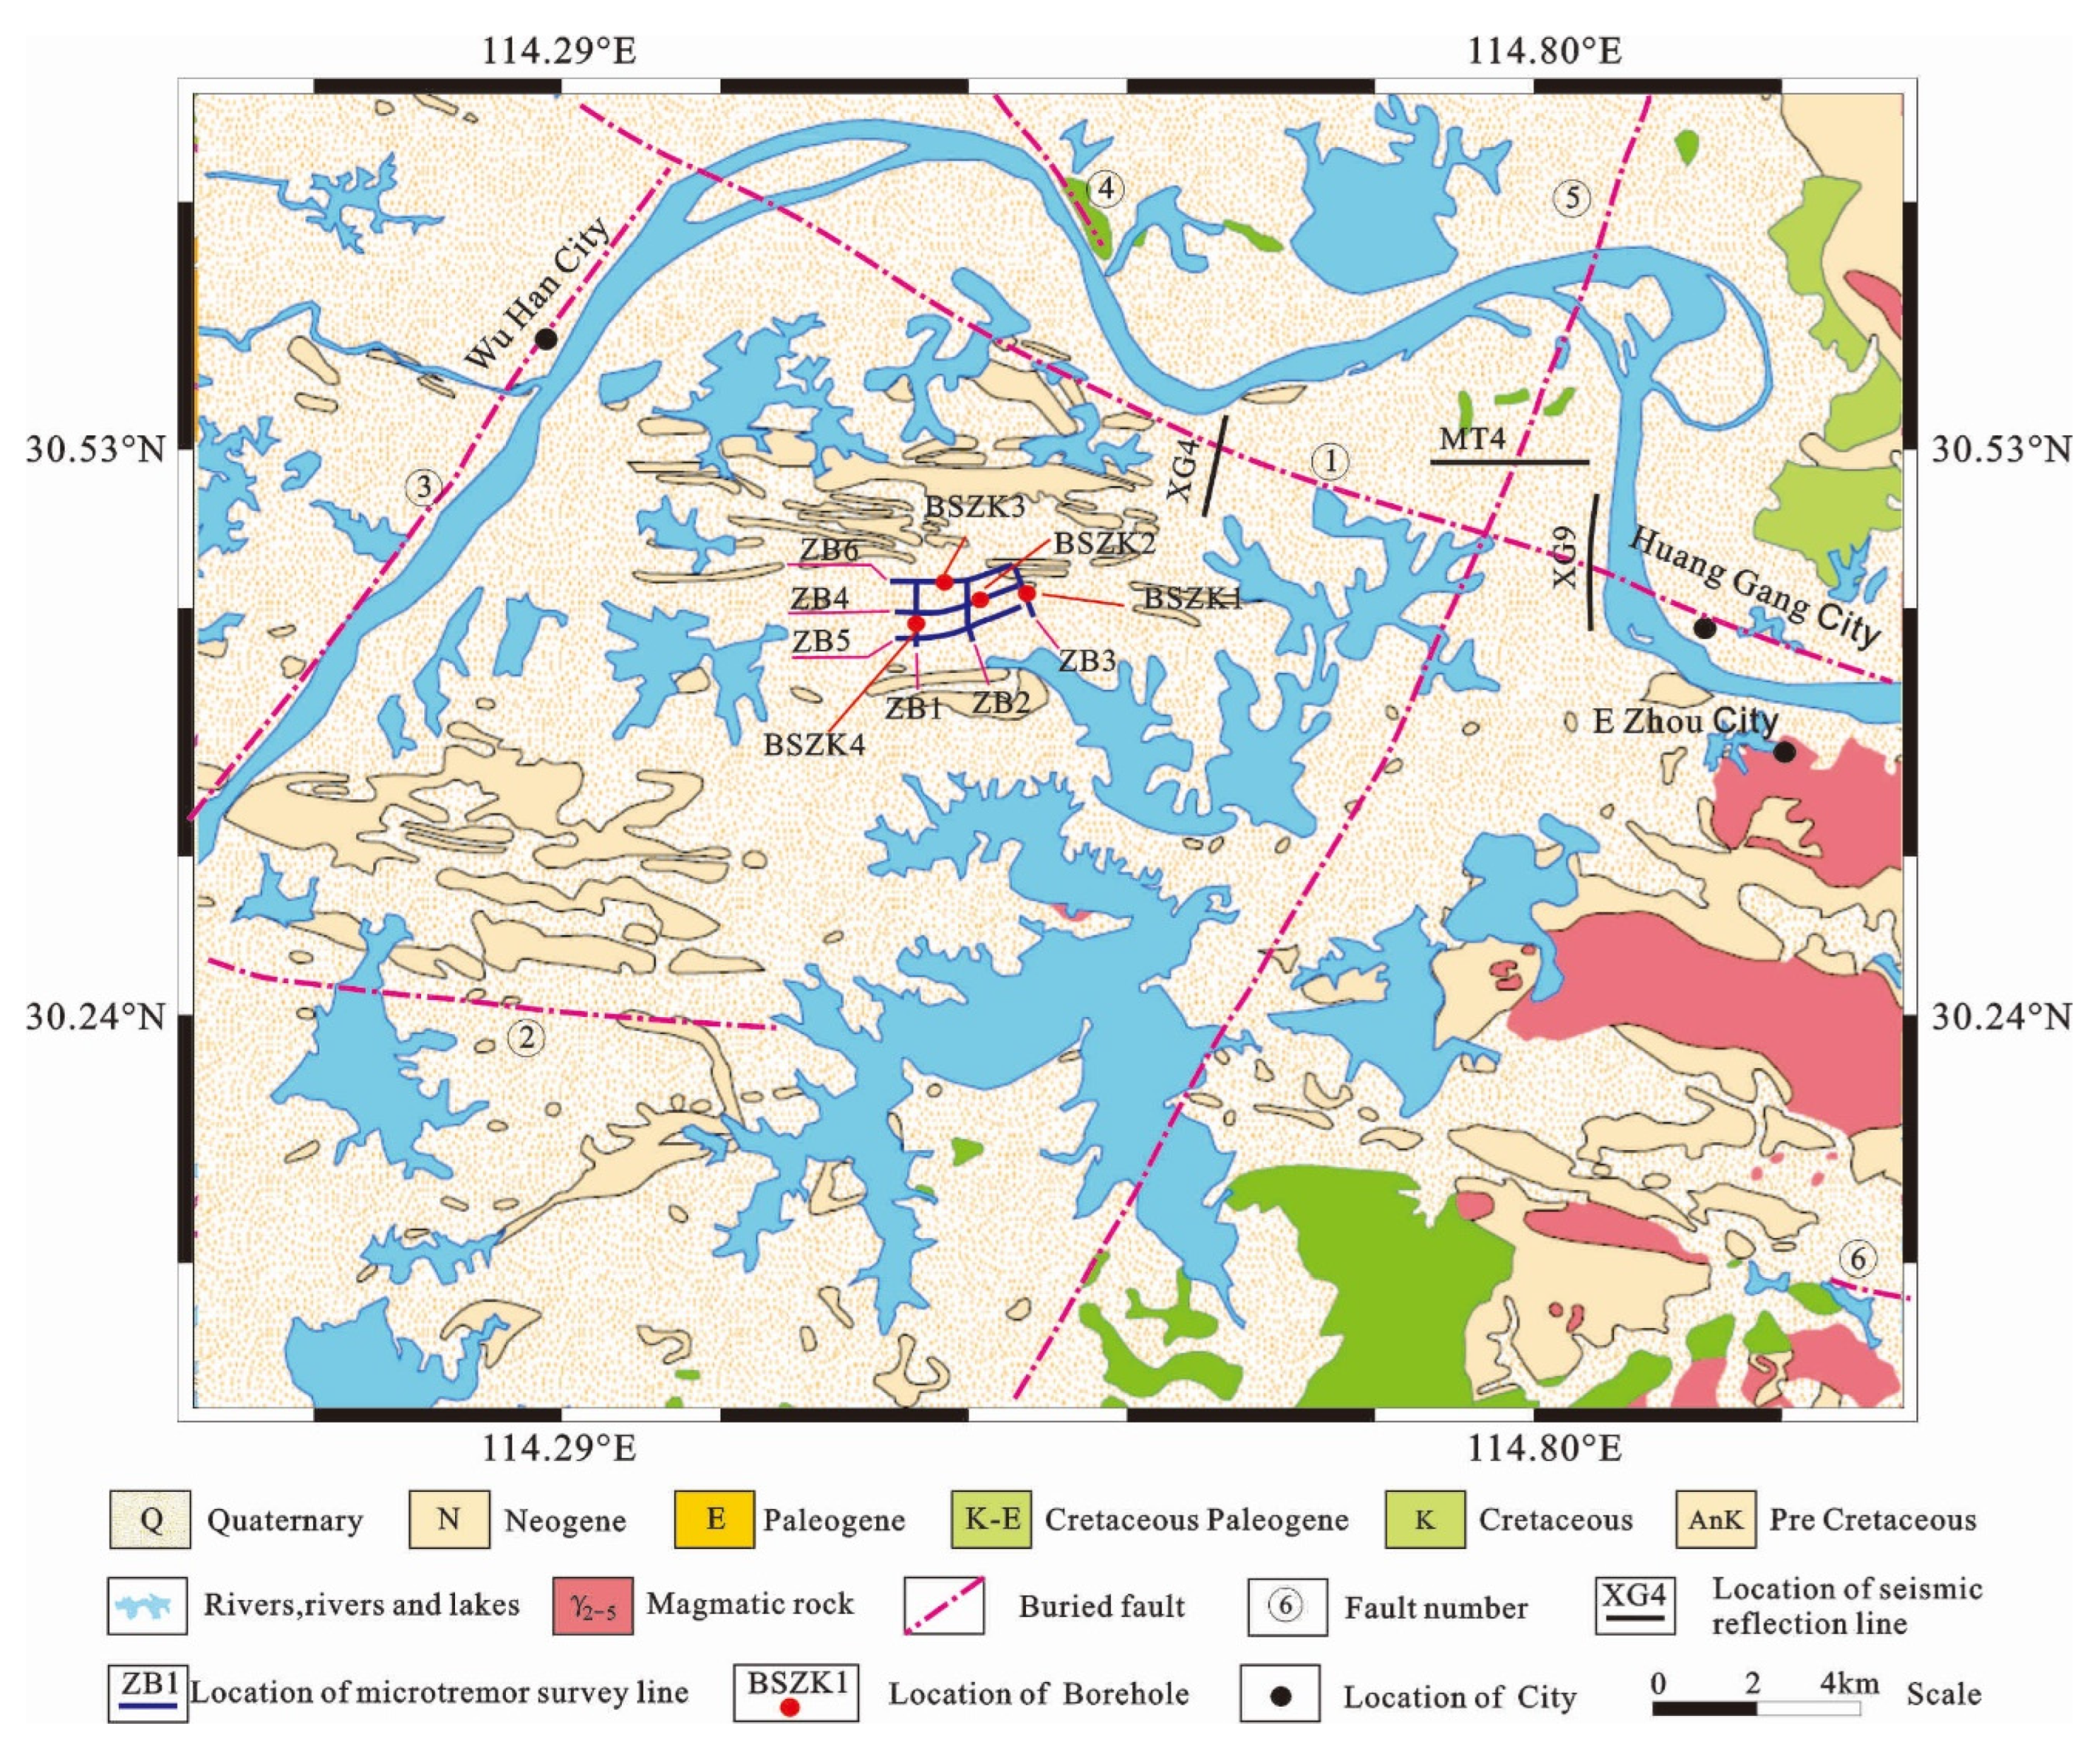
2.2. Main Faults and Features in the Region

The faults in the region are mainly NE and NW, especially NW. The Xiangfan-Guangji Fault and Tanlu Fault are the boundaries of the primary tectonic units, with complex geometric structures and multi-phase activity traces. Since the Neotectonic period, the correlation between the activity intensity of these fault zones and seismic activity has been obviously different. This paper focuses on the geophysical measurements carried out on two major faults in the region, namely, the Xiangfan-Guangji Fault and the Macheng-Tuanfeng Fault.
(1)
Xiangfan-Guangji Fault
Number ① in Figure 2 is the Xiangfan-Guangji Fault. This fault zone is the combined structure of the Tongbai-Dabie fault uplift and the Yangzi Platform Fold Belt, extending in an NW-SE direction with a length of about 380 km. There are still clear signs of activity since the Neoproterozoic. It controls the development of tectonic landforms along and on both sides of the Fault and cuts the Pliocene and Lower Pleistocene, which leads to folding and deformation of the Pliocene and Lower Pleistocene strata and creates new tectonic rocks of different activity periods. The Wuhan section is about 99 km long, most of which is covered by the Quaternary and concealed, but the fault structure can still be seen in some Mesozoic-Cenozoic strata. In the Upper Cretaceous-Paleocene strata, the fault shows an orthotropic nature. According to the water system and geomorphological features, this section of the fault has left-slip characteristics [23].
(2)
Macheng-Tuanfeng Fault
The number ⑤ in Figure 2 is Macheng-Tuanfeng Fault. It starts from the north of Shangcheng, passes through Macheng, Xinzhou, and Tuanfeng in the South and West, cuts the Xiangfan-Guangji Fault zone, and continues to extend to Liangzi Lake in the South [24], with a total length of more than 250 km. Geometrically, the main belt is arranged in a right row and right steps, with a strike of 15~25° NNE, and the main section generally tends to NW, with a dip angle of 60~70°. The southern section of the Macheng-Tuanfeng Fault is called the Liangzihu Fault, which consists of several NE trending faults, and cuts off the Xiangfan-Guangji Fault Zone to the south of Tuanfeng. To a certain extent, it acts as the lateral transformation structure of the latter, rising in the east and falling in the west, and the Quaternary activity is more obvious. In terms of macro tectonic geomorphology, the line from Ezhou to Baoban Lake has an NNE geomorphic zoning boundary with high east and low west. The height of the Middle Pleistocene hillock in the east is about 30~50 m, and that of the Upper Pleistocene and Holocene Lake floodplain in the west is only 19~26 m. The ground in the west of Liangzi Lake tilts from west to east. Since the NNE trending Xinzhou Basin and Liangzi Lake Basin and the Huarong Bulge between them are distributed in the western plate of the main fault in a right oblique row, this pattern also indicates that the Macheng-Tuanfeng Fault zone has the characteristics of dextral slip in the Quaternary.

2.3. Urgent Geological Problems to Be Solved in the Region

The geological problems of the East Lake High-tech Development Zone, an urban buried region, are as follows: (1) The distribution of faults in the area is hidden, and their geometric position, strike, and tendency are not clear; (2) Most of the sites in the region are filled lakes with weak and changeable strata of which the velocity structure and depth are not clear; (3) Due to the complex road conditions and many interference factors in the region, it is difficult to accurately obtain the stratigraphic structure and the geometric characteristics of buried faults. These problems will be effectively solved through seismic reflection and microtremor surveys in our study.

3. Geophysical Field Measurement of the Target Area

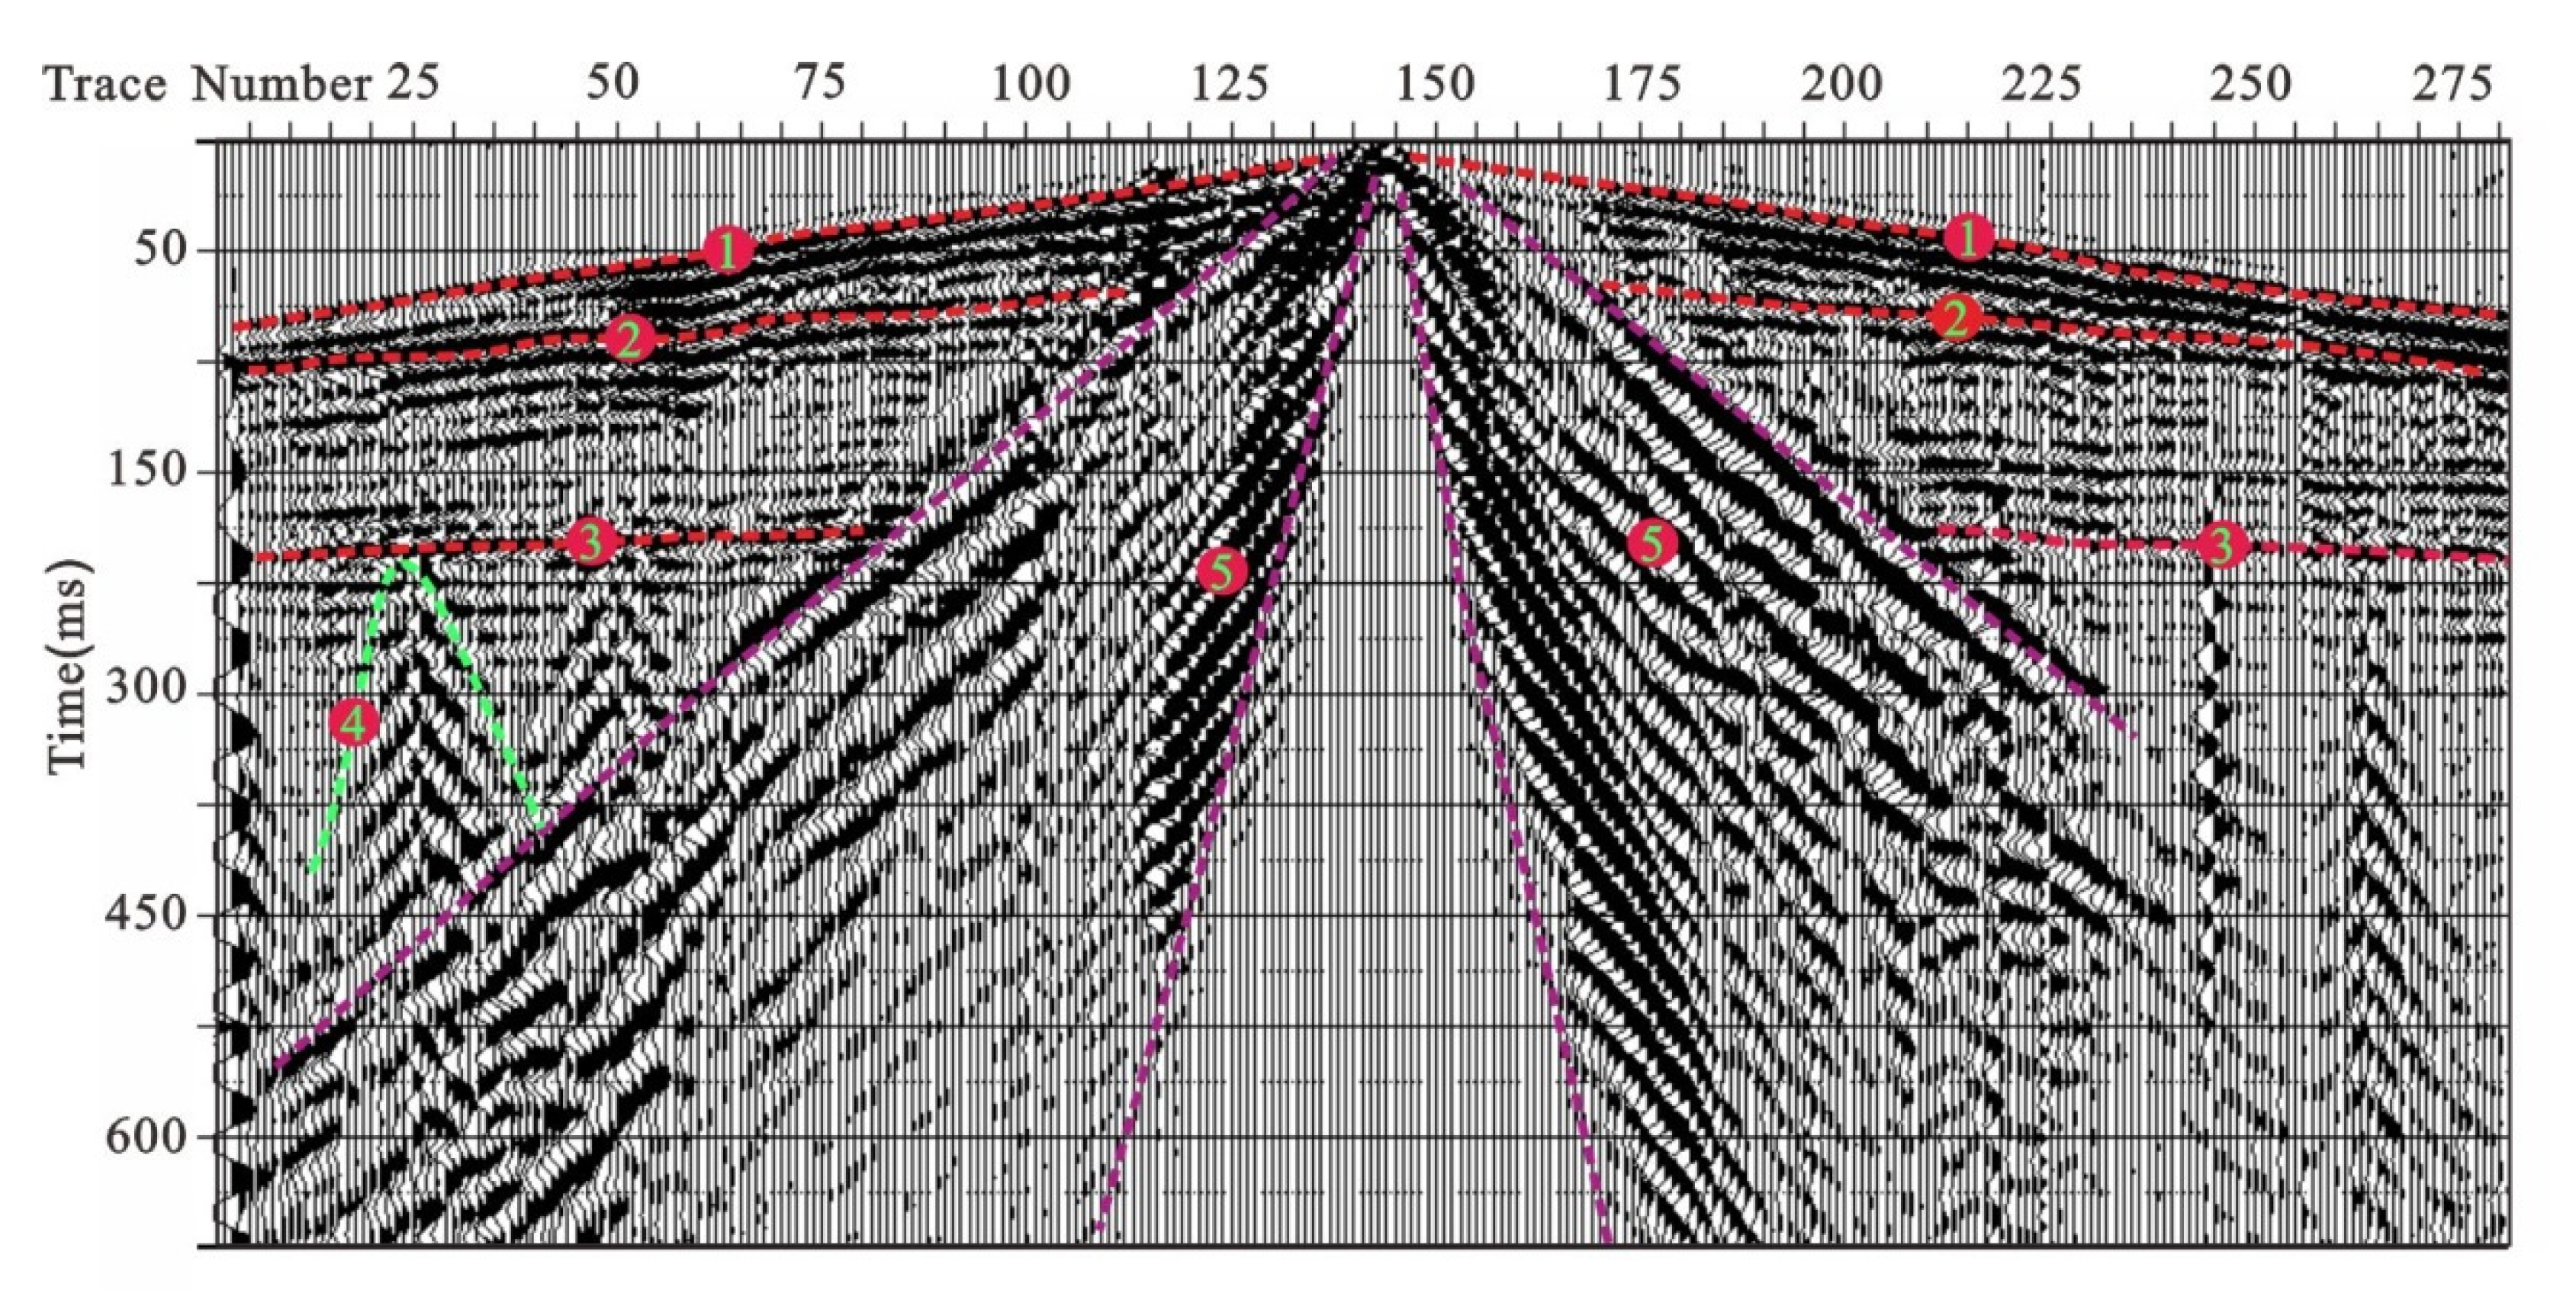
3.1. Seismic Reflection

Seismic reflection is a geophysical method to detect by using the physical difference in wave impedance between different strata. When the ground-excited incident wave propagates downward to the stratum interface, the reflected wave will be generated at the interface due to the difference in wave impedance at the interface, and then the stratification and structural development of the underground strata can be inferred by analyzing the reflected wave signals received on the ground [25].
The stratigraphic dip angle within the target area is small, which basically meets the assumption of the horizontally layered medium of the elastic wave correlation theory in seismic exploration [6]. In our study, a 428XL seismograph was used for field data acquisition. Vibrator vehicle WTC5112TZY is used as the source, with intermediate excitation, shot spacing of 8 m, and 280 traces of rolling reception. The specific parameters are shown in Table 1.
Before data acquisition, interference wave investigation and extended alignment experiments were conducted. Figure 3 shows the single-shot record of 280 traces reception of Survey Line XG4. The interference wave includes acoustic waves, surface waves, other high-frequency interference waves, and on-site environmental noise interference. The investigation of interference waves facilitates the acquisition of original data with a high signal-to-noise ratio. The seismic reflection measurement was carried out on the survey lines in Table 2 according to the parameters selected in Table 1. In data processing, attention should be paid to near-surface reflection information extraction and velocity pickup on near-offset distance recording traces [26] to preserve and recover as much as possible the effective high-frequency components in the seismic record and facilitate accurate determination of breakpoint locations. In our study, pre-stack multi-domain processing was combined with noise attenuation techniques to suppress a range of noise sources. Relatively accurate root-mean-square speed estimates were obtained by the human–computer interactive velocity analysis method. Treatment of rugged topographic areas with Kirchhoff time migration improved the quality of seismic images [27].

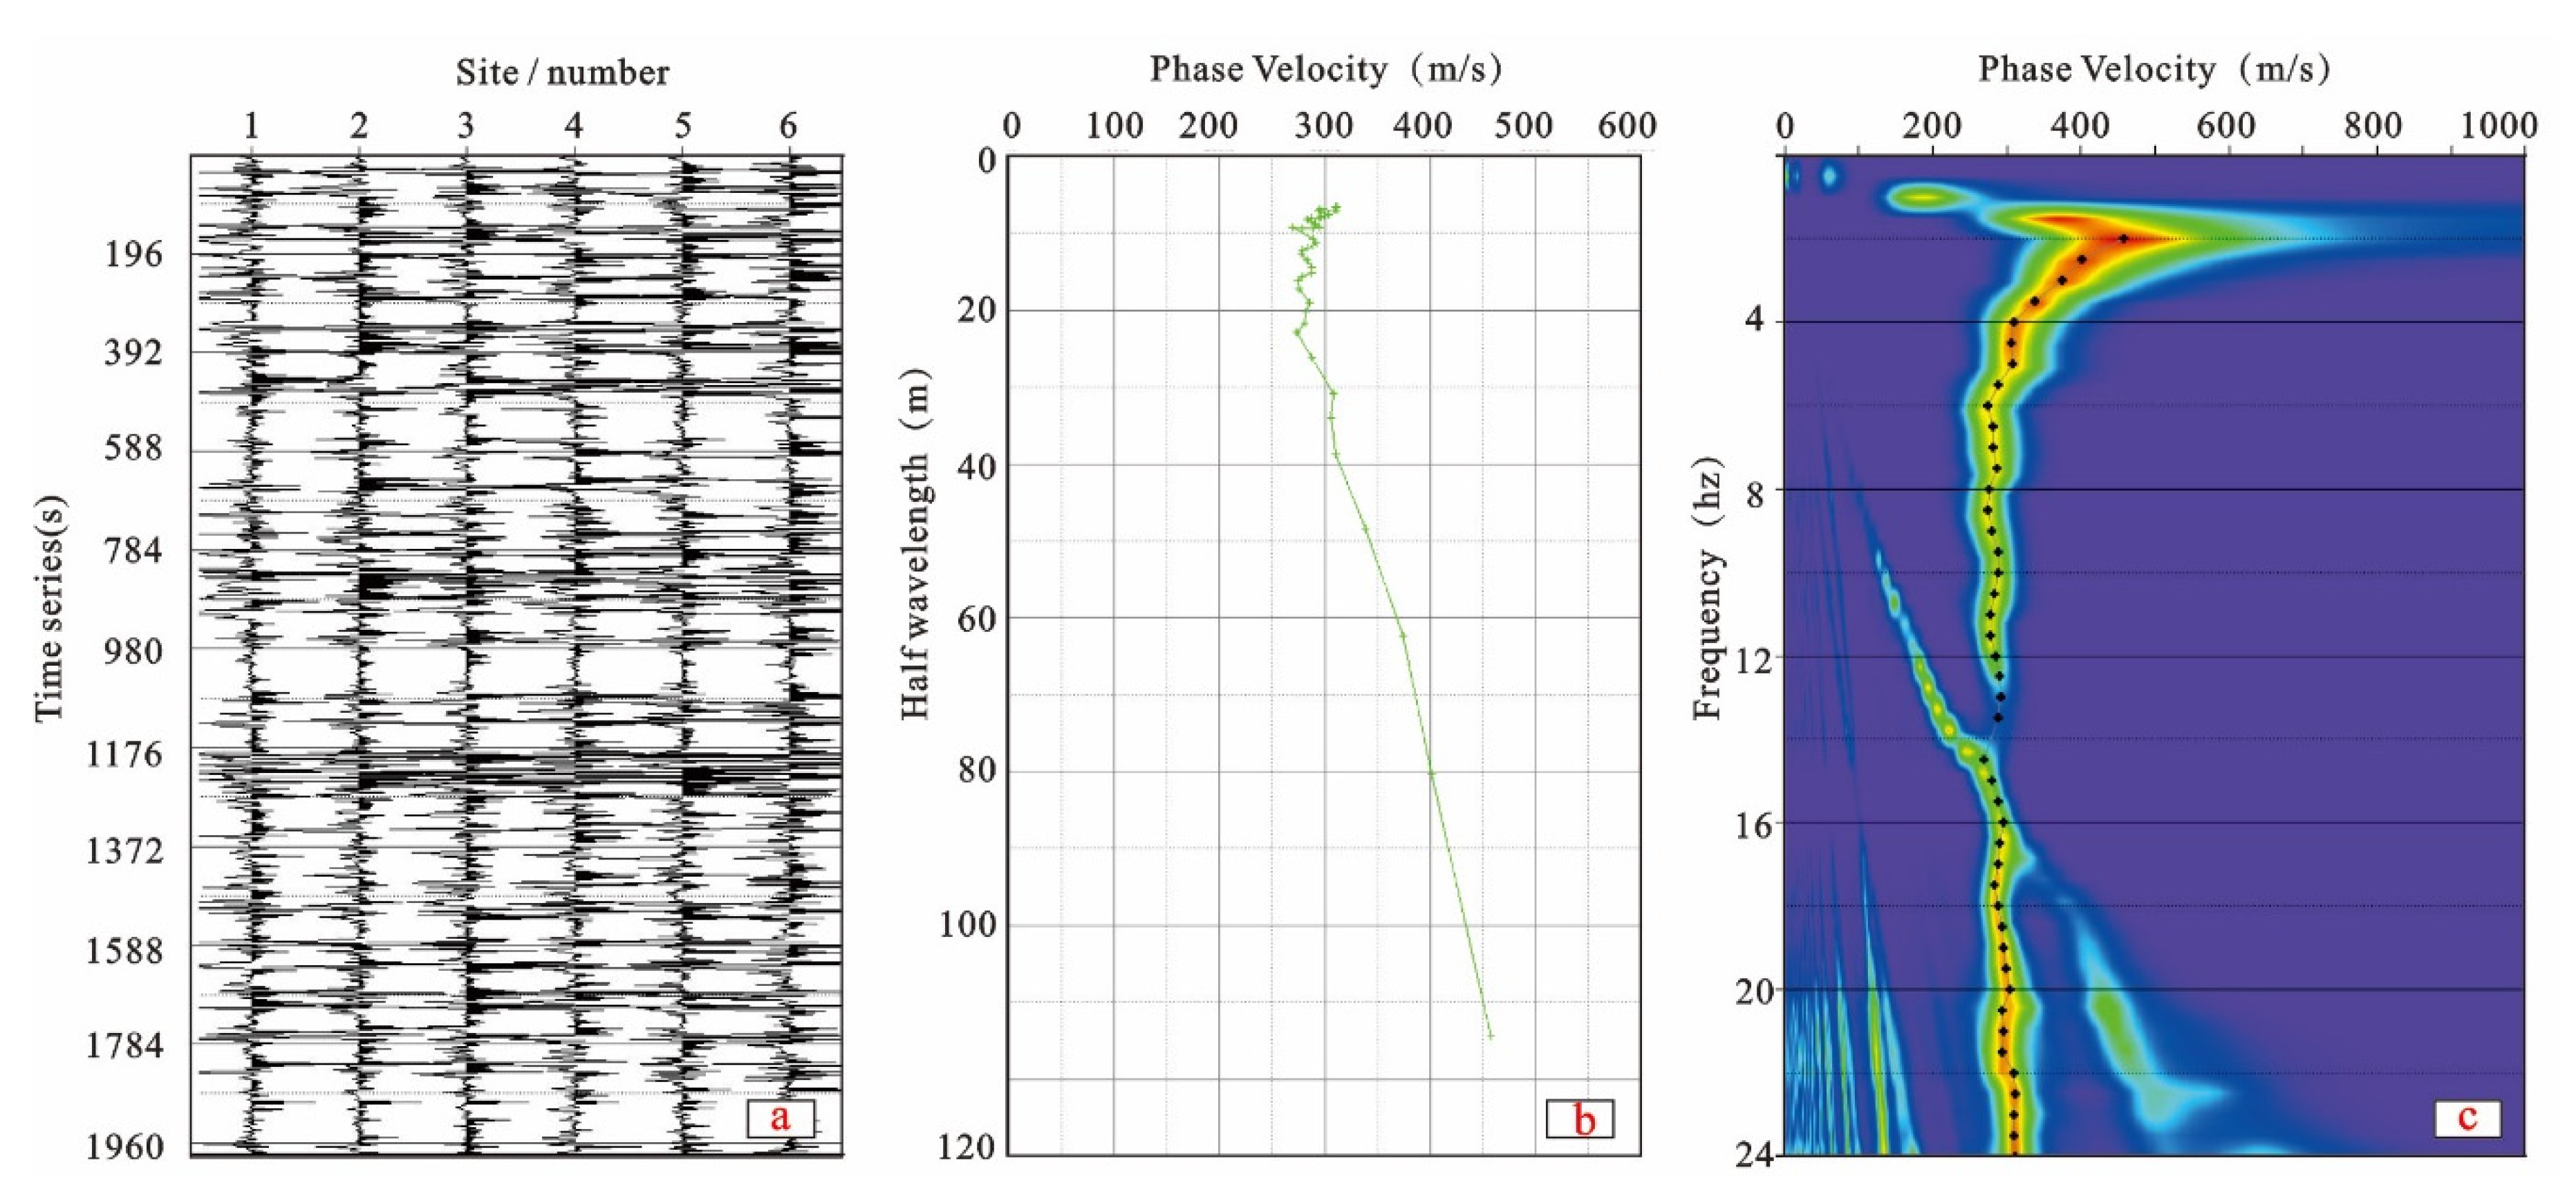
3.2. Microtremor Survey

The spatial autocorrelation (SPAC) method of the microtremor array extracts the dispersion properties of Rayleigh waves from the vertical component of microtremors observed by a number of seismometers deployed on-site. In the microtremor survey method (MSM), the dispersion curves of Rayleigh waves are obtained by the SPAC method to estimate the shear wave velocity structure of lithological layers and geological structures [28]. Its signal originates from the more energetic Rayleigh waves in a complex signal consisting of body and surface waves, both from natural phenomena such as air pressure, wind speed, waves, and tidal changes, as well as from vehicle movement, machine operation, and people’s daily production life [20]. Recent studies on disasters have yielded a series of results through multiple methods [13,29,30,31,32,33]. The target area has a complex environment and more interference sources. The bonded area (location of Survey Line ZB1-ZB6) is not suitable for seismic reflection because the huge vibration of the vibrator vehicle will damage the precision instruments and construction facilities there. Instead, a microtremor survey can detect the characteristics of the velocity structure of the underground strata to determine the stratigraphic structure in the bonded area.
According to the detection requirements and the topographic and geological conditions of the site, 100 IGU-16HR nodal instruments with a natural frequency of 5 Hz are used for the microtremor survey. Each acquisition unit is observed independently, and GPS timing is used to ensure the synchronization of the recording time of each seismic device. The selected sampling rate is 250 Hz, and the duration of simultaneous observation at each point is 45 min. The specific parameters are shown in Table 3. Figure 4 shows the time series curves (a), half wavelength-velocity curves (b) and frequency-phase velocity curves (c) that have been acquired. In order to better demonstrate the three-dimensional underground space structure of the bonded area, microtremor data are collected according to the grid survey lines. Information on survey lines is shown in Table 4.

4. Analysis of Field Measurement Results

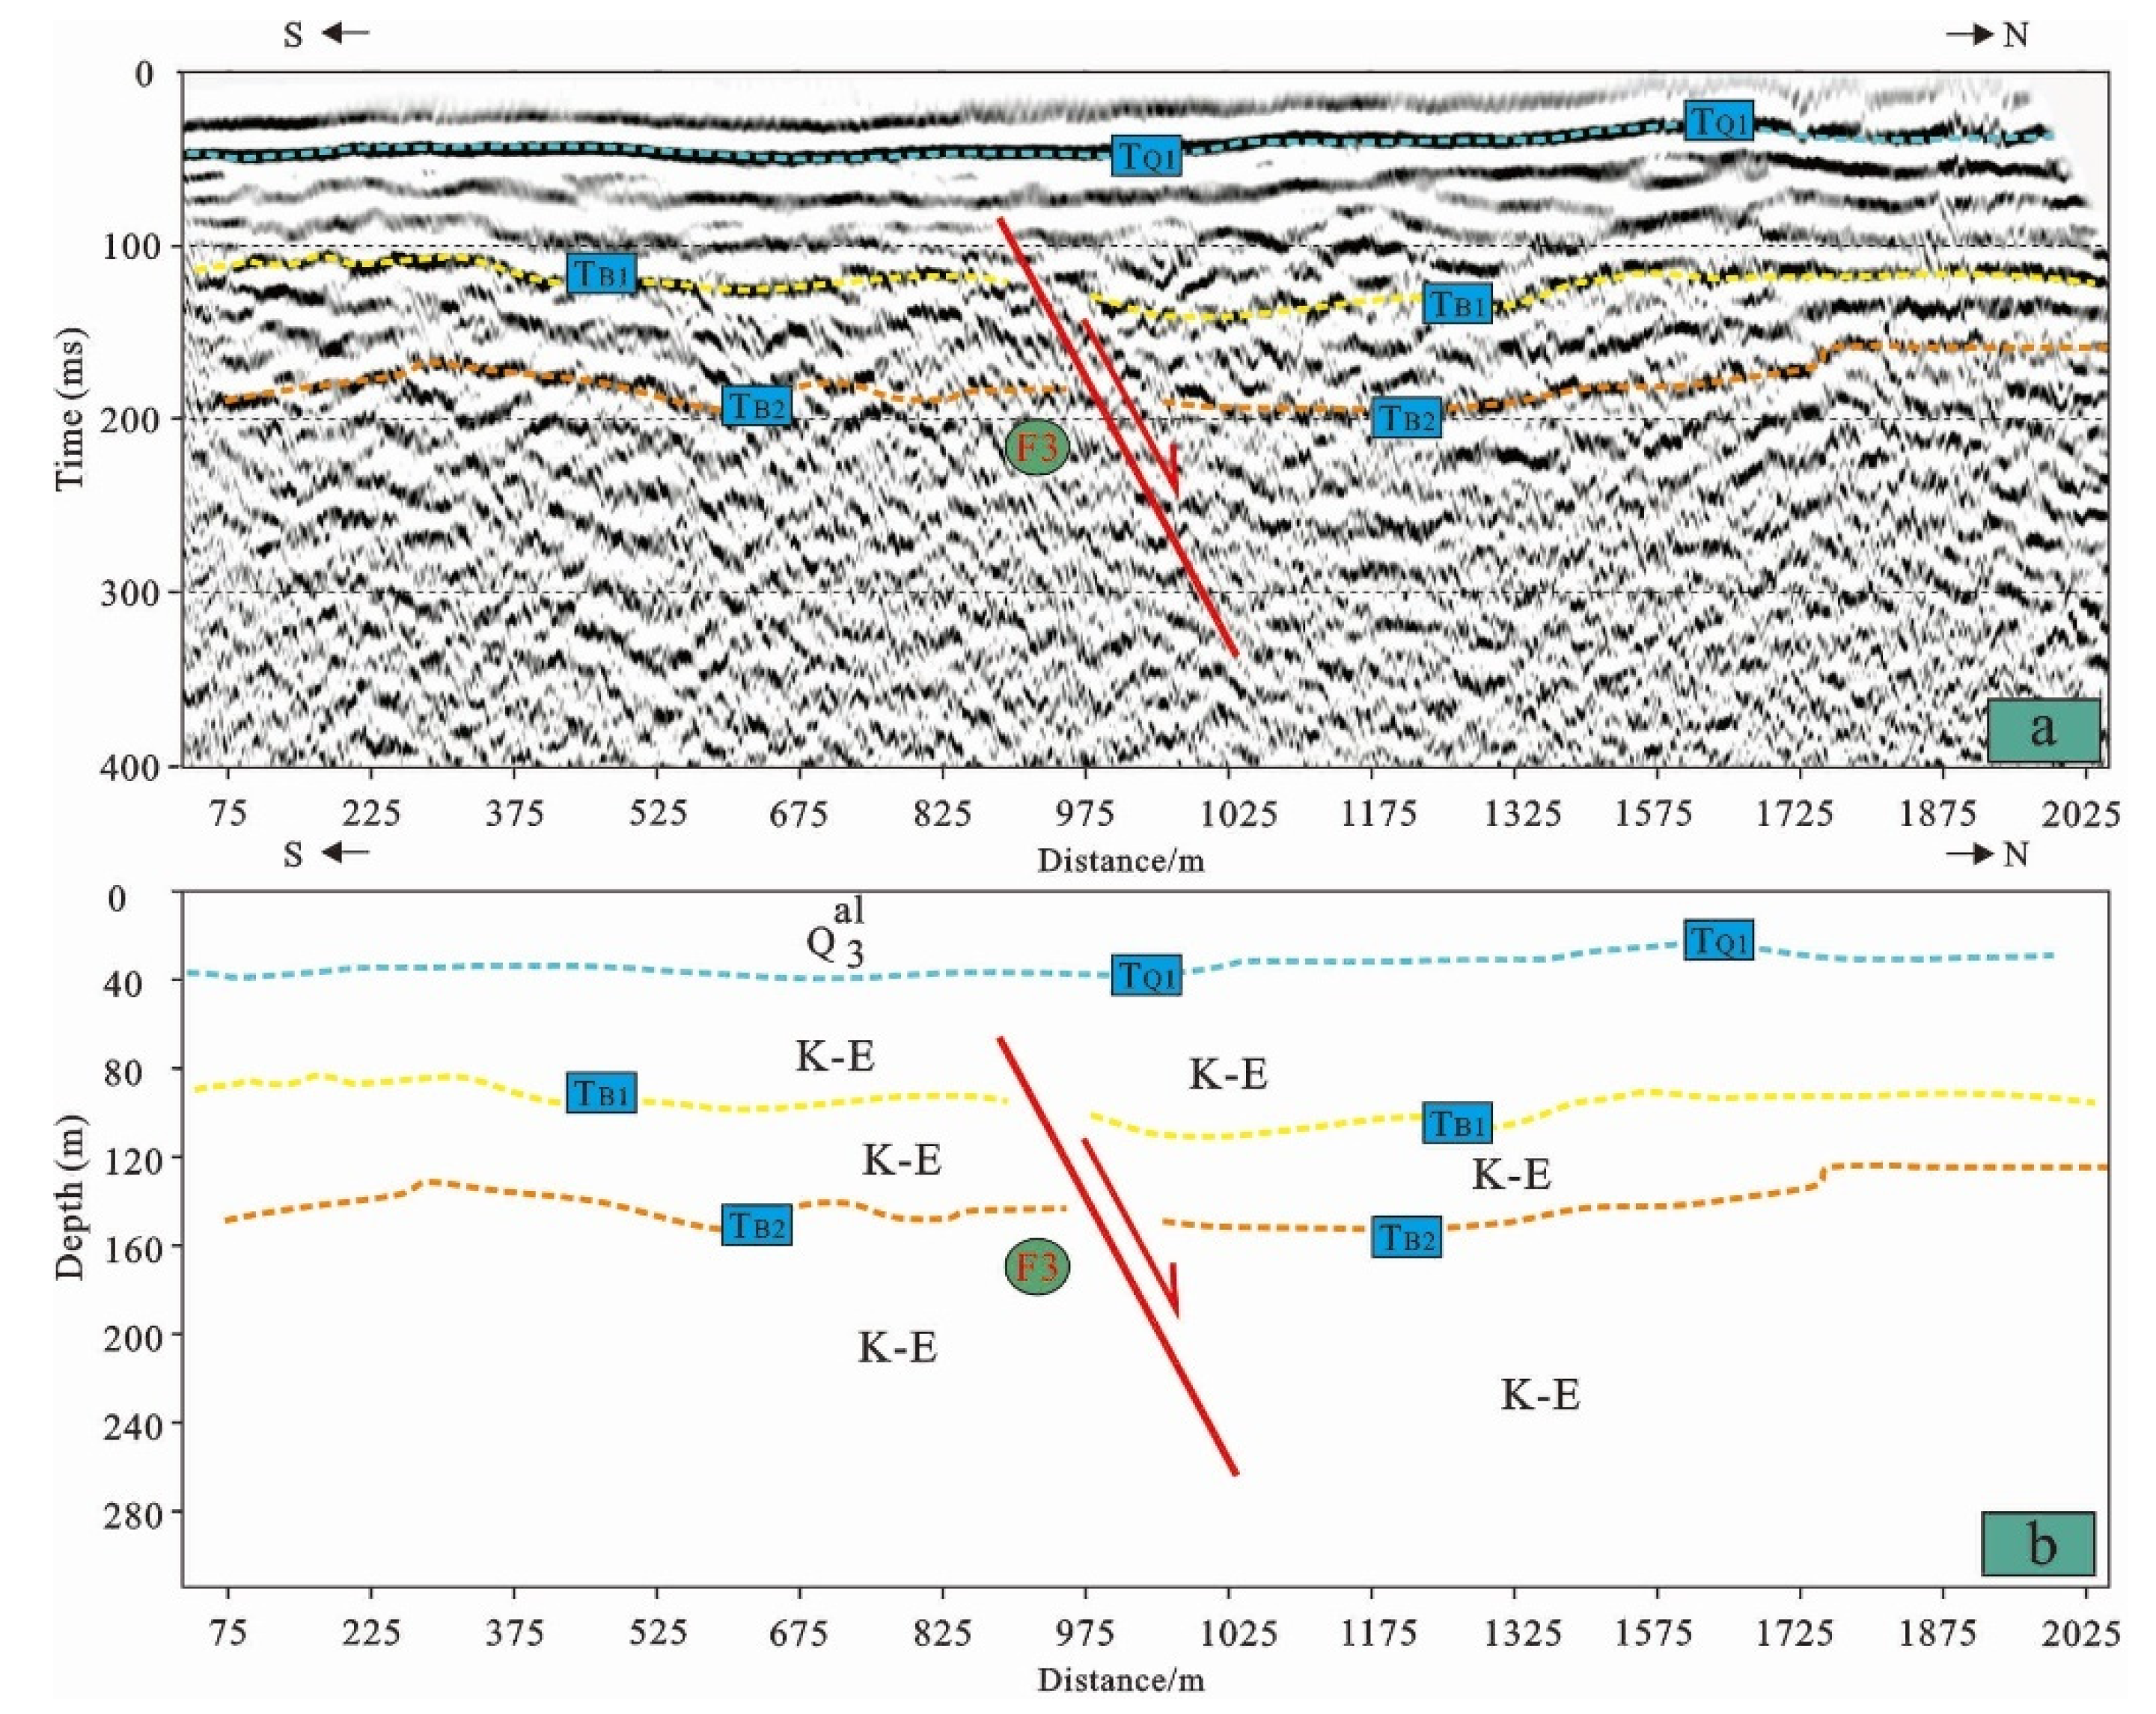
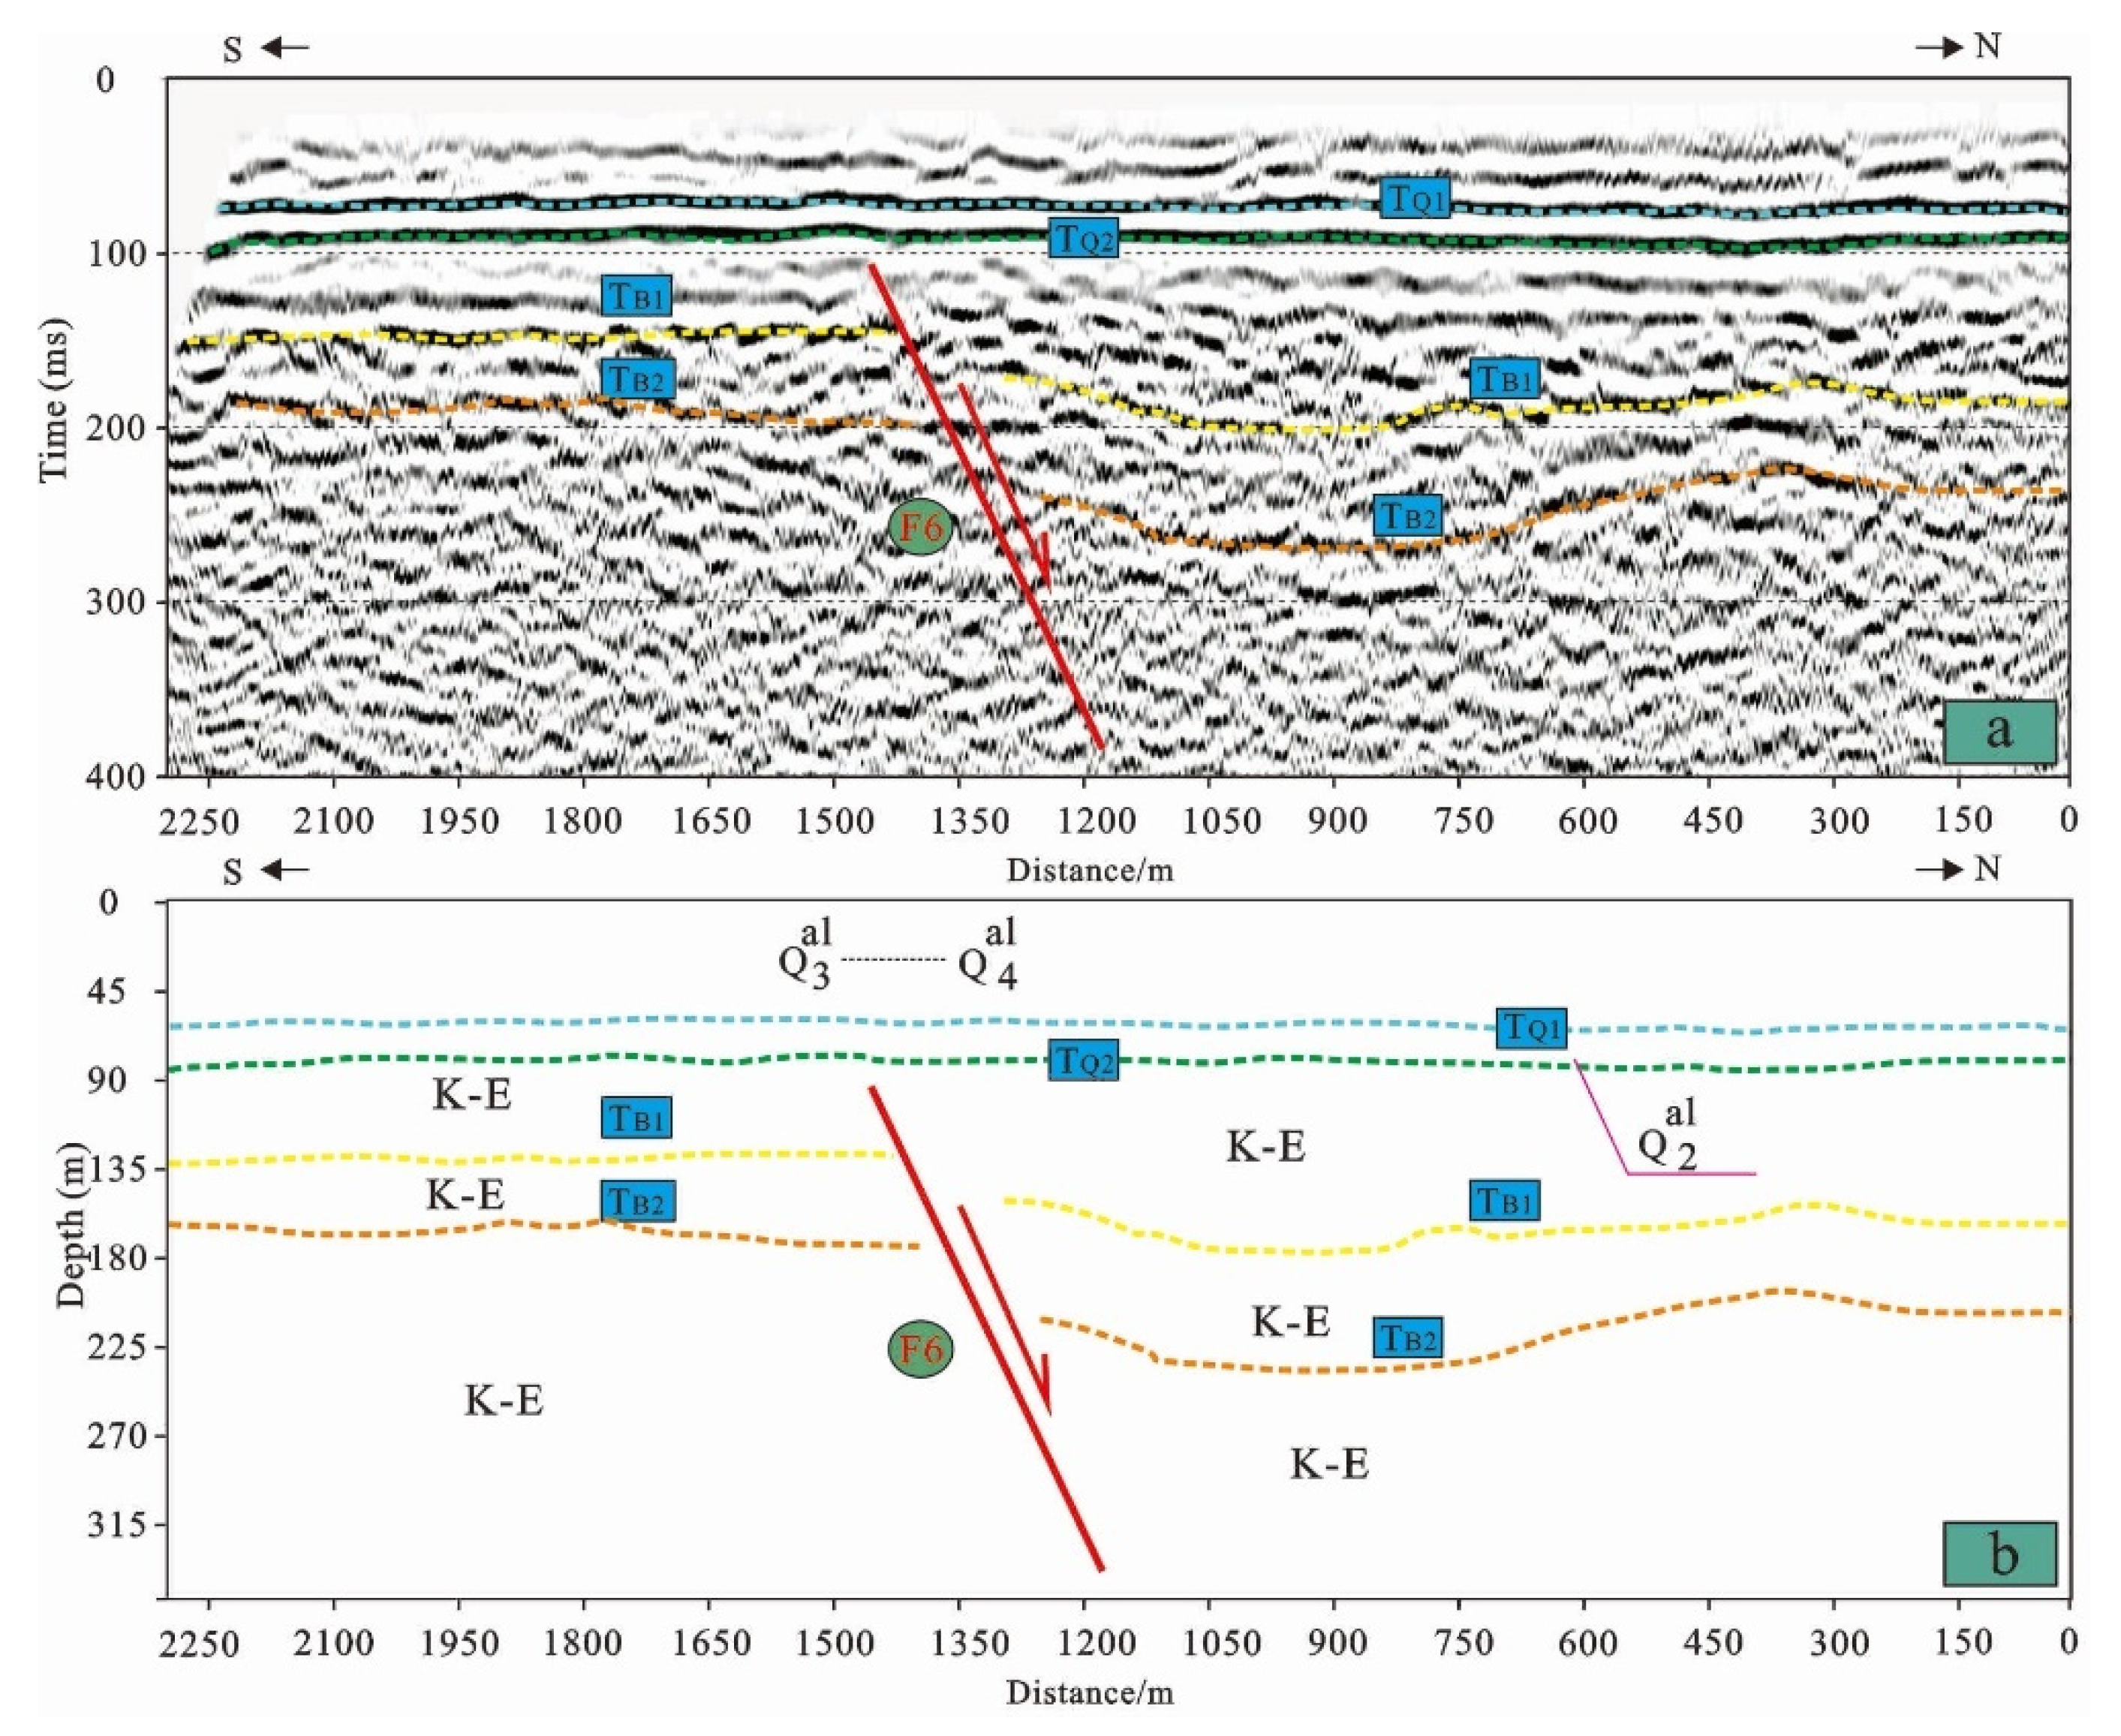
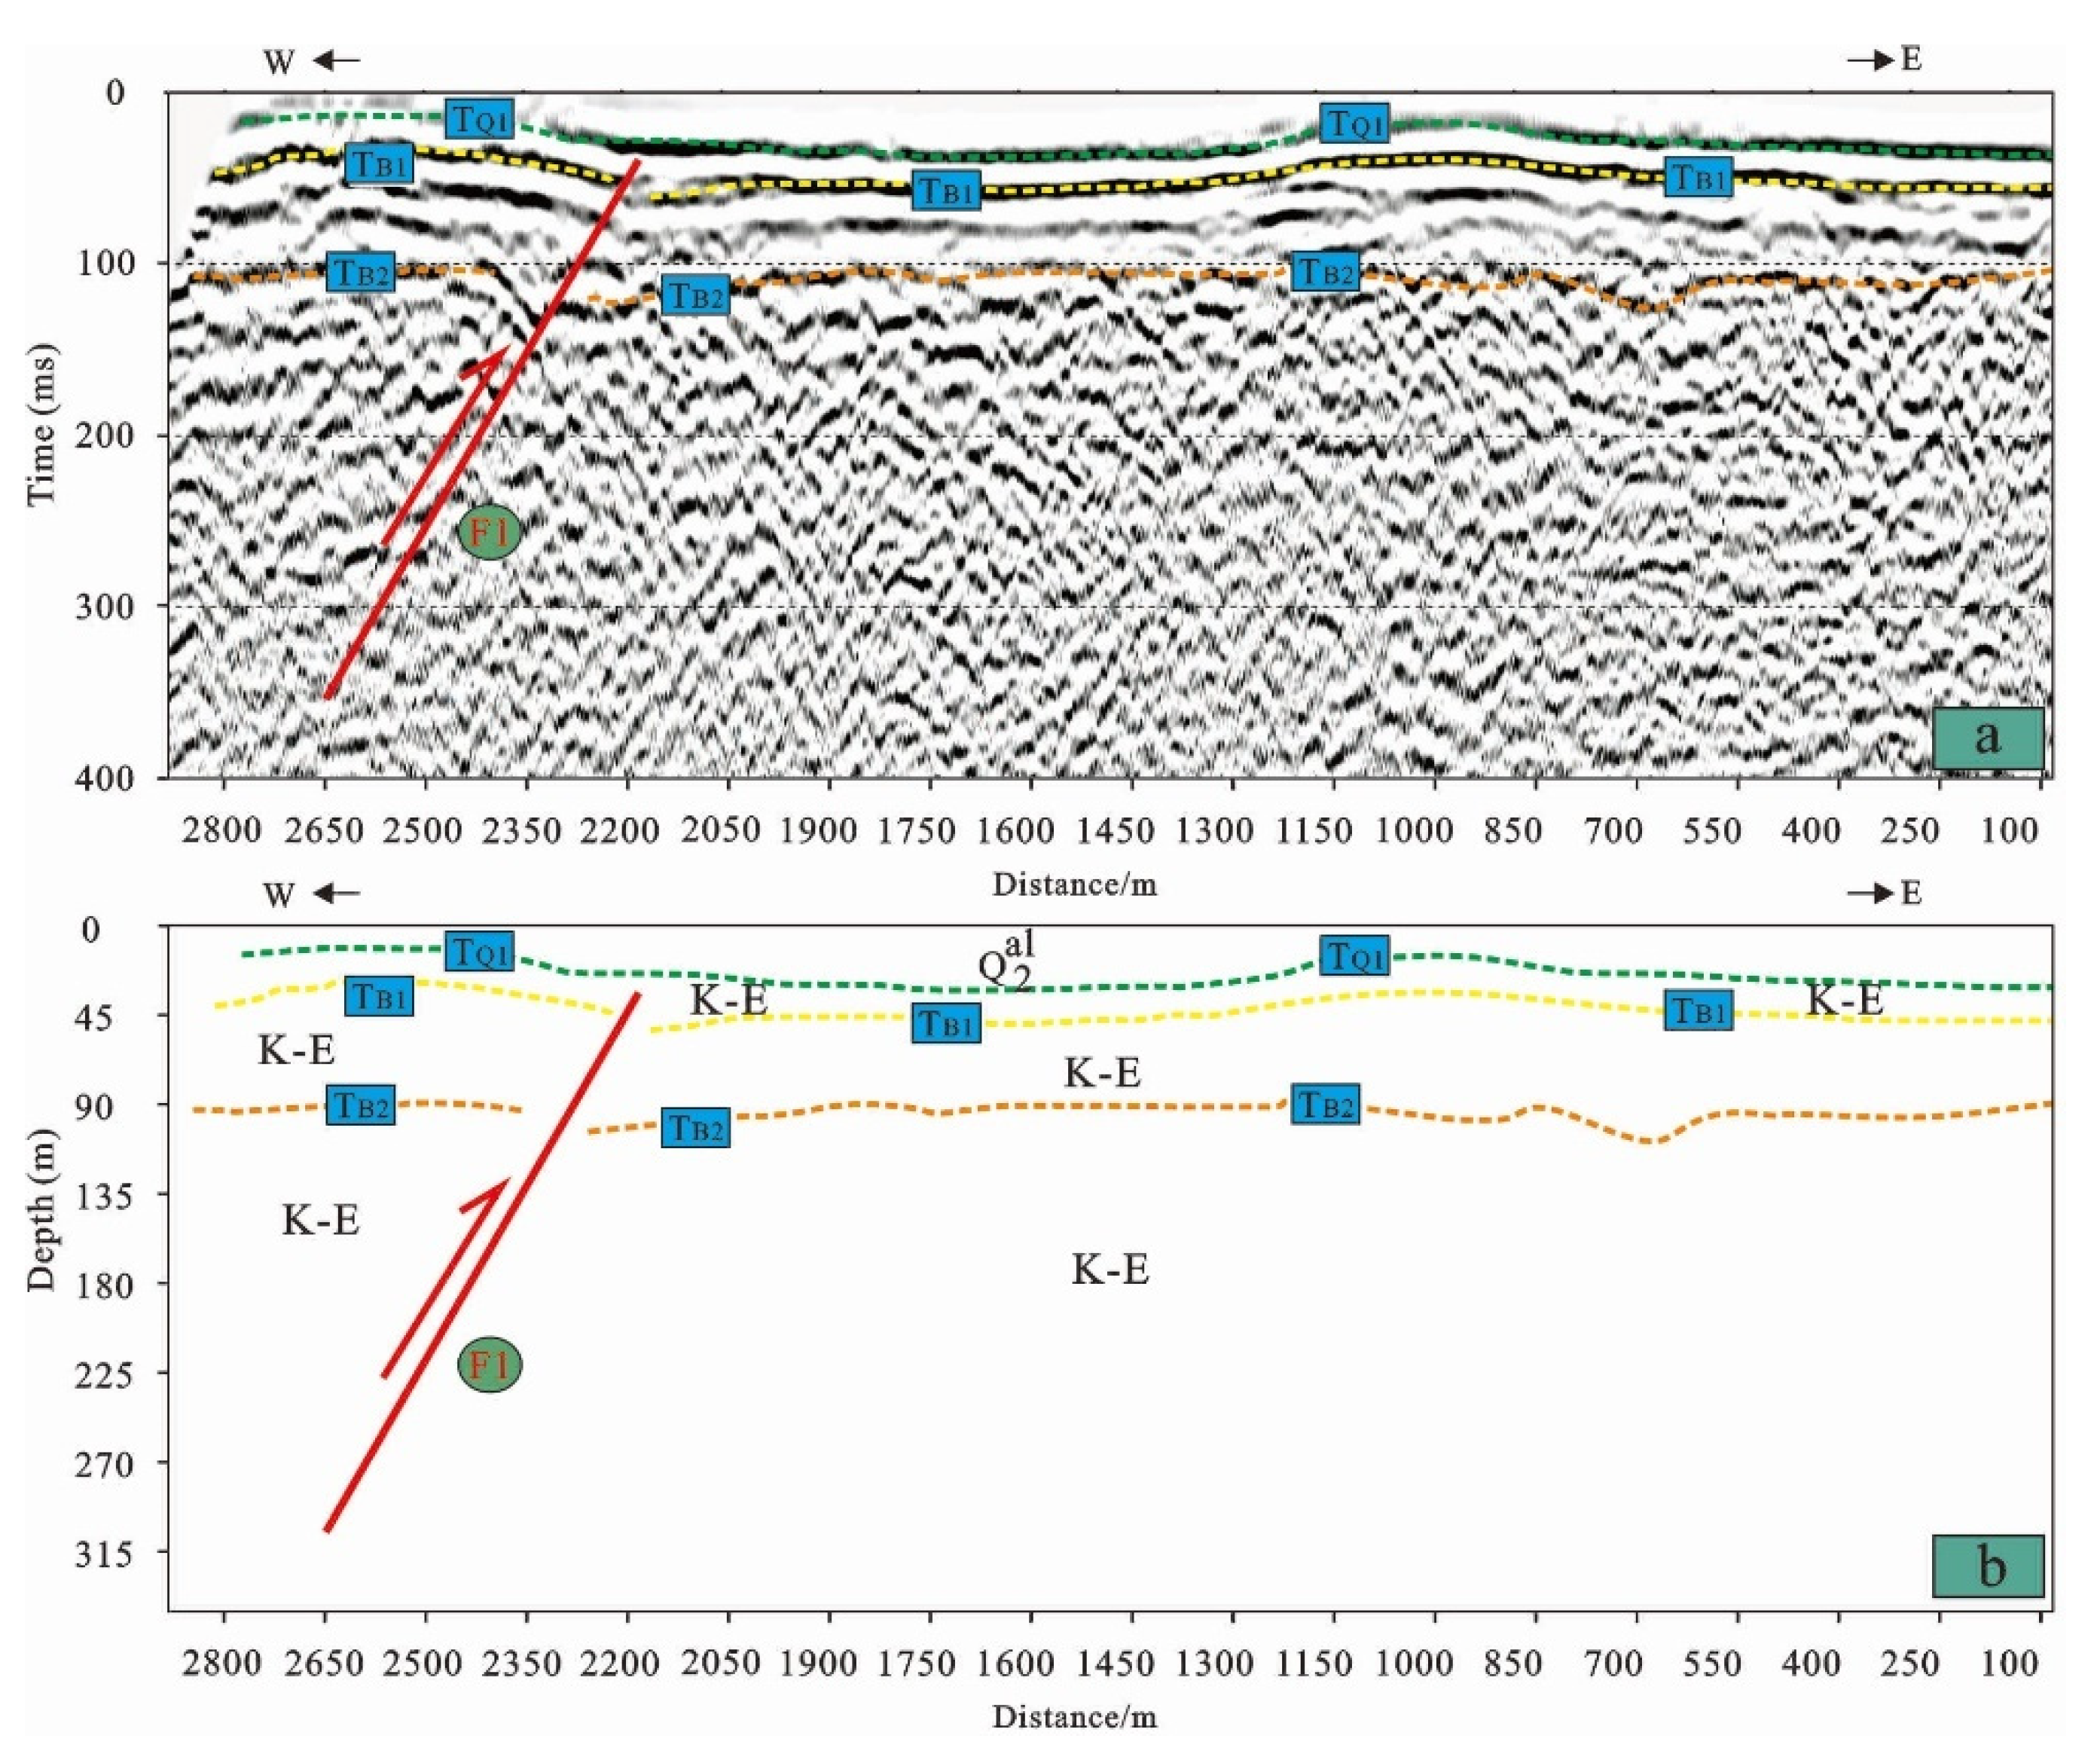
4.1. Characteristics of Buried Faults Revealed by Seismic Reflection Profiles

In the study, seismic reflection measurements were conducted on two major buried faults in the target area, namely, the Xiangfan-Guangji Fault and the Macheng-Tuanfeng Fault. Two seismic reflection profiles of the Xiangfan-Guangji Fault and one of the Macheng-Tuanfeng Fault are selected for discussion.
The seismic reflection profile of Line XG4 of the Xiangfan-Guangji Fault is shown in Figure 5. There are several sets of events in the profile. The continuity of the events varies slightly at different depths, with better continuity at the upper part and a worse one at the lower part. At a distance of about 45 ms, 110 ms, and 180 ms from the starting point of the two-way travel time, multiple reflection wave groups appear and form reflection interfaces, namely, TQ, TB1, and TB2, respectively. There appears to be a displacement of the events in the 875 m~1000 m section of the reflection wave group. Through time-depth conversion, the stratigraphic interface is divided according to the characteristics of the events and relevant data. Three groups of obvious events appear at depths of about 35 m (TQ), 90 m (TB1), and 150 m (TB2). The stratum with a depth of more than 25 m (TQ) is presumed to be the Quaternary overburden and the one with a depth of 90 m (TB1) to be moderately weathered bedrock surface since the Mesozoic Triassic-Jurassic. The events are misplaced in the 875 m~1000 m section, forming fault F3, which is a normal fault with a NE strike and SW tendency. The buried depth of the upper breakpoint is about 85 m, and the fault distance is about 8 m.
Figure 6 shows the seismic reflection profile of Line XG9 of the Xiangfan-Guangji Fault. Four reflection wave groups appear at about 80 ms, 100 ms, 150 ms, and 210 ms from the starting point of the two-way travel time and form reflection interfaces, namely, TQ1, TQ2, TB1, and TB2, respectively. There appears to be a displacement of the events in the 1400 m section of the reflection wave group. Through time-depth conversion, the stratigraphic interface is divided according to the characteristics of the events and relevant data. Four groups of obvious events appear at the depths of about 65 m (TQ1), 85 m (TQ2), 120 m (TB1), and 180 m (TB2). The stratum with a depth of more than 85 m (TQ2) is presumed to be the Quaternary overburden and the one with a depth of 120 m (TB1) to be moderately weathered bedrock surface since the Mesozoic Triassic-Jurassic. The events are misplaced in the 1400 m section, forming fault F6, which is a normal fault with a NE strike and SW tendency. The buried depth of the upper breakpoint is about 120 m, and the fault distance is about 10 m.
The seismic reflection profile of Line MT4 of the Macheng-Tuanfeng Fault is shown in Figure 7. There are multiple sets of events in the profile, and the continuity of the events at different depths is slightly different, with better continuity at the upper part and a worse one at the lower part. At about 25 ms, 50 ms (TQ), and 110 ms (TB) from the starting point of the two-way travel time, multiple reflection wave groups appear and form rather continuous events. There appears to be a displacement of the events in the 2150 m~2350 m section of the reflection wave group. Through time-depth conversion, the stratigraphic interface is divided according to the characteristics of the events and relevant data. Three groups of obvious events appear at the depths of about 25 m, 40 m (TQ), and 90 m (TB). The stratum with a depth of more than 40 m (TQ) is presumed to be the Quaternary overburden, and the one with a depth of 90 m (TB) to be moderately weathered bedrock surface since the Mesozoic Triassic-Jurassic. The events are misplaced in the 2150 m~2350 m section and misplaced in the Fourth Series strata, forming fault F1, which is a thrust fault with an NNE strike and NE tendency. The buried depth of the upper breakpoint is about 45 m, and the fault distance is about 10 m.

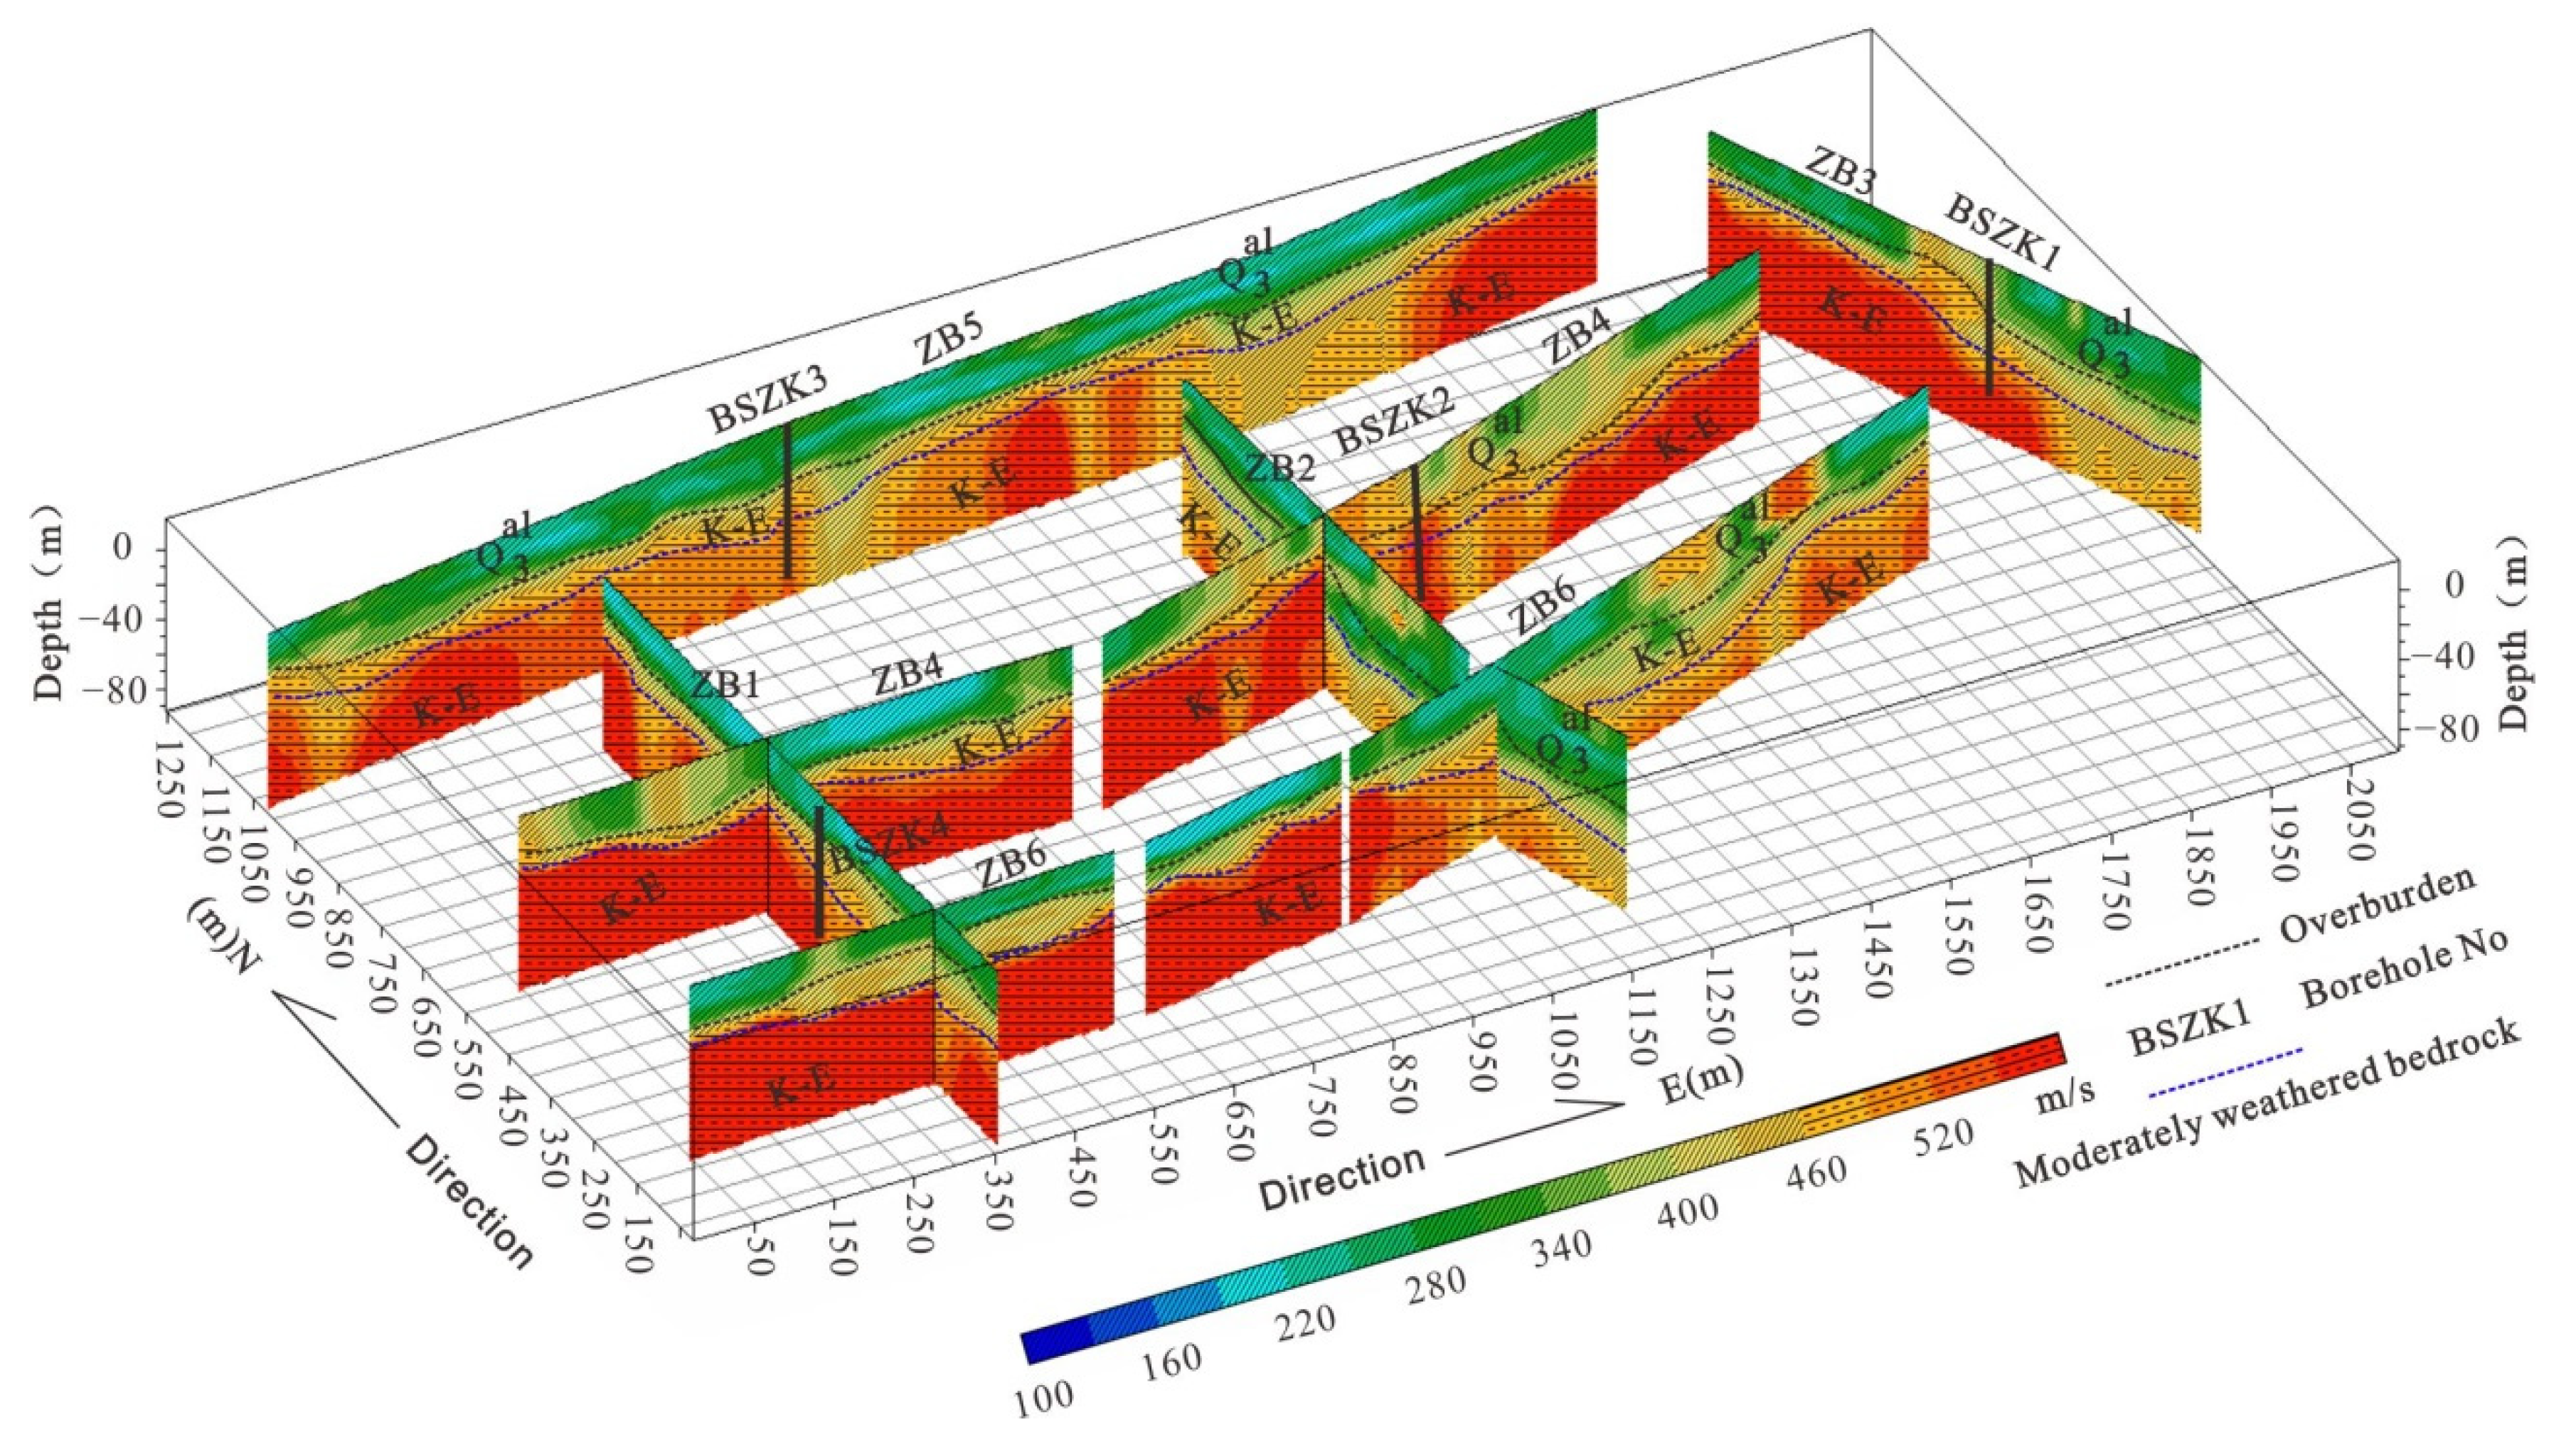
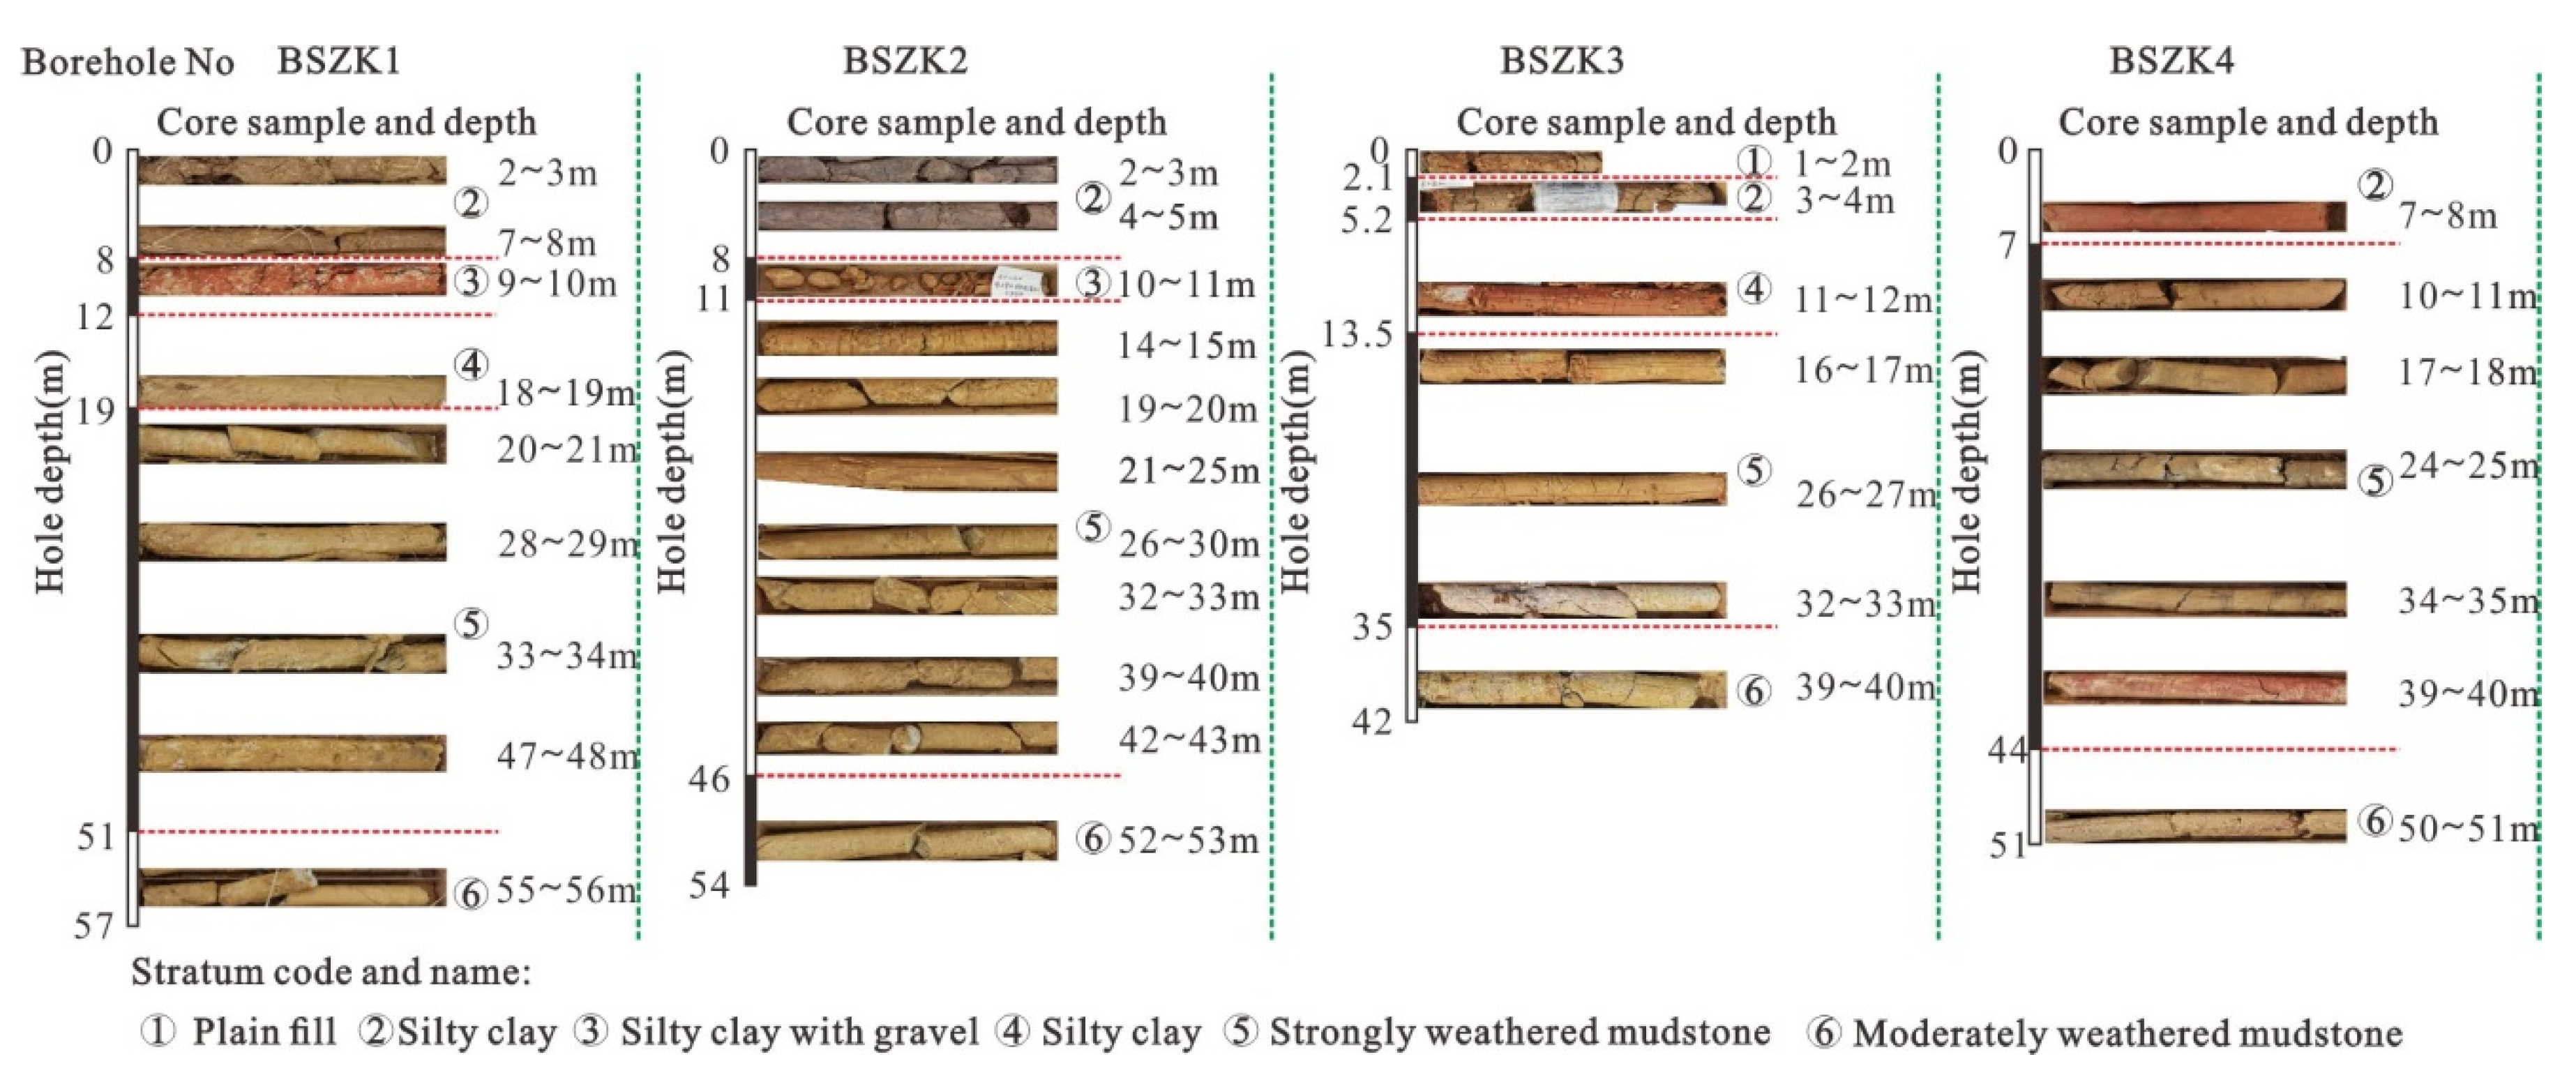
4.2. Stratigraphic Structure Characteristics Revealed by Microtremor Velocity Structure Profiles and Boreholes

Six 2D microtremor velocity structure profiles in the bonded area are obtained by microtremor survey. These gridded 2D profiles are projected with actual coordinates to obtain the 3D profiles of the microtremor survey in the bonded area shown in Figure 8. Combined with the borehole data and wave velocity test results, the layers with an apparent transverse wave velocity of less than 450 m/s are classified as overburden, in which the silty clay layer is less than 250 m/s, the strongly weathered mudstone layer is 250~450 m/s, and the lower bedrock is a moderately weathered mudstone layer. The undulating shape of the bedrock surface can be clearly distinguished in Figure 8. Bound by Survey Line ZB2, the bedrock surface as a whole is shallow in the west, with deep overburden in the east and deep in the southeast. According to the velocity structure, the depth of overburden is about 6~20 m, and the depth of the moderately weathered mudstone varies between 37 and 47 m.
The core samples and layer thickness of boreholes in the bonded area are shown in Figure 9, which reveals the stratigraphic structure as follows: ① Plain fill (Qml): yellowish brown, slightly wet, loose, dominated by silty clay, containing a small amount of domestic waste and plant roots, mainly distributed on the surface, and at a depth of about 1~2 m; ② Silty clay (Q3al): grayish brown or yellowish brown, wet, plastic or hard plastic, containing a small amount of ferromanganese oxide and kaolinite agglomerate, widely distributed, with a very significant change of layer thickness in space; ③ Silty clay with gravel (Q2pl + dl): reddish brown, wet, slightly dense, containing a small amount of ferromanganese oxide, with a gravel content of about 40%, the other of silty clay, with a gravel particle size of 5~45 mm, angular in the lower part, slightly rounded upward, rough cut, local section distribution; ④ Silty clay (Q3pl): grayish brown to yellowish brown, wet, hard plastic-hard, containing a small amount of ferromanganese oxide and kaolinite agglomerate, smooth cut surface, slightly lustrous, no shaking reaction, high dry strength and toughness, gravel in some areas, continuous distribution in the area; ⑤ Strongly weathered mudstone (K-E): gray, gray-green, mud structure, thin laminated structure, intense core weathering, tissue structure mostly destroyed, mainly weathered soil columnar, partly completely weathered soil, the bottom interface of strongly weathered mudstone exposed by four boreholes ranging from 7 to 19 m; ⑥ Weathered mudstone (K-E): gray, gray-green, mud structure, thin laminated structure, rather complete core, mainly columnar and short columnar, a few fragmented, buried depth of about 35~51 m.
The comparison between the results of the microtremor survey and geological drilling indicates that the stratigraphic structure characteristics revealed by the boreholes correspond well to the microtremor velocity structure profiles. The comparative interpretation of the microtremor velocity structure profiles based on the direct information obtained from the boreholes not only conforms to the principle of geophysical interpretation, namely, from known to unknown, but also verifies the reliability of the microtremor survey results. The obtained microtremor velocity structure profiles make up for the shortage of seismic data and better reveal the characteristics of underground space structures in key areas in the region.

5. Discussion and Conclusions

(1) Based on the geological background of the study area, a shallow seismic reflection survey was carried out at the location where there might be buried faults. High-resolution seismic reflection profiles were obtained by means of 2 m trace spacing, zero offsets, 280 trace receptions, and multiple coverage observations. The profiles reveal the stratigraphic structure and the geometric characteristics of the buried faults. The Survey Lines XG4 and XG9 reveal the following two buried faults of Xiangfan-Guangji: ① F3 is a normal fault with an NE strike and SW tendency. The buried depth of the upper breakpoint is about 85 m, and the fault distance is about 8 m. ② F6 is a normal fault with a NE strike and SW tendency. The buried depth of the upper breakpoint is about 120 m, and the fault distance is about 10 m. Survey Line MT4 reveals the following buried fault of Macheng-Tuanfeng: F1 is a thrust fault with an NNE strike and NE tendency. The buried depth of the upper breakpoint is about 45 m, and the fault distance is about 10 m. In addition, through time-depth conversion of the velocity spectrum, the stratigraphic structure characteristics such as overburden and bedrock interface were primarily obtained.
(2) A microtremor survey was carried out by making full use of the background noise in key areas where the vibrator vehicle cannot get in or the vibration has an impact on building facilities, and borehole verification was conducted. Six velocity structure profiles obtained were projected with the actual coordinates to form 3D underground velocity structure profiles of the detection area. Through comparative interpretation and mutual confirmation of velocity structure profiles and borehole data, the underground stratigraphic structure characteristics such as the thickness of the fourth clay layer, the distribution of strongly weathered mudstone, and the buried depth of the moderately weathered bedrock surface were revealed with precision.
(3) The combination of seismic reflection and microtremor survey is of great scientific significance in regional seismic safety evaluation. In the process of seismic data processing, attention is paid to the near-surface reflection information extraction and velocity pickup on the near-offset recording trace, which protects and restores the effective high-frequency components in seismic records and provides theoretical support for the accurate determination of the upper breakpoint location. In the microtremor survey, the small linear spacing array was adopted, and the two-dimensional profiles were projected into the underground space with the actual coordinates to form three-dimensional ones, which has a better perspective of the velocity characteristics of the stratigraphic structure in the measured area. In addition, the combination of seismic reflection and microtremor survey provides a new idea for regional seismic safety evaluation, which has good scientific significance.
(4) The geophysical profiles obtained by seismic reflection and microtremor survey have effectively identified the specific location, geometric characteristics, stratigraphic structure characteristics, and velocity structure distribution of the buried faults in the study area, which provides important geological information for seismic safety evaluation and seismic fortification, and a reference for similar geological investigations such as active fault detection in the study area in the future.
(5) Although the methods proposed in this paper have very important popularization significance and scientific value, urban sustainable development and major engineering construction can not rely solely on comprehensive geophysical measurement. Due to the multiplicity of geophysics, the results need to be used together with other detection means.

Author Contributions

Conceptualization, W.W. and S.L.; methodology, S.L.; software, C.J.; validation, C.J., D.L. and Y.C.; formal analysis, W.W.; investigation, W.W.; resources, S.L.; data curation, C.J.; writing—original draft preparation, W.W.; writing—review and editing, Y.C.; visualization, S.L.; supervision, S.L.; project administration, S.L.; funding acquisition, S.L. All authors have read and agreed to the published version of the manuscript.

Funding

Supported by Scientific Research Fund from Institute of Seismology, CEA and National Institute of Natural Hazards, Ministry of Emergency Management of China (Grant No. IS201926301).

Institutional Review Board Statement

Not applicable.

Informed Consent Statement

Not applicable.

Data Availability Statement

Not applicable.

Conflicts of Interest

The authors declare no conflict of interest.

References

  1. Wei, Y. Earthquake Safety Estimation Study for the Urban Rail Transportation Engineering Field; Central South University: Changsha, China, 2009. [Google Scholar]
  2. Ding, Z.J. Urban Seismic Microzonation and Engineering Seismic Exploration; Seismological Press: Beijing, China, 1991. [Google Scholar]
  3. You, J.M. The Application of Geophysical Methods in Nuclear Power Plant Seismic Safety Evaluation; Chengdu University of Technology: Chengdu, China, 2014. [Google Scholar]
  4. Luo, Y.X.; Wang, X.C.; Li, D.X. Importance of Seismic Safety Evaluation in City Construction. J. Coll. Disaster Prev. Tech. 2005, 7, 2. [Google Scholar]
  5. Lin, S.; Cai, Y.J.; Lei, D.N.; Wang, Q.L.; Yang, G. Seismic Reflection Profile Reveal Overburden Thickness and Buried Faults of Seismic Zoning—Take the Planning Area of JiuJiang Fanglan as an Example. J. Geod. Geodyn. 2018, 38, 881–890. [Google Scholar]
  6. Cai, L.L.; Yang, Q.Y.; Guo, Q.N.; Wen, C.; Li, H.; Liu, G.J.; Peng, Y.Q. Synthesis Geophysical Method in Earthquake Safety Evaluation. N. China Earthq. Sci. 2016, 34, 21–29. [Google Scholar]
  7. Deng, Q.D.; Lu, Z.X.; Yang, Z.E. Evaluation of Active Fault Detection and Fault Activity in city. Seismol. Geol. 2007, 29, 189. [Google Scholar]
  8. Lin, S.; Li, Y.; Luo, D.G.; Fu, Y.L. Research on the fracture structure and activity of the Qinling Mountains thrust nappe system in western Hubei. Can. J. Earth Sci. 2020, 57, 1–15. [Google Scholar] [CrossRef]
  9. Lin, S.; Tang, Q.J.; Li, Y.; Luo, D.G.; Liao, W.L.; Wang, Q.L. Analysis and Characteristics of Faults Around Danjiang Reservoir, Western Hubei Provience. Earth Sci. 2017, 42, 1830–1841. [Google Scholar]
  10. Lin, S.; Wang, W.; Li, Y.; Zhou, X.; Liao, W.L. Shallow Seismic Profiles Reveal the Buried Fault Feature of Southern Qinling:A Case of Danjiang Fracture. J. Geod. Geodyn. 2019, 39, 221–225. [Google Scholar]
  11. Liu, B.J.; Zhang, X.K.; Feng, S.Y.; Zhao, C.B.; Ji, J.F.; Shi, J.H.; Yuan, H.K. High-Resolution Seismic Reflection Profile Across Pengzhou Buried Fault in the Frontal Areas of Longmen Shan. Geophysics 2009, 52, 538–546. [Google Scholar]
  12. Buday-Bódi, E.; Irfan, A.; McIntosh, R.W.; Fehér, Z.Z.; Csajbók, J.; Juhász, C.; Radócz, L.; Szilágyi, A.; Buday, T.J.S. Subregion-Scale Geothermal Delineation Based on Image Analysis Using Reflection Seismology and Well Data with an Outlook for Land Use. Sustainability 2022, 14, 3529. [Google Scholar] [CrossRef]
  13. Bathrellos, G.D.; Gaki-Papanastassiou, K.; Skilodimou, H.D.; Papanastassiou, D.; Chousianitis, K.G. Potential suitability for urban planning and industry development using natural hazard maps and geological–geomorphological parameters. Environ. Earth Sci. 2012, 66, 537–548. [Google Scholar] [CrossRef]
  14. Su, M.; Cheng, K.; Li, H.; Xue, Y.; Wang, P.; Ma, X.; Li, C. Comprehensive investigation of water-conducting channels in near-sea limestone mines using microtremor survey, electrical resistivity tomography, and tracer tests: A case study in Beihai City, China. Bull. Eng. Geol. Environ. 2022, 81, 1–14. [Google Scholar] [CrossRef]
  15. Thein, P.; Kyaw, K.; Kiyono, J.; Pramumijoyo, S.; Nu, T.; Khaing, K.; Than, W.; Win, T.; Thant, M. Estimation of the subsurface sedimentary structure of Amarapura township (Mandalay Region) based on microtremor survey. In Proceedings of the IOP Conference Series: Earth and Environmental Science, Yogyakarta, Indonesia, 16–18 March 2021; p. 012019. [Google Scholar]
  16. Tian, R.; Wang, L.; Zhou, X.; Xu, H.; Lin, J.; Zhang, L.J.S. An integrated energy-efficient wireless sensor node for the microtremor survey method. Sensors 2019, 19, 544. [Google Scholar] [CrossRef] [PubMed] [Green Version]
  17. Tian, B.; Ding, Z.; Yang, L.; Fan, Y.; Zhang, B. Microtremor survey method: A new approach for geothermal exploration. Front. Earth Sci. 2022, 10, 4. [Google Scholar] [CrossRef]
  18. Xu, P.F.; Li, S.H.; Du, J.G.; Ling, S.Q.; Guo, H.L.; Tian, B.Q. Microtremor survey method: A new geophysical method for dividing strata and detecting the buried fault structures. Acta Petrol. Sin. 2013, 29, 1841–1845. [Google Scholar]
  19. Zhang, W.; Gan, F.P.; Liang, D.H.; Han, K.; Liu, W. Revelation of Fushougou Ditch’s Conception for the Construction of Modern Sponge City. Yangtze River 2016, 47, 51–54. [Google Scholar]
  20. Jin, C.; Lin, S.; Cheng, M.; Zha, Y.H. Application and Discussion of Microtremor Survey for Frozen Soil Roadbed. J. Geod. Geodyn. 2021, 41, 212–216. [Google Scholar]
  21. Lin, S.; Cai, Y.J.; Lei, D.N.; Qiao, Y.Q. Seismic Safety Evaluation Report of East Lake High Tech Zone; Wuhan Institute of Earthquake Engineering Co., Ltd.: Wuhan, China, 2021; Volume 3, p. 18. [Google Scholar]
  22. Lin, S.; Wang, W.; Deng, X.H.; Zha, Y.H.; Zhou, H.W.; Cheng, M. Geophysical Observation of Typical Landslides in Three Gorges Reservoir Area and Its Significance: A Case Study of Sifangbei Landslide in Wanzhou District. Earth Sci. 2019, 44, 3135–3146. [Google Scholar]
  23. Lei, D.N.; Cai, Y.J.; Yu, S. Discussion on Characteristics Activity of Xiangfan-Guangji Fault Since the Quaternary, Hubei. Geol. Sci. Technol. Inf. 2011, 30, 38–43. [Google Scholar]
  24. Lei, D.N.; Cai, Y.J.; Zhen, S.M.; Li, H. A Preliminary Study on the Quaternary Activities and the New Tectonic Deformation Modes of Shangcheng-Macheng-Tuanfeng Fault in Northeast Hubei. J. Geod. Geodyn. 2012, 32, 21–25. [Google Scholar]
  25. Xu, M.C.; Gao, J.H.; Liu, J.X.; Rong, L.X. Eismological Methods and Techniques Applied to Active Fault Investigation in Cities. Seismol. China 2005, 21, 17–23. [Google Scholar]
  26. Brouwer, J.H. Improved NMO correction with a specific application to shallow-seismic data. Geophys. Prospect. 2002, 50, 225–237. [Google Scholar] [CrossRef]
  27. Dong, X.Y.; Li, W.H.; Lu, Z.W.; Huang, X.F.; Gao, R. Seismic reflection imaging of crustal deformation within the eastern Yarlung-Zangbo suture zone. Tectonophysics 2020, 780, 228395. [Google Scholar] [CrossRef]
  28. Gao, W.W.; Gao, W.; Hu, R.L.; Xu, P.F.; Xia, J.G. Microtremor survey and stability analysis of a soil-rock mixture landslide: A case study in Baidian town, China. Landslides 2018, 15, 1951–1961. [Google Scholar] [CrossRef]
  29. Futalan, K.M.; Biscaro, J.R.D.; Saturay, R.M.; Catane, S.G.; Amora, M.S.; Villaflor, E.L. Assessment of potential slope failure sites at Mt. Can-abag, Guinsaugon, Philippines, based on stratigraphy and rock strength. Bull. Eng. Geol. Environ. 2010, 69, 517–521. [Google Scholar] [CrossRef]
  30. Loew, S.; Gischig, V.; Willenberg, H.; Alpiger, A.; Moore, J.R. Randa: Kinematics and driving mechanisms of a large complex rockslide. Landslides Types Mech. Modeling 2012, 297, 24. [Google Scholar]
  31. Zhang, S.; Tang, H.; Zhan, H.; Lei, G.; Cheng, H. Investigation of scale effect of numerical unconfined compression strengths of virtual colluvial–deluvial soil–rock mixture. Int. J. Rock Mech. Min. Sci. 2015, 77, 208–219. [Google Scholar] [CrossRef]
  32. Zhang, Y.S.; Guo, C.B.; Lan, H.X.; Zhou, N.J.; Yao, X. Reactivation mechanism of ancient giant landslides in the tectonically active zone: A case study in Southwest China. Environ. Earth Sci. 2015, 74, 1719–1729. [Google Scholar] [CrossRef]
  33. Tian, B.Q.; Xu, P.F.; Ling, S.Q.; Du, J.G.; Xu, X.Q.; Pang, Z.H. Application effectiveness of the microtremor survey method in the exploration of geothermal resources. J. Geophys. Eng. 2017, 14, 1283–1289. [Google Scholar] [CrossRef] [Green Version]
Figure 1. Regional geotectonic unit zonation. I North China Quasi-platform: I1 Jianghuai Terrace Depression; II Qinling fold system: II1 North Huaiyang fault fold; II2 Tungbai-Dabie fault uplift; II3 Nanxiang fault sag; III Yangzi quasi platform: III1 Upper Yangtze platform fold belt; III2 Jianghan-Dongting Rifted; III3 Lower Yangtze platform fold belt; III4 Jiangnan Tailong.
Sustainability 14 06307 g001
Figure 2. Distribution of main faults and location of geophysical measuring lines in the region. ① Xiangfan-Guangji Fault; ② Jinkou-Chenjiaji Fault; ③ Wulongquan Fault; ④, Qingshankou-Huangpi Fault; ⑤ Macheng-Tuanfeng Fault; ⑥ Daye Lake Fault.
Sustainability 14 06307 g002
Figure 3. Interference wave investigation and single shot record of Survey Line Xg4. ① Direct wave; ② Shallow refraction wave; ③ Reflection wave; ④ Vibration interference wave; ⑤ Surface wave.
Sustainability 14 06307 g003
Figure 4. Time series interception and dispersion curve extraction of microtremor survey. (a) Cross-correlation time series curve. (b) Half wavelength and phase velocity curve. (c) Dispersion curve.
Sustainability 14 06307 g004
Figure 5. Seismic reflection time (a) and depth (b) profile of Survey Line XG4.
Sustainability 14 06307 g005
Figure 6. Seismic reflection time (a) and depth (b) profile of Survey Line XG9.
Sustainability 14 06307 g006
Figure 7. Seismic reflection time (a) and depth (b) profile of Survey Line MT4.
Sustainability 14 06307 g007
Figure 8. Three-dimensional section of microtremor survey.
Sustainability 14 06307 g008
Figure 9. Core samples and layer thickness of boreholes.
Sustainability 14 06307 g009
Table 1. Parameters of seismic reflection acquisition.
Group IntervalOffset DistanceCoverage NumberReceiver Trace NumberSampling RateRecording TimeDetector Frequency
2 m0 m35 times280 tracks0.5 ms650 ms60 Hz
Table 2. Information of seismic reflection lines.
Survey Line NameCoordinates of Starting Point of Survey LinesCoordinates of End Point of Survey LinesSurvey Line Length (m)
Latitude (°)Longitude (°)Latitude (°)Longitude (°)
Survey line XG430.52863697114.6076364730.54714475114.610944022145
Survey line XG930.44664009114.8213809830.42700462114.831100792421
Survey line MT430.48921904114.7835094030.48933117114.752341162974
Table 3. Parameters of microtremor survey acquisition.
Array SpacingSpread LengthType of ArrayObservation WaySampling RateObservation TimeFrequency
10 m70 mLinearRolling observation4 ms45 min5 Hz
Table 4. Information of microtremor survey lines.
Survey Line NameCoordinates of Starting Point of Survey LinesCoordinates of End Point of Survey LinesSurvey Line Length (m)
Latitude (°)Longitude (°)Latitude (°)Longitude (°)
ZB130.44757559114.4978178130.43863681114.49775205990
ZB230.44778654114.5056838530.43950138114.50651028925
ZB330.44975387114.5129432330.44273353114.51601027830
ZB430.44347793114.4945200130.44699354114.513698541920
ZB530.43993319114.4945461730.44415822114.514185931995
ZB630.44766732114.4936964530.44978537114.512811132130
Publisher’s Note: MDPI stays neutral with regard to jurisdictional claims in published maps and institutional affiliations.

