
Which Is the Best Supply Chain Policy: Carbon Tax, or a Low-Carbon Subsidy?


School of Economics and Management, Qingdao University of Science and Technology, Qingdao 266061, China
*
Author to whom correspondence should be addressed.
Sustainability 2022, 14(10), 6312; https://0-doi-org.brum.beds.ac.uk/10.3390/su14106312
Submission received: 13 April 2022
/
Revised: 12 May 2022
/
Accepted: 19 May 2022
/
Published: 22 May 2022
(This article belongs to the Special Issue Advances in the Supply Chain and Circular Economy towards Sustainability)
Abstract
:The low-carbon supply chain is key to promoting sustainable development and solving environmental pollution. Government policies related to lowering carbon emissions deeply affect supply chains. This paper builds a supply chain decision-making model under three different regulatory policies: a pure carbon tax, a pure low-carbon subsidy, and a mixed policy with both a carbon tax and a low-carbon subsidy, then compares and analyzes the impacts of these three different regulatory policies on carbon emissions, manufacturer and retailer income, and marginal profit in order to determine the best course of action with respect to supply chain decision-making. Our results indicate that the supply chain decision-making model under the mixed carbon tax and low-carbon subsidy policy results in a unique Nash equilibrium solution between the retailer subsidy rate and the manufacturing carbon reduction rate in a non-cooperative game. Although a carbon tax is beneficial to the ecological environment, retailer income increases slightly as the carbon tax coefficient increases before declining rapidly. Manufacturer income has a negative linear relationship with carbon tax, and an excessive amount of carbon tax increases the burden on companies. Therefore, the government must establish reasonable standards for carbon tax collection while offering moderate low-carbon subsidies at the same time as a means of optimizing social welfare.
1. Introduction
In the context of low-carbon sustainable development, the government imposes carbon taxes on end products and subsidises low-carbon products. As a result of the carbon tax, manufacturers must handle the problem of carbon emissions and rely on strong coordination between manufacturers and retailers. With rising carbon dioxide emissions around the world, the increasing number of greenhouse gases have caused havoc. Facing the climate change crisis and the goal of “carbon neutralization” in all countries, carbon taxes are generally considered by the international community to be an effective market-oriented carbon emission reduction policy tool [1]; however, excessive taxation hinders economic growth [2]. Therefore, the introduction of a low-carbon subsidy policy can make up for the increase in enterprise costs [3] and raise the passion of enterprises for low-carbon innovation [4]. Many studies in this field have examined the supply chain of carbon tax and government subsidies, but have not considered low-carbon subsidies between supply chains.
Carbon tax and low-carbon subsidy research has primarily focused on enterprise incentives, low-carbon strategies, and government subsidiaries. In terms of enterprise incentives, regardless of the initial green innovation desire, a unit progressive carbon price might motivate businesses to participate in green innovation. For encouraging green innovation by all businesses, a progressive tax rate proved more beneficial than a set rate, while increases in the tax rate had a marginal declining impact [5]. Carbon tax policy is bad for business and bad for consumers, whereas it is positive for both enterprises and consumers if products are more satisfactory to customers. As the unit carbon price rises, the platform’s referral fee should decrease [6]. Consumer preferences and free-riding have a bigger influence on social welfare when it comes to low-carbon policies and proportional emission carbon tax policies. Progressive carbon taxes, in contrast to flat carbon taxes, can delay or even prohibit the order quantity system from bifurcating [7]. As in a government subsidiary, more firms embrace low-carbon manufacturing methods if there is a static carbon tax and a dynamic subsidy system in place. Consumers’ preferences for low-carbon products have a considerable influence on manufacturers’ decisions, indicating that supply chain members’ coordination demands are crucial to the strategies relevant to manufacturers’ lowering carbon emissions, and have a direct impact on outputs [8,9,10]. The carbon charge system is a valuable tool for reducing the byproducts of fossil fuels. Governments should instruct projects to establish the recuperation proportion in a reasonable range, and the specific option should be associated with the amount of remanufacturing cost savings and the green level of things [11].
The majority of the research on the impact of consumers’ low-carbon preferences is focused on low-carbon supply chains, emission reduction policies, and supply chain decision-making. In certain cases, both the channel profit and the reduction in emissions increase customer demand for low-carbon purchases. The manufacturer’s ideal carbon emissions per unit product stays the same. In the absence of regulation while maintaining ethical standards, less environmentally friendly manufacturing may be chosen in certain circumstances [12]. Consumer demand for low-carbon products can encourage enterprises to be more environmentally friendly and help the supply chain reduce carbon emissions. According to numerical simulations, the retailer’s sales scale increases as a result of cost-sharing for carbon emission reduction, making the upstream and downstream of the supply chain mutually beneficial [13]. The equilibrium outcomes, which include the order quantity, emission level, and profitability of supply chain participants under contract, are better than those obtained via centralized decision-making. In order to make low-carbon emission reduction work on a larger platform, retailers should cooperate to share this cost [14]. The carbon emission level of manufacturers is improved due to the lag time of energy-saving technology and consumers’ low-carbon concept, and will not affect suppliers. If the lag time does not change in this case, the supply chain only changes the demand of customers [15]. While the increased carbon intensity constraint reduces revenues and emissions in supply chain decision-making, the negative impact on its brand and society is partially offset by the cost contract. Governments should create an incentive system or control the carbon market to improve societal wellbeing [16]. A cooperative approach to emission reduction benefits both the producer and the merchant. Consumers’ low-carbon preferences drive businesses to produce and sell in a low-carbon way, whether or not manufacturers motivate them. Low-carbon promotion may aid in achieving emission reduction targets as well as economic and social advancement [17]. In the case of emission sensitivity, the joint sharing contract of repurchase and emission reduction is beneficial to each party in the supply chain and helps to optimize the dual channel. When the product emission is very low at the beginning and consumers have a low-carbon preference, dual channels are very suitable [18].
The study of optimal supply chain decision-making focuses on the following aspects: dual-channel supply chains, green supply chains, and optimal decision-making. The advantage of dual channel supply chains over single channel supply chains is that they can optimize the profit mode of manufacturers and supply chains and expand profit channels [19]. Due to asymmetric information, when the demand interruption is low, retailers may bear the consequences of knowledge leakage to stabilize their existing advantages and change the order quantity [20]. In terms of the green supply chain, when the retailer’s operating capital falls below a certain threshold, he or she acquires a fixed order. Whether supply chain members are funded by suppliers or banks, their benefits are greater than those of the benchmark model, and cleaner production benefits supply chain members more [21]. Under both power arrangements, whether the government subsidizes manufacturers or consumers, carbon emissions increase with the increase of subsidy coefficient and the retail price remains the same [22]. The profit level of supply chain and retailers are affected by the level of service. When the profit decreases, the optimal retail price decreases as well [23]. When a manufacturer operates as a Stackelberg leader, it has more opportunities to pursue greater predicted profits. In a closed-loop supply chain, dominance may result in poor overall system performance, such as higher sales prices, poorer collection rates, and lower predicted profits across the whole supply chain. Cost ambiguity may have a favourable impact on recycling rates [24].
While existing research provides a solid theoretical foundation for this project, there are constraints and room for growth. First, existing research on carbon taxes and low-carbon subsidies mostly discusses optimal supply chain decision-making from the single perspective of enterprise incentives, low-carbon strategy, and government subsidies, and lacks a systematic and comprehensive analysis of pure carbon tax policy, pure low-carbon subsidy, and a mixed taxation and subsidy policy. Second, existing research on the impact of consumers’ low-carbon preferences focuses primarily on low-carbon supply chains, emission reduction policies, and supply chain decision-making, and does not consider the impact of low-carbon subsidies on consumer preferences. Third, existing research on supply chain optimization decision-making focuses on dual channel supply chains, green supply chains, and optimization decision-making. Under a non-cooperative game, there is no Nash equilibrium solution of retailer subsidy rate and manufacturer carbon emission reduction rate. There is a lack of research on the optimal supply chain decision model under a mixed policy of a pure carbon tax policy, a pure low-carbon subsidy, or a carbon tax and low-carbon subsidy. We therefore adopt the supply chain decision-making model under the pure carbon tax and the pure low-carbon subsidy policies. The Stackelberg game model is based on retailer leadership and a supply chain decision-making model with member income as the objective function under a linear carbon tax. We compare the scores of these three models, solve the supply chain decision-making model’s equilibrium point, and explore the supply chain’s optimal decision-making. We concentrate on three major issues:
- Which policy’s supply chain decision-making model is the best, and is there a Nash equilibrium solution?
- Which policy’s supply chain decision-making model leads to the greatest carbon emission reduction?
- Is there a link between the carbon tax coefficient and the rate of carbon emission reduction, manufacturer income, and subsidy rate?
2. Theoretical Analysis and Development of Model
2.1. Supply Chain Decision Model Based on Pure Carbon Tax Policy
- (1)
- Parameter description.
It is necessary to build a two-tier supply chain, with producers and merchants on each level [25]. It is assumed that if the cost of raw materials processed by a manufacturer is c, the carbon emissions per unit product is e, the wholesale price ordered by retailers is w, and the price of products purchased by customers is p, then c < w < p. Market demand is fixed at d, manufacturer revenue is and retailer revenue is . Retailer income is the carbon tax that is levied on enterprises by the government, which is t. The parameter description can be seen in Table 1.
- (2)
- Profit model of supply chain members without the carbon tax mechanism.
The carbon emission per unit product that is produced by the manufacturer is e; retailers buy products from manufacturers according to market demand d and sell them to customers [26,27,28]. The profit function of manufacturers and retailers is as follows:
The manufacturer revenue function is
The retailer revenue function is
- (3)
- Profit model of the supply chain members under the carbon tax mechanism.
If it is assumed that carbon emissions are mainly produced by manufacturers, the government imposes a carbon tax on them due to the harmful greenhouse gases emitted to the environment [29,30].
① The relationship between carbon tax and carbon emissions
The carbon emissions per unit product clearly reflect the low-carbon degree of products. The lower the resource loss, the lower the carbon emissions will be per unit product.
There are currently several types of carbon tax rates, including a linear carbon tax, index carbon tax and segmented carbon tax [31,32,33,34]. Linear carbon taxes are the most common and the collection method is relatively simple. It can be easily understood and is accepted by enterprises. This tax can be applied to modelling, solutions, and analysis. A linear carbon tax is chosen here to study the impact of carbon tax on supply chain decision-making.
② Manufacturer income model under linear carbon tax
Under a linear carbon tax mechanism, if the linear carbon tax coefficient is , then the carbon tax formula of the unit product is
The manufacturer income function under linear carbon tax is
2.2. Supply Chain Decision Model Based on Pure Low-Carbon Subsidy Policy
- (1)
- Model assumptions.
Economic development leads to environmental pollution, and consumers have a strong low-carbon preference [35]. To stimulate market demand, enterprises in the supply chain must increase their low-carbon technological innovation to reduce carbon emissions through producing low-carbon products. We established a supply chain model with no subsidy and with a low-carbon subsidy in order to compare and analyse the changes in carbon emissions and member income in different modes. This study used assumptions based on the following in order to develop the supply chain model:
Hypothesis 1 (H1).
Consumers favour low-carbon products.
Hypothesis 2 (H2).
Market demand is fixed.
Hypothesis 3 (H3).
Enterprises should invest in research and development related to low-carbon technology. Existing research [36,37] shows these costs to be related to the carbon emissions reduction rate. The relationship is , where ξ is the cost coefficient of carbon emissions reduction technology (indicating the difficulty of carbon emissions reduction) and is the carbon emissions reduction rate of the manufacturer, . The carbon emissions per
unit product are then reduced to .
The carbon emission reduction rate refers to the reduction rate of carbon emissions in the previous period compared with that in the current period.
Hypothesis 4 (H4).
Consumers have a low-carbon preference, and market demand becomes the original demand d and demand change ; thus,, where δ indicates consumer low-carbon preference.
- (2)
- Supply chain decision model without low-carbon subsidy.
In the decision-making model for a supply chain without a low-carbon subsidy, the decision variable is the manufacturers and the objective function is the income function of manufacturers and retailers.
① Manufacturer revenue
Manufacturer revenue is , manufacturer cost is , and the cost of low-carbon technology is . The manufacturer revenue function is then
② Retailer revenue
Retailer revenue is and retailer cost is . The retailer revenue function is then
Theorem 1.
Without any subsidy, the optimal carbon emissions reduction rate for manufacturers is: .
- (3)
- Supply chain decision model under low-carbon subsidy.
Low-carbon technologies can help manufacturers cut carbon emissions. Market demand and store income both rise as a result of customers’ low-carbon preferences [38,39]. Retailers subsidize manufacturers and encourage innovation. This section is based on a Stackelberg game model that is led by retailers. The manufacturer decision variable is the carbon emissions reduction rate, , and the decision variable of retailers is the subsidy rate, λ. A supply chain decision model is then established.
① Manufacturer revenue
Manufacturer revenue is , low-carbon subsidies provided by retailers are , and manufacturer cost is . The manufacturer revenue function is then
② Retailer revenue
Retailer revenue is , retailer cost is , and the low-carbon subsidies provided by retailers are . The retailer revenue function is then
Theorem 2.
There is a unique Nash equilibrium solution between the manufacturer carbon emissions reduction rate,, and the retailer subsidy rate, λ, in a non-cooperative game with low-carbon subsidies:
- (4)
- Compare the supply chain decision-making model with or without low-carbon subsidies.
The following conclusions can be reached after analysing the supply chain decision-making model with or without subsidies:
① Factors influencing the carbon reduction rate of manufacturers
We can obtain by finding a first-order partial derivative for the low-carbon preference of consumers δ for carbon emission reduction rates . Carbon emission reduction rates have a positive correlation with the low-carbon preferences of consumers. We can obtain by finding a first-order partial derivative of the carbon emission reduction cost factor ξ for carbon emission reduction rates , whereby the carbon emissions reduction rate has a negative correlation with the carbon emissions reduction technology cost coefficient. In the case of low-carbon subsidies, the first-order partial derivative of the subsidy rate for the carbon emissions reduction rate is .
② The nature of the retailer subsidy rate
The marginal profit of the manufacturer is and that of the retailer is . We can obtain a first derivative of the marginal profit on as follows:
Thus, has a negative correlation with manufacturer revenue and a positive correlation with retailer marginal earnings.
③ Low-carbon subsidies coordinate supply chains
The marginal profit of manufacturers is ; has a positive correlation with manufacturer marginal profit and has a positive correlation with retailer and supply chain marginal profit. Low-carbon subsidies incentivise the innovation of low-carbon technology by enterprises while promoting the coordination of supply chain decision-making.
- (5)
- Analysis of carbon emissions reduction and member income of low-carbon subsidies.
Whether there is carbon emissions reduction and member income with low-carbon subsidies is studied and the impact of low-carbon subsidies on carbon emissions reduction and member income is analysed.
① Carbon emissions reduction optimisation analysis
The optimal carbon reduction rate is for manufacturers when there is a low-carbon subsidy and is reduced with when there is no subsidy. The following is obtained:
When , according to , , then . In the event of a low-carbon subsidy, the carbon reduction rate of manufacturers is greater than the non-subsidised carbon reduction rate. Therefore, low-carbon subsidies are able to increase the rate of carbon emissions reduction, which reduces carbon emissions. The reduction in carbon emissions per unit of product is
② Revenue analysis for manufacturers and retailers
With low-carbon subsidies, the optimal subsidy rate, , and the optimal carbon emission reduction rate, , are substituted into the manufacturer income function (8) in order to obtain the benefits of the manufacturer with a low-carbon subsidy, . The revenue function of the retailer (9) is substituted for obtaining the benefits of the retailer with a low-carbon subsidy, .
Therefore, a low-carbon subsidy under manufacturer earnings minus the non-subsidy manufacturer earnings results in
With low-carbon subsidies, retailer earnings minus retailer benefits without subsidies results in
When , , there is a low-carbon subsidy and manufacturer income is higher than under the non-subsidy; means that retailers have greater incomes with low-carbon subsidies than with none. As low-carbon subsidies contribute to lower carbon emissions and greater consumer demand, retailers can subtract low-carbon subsidies. However, when there is higher demand, with low-carbon subsidies both manufacturers and retailers are more profitable than in non-subsidy situations, which facilitates supply chain coordination.
2.3. A Supply Chain Optimal Decision-Making Model Based on Carbon Taxes and Low-Carbon Subsidies
To establish a low-carbon economy, the government must impose a tax on environmental damage caused by businesses and regulate their carbon emissions [40]. Carbon taxation is a punitive measure and converts the external costs of environmental pollution caused by enterprises into internal costs, making it essential that enterprises consider their carbon emissions. As an incentive, low-carbon subsidies can stimulate innovation around low-carbon technologies by enterprises and increase the enthusiasm enterprises have for low-carbon innovation, leading to an effective reduction in carbon emissions [41]. By combining a carbon tax mechanism with a low-carbon subsidy policy, a supply chain decision-making model can be constructed in which the impact carbon emissions have on low-carbon subsidies, carbon emission reduction rates, and member incomes can be analysed based on the consideration of carbon taxes and low-carbon subsidies.
Government can impose a linear carbon tax on manufacturing companies throughout the supply chain with carbon tax coefficient . Manufacturers are then able to make decisions based on carbon taxes, and retailers can decide the proportion of low-carbon subsidies. We constructed a decision model based on the Stackelberg game model for retailers under a linear carbon tax. The retailer decision variable is the subsidy rate, λ, the manufacturer decision variable is the carbon emissions reduction rate, , and the upstream decision model of the downstream subsidy incentive of the supply chain is based on member income with its target function.
- (1)
- A supply chain decision-making model under linear carbon tax and low-carbon subsidies is established.
① Manufacturer revenue
Manufacturer revenue is , the low-carbon subsidy provided by retailers is , manufacturer cost is , low-carbon technology cost is , carbon tax paid is , and the manufacturer yield function is
② Retailer revenue
Retailer revenue is , retailer cost is , the low-carbon subsidy provided by retailers is , and the retailer revenue function is
- (2)
- Model solving and analysis.
Theorem 3.
In the case of a linear carbon tax combined with low-carbon subsidies, the retailer subsidy rateλand the manufacturer carbon reduction rateexist in a non-cooperative game with a Nash equilibrium solution.
Proof.
The game process is divided into two processes. When the linear carbon tax coefficient, , is known, the retailer bears the cost of the low-carbon technology of the manufacturer at subsidy rate λ. During the second stage, manufacturers take carbon taxes into account with their own revenue function when the carbon tax is known and decide on carbon reduction rates θ after low-carbon subsidies are combined.
Reverse induction is used by the model to obtain the objective function of the second stage, which determines the carbon reduction rate of manufacturers, . If the manufacturer aims to maximise their own interests, then
The first-order partial derivative for is
and the solution is
Second, it is brought into the reaction function of the first stage, the determination of the subsidy rate of the retailer λ. If retailers aim to maximise their own interests, then
The first-order partial derivative for is
and the solution is
when is brought into (18), the solution is
Verification is therefore complete. □
3. Numerical Simulation
3.1. Supply Chain Decision Simulation Based on Pure Carbon Tax
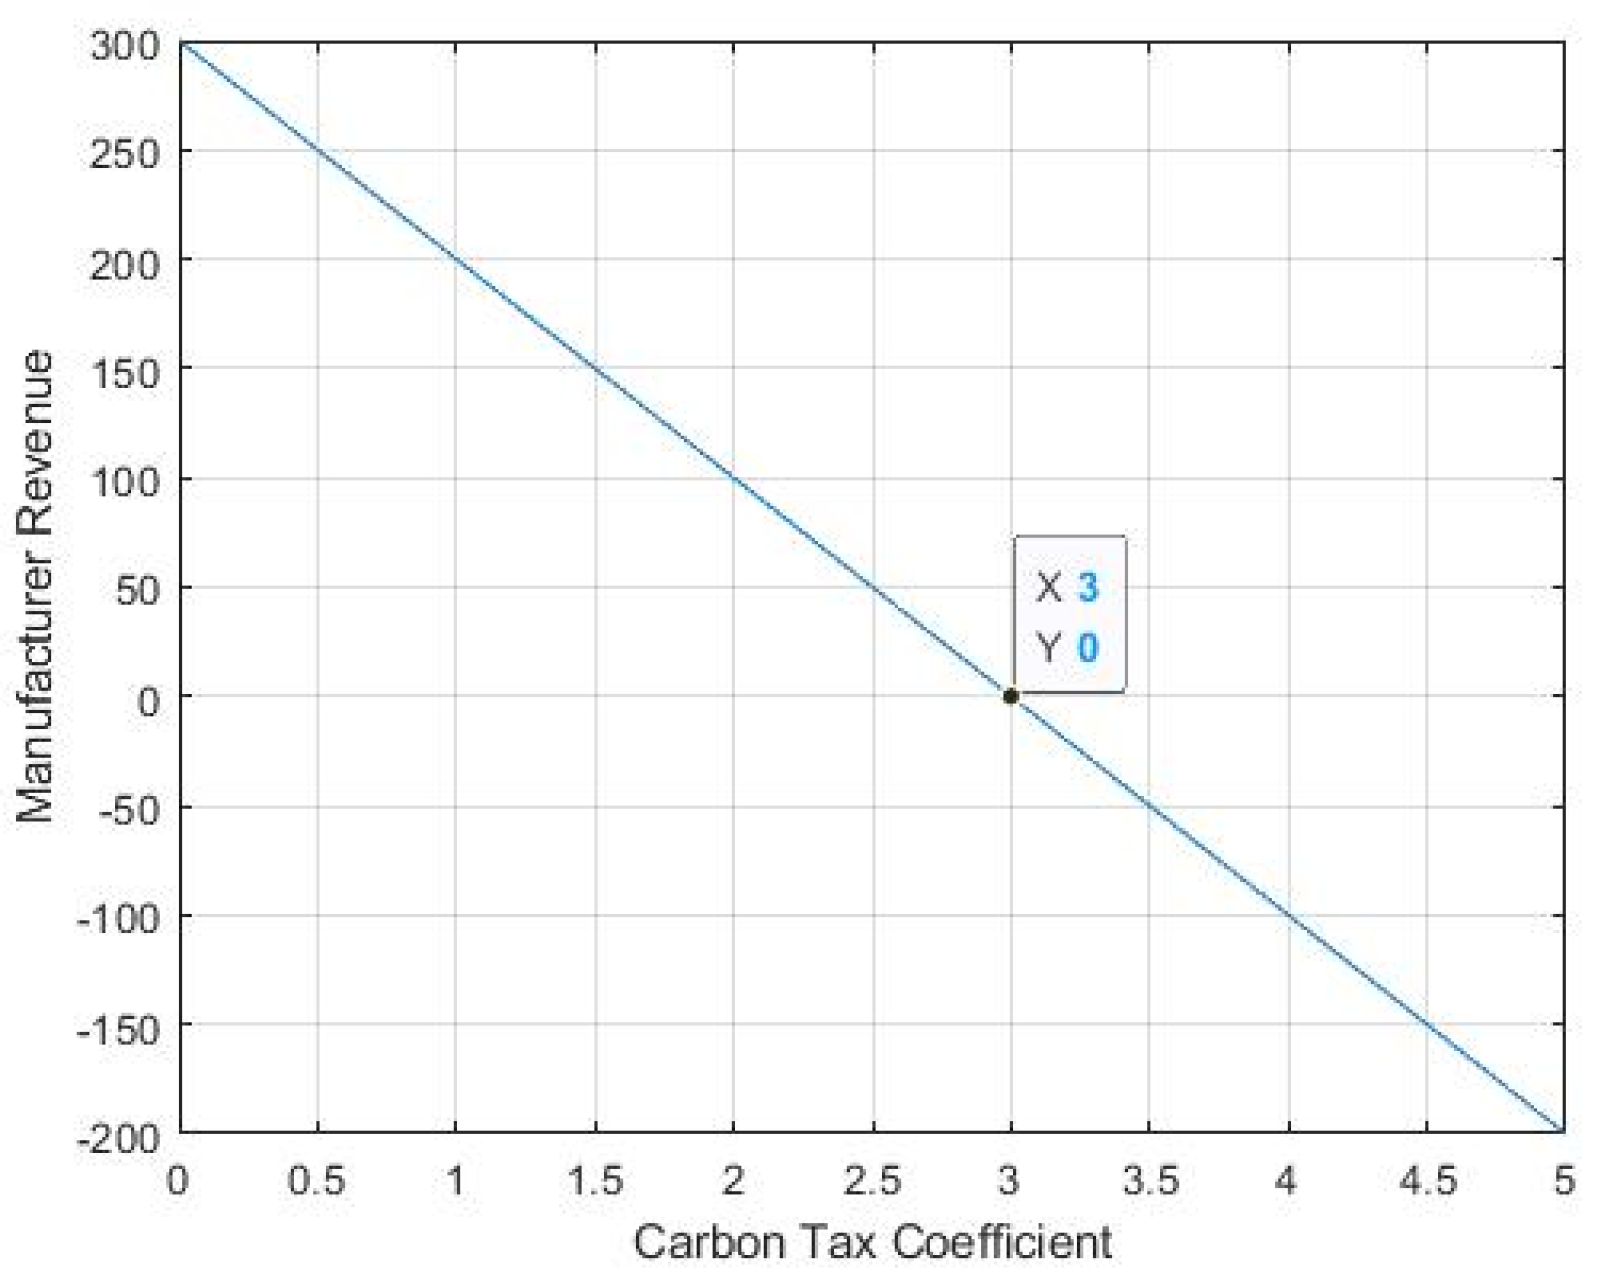
MATLAB (2018A) software can simulate numerical changes. Based on the relevant literature [42,43], the parameters in this paper were set as follows: p = 10; w = 8; c = 5; d = 100; e = 1. For the carbon tax coefficient, the step size was 0.1; the change of the carbon tax coefficient on manufacturer income can be seen in Figure 1.
Figure 1 shows the carbon tax coefficient to have a negative linear relationship with manufacturer income. When the carbon tax coefficient is higher than 5, there is no manufacturer income. Therefore, the government must formulate an appropriate carbon tax coefficient in order to avoid hindering economic development through an excessive carbon tax.
3.2. Supply Chain Decision Simulation Based on Pure Low-Carbon Subsidy Policy
The influencing factors of low-carbon subsidies and carbon emission reduction with no subsidies and low-carbon subsidies were compared and analysed, along with the impact of low-carbon subsidies on carbon emission reduction and member income. The previous parameters remained unchanged and the parameter settings were as follows: p = 10; w = 8; c = 5; d = 100; e = 1; δ = 110; ξ = 1800.
- (1)
- Analysis of the impact of carbon emissions reduction rate on member income without subsidy.
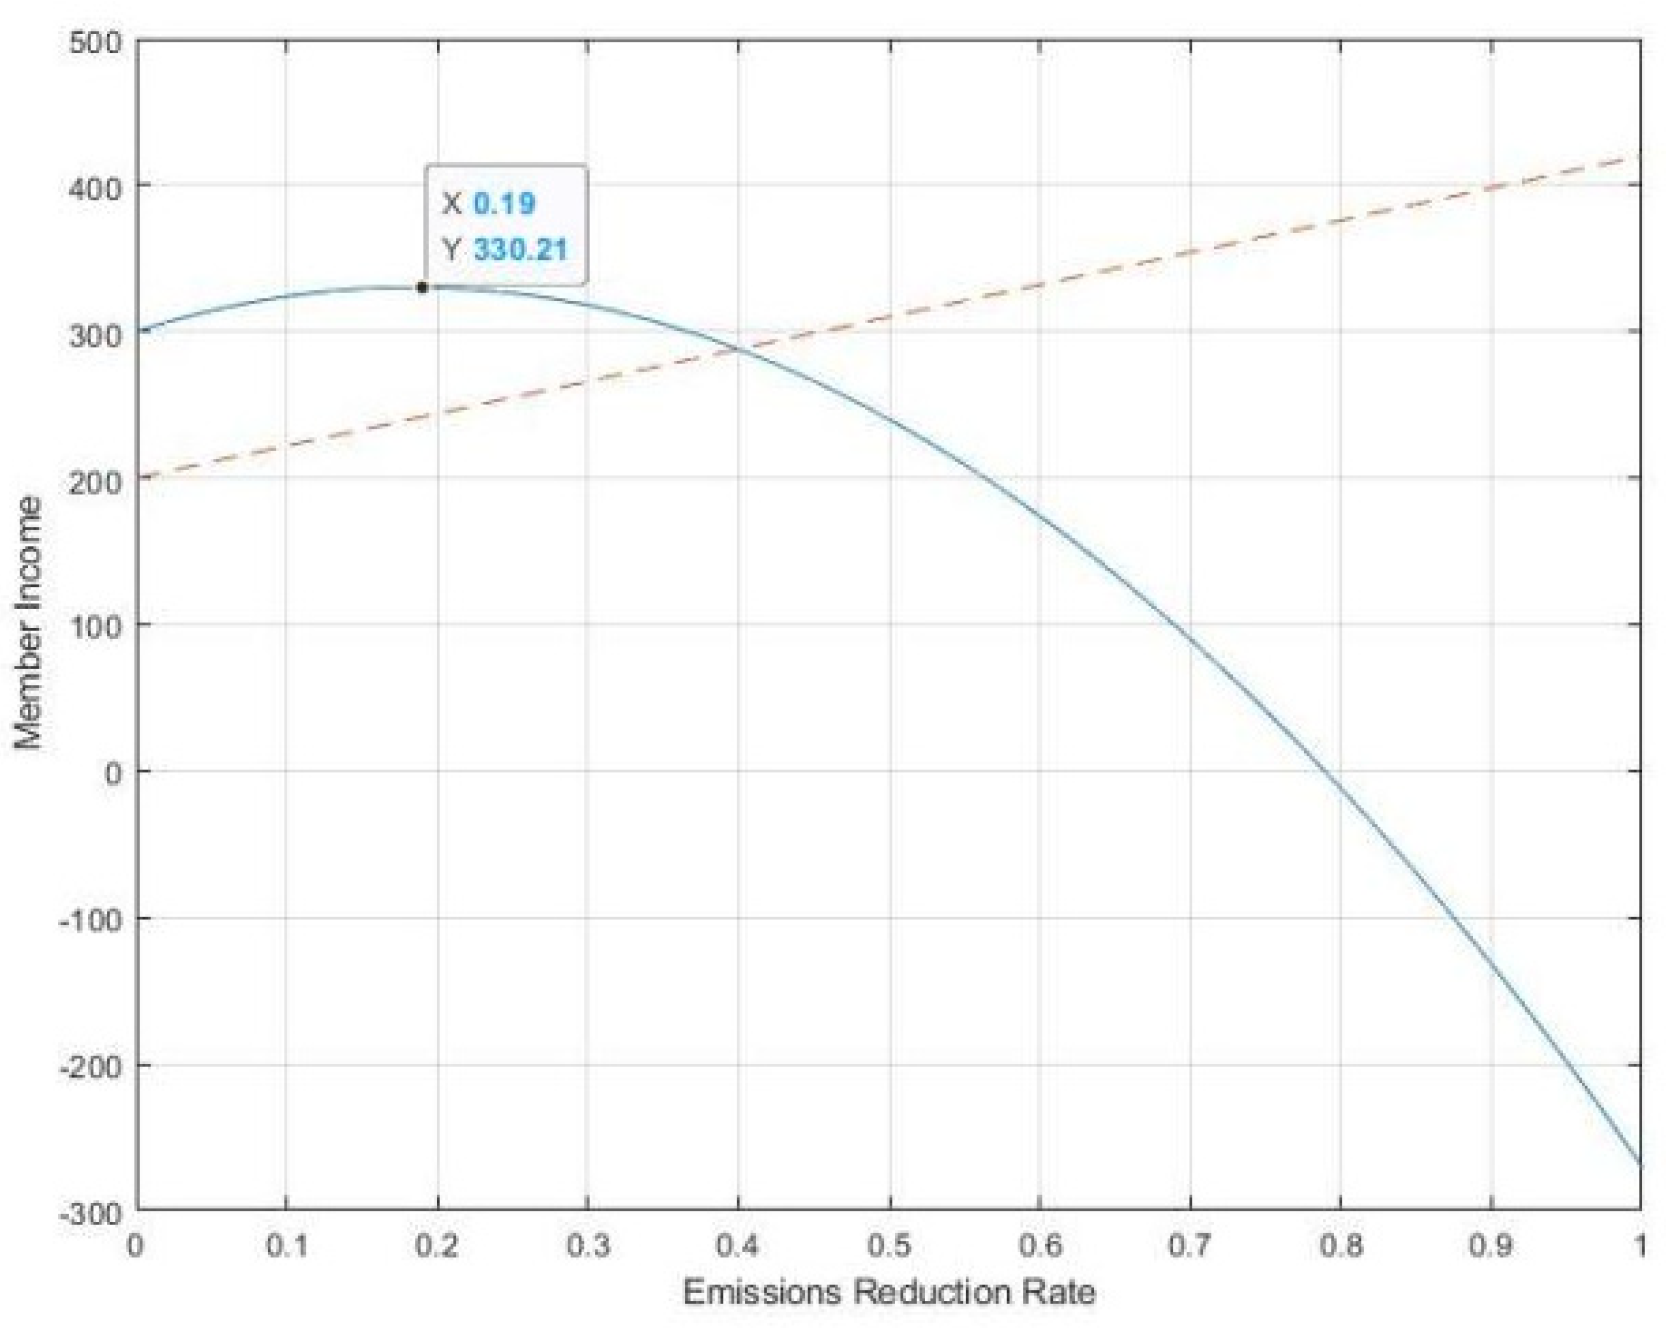
Figure 2 shows that manufacturer income initially increases before decreasing as the carbon emissions reduction rate increases. The optimal decision of the manufacturer is when manufacturer income is highest (330.2), while retailer income increases as the carbon emissions reduction rate increases. With the optimal solution, consumer demand and retailer revenue both increase accordingly.
- (2)
- Analysis of influencing factors of low-carbon subsidy strategy.
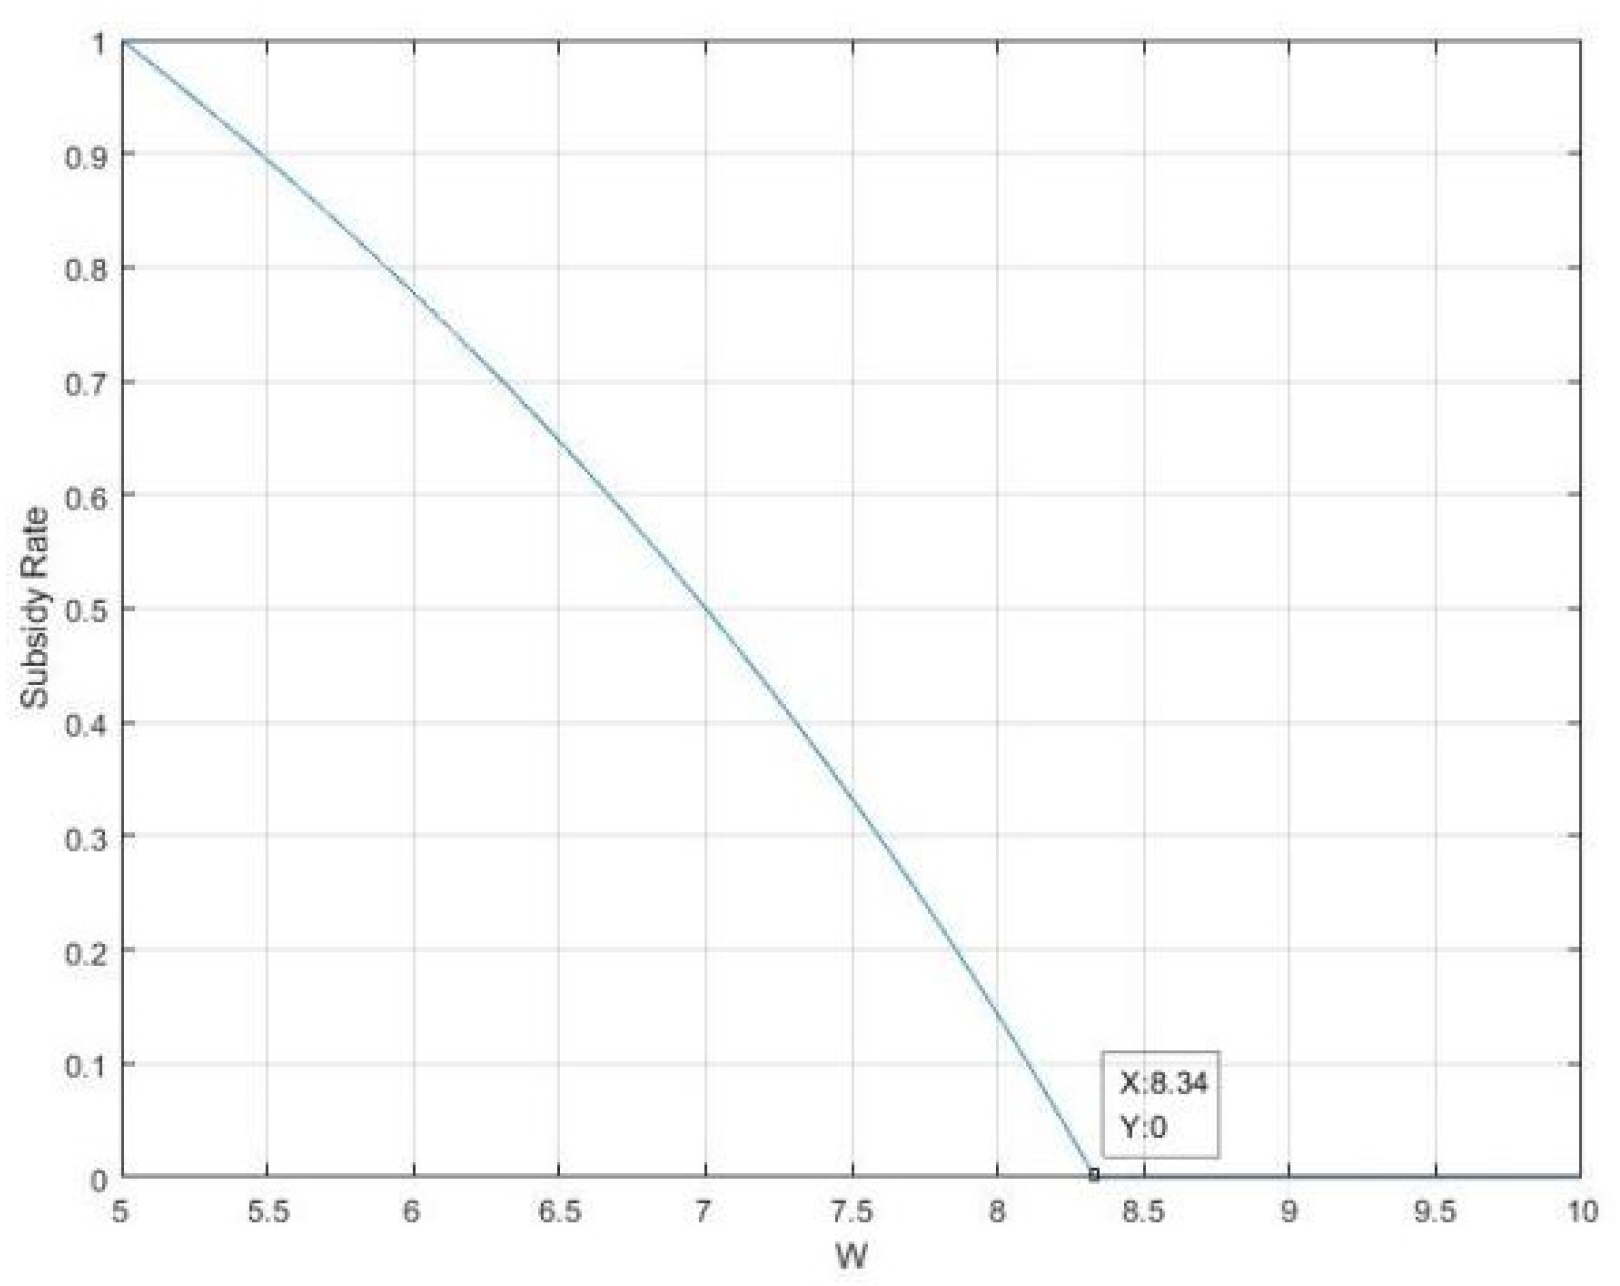
The above analysis shows low-carbon subsidies to be related to the means of profit distribution, while the subsidy rate has a positive correlation with the marginal profit of retailers and a negative correlation with the marginal profit of manufacturers. The parameters were set as follows: p = 10; w = 8; c = 5; d = 100; e = 1; δ = 110; ξ = 1800. As w (the wholesale price of products ordered by retailers) changes between (c, p), the change in subsidy rate was studied under different profit distributions, as shown in Figure 3.
Figure 3 shows that as w increases, the profit margin of the manufacturer increases and that of the retailer decreases. When w = c = 5, the marginal revenue of the manufacturer is 0, the subsidy rate is 1, and the retailer bears all the low cost of carbon technology, which gradually decreases, while when w = 8.34, the subsidy rate is 0, low-carbon subsidies are linked to profit margins, and low-carbon subsidies increase as retailer profits increase.
- (3)
- Analysis of influencing factors of carbon emissions reduction.
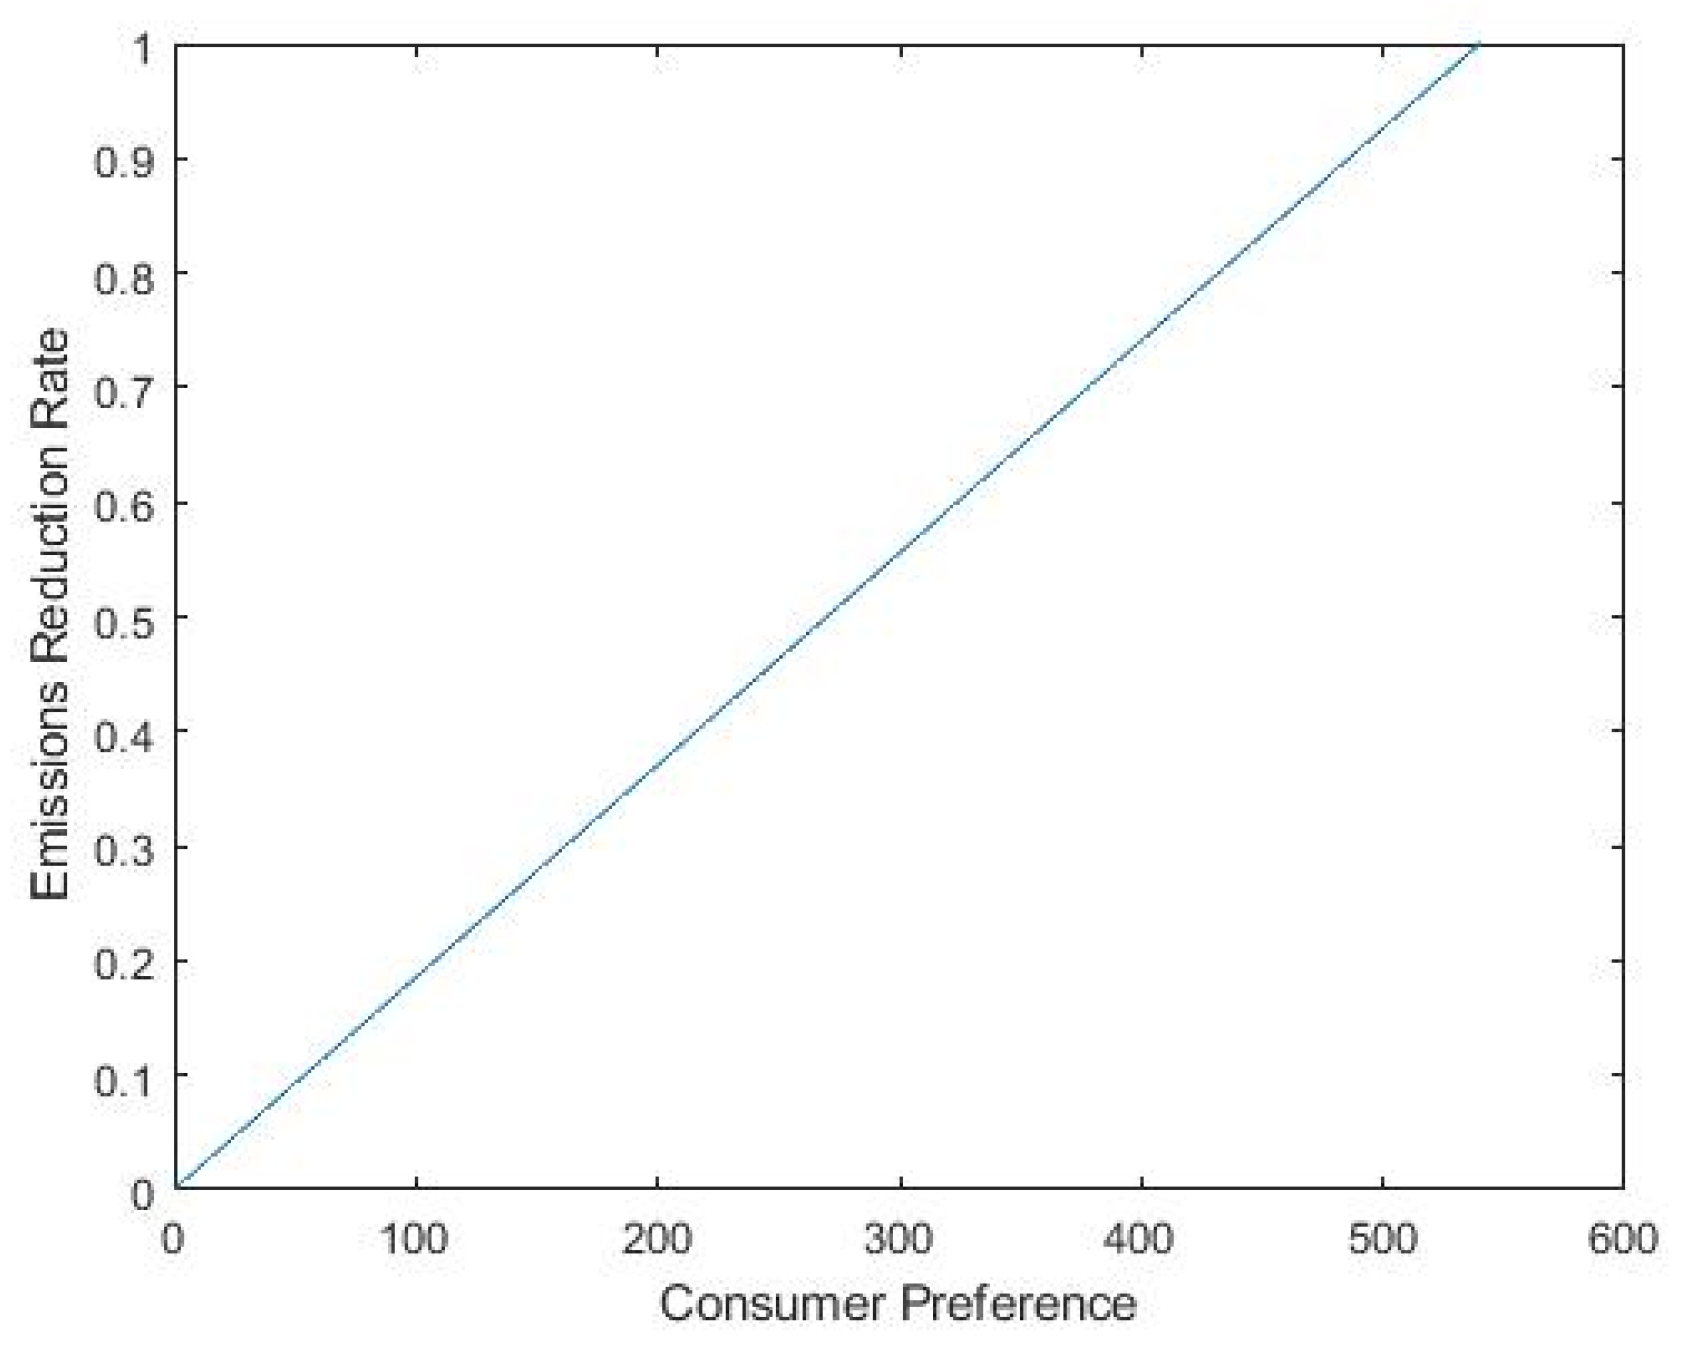
With the other parameters fixed, the influences of consumer preference, δ, the low-carbon technology cost coefficient, ξ, and the subsidy rate, λ, on the carbon emissions reduction, , were studied.
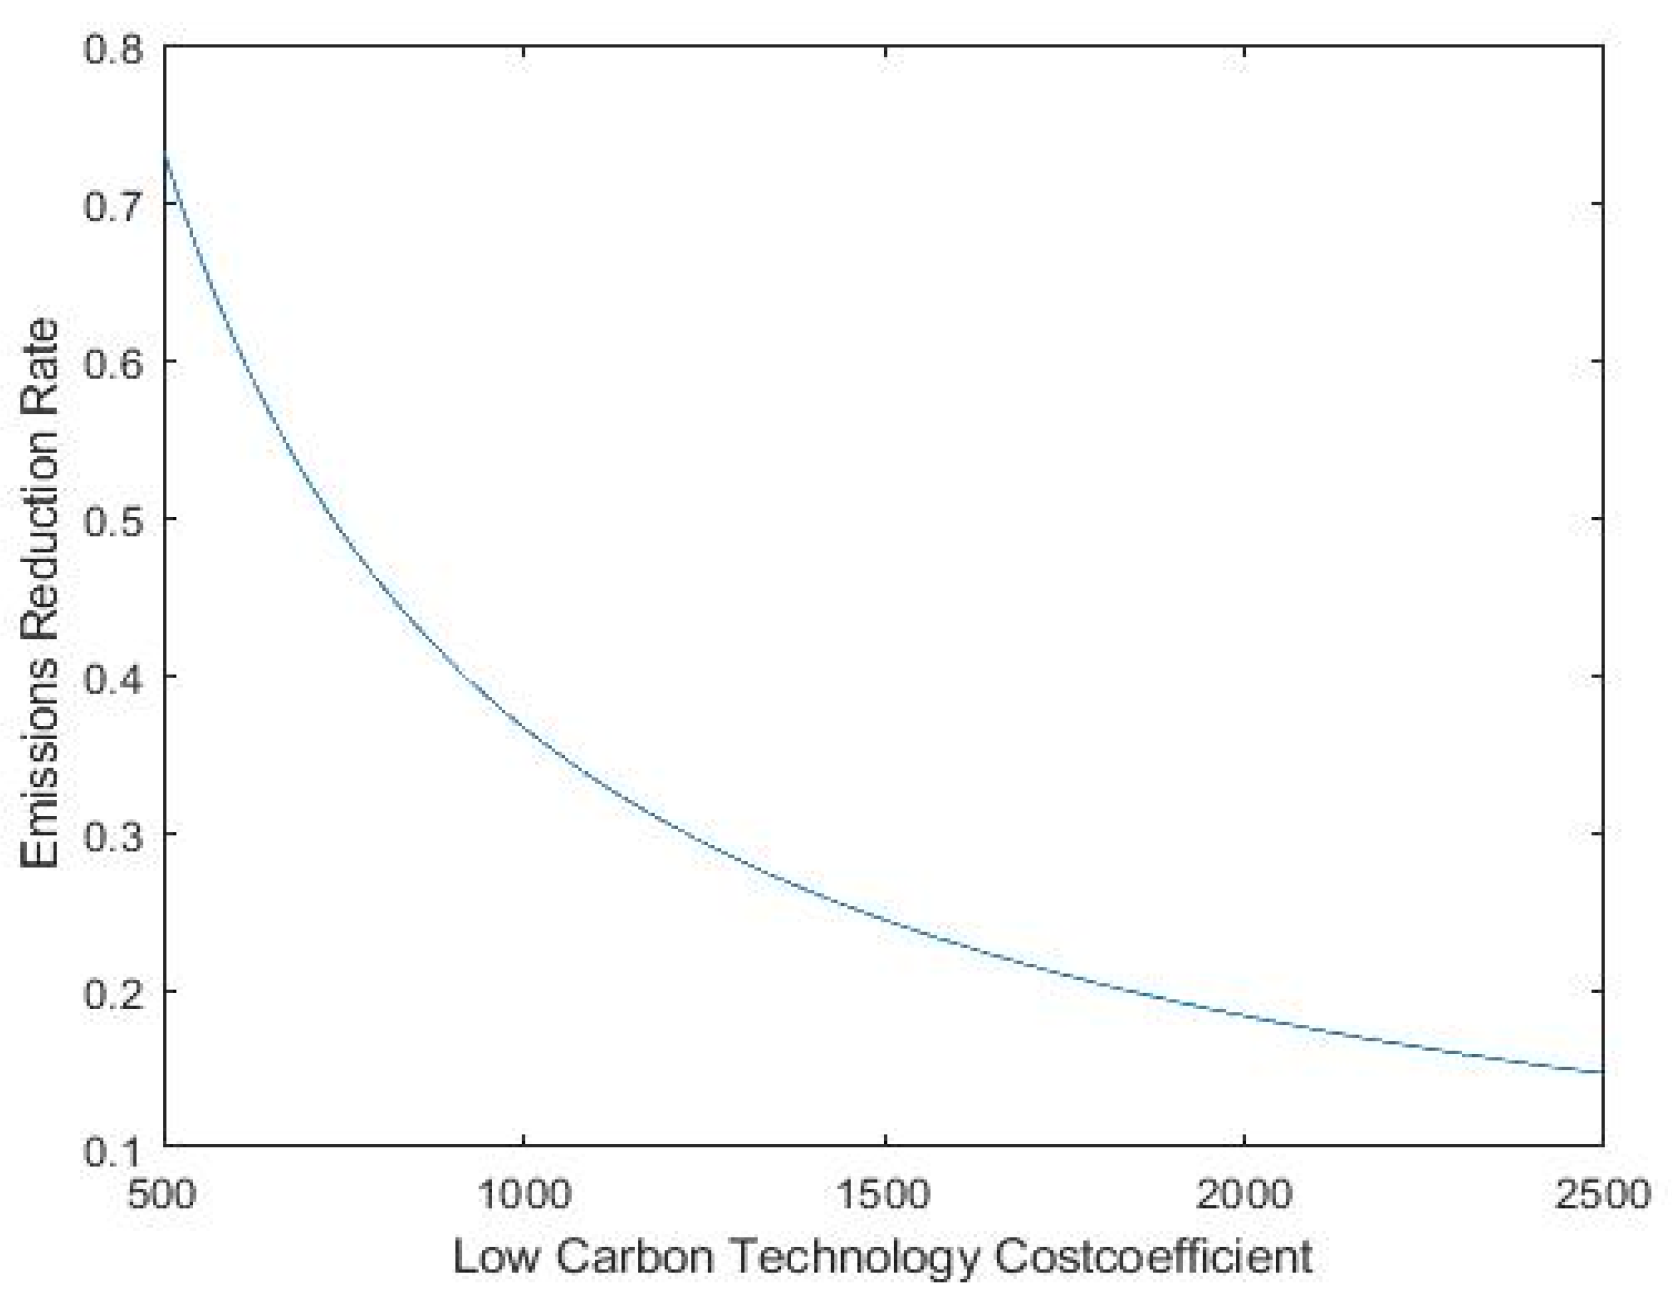
Figure 4 shows a positive linear relationship between the carbon emissions reduction rate and the low-carbon preferences of consumers. In Figure 5, it can be seen that the carbon emissions reduction rate has a negative correlation with the low-carbon emissions reduction cost coefficient, and the rate of decrease of carbon emissions reduction is slower with the higher cost of low-carbon technology.
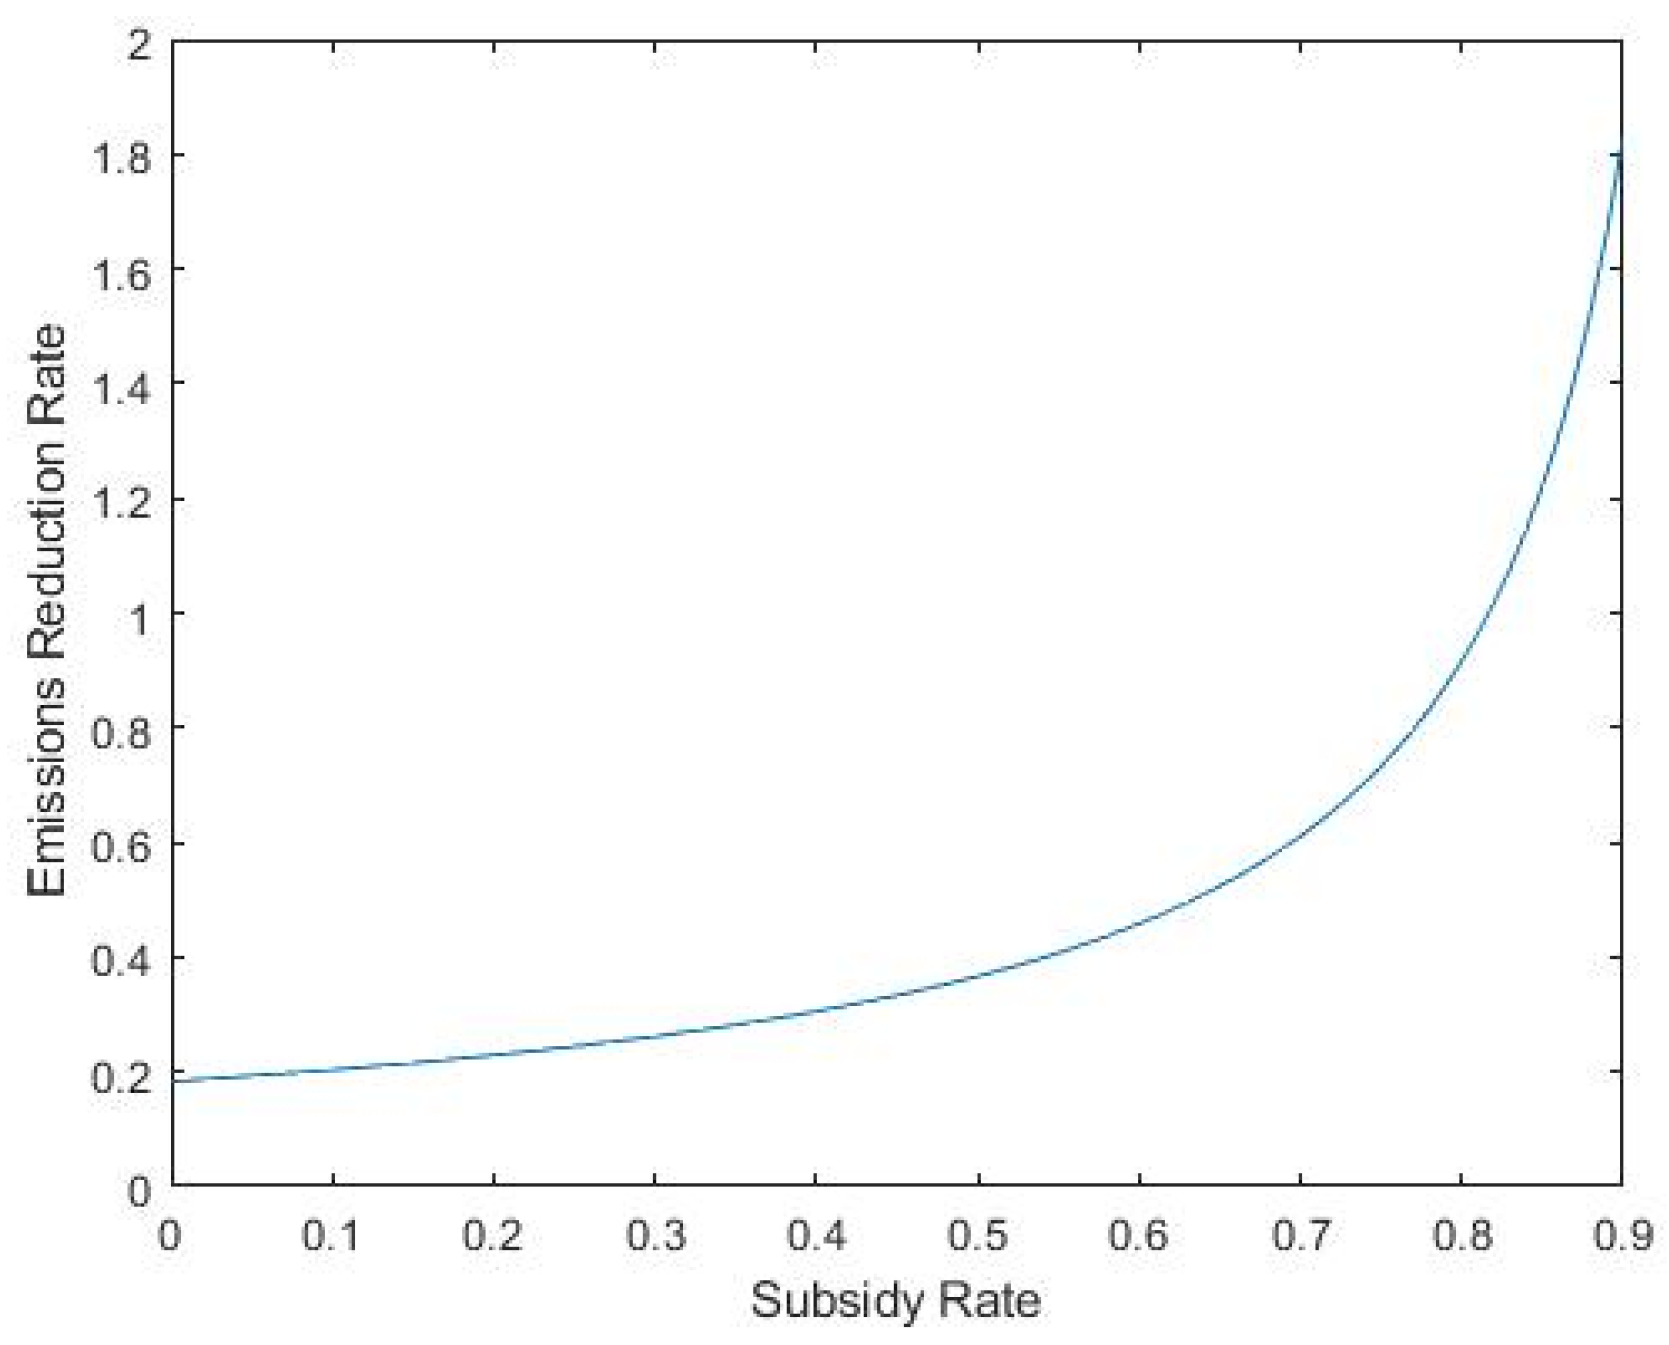
Figure 6 shows the carbon emissions reduction rate to have a positive correlation with the subsidy rate; the greater the subsidy rate, the more rapidly the carbon emissions reduction rate grows.
In conclusion, with low-carbon subsidies the carbon emissions reduction rate has a negative correlation with the cost coefficient of low-carbon technologies. Therefore, the government must promote the low-carbon concept.
- (4)
- Analysis of the impact of low-carbon subsidies on member income.
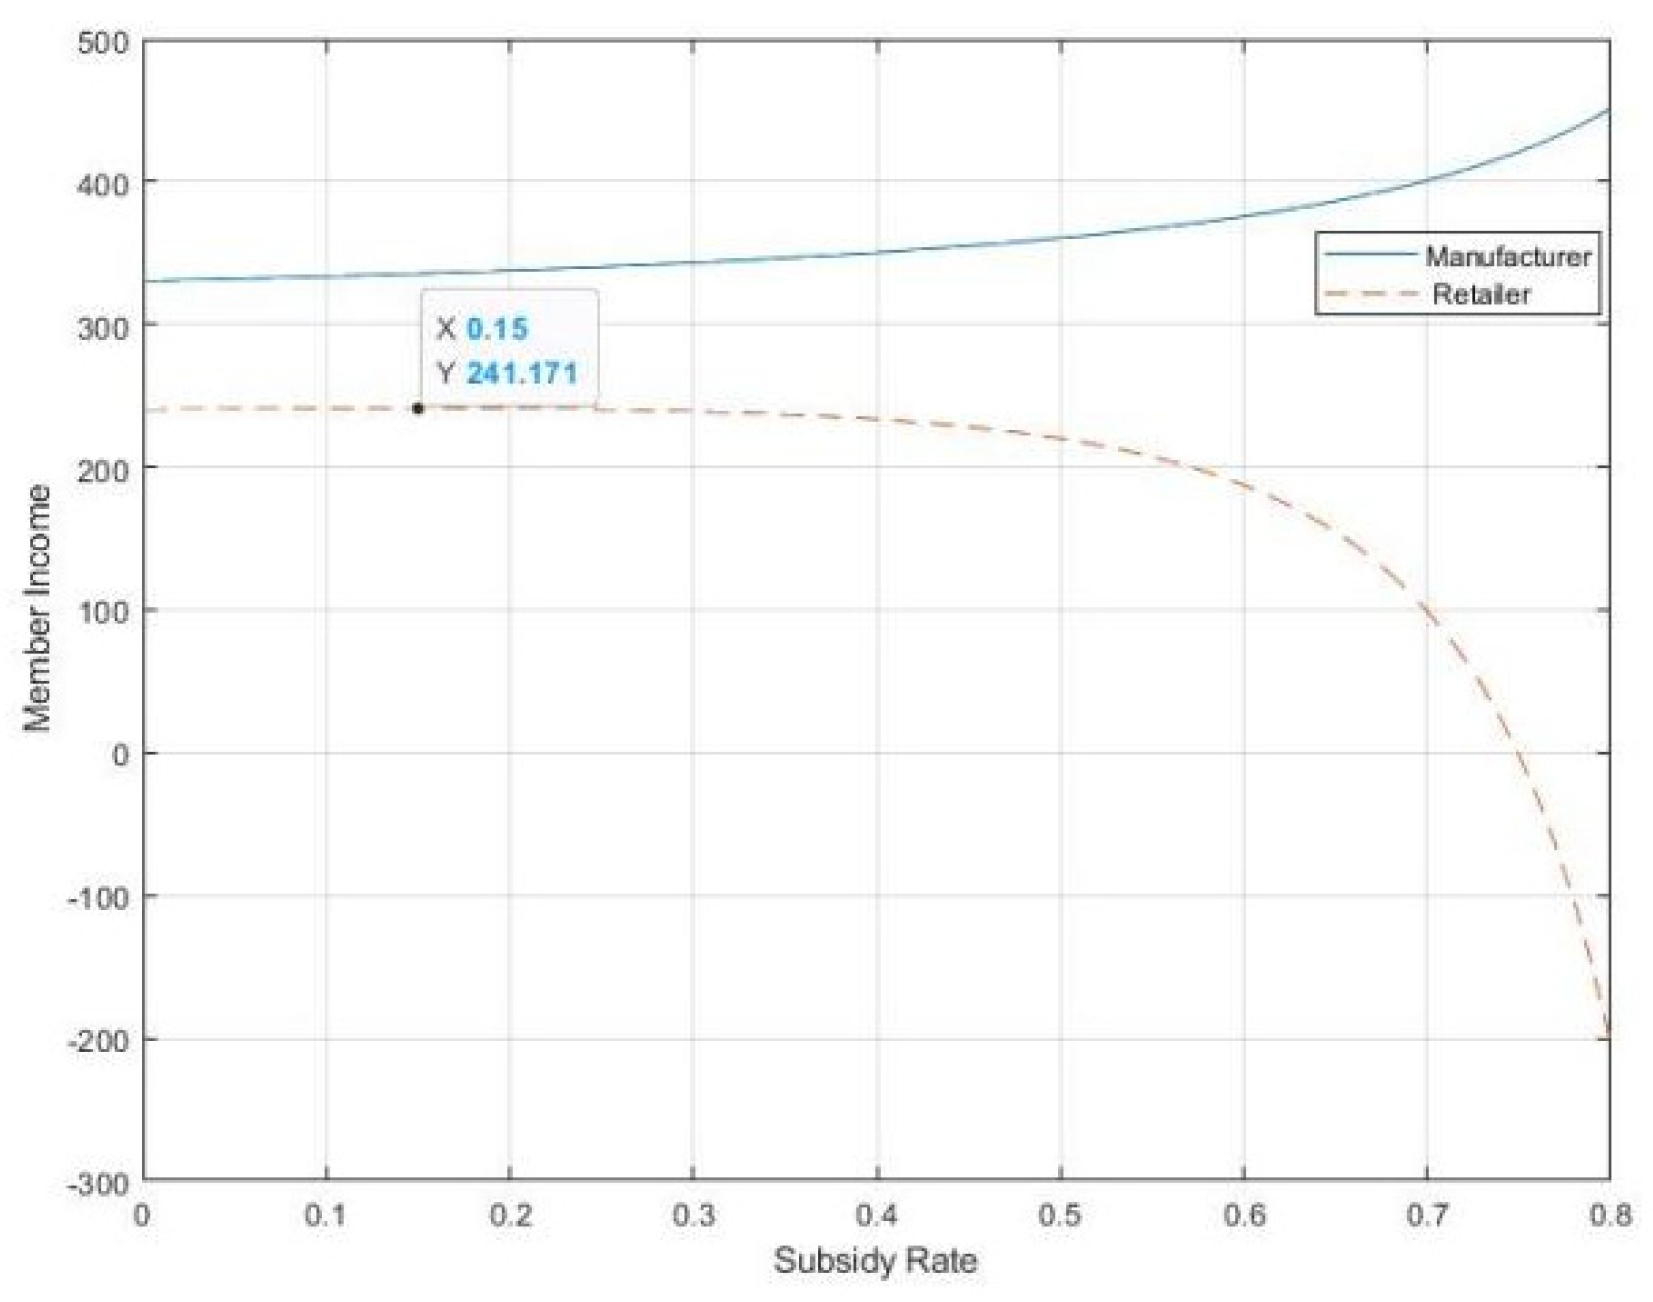
With a low-carbon subsidy, other parameters are fixed for analysing the impact subsidy rate has on member income, as can be seen in Figure 7.
Figure 7 shows that retailer income initially increases before decreasing as the subsidy rate, λ, increases. When λ = 0.15, retailer income is at its highest; as λ increases, retailer income decreases more rapidly. As the subsidy rate increases, the cost of low-carbon technologies increases and the retailer subsidy increases more quickly. At the same time, as λ increases, manufacturer income monotonically increases faster.
- (5)
- Analysis of carbon emissions and member income at decision-making equilibrium point.
As Table 2 shows, the equilibrium solution, the carbon emissions reduction rate and the member income of both manufacturers and retailers under low-carbon subsidies are all higher than without low-carbon subsidies.
3.3. Supply Chain Optimal Decision Simulation Based on Carbon Tax and Low-Carbon Subsidy Policy
- (1)
- The influence of carbon tax coefficient on subsidy rate.
The effect of a joint carbon tax and low-carbon subsidy policy [44,45] on member income was analysed with the following parameter settings: p = 10; w = 8; c = 5; d = 100; e = 1; δ = 110; ξ = 1800.
The effects of different types of carbon taxes on carpet subsidies were studied as well.
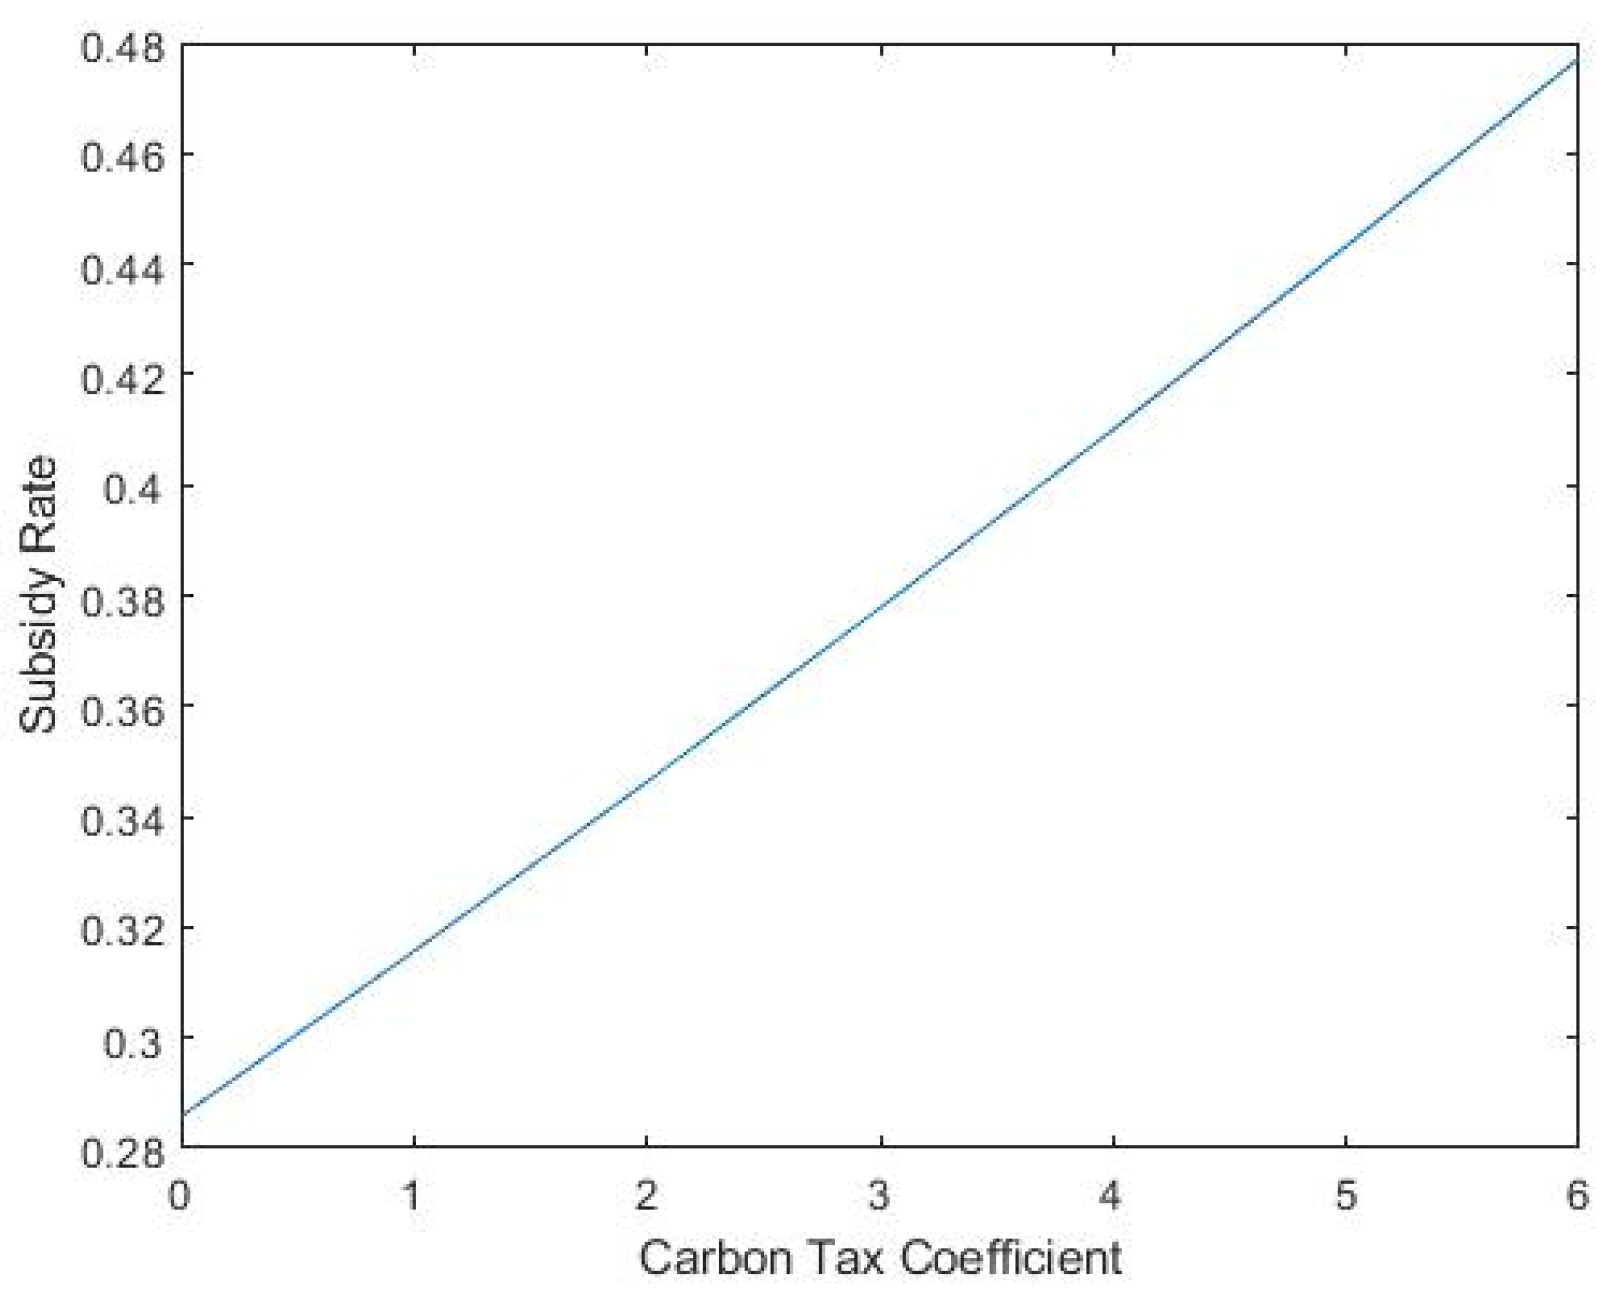
Figure 8 shows a positive linear relationship between the carbon tax coefficient and the subsidy rate. When a carbon tax is combined with low-carbon subsidies, more income is received by the subsidy side; the more the subsidizer has, the higher the subsidy is, and vice versa. At the same time, the carbon tax positively affects the subsidy.
- (2)
- The impact of carbon tax on carbon emission reduction.
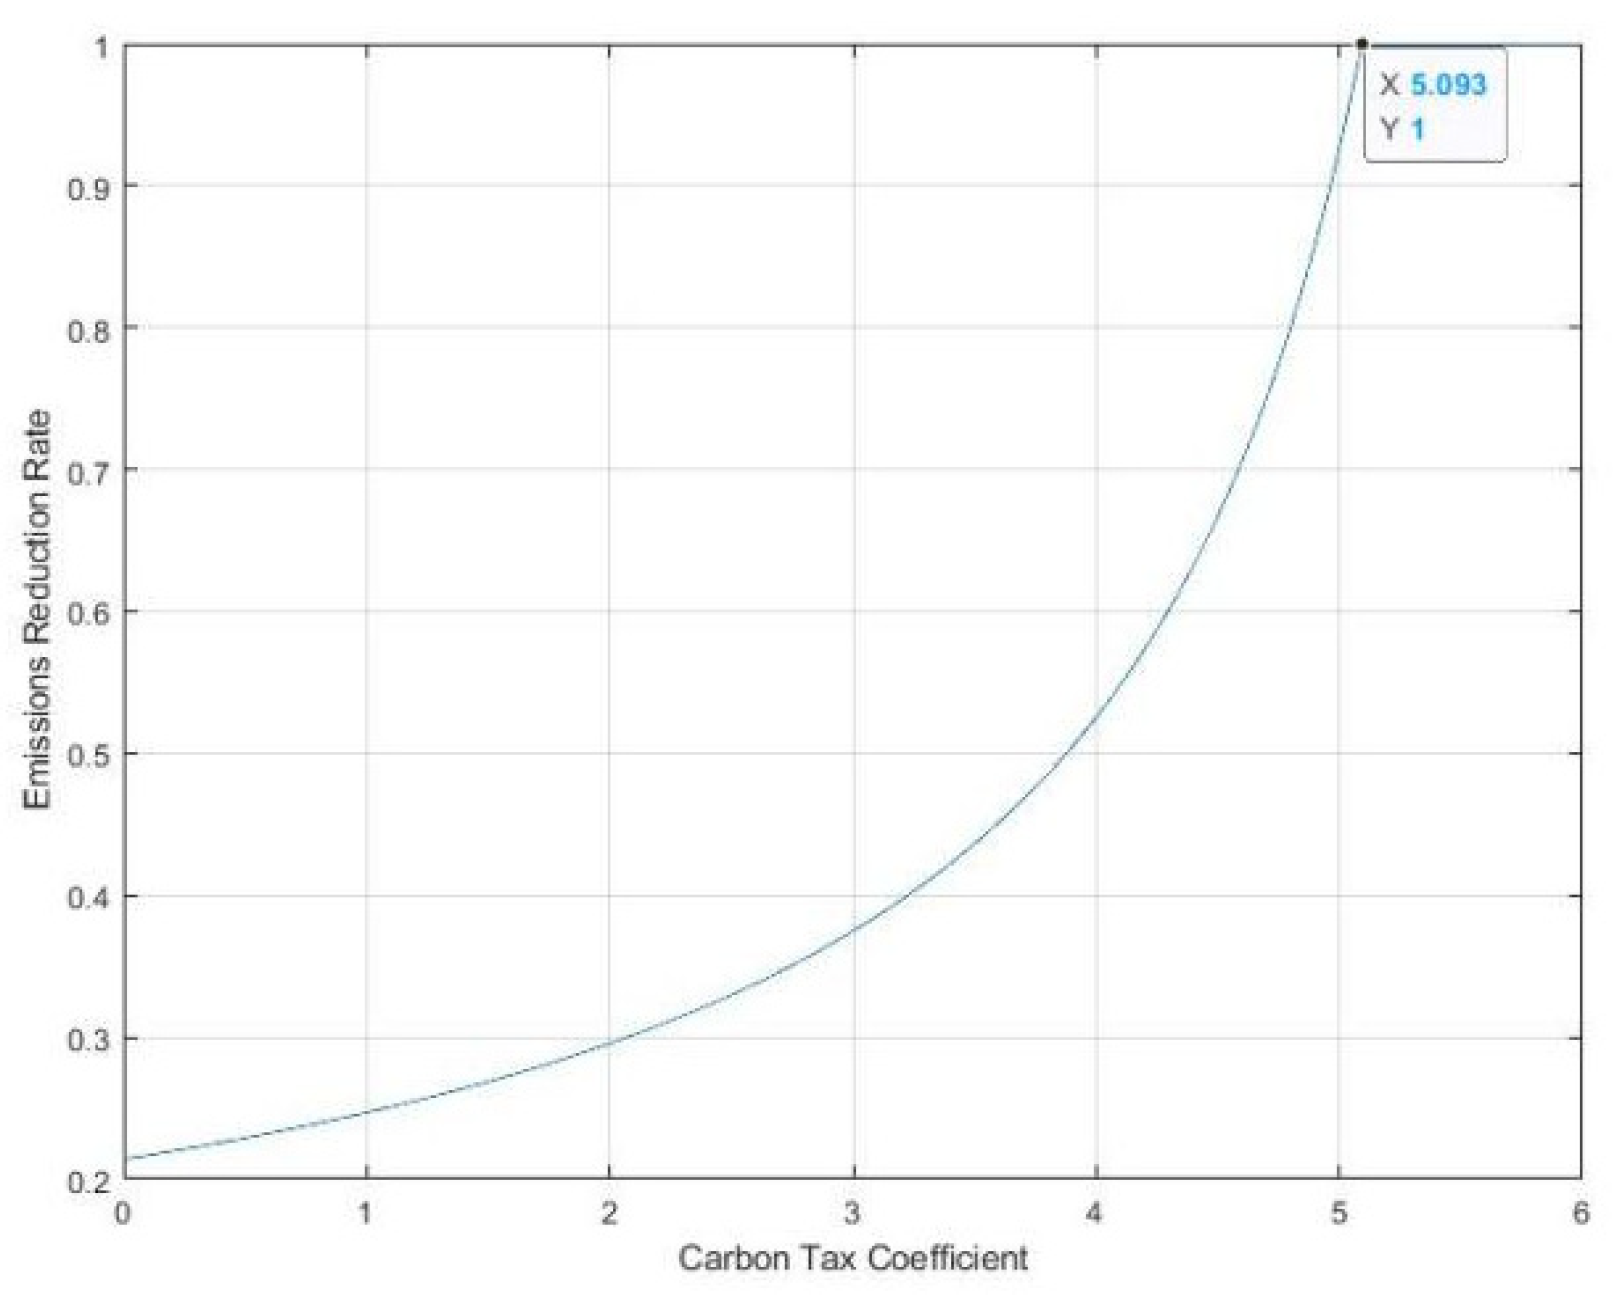
From the above analysis, a carbon tax can effectively control the harm caused by greenhouse gases; the influence that different types of carbon taxes have on the carbon emission reduction rate was studied as well.
Figure 9 shows that with a carbon tax combined with low-carbon subsidies, the carbon emissions reduction per unit product increases as the carbon tax increases, and the rate of carbon emission reduction increases more rapidly.
- (3)
- The effect of marginal profit distribution on subsidy rate under carbon tax.
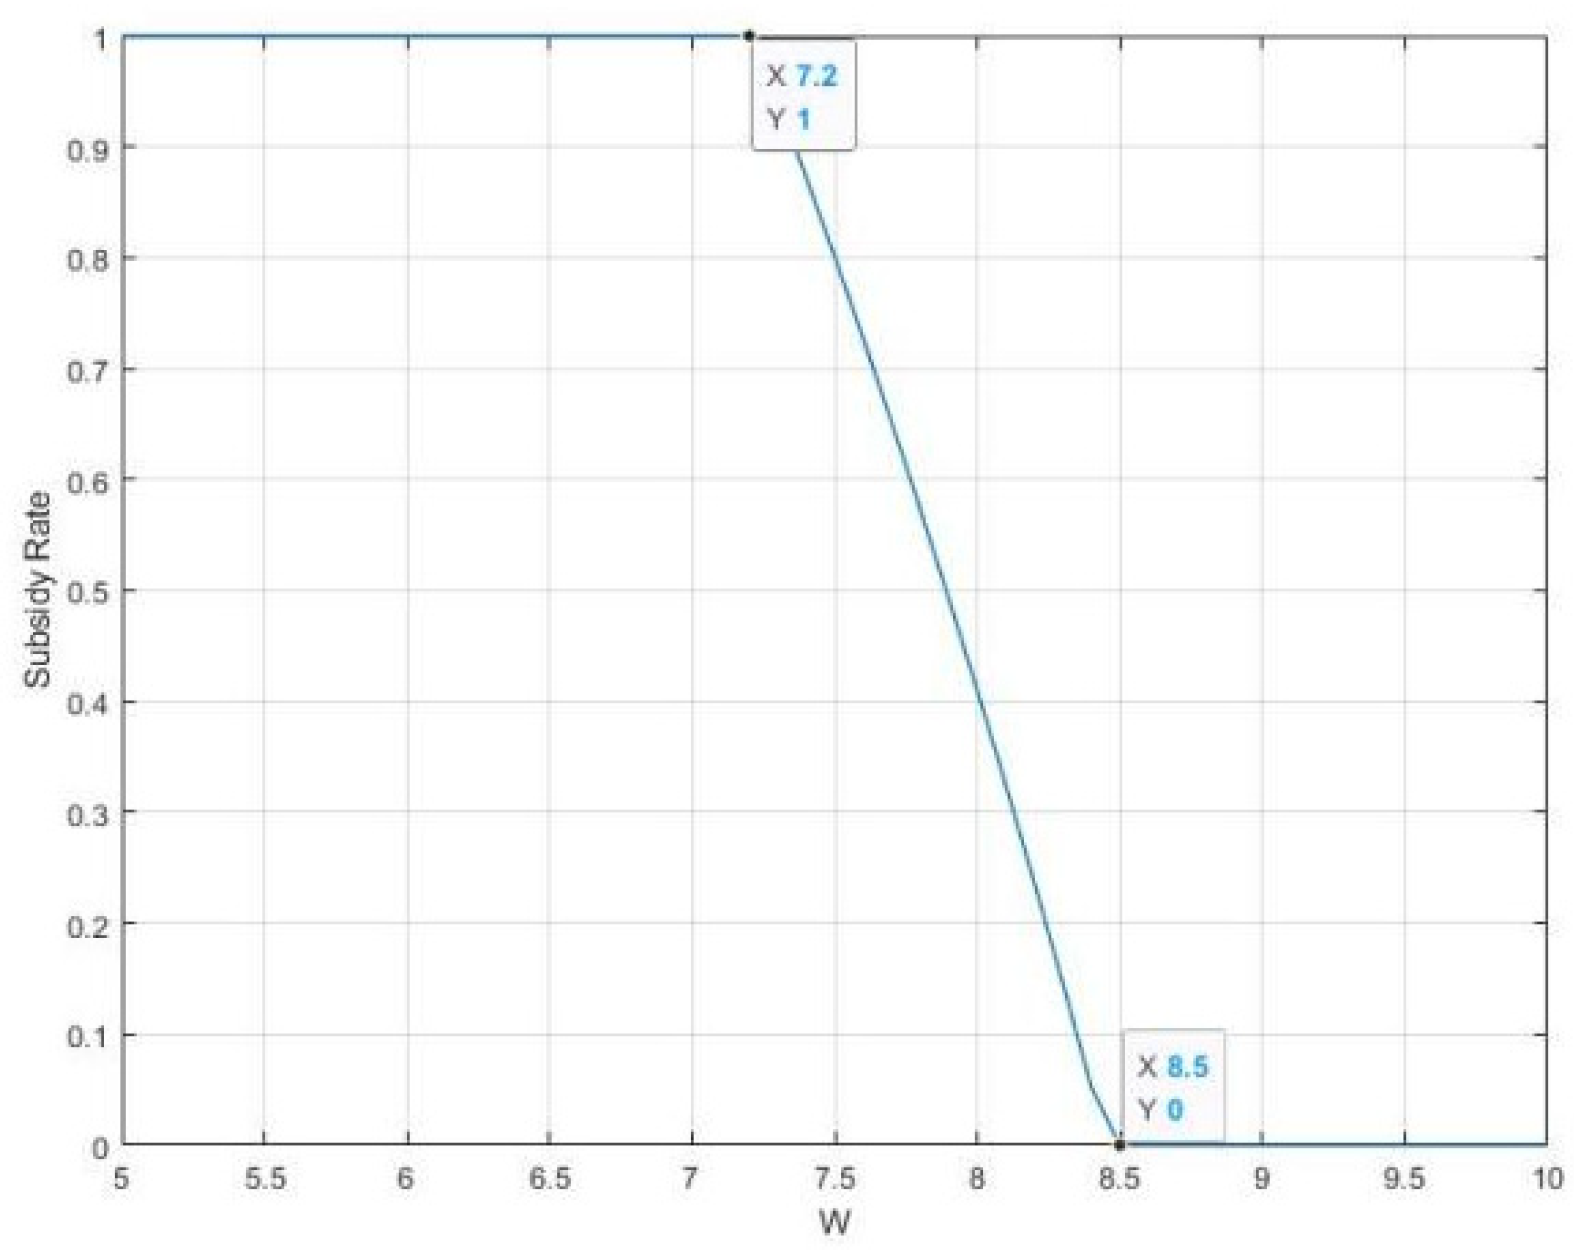
With , the other parameters remained, and w changed between (c, p), the change in the subsidy rate under different values of the profit distribution w was studied. The results are shown in Figure 10.
Figure 10 shows that the subsidy rate and the wholesale price of products ordered by the retailer decrease monotonically, while the profit margin of the retailer has a negative correlation with w. The subsidy rate, λ, is initially maintained at 1; when w = 7.2, decreases until the subsidy rate is 0 (w = 8.5). In contrast, the subsidy rate has a negative correlation with w in both cases, either with or without a carbon tax; see Figure 10.
However, in Figure 10 it can be seen that at w > c (c = 5), the subsidy rate begins to decrease. Considering both the carbon tax and the low-carbon subsidy, the subsidy rate does not decrease immediately, as it is positively affected by the carbon tax. Retailers will not immediately reduce the subsidy rate after w > c due to the impact the carbon tax has on the profit margin of the manufacturer.
- (4)
- Impact of carbon tax on member earnings.
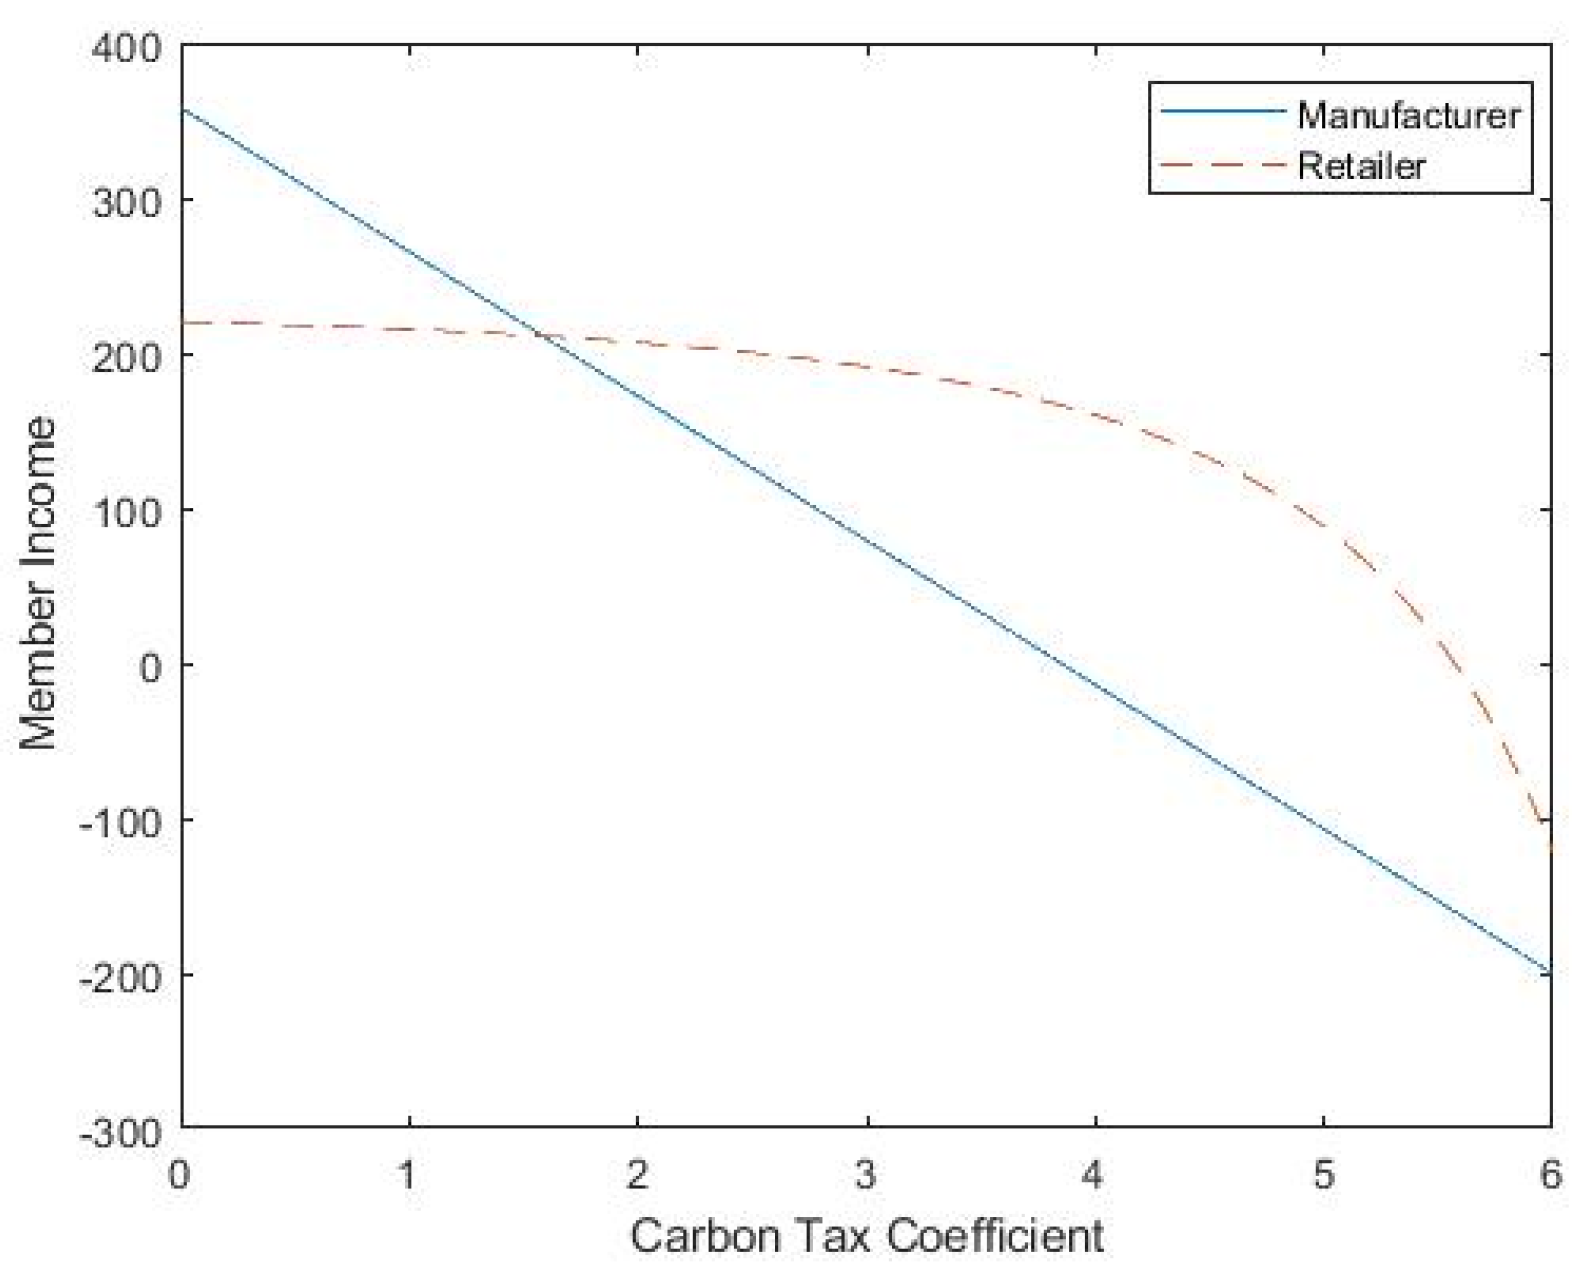
A reasonable carbon tax promotes carbon emissions reduction, and any carbon tax increases manufacturer costs; thus, manufacturers must convert the external costs of environmental pollution into internal costs. The root carbon tax has a negative correlation with manufacturer income. The impact of carbon taxes on supply chain member income was studied for different kinds of carbon taxes.
In Figure 11, it can be seen that with a combination of a carbon tax and low-carbon subsidies, retailer income initially shows a slight increase as the carbon tax coefficient increases, then has a tendency to flatten and drop suddenly, leading to manufacturer income decreasing monotonically. The earnings of the manufacturer have a negative linear relationship with the carbon tax. According to the actual situation, excessive carbon taxes increase the burden on enterprises; thus, the government must set appropriate carbon tax targets as a means of avoiding the impedance of economic development by the carbon tax.
- (5)
- Carbon reduction and member benefit analysis.
As the carbon tax coefficient, , gradually increases from 0, the different carbon tax coefficients impact the carbon emissions reduction rate and the income of manufacturers and retailers, as shown in Table 3.
Table 3 shows that under the low-carbon subsidy the carbon emissions reduction rate (0.2142) at the start of the period is higher than the optimal carbon emissions reduction rate (0.1429). With a combination of a carbon tax and low-carbon subsidies the carbon reduction rate is greatest, meaning that the carbon reduction is the highest.
The income of manufacturers decreases with the increase of the carbon tax coefficient. At the start of the period, manufacturer income is higher than with only low-carbon subsidies. In this example, at manufacturer income is ranked as follows: no subsidy < low-carbon subsidy < combined carbon tax and low-carbon subsidy. When , the manufacturer revenue sequence is as follows: no subsidy < carbon tax combined with low-carbon subsidies < low-carbon subsidies. Finally, when , the manufacturer revenue sequence is as follows: carbon tax combined with low-carbon subsidies < no subsidies < low-carbon subsidies. Therefore, whether manufacturer earnings are optimised or not is dependent on the carbon tax factor.
In summation, a combined carbon tax and subsidy policy reduces the carbon emissions of the supply chain the most. The income of retailers first increases with the increase of carbon tax coefficient, and then decreases. The income of manufacturers and retailers is determined by the value of the carbon tax coefficient
4. Discussion
(1) Carbon emissions contribute to global warming, sea-level rise, extreme weather, and natural disasters, endangering human health and the ecological environment. Carbon taxes aim to protect the environment, hoping to slow down global warming by cutting carbon dioxide emissions. The carbon tax coefficient has a negative linear relationship with manufacturer profitability, implying that the greater the carbon tax, the lower the earnings of manufacturers in the supply chain will be. Therefore, a carbon tax should take into account environmental benefits, economic efficiency, and social benefits. Carbon taxes represent effective environmental economic policy tools which can effectively reduce CO2 emissions, reduce energy consumption, change the structure of energy consumption, restrain economic growth in the short term, and benefit the healthy development of the economy in the medium and long term.
(2) As a punitive measure, carbon taxes convert the external costs of environmental pollution caused by enterprises into internal costs, which forces enterprises to reconsider their carbon emissions. As an incentive, low-carbon subsidies can encourage enterprises to innovate in low-carbon technologies and increase enthusiasm for low-carbon innovation, which can effectively reduce carbon emissions. Low-carbon technology can help manufacturers to cut carbon emissions. As consumers favor low-carbon products, market demand increases, causing retailer earnings to increase. With the optimal solution, consumer demand and retailer earnings both increase. Low-carbon subsidies are related to marginal profits, and increase together with retailer profits. With low-carbon subsidies, the carbon reduction rate has a negative correlation with the cost of low-carbon technologies. The carbon reduction rate has a positive linear relationship with the low-carbon preferences of consumers, while it has a negative correlation with the low-carbon reduction cost coefficient. The higher the low-carbon reduction cost is, the slower the decrease in the carbon reduction rate. The carbon reduction rate has a positive correlation with the subsidy rate; thus, the more subsidy rates there are, the more rapidly the carbon reduction rate increases.
(3) The carbon tax mechanism can be combined with a low-carbon subsidy policy to construct a Stackelberg game model based on retailer leadership under a linear carbon tax and is an optimal decision-making model for downstream supply chain subsidies and incentives, with member benefits as its objective function. When considering carbon taxes and low-carbon subsidies, the impact of carbon emissions on low-carbon subsidies, carbon reduction rates, and member benefits should be analysed. Manufacturers form their decisions based on carbon taxes, and retailers can make decisions based on their proportion of low-carbon subsidies. The carbon reduction rate and the carbon tax coefficient have a positive relationship. The carbon reduction rate is higher when a carbon tax and a low-carbon subsidy are combined than when a low-carbon subsidy is used alone. With the combination of a carbon tax and low-carbon subsidy, the carbon reduction rate is higher than with a low-carbon subsidy alone. Therefore, the carbon reduction rate with a combination of a carbon tax and low-carbon subsidy is the highest, as is the amount of carbon reduction.
(4) In the case of a carbon tax combined with low-carbon subsidies, manufacturer earnings have a negative association with the carbon tax coefficient, consistent with the conclusion reached with a carbon tax alone. Manufacturer earnings decrease as the carbon tax coefficient increases, while retailer earnings initially increase before decreasing as the carbon tax coefficient increases. Whether the earnings of manufacturers and retailers are optimised is dependent on the value of the carbon tax coefficient. The carbon tax coefficient has a positive linear relationship the with subsidy rate. This is the same as with only low-carbon subsidies. When a carbon tax is combined with low-carbon subsidies, the income of the party receiving the subsidy increases with the more subsidy. Subsidies are positively affected by carbon tax. The carbon reduction rate has a positive correlation with the carbon tax coefficient and as the carbon tax coefficient increases, the carbon reduction rate increases more rapidly. With a combination of a carbon tax and low-carbon subsidies, the carbon emission reduction per unit product increases as the carbon tax increases, and the rate at which carbon emission reduction increases is accelerated. As the carbon tax coefficient increases, the earnings of retailers exhibit a slight initial increase before decreasing rapidly. The earnings of manufacturers have a negative linear relationship with the carbon tax, and manufacturer earnings decrease monotonically. As excessive carbon taxes can increase the burden on companies, the government must set appropriate carbon taxes and offer low-carbon subsidies to related companies.
(5) This paper consists of theoretical research in an ideal state, and is therefore able to use microdata on different enterprises in the model in order to apply the results of theoretical research in practice. This can provide an important basis for enterprise decision-making in different industries, and has strong practical significance. At the enterprise level, carbon taxes and low-carbon subsidies affect the total cost of enterprises; in supply chain management, carbon emissions-related costs significantly affect the total profit of the supply chain. Therefore, enterprises should combine environmental benefits with economic objectives in order to optimize profits with respect to the premise of reducing carbon emissions.
5. Conclusions
In this paper, we have compared three models of supply chain decision-making, namely, a pure carbon tax policy, a pure low-carbon subsidy policy, and a combined carbon tax and low-carbon subsidy policy. We then solved the equilibrium points of these supply chain decision-making models, explored the optimal decision-making process for the supply chain, and analysed the impacts that carbon taxes, low-carbon subsidies, and their combination have on carbon emissions, member benefits, and marginal profits.
Our research has found that companies must pay a carbon tax in order to account for the environmental pollution caused by their carbon emissions. Carbon taxes increase manufacturers’ costs, leading them to convert the external costs of environmental pollution into internal costs. Governments must formulate appropriate carbon tax coefficients in order to avoid hindering economic development through excessive carbon tax rates. The low-carbon preferences of consumers can be used for the promotion of carbon emissions reduction rates. Consumer awareness of environmental protection should be cultivated in order to promote the development of a low-carbon and green consumption outlook. Appropriate subsidies should be provided to enterprises that implement low-carbon emission reductions, and larger subsidies should be provided to those with demonstrably higher carbon emissions reduction rates. The amount of the subsidy rate could be determined based on the level of the carbon emissions reduction rate.
With low-carbon subsidies, manufacturers and retailers experience higher returns than without subsidies. Whether the earnings of manufacturers and retailers are optimised is dependent on the carbon tax coefficient. The carbon tax coefficient positively affects both the carbon reduction rate and the subsidy rate. In addition, with a combined carbon tax and low-carbon subsidy policy, the amount of carbon reduction increases as the carbon tax increases and the growth rate of carbon reduction is much faster than with a carbon tax alone. Low-carbon subsidies are related to the way in which profits are distributed. The more that is earned by the subsidy party and the more subsidies there are, the greater the carbon reduction. Carbon reduction can be sorted as no subsidy < low-carbon subsidy < carbon tax combined with low-carbon subsidy.
With a combined linear carbon tax and low-carbon subsidy policy, there is a unique Nash equilibrium solution between the retailer subsidy rate and the manufacturer carbon reduction rate. Although the supply chain decision-making model under the carbon tax and low-carbon subsidy policy is optimal, and imposing a carbon tax is conducive to the ecological environment, retailer income first increases slightly as the carbon tax coefficient increases before declining rapidly. Manufacturer income has a negative linear relationship with the carbon tax, and an excessive carbon tax increases the burden on companies. Therefore, governments must establish reasonable standards for carbon tax collection while offering moderate low-carbon subsidies while collecting carbon taxes as a means of optimizing social welfare. Our results provide clear and meaningful information for supply chain decision-makers and other stakeholders in the low-carbon economy.
This paper is based on the requirements of low-carbon supply chain management, that is, maximizing environmental and economic benefits, enabling node enterprises to spontaneously move to low-carbon production, and linking supply chains to promote transformation towards low-carbon and efficient activity integration. Although the purpose of enterprise profit, enterprise need to bear certain social responsibilities. Enterprises can use the required carbon emission reduction cost according to the optimal decision-making model in this study in order to achieve carbon emissions reduction targets while continuing to establish profits. Carbon taxes are an effective environmental and economic policy tool for reducing carbon dioxide emissions; however, because an excessive carbon tax inhibits economic growth in the short term, it is necessary to set a reasonable carbon tax coefficient for carbon tax collection while offering moderate low-carbon subsidies at the same time in order to ensure that policy is conducive to the healthy development of the economy in the medium and long term, which is one of the important practical goals of this paper. Furthermore, supply chain enterprises can use the optimal decision-making model provided herein to calculate the relationship between consumer preferences and low-carbon subsidies, carbon emissions, and member benefits, and use this as a basis for allocating production or sales of low-carbon products and non-low-carbon products, another important practical application of this study. The purpose of this research is to help enterprises to realize the development of low-carbon supply chains and to maximize both environmental and economic benefits, with the goal of taking environmental protection into account while realizing the sustainable economic development of the supply chain.
Author Contributions
Conceptualization, H.W. and Y.S. (Yaxin Sun); methodology, H.W.; software, H.W. and M.C.; validation, H.W., Y.S. (Yutong Su) and M.C.; formal analysis, H.W., M.C., Y.S. (Yaxin Sun); investigation, H.W. and Y.S. (Yaxin Sun); resources, H.W. and Y.S. (Yaxin Sun); data curation, H.W. and Y.S. (Yaxin Sun); writing—original draft preparation, H.W. and M.C.; writing—review and editing, H.W., Y.S. (Yutong Su) and M.C.; visualization, Y.S. (Yaxin Sun); supervision, H.Z.; modification, H.Z. and Q.L.; project administration, M.C.; funding acquisition, M.C. All authors have read and agreed to the published version of the manuscript.
Funding
This research was funded by the National Social Science Foundation of China (Grant No. 18bjl069); Shandong Social Science Planning Project, China (Grant No. 21CJJJ17, 21BZBJ15): Shandong natural science foundation project, China (ZR2020mg008); Shandong Provincial Key Financial Application Research Project; and 2022 Project on Social Science Planning Research in Qingdao; The National Social Science Fund of China (18BJL069); Humanities and Social Science Projects of the Ministry of Education of China (19YJAZH020).
Data Availability Statement
Not applicable.
Acknowledgments
Special thanks to those who participated in the writing of this paper.
Conflicts of Interest
The authors declare no conflict of interest.
References
- Ding, S.T.; Zhang, M.; Song, M.; Song, Y. Exploring China’s carbon emissions peak for different carbon tax scenarios. Energy Policy 2019, 129, 1245–1252. [Google Scholar] [CrossRef]
- Tang, W.G.; Li, H.T.; Chen, J. Optimizing carbon taxation target and level: Enterprises, consumers, or both? J. Clean. Prod. 2021, 282, 124515. [Google Scholar] [CrossRef]
- Chang, N.; Han, C.H. Cost-push impact of taxing carbon in China: A price transmission perspective. J. Clean. Prod. 2020, 248, 119194. [Google Scholar] [CrossRef]
- Wang, M.Y.; Li, Y.M.; Li, M.M.; Shi, W.Q.; Quan, S.P. Will carbon tax affect the strategy and performance of low-carbon tech nology sharing between enterprises? J. Clean. Prod. 2019, 210, 724–737. [Google Scholar] [CrossRef]
- Yu, X.; Xu, Y.; Sun, M.; Zhang, Y. The Green-Innovation-Inducing Effect of a Unit Progressive Carbon Tax. Sustainability 2021, 13, 11708. [Google Scholar] [CrossRef]
- Wang, J.; Huang, X. The Optimal Carbon Reduction and Return Strategies under Carbon Tax Policy. Sustainability 2018, 10, 2471. [Google Scholar] [CrossRef] [Green Version]
- Tian, Y.; Ma, J.H.; Wang, Z.X.; Xie, L. Complexity and Control of Multichannel Supply Chain Under Carbon Tax Policy. Int. J. Bifurc. Chaos 2021, 31, 2150092. [Google Scholar] [CrossRef]
- Hu, Z.H.; Wang, S.W. An Evolutionary Game Model Between Governments and Manufacturers Considering Carbon Taxes, Subsidies, and Consumers’ low-carbon Preference. Dyn. Games Appl. 2022, 12, 513–551. [Google Scholar] [CrossRef]
- Wang, W.; Wang, Y.; Zhang, X.; Zhang, D. Effects of Government Subsidies on Production and Emissions Reduction Decisions under Carbon Tax Regulation and Consumer low-carbon Awareness. Int. J. Environ. Res. Public Health 2021, 18, 10959. [Google Scholar] [CrossRef]
- Zhang, S.Y.; Wang, C.X.; Panos, M.P. Co-evolutionary game of manufacturers’ abatement behavior under carbon tax-subsidy policy. Int. J. Low Carbon Technol. 2021, 16, 1217–1228. [Google Scholar] [CrossRef]
- Yi, Y.Y.; Li, J.X. The effect of governmental policies of carbon taxes and energy-saving subsidies on enterprise decisions in a two-echelon supply chain. J. Clean. Prod. 2018, 181, 675–691. [Google Scholar]
- Du, S.F.; Zhu, J.A.; Jiao, H.F. Game-theoretical analysis for supply chain with consumer preference to low-carbon. Int. J. Prod. Res. 2015, 53, 3753–3768. [Google Scholar] [CrossRef]
- Liu, M.L.; Li, Z.H.; Anwar, S.; Zhang, Y. Supply chain carbon emission reductions and coordination when consumers have a strong preference for low-carbon products. Environ. Sci. Pollut. Res. 2021, 28, 19969–19983. [Google Scholar] [CrossRef] [PubMed]
- Wu, D.; Yang, Y. The low-carbon Supply Chain Coordination Problem with Consumers’ low-carbon Preference. Sustainability 2020, 12, 3591. [Google Scholar] [CrossRef]
- Sun, L.C.; Cao, X.X.; Majed, A.; Zhang, J.J.; Farhad, T.-H.; Muhammad, M. Carbon emission transfer strategies in supply chain with lag time of emission reduction technologies and low-carbon preference of consumers. J. Clean. Prod. 2020, 264, 121664. [Google Scholar] [CrossRef]
- Xie, J.P.; Li, J.; Liang, L.; Fang, X.; Yang, G.; Wei, L.H. Contracting Emissions Reduction Supply Chain Based on Market low-carbon Preference and Carbon Intensity Constraint. Asia Pac. J. Oper. Research 2020, 37, 2050003. [Google Scholar] [CrossRef]
- Ji, J.N.; Zhang, Z.Y.; Yang, L. Carbon emission reduction decisions in the retail-/dual-channel supply chain with consumers’ preference. J. Clean. Prod. 2017, 141, 852–867. [Google Scholar] [CrossRef]
- Santanu, K.G.; Mijanur, R.S.; Milan, C. Analyzing a stochastic dual-channel supply chain under consumers’ low-carbon preferences and cap-and-trade regulation. Comput. Ind. Eng. 2020, 149, 106765. [Google Scholar]
- Chen, X.; Zhang, H.; Zhang, M.; Chen, J. Optimal decisions in a retailer Stackelberg supply chain. Int. J. Prod. Econ. 2017, 187, 260–270. [Google Scholar] [CrossRef]
- Fang, D.; Ren, Q. Optimal Decision in a Dual-Channel Supply Chain under Potential Information Leakage. Symmetry 2019, 11, 308. [Google Scholar] [CrossRef] [Green Version]
- Luo, Y.; Wei, Q.; Ling, Q.H.; Huo, B.F. Optimal decision in a green supply chain: Bank financing or supplier financing. J. Clean. Prod. 2020, 271, 122090. [Google Scholar] [CrossRef]
- Su, C.; Liu, X.; Du, W. Green Supply Chain Decisions Considering Consumers’ low-carbon Awareness under Different Government Subsidies. Sustainability 2020, 12, 2281. [Google Scholar] [CrossRef] [Green Version]
- Wu, Y.; Wang, J.; Chen, L. Optimization and Decision of Supply Chain Considering Negative Spillover Effect and Service Competition. Sustainability 2021, 13, 2320. [Google Scholar] [CrossRef]
- Ke, H.; Wu, Y.; Huang, H.; Chen, Z.Y. Optimal pricing decisions for a closed-loop supply chain with retail competition under fuzziness. Orig. Artic. 2018, 69, 1468–1482. [Google Scholar] [CrossRef]
- Cao, Q.N.; Tang, Y.Z.; Perera, S.; Zhang, J.Q. Manufacturer- versus retailer-initiated bundling: Implications for the supply chain. Transp. Res. Part E Logist. Transp. Rev. 2022, 157, 102552. [Google Scholar] [CrossRef]
- Vipin, B.; Amit, R.K. Whole sale price versus buyback: A comparison of contracts in a supply chain with a behavioral retailer. Comput. Ind. Eng. 2021, 162, 107689. [Google Scholar] [CrossRef]
- Zhao, X.; Niu, T. Impacts of horizontal mergers on dual-channel supply chain. J. Ind. Manag. Optim. 2022, 18, 655–680. [Google Scholar] [CrossRef]
- Lou, Y.Q.; Feng, L.P.; He, S.G.; He, Z.; Zhao, X.K. Logistics service outsourcing choices in a retailer-led supply chain. Transp. Res. Part E Logist. Transp. Rev. 2020, 141, 101944. [Google Scholar] [CrossRef]
- Yang, L.; Ji, J.N.; Wang, M.Z.; Wang, Z.Z. The manufacturer’s joint decisions of channel selections and carbon emission reductions under the cap-and-trade regulation. J. Clean. Prod. 2018, 193, 506–523. [Google Scholar] [CrossRef]
- Wang, Y.J.; Chen, W.D.; Liu, B.Y. Manufacturing/remanufacturing decisions for a capital-constrained manufacturer considering carbon emission cap and trade. J. Clean. Prod. 2017, 140, 1118–1128. [Google Scholar] [CrossRef]
- Fukui, H.; Miyoshi, C. The impact of aviation fuel tax on fuel consumption and carbon emissions: The case of the US airline industry. Transp. Res. Part D Transp. Environ. 2017, 50, 234–253. [Google Scholar] [CrossRef] [Green Version]
- Reanos, M.A.T.; Lynch, M.A. Measuring carbon tax incidence using a fully flexible demand system. Vertical and horizontal effects using Irish data. Energy Policy 2022, 160, 112682. [Google Scholar] [CrossRef]
- Wei, S.D. A sequential game analysis on carbon tax policy choices in open economies: From the perspective of carbon emission responsibilities. J. Clean. Prod. 2021, 283, 124588. [Google Scholar] [CrossRef]
- Zhai, M.Y.; Huang, G.H.; Liu, L.R.; Guo, Z.Q.; Su, S. Segmented carbon tax may significantly affect the regional and national economy and environment-a CGE-based analysis for Guangdong Province. Energy 2021, 231, 120958. [Google Scholar] [CrossRef]
- Xia, L.J.; Hao, W.Q.; Qin, J.J.; Ji, F.; Yue, X.H. Carbon emission reduction and promotion policies considering social preferences and consumers’ low-carbon awareness in the cap-and-trade system. J. Clean. Prod. 2018, 195, 1105–1124. [Google Scholar] [CrossRef]
- Pan, X.Y.; Pan, X.F.; Wu, X.H.; Jiang, L.; Guo, S.C.; Feng, X.H. Research on the heterogeneous impact of carbon emission reduction policy on R&D investment intensity: From the perspective of enterprise’s ownership structure. J. Clean. Prod. 2021, 328, 129532. [Google Scholar]
- Yu, J.J.; Shi, W.J.; Fang, Y.L. Optimization of carbon emission reduction paths in the low-carbon power dispatching process. Renew. Energy 2022, 188, 425–436. [Google Scholar]
- Yu, J.J.; Shi, W.J.; Fang, Y.L. Construction of low-carbon Supply Chain Profit Model Considering Consumer Preference. Procedia CIRP 2019, 83, 690–693. [Google Scholar] [CrossRef]
- Wang, Y.J.; Wang, F. Production and emissions reduction decisions considering the differentiated carbon tax regulation across new and remanufactured products and consumer preference. Urban Clim. 2021, 40, 100992. [Google Scholar] [CrossRef]
- Li, X.Y. Local government decision-making competition and regional carbon emissions: Experience evidence and emission reduction measures. Sustain. Energy Technol. Assess. 2022, 50, 101800. [Google Scholar] [CrossRef]
- He, S.Y.; Yin, J.H.; Zhang, B.; Wang, Z.H. How to upgrade an enterprise’s low-carbon technologies under a carbon tax: The trade-off between tax and upgrade fee. Appl. Energy 2018, 227, 564–573. [Google Scholar] [CrossRef]
- Deng, Y.L.; You, D.M.; Zhang, Y. Research on improvement strategies for low-carbon technology innovation based on a differential game: The perspective of tax competition. Sustain. Prod. Consum. 2021, 26, 1046–1061. [Google Scholar] [CrossRef]
- Zhou, D.Q.; An, Y.F.; Zha, D.L.; Wu, F.; Wang, Q.W. Would an increasing block carbon tax be better? A comparative study within the Stackelberg Game framework. J. Environ. Manag. 2019, 235, 328–341. [Google Scholar] [CrossRef] [PubMed]
- Yu, P. Carbon tax/subsidy policy choice and its effects in the presence of interest groups. Energy Policy 2020, 147, 111886. [Google Scholar] [CrossRef]
- Xu, C.Y.; Wang, C.X.; Huang, R. I mpacts of horizontal integration on social welfare under the interaction of carbon tax and green subsidies. Int. J. Prod. Econ. 2020, 222, 107506. [Google Scholar] [CrossRef]
Figure 1.
The effect of the carbon tax coefficient on manufacturer earnings.

Figure 2.
The impact of emissions reduction rate on member income.

Figure 3.
The effect of wholesale price on subsidy rate.

Figure 4.
The impact of consumer low-carbon preferences on emissions reduction rate.

Figure 5.
The effect of the low-carbon emissions reduction coefficient on emissions reduction rate.

Figure 6.
The impact of subsidy rate on emissions reduction rate.

Figure 7.
The impact of subsidy rate on member income.

Figure 8.
The effect of carbon tax coefficient on subsidy rate.

Figure 9.
The effect of the carbon tax coefficient on the emissions reduction rate.

Figure 10.
The impact of wholesale prices on subsidy rates.

Figure 11.
The effect of the carbon tax coefficient on member income.


Table 1.
Parameter description.
| Parameter | Parameter Interpretation |
|---|---|
| w | Wholesale price of products ordered by retailers |
| p | Price a customer pays for the product |
| c | Cost per unit product produced by the manufacturer |
| d | Market demand |
| Earnings of manufacturers and retailers | |
| e | Carbon emissions per unit product produced by the manufacturer |
| Linear carbon tax coefficient | |
| t | Carbon tax levied on enterprises by the government |
| λ | Subsidy rate |
Table 2.
The values of various parameters under decision equilibrium.
| No Low-Carbon Subsidies | Low-Carbon Subsidies | |
|---|---|---|
| Optimal subsidy rate | — | 0.1429 |
| Carbon reduction rate | 0.1833 | 0.2139 |
| Manufacturer’s revenue | 330.2500 | 335.2934 |
| Retailer revenue | 240.326 | 241.1736 |
Table 3.
The impact of the carbon tax coefficient on the emissions reduction rate and member income.
Table 3.
The impact of the carbon tax coefficient on the emissions reduction rate and member income.
| η | Carbon Reduction Rate | Manufacturer’s Revenue | Retailer Revenue |
|---|---|---|---|
| 0.01 | 0.2142 | 336.6795 | 238.8605 |
| 0.02 | 0.2144 | 335.7147 | 238.9002 |
| 0.03 | 0.2147 | 334.7500 | 238.9400 |
| 0.04 | 0.2150 | 333.7855 | 238.9800 |
| 0.05 | 0.2153 | 332.8210 | 239.0200 |
| 0.06 | 0.2156 | 331.8567 | 239.0602 |
| 0.07 | 0.2158 | 330.8924 | 239.1004 |
| 0.08 | 0.2161 | 329.9283 | 239.1407 |
| 0.09 | 0.2164 | 328.9644 | 239.1812 |
| …… | …… | …… | …… |
| 0.34 | 0.2238 | 304.9051 | 240.2270 |
| 0.35 | 0.2242 | 303.9444 | 240.2702 |
| 0.36 | 0.2245 | 302.9838 | 240.3136 |
| 0.37 | 0.2248 | 302.0234 | 240.3571 |
| 0.38 | 0.2251 | 301.0631 | 240.4007 |
| …… | …… | …… | …… |
| 0.54 | 0.2303 | 285.7177 | 241.1141 |
| 0.55 | 0.2306 | 284.7598 | 241.1597 |
| 0.56 | 0.2309 | 283.8021 | 241.2054 |
| 0.57 | 0.2313 | 282.8445 | 241.2513 |
| …… | …… | …… | …… |
| 4.31 | 0.6046 | −47.4272 | 267.2147 |
| 4.32 | 0.6076 | −48.1153 | 267.2200 |
| 4.33 | 0.6106 | −48.8006 | 267.2222 |
| 4.34 | 0.6137 | −49.4833 | 267.2210 |
| …… | …… | …… | …… |
| 5.07 | 0.9809 | −89.1959 | 242.6019 |
| 5.08 | 0.9893 | −89.5556 | 241.4796 |
| 5.09 | 0.9978 | −89.9091 | 240.7563 |
| 5.10 | 1.0064 | −90.2563 | 240.3264 |
| 5.11 | 1.0152 | −90.5974 | 237.8303 |
| …… | …… | …… | …… |
Publisher’s Note: MDPI stays neutral with regard to jurisdictional claims in published maps and institutional affiliations. |
© 2022 by the authors. Licensee MDPI, Basel, Switzerland. This article is an open access article distributed under the terms and conditions of the Creative Commons Attribution (CC BY) license (https://creativecommons.org/licenses/by/4.0/).
Share and Cite
MDPI and ACS Style
Wu, H.; Sun, Y.; Su, Y.; Chen, M.; Zhao, H.; Li, Q. Which Is the Best Supply Chain Policy: Carbon Tax, or a Low-Carbon Subsidy? Sustainability 2022, 14, 6312. https://0-doi-org.brum.beds.ac.uk/10.3390/su14106312
AMA Style
Wu H, Sun Y, Su Y, Chen M, Zhao H, Li Q. Which Is the Best Supply Chain Policy: Carbon Tax, or a Low-Carbon Subsidy? Sustainability. 2022; 14(10):6312. https://0-doi-org.brum.beds.ac.uk/10.3390/su14106312
Chicago/Turabian StyleWu, Hanbo, Yaxin Sun, Yutong Su, Ming Chen, Hongxia Zhao, and Qi Li. 2022. "Which Is the Best Supply Chain Policy: Carbon Tax, or a Low-Carbon Subsidy?" Sustainability 14, no. 10: 6312. https://0-doi-org.brum.beds.ac.uk/10.3390/su14106312
Note that from the first issue of 2016, this journal uses article numbers instead of page numbers. See further details here.