
Towards Sustainable Road Safety in Saudi Arabia: Exploring Traffic Accident Causes Associated with Driving Behavior Using a Bayesian Belief Network


Abstract
:1. Introduction
Literature Review
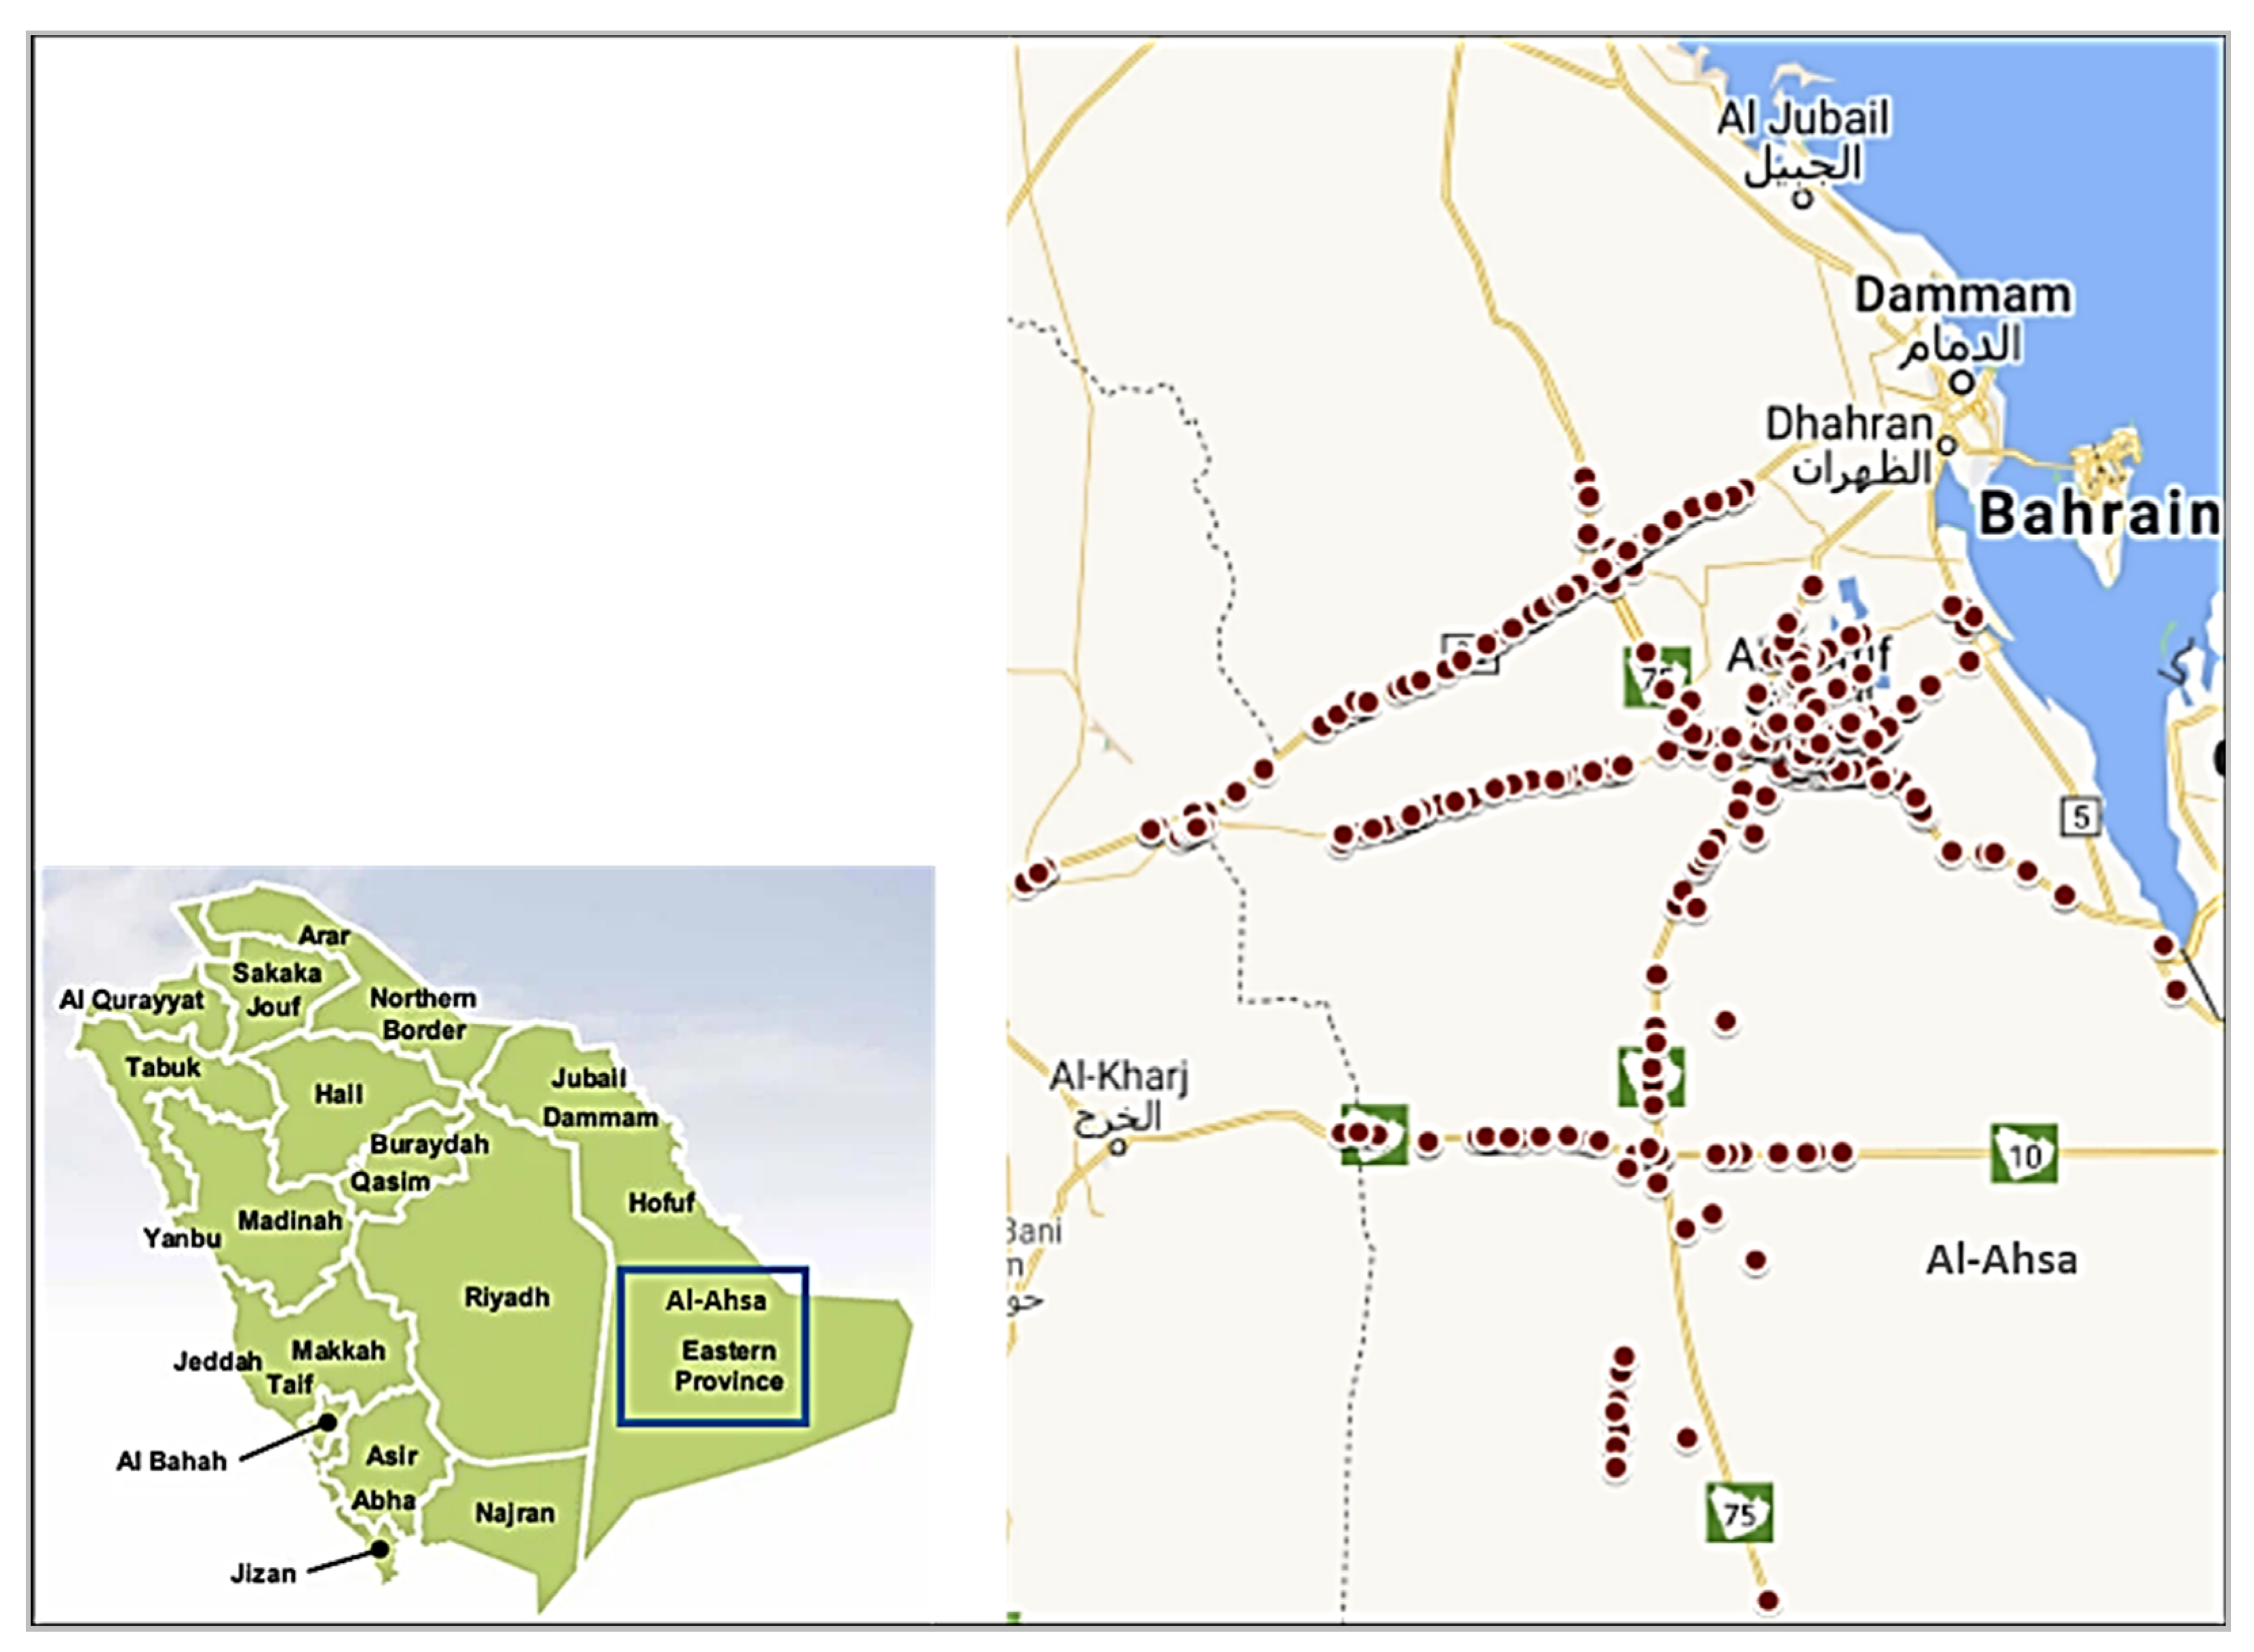
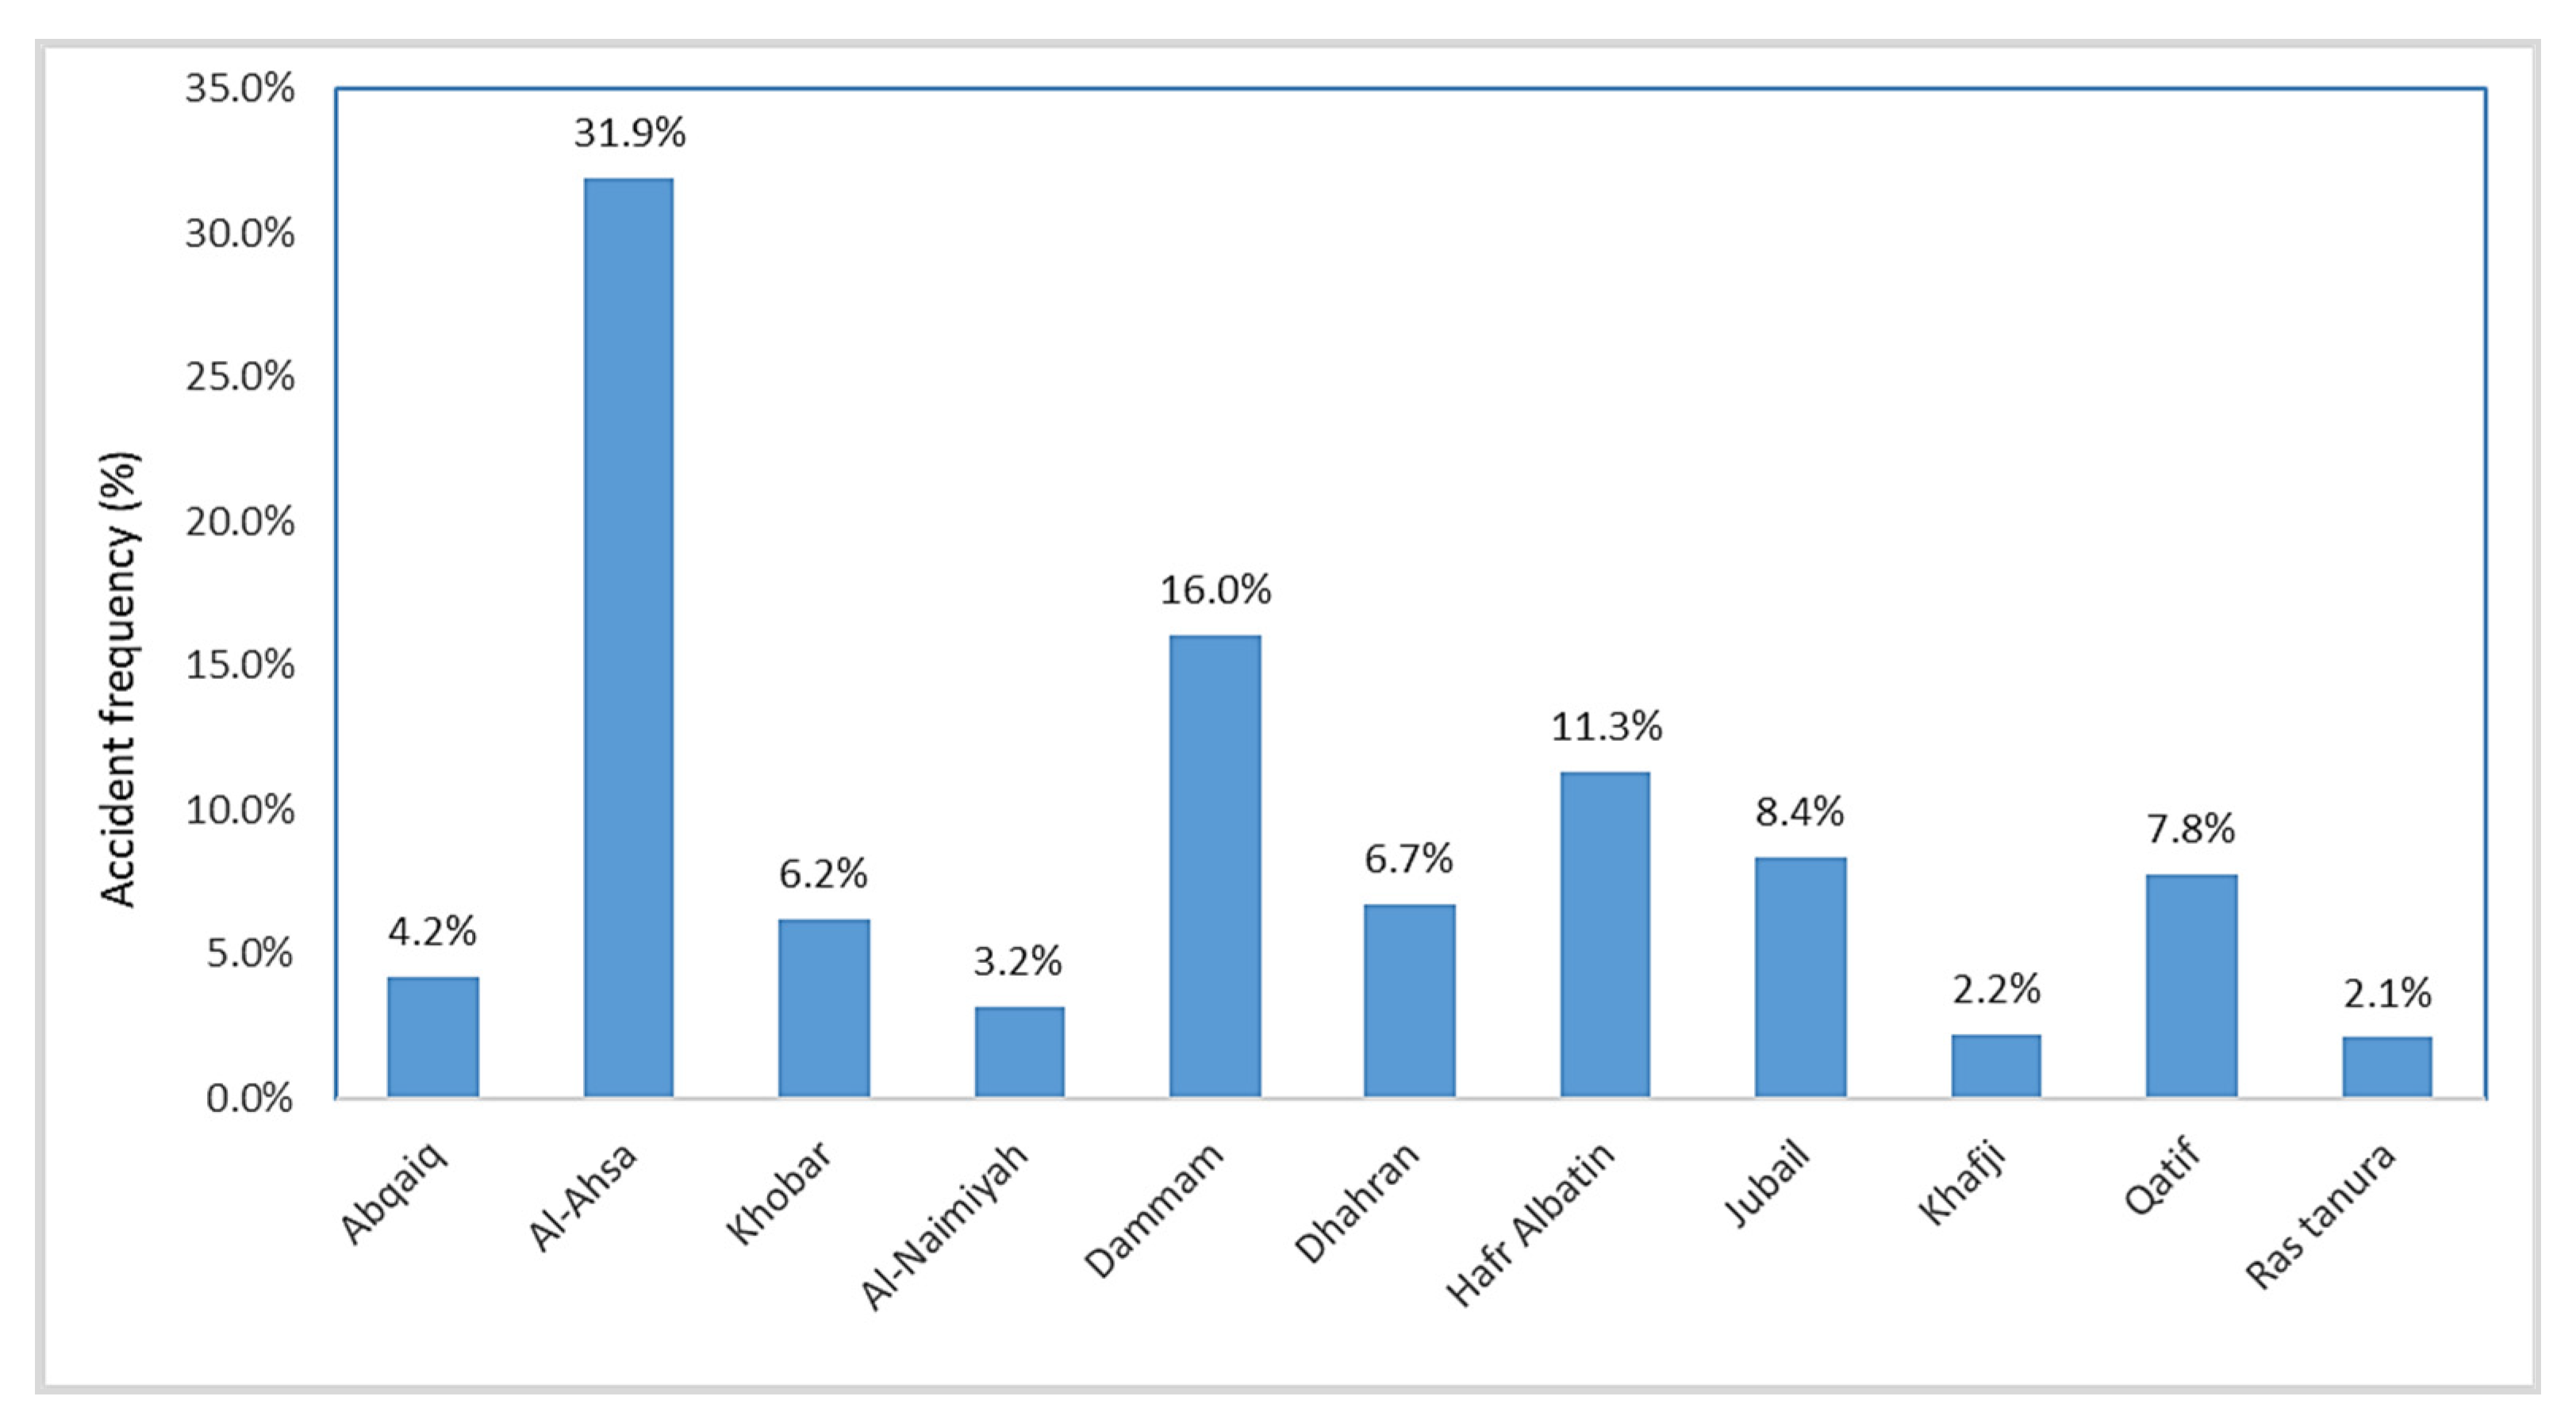
2. Case Study Area and Data Sources
3. BBN Model
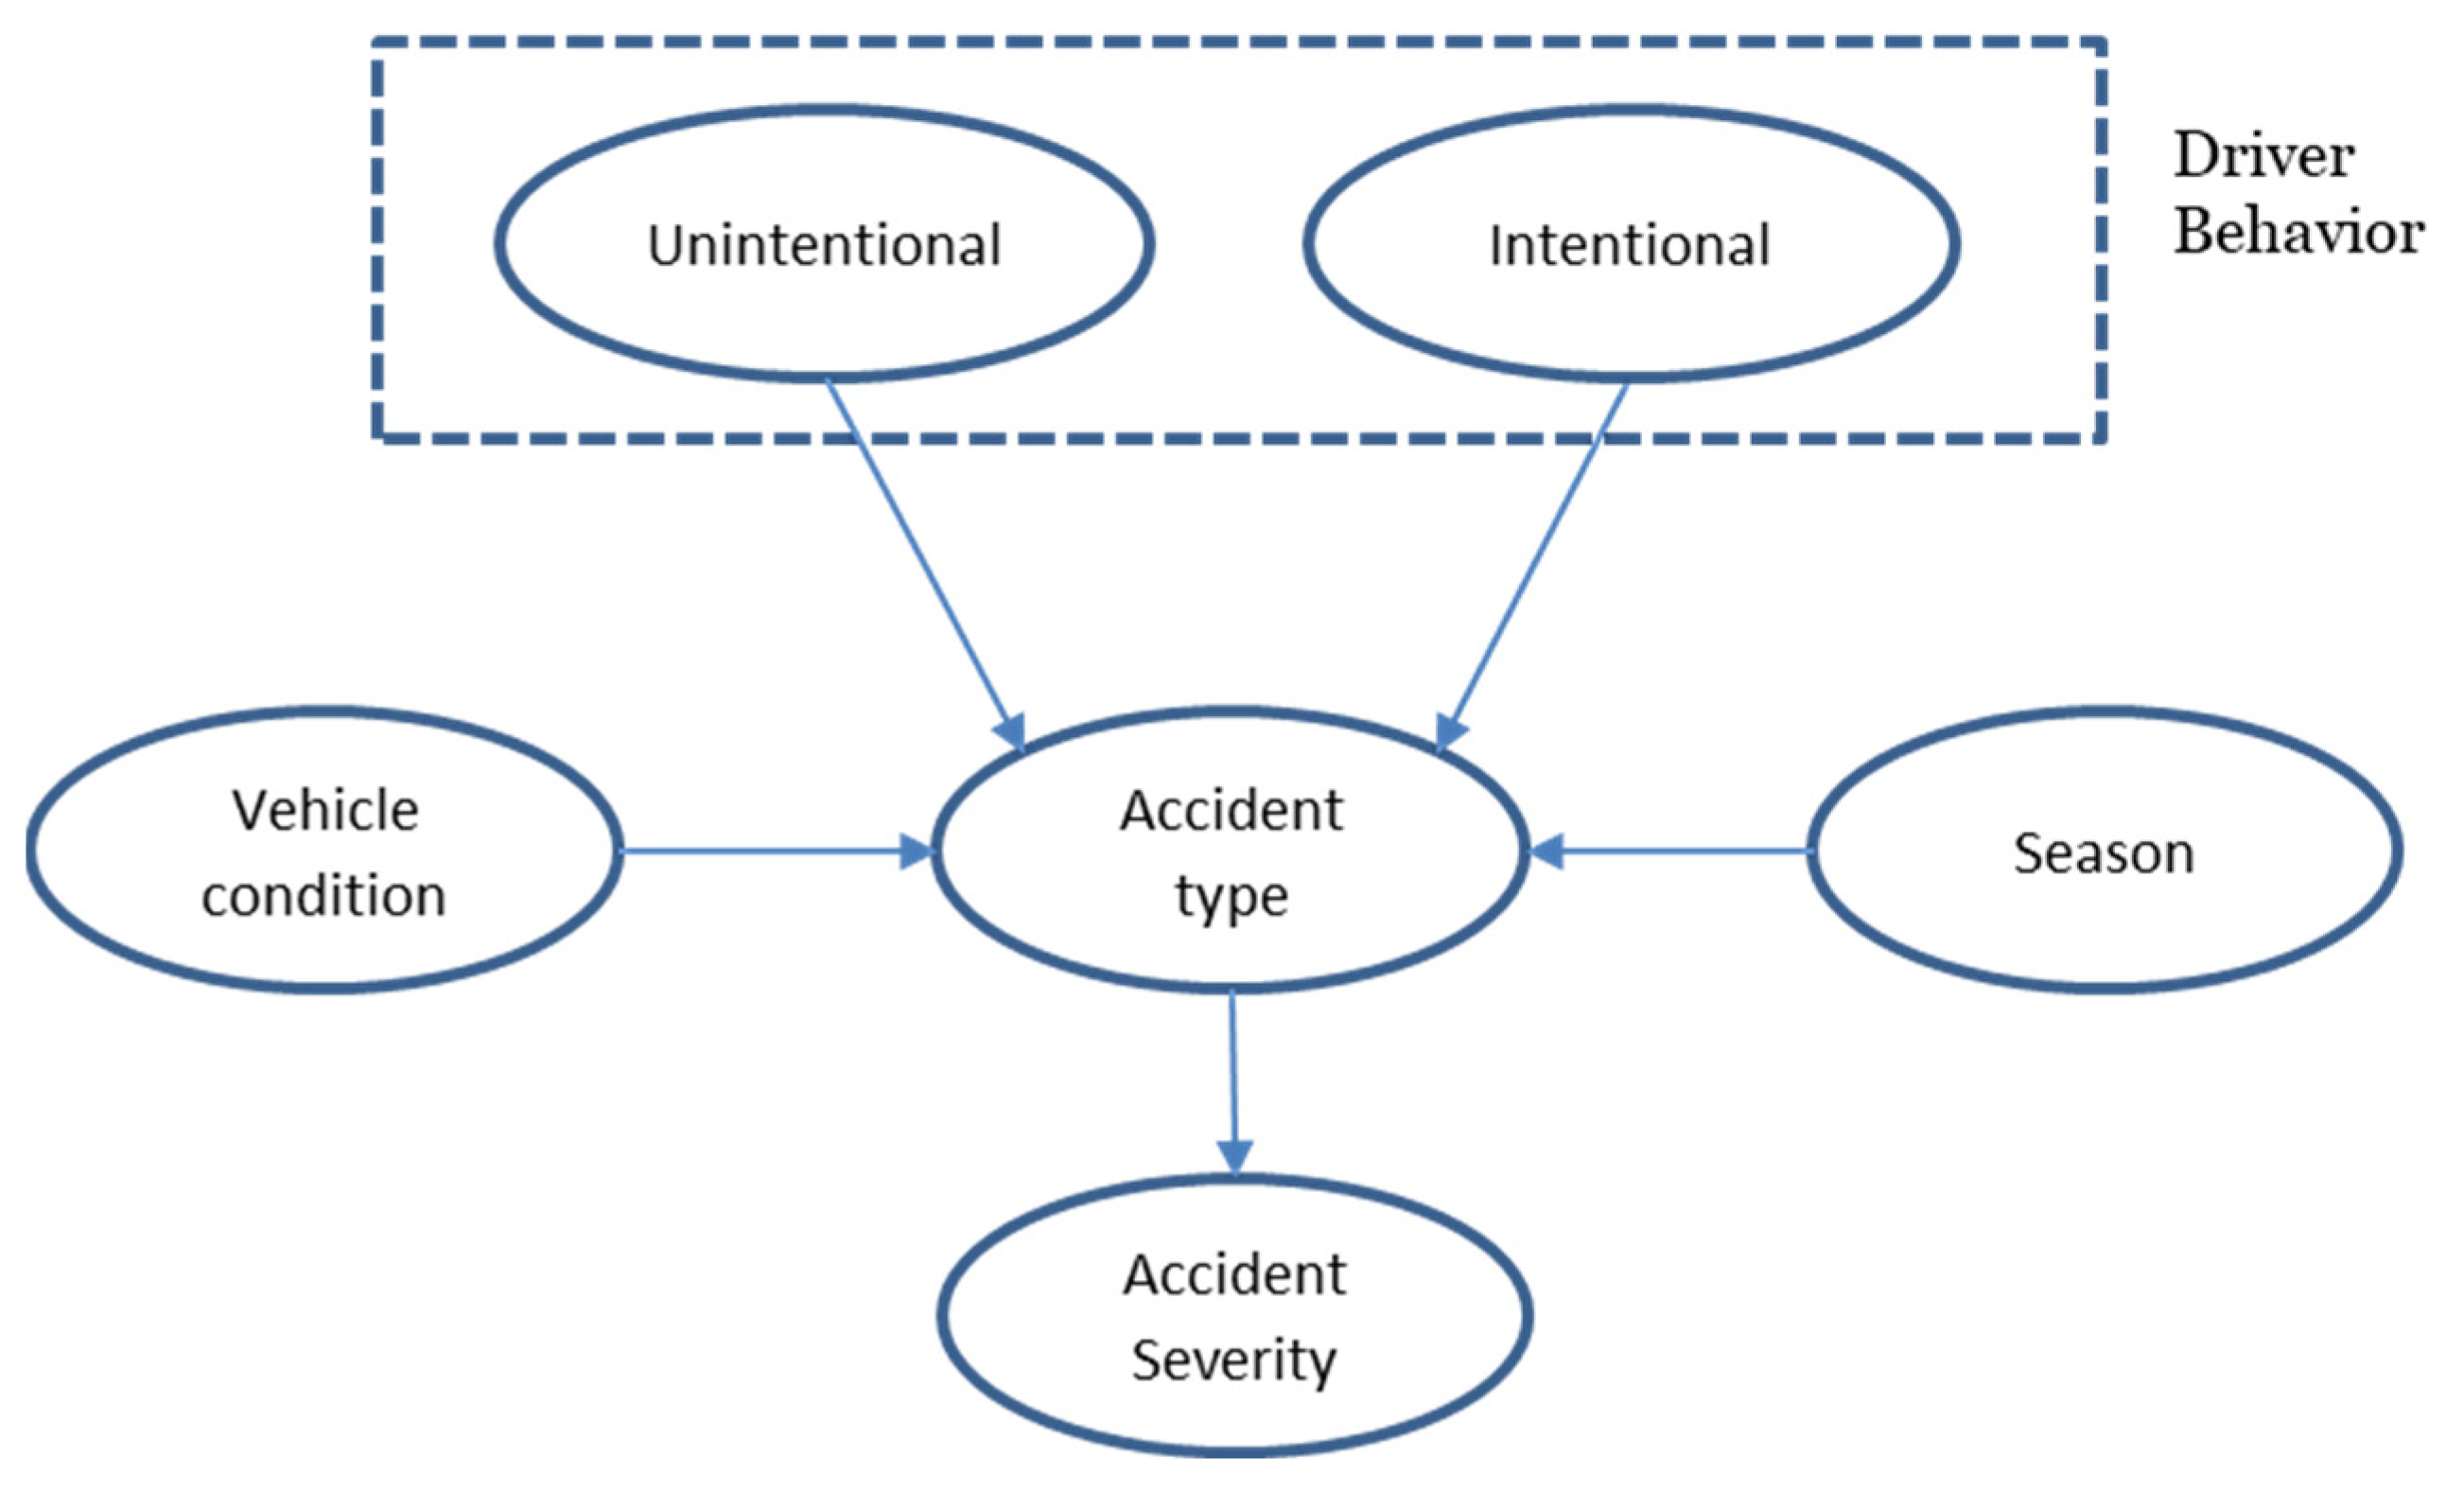
4. Proposed Model Development
Variables (Parent and Child)
5. Results and Discussion
5.1. Model Calibration and Validation
5.1.1. Sensitivity Analysis
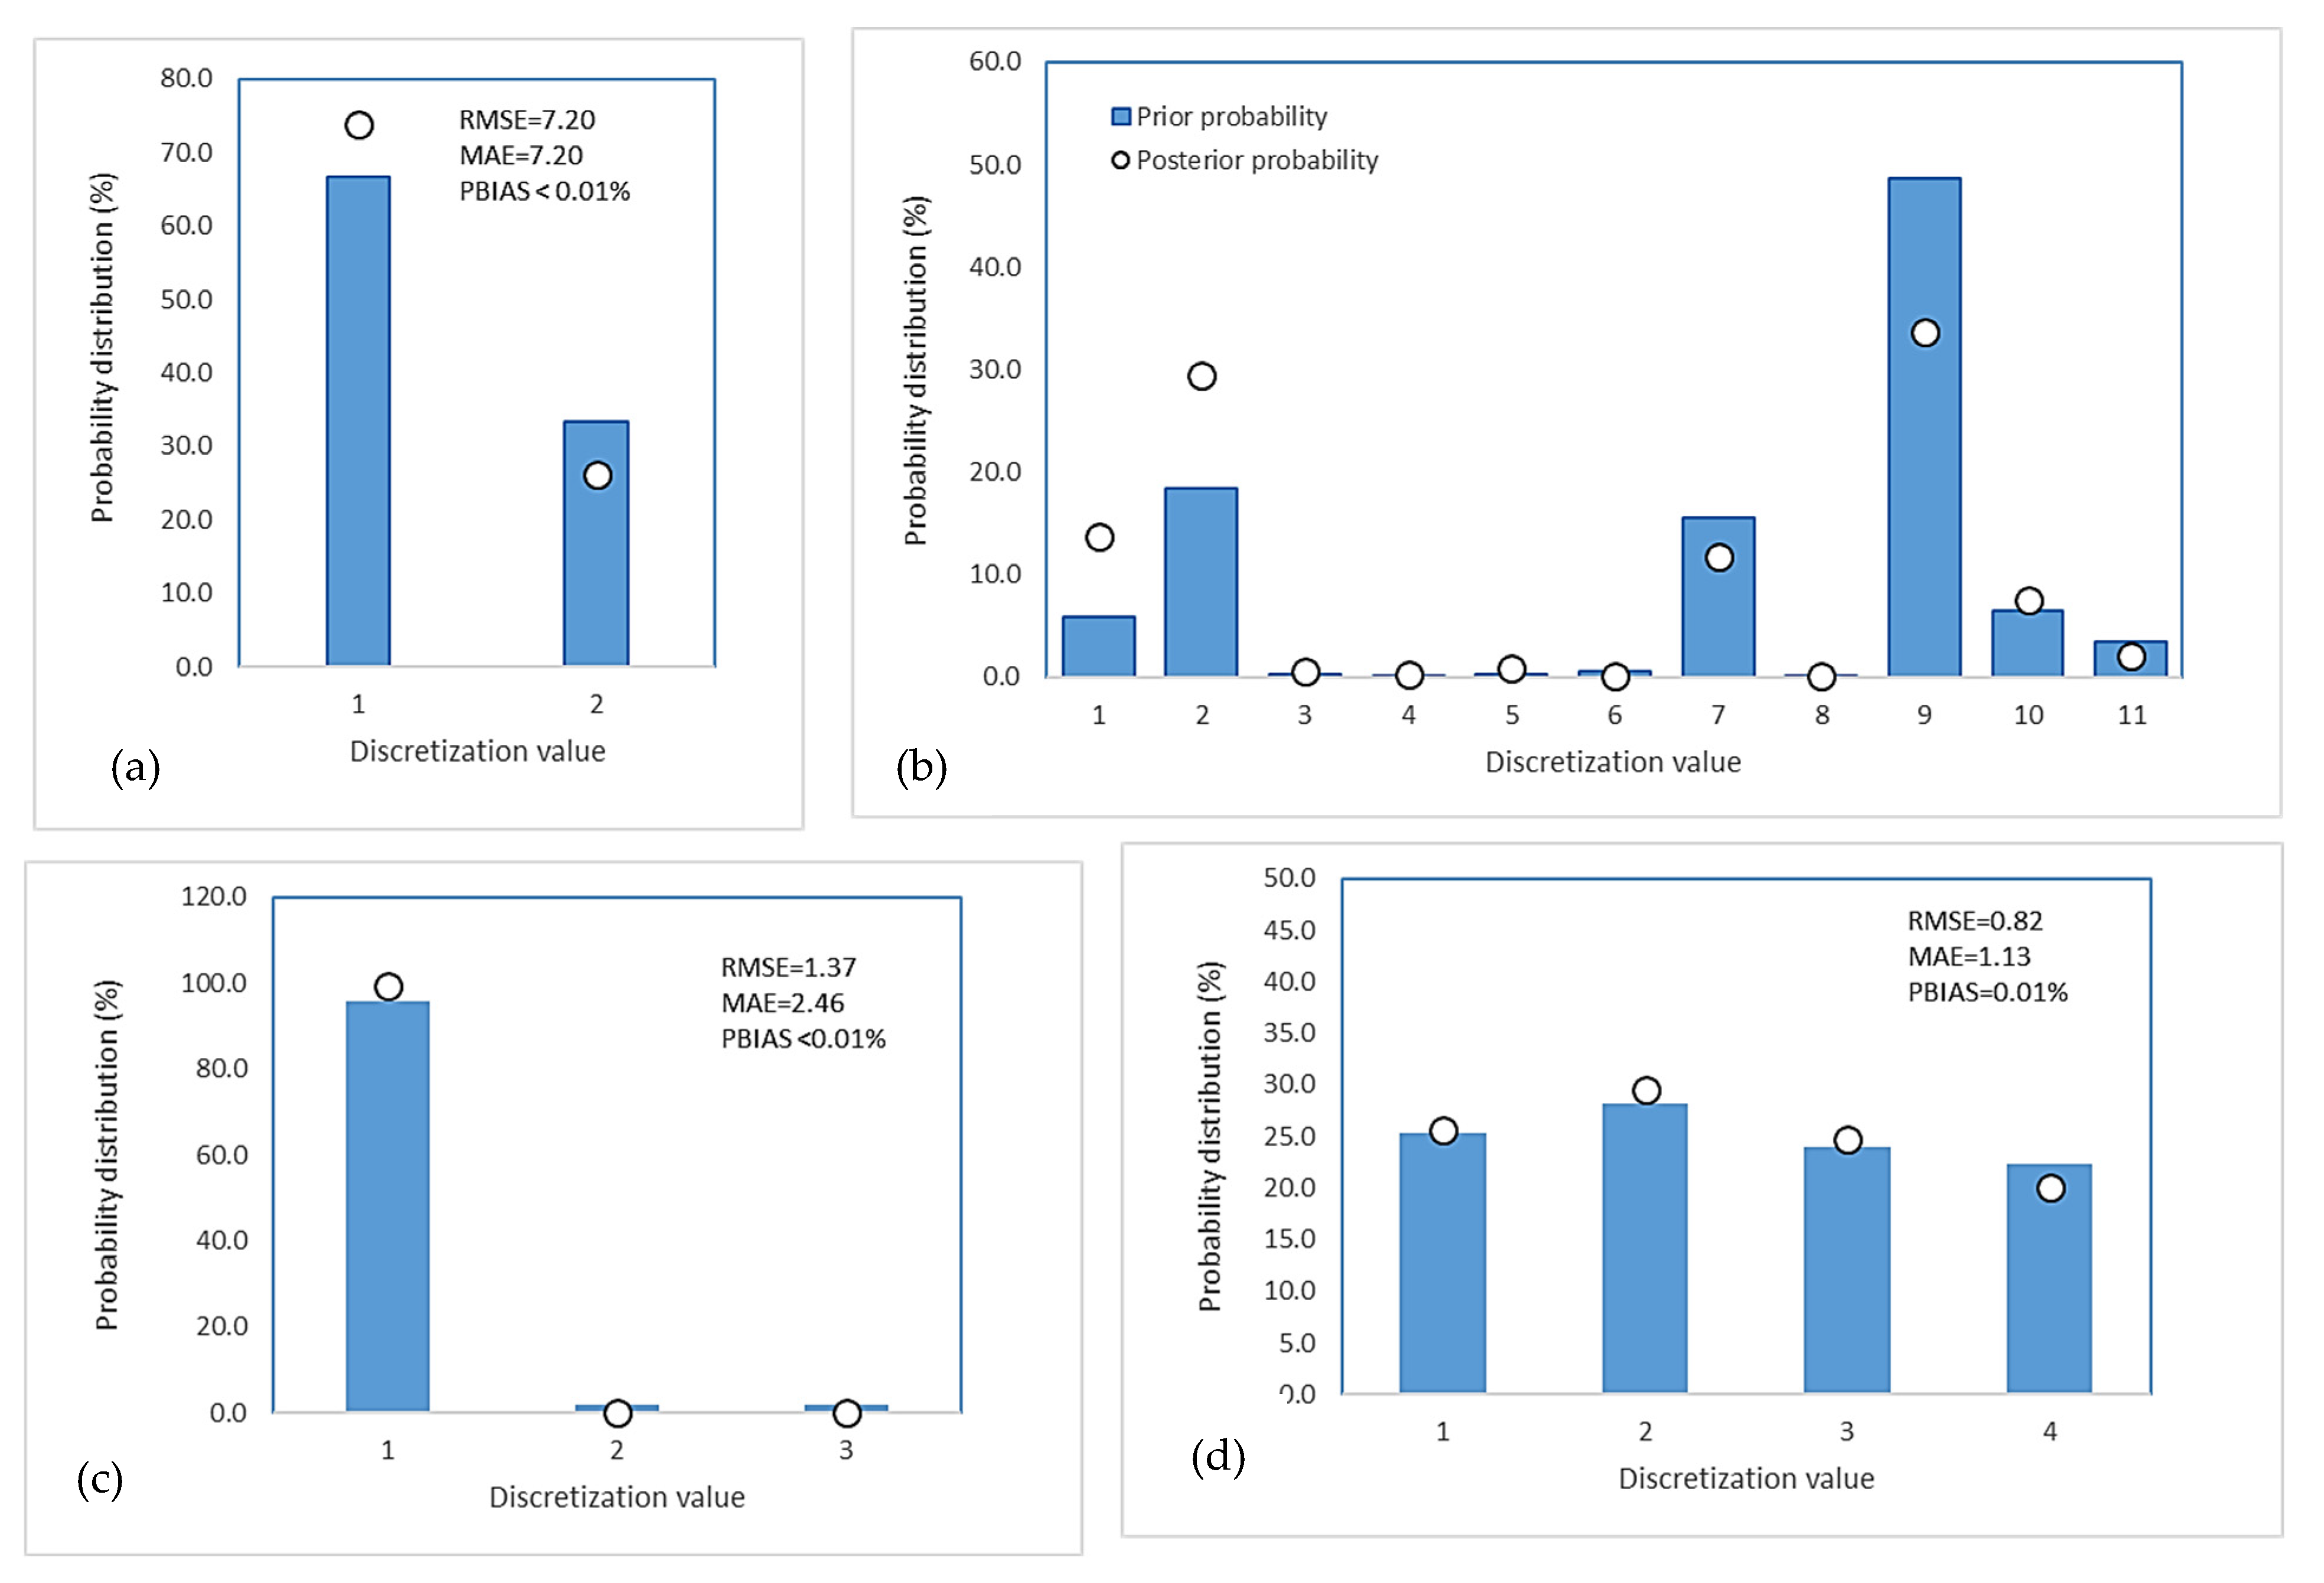
5.1.2. Model Fitting
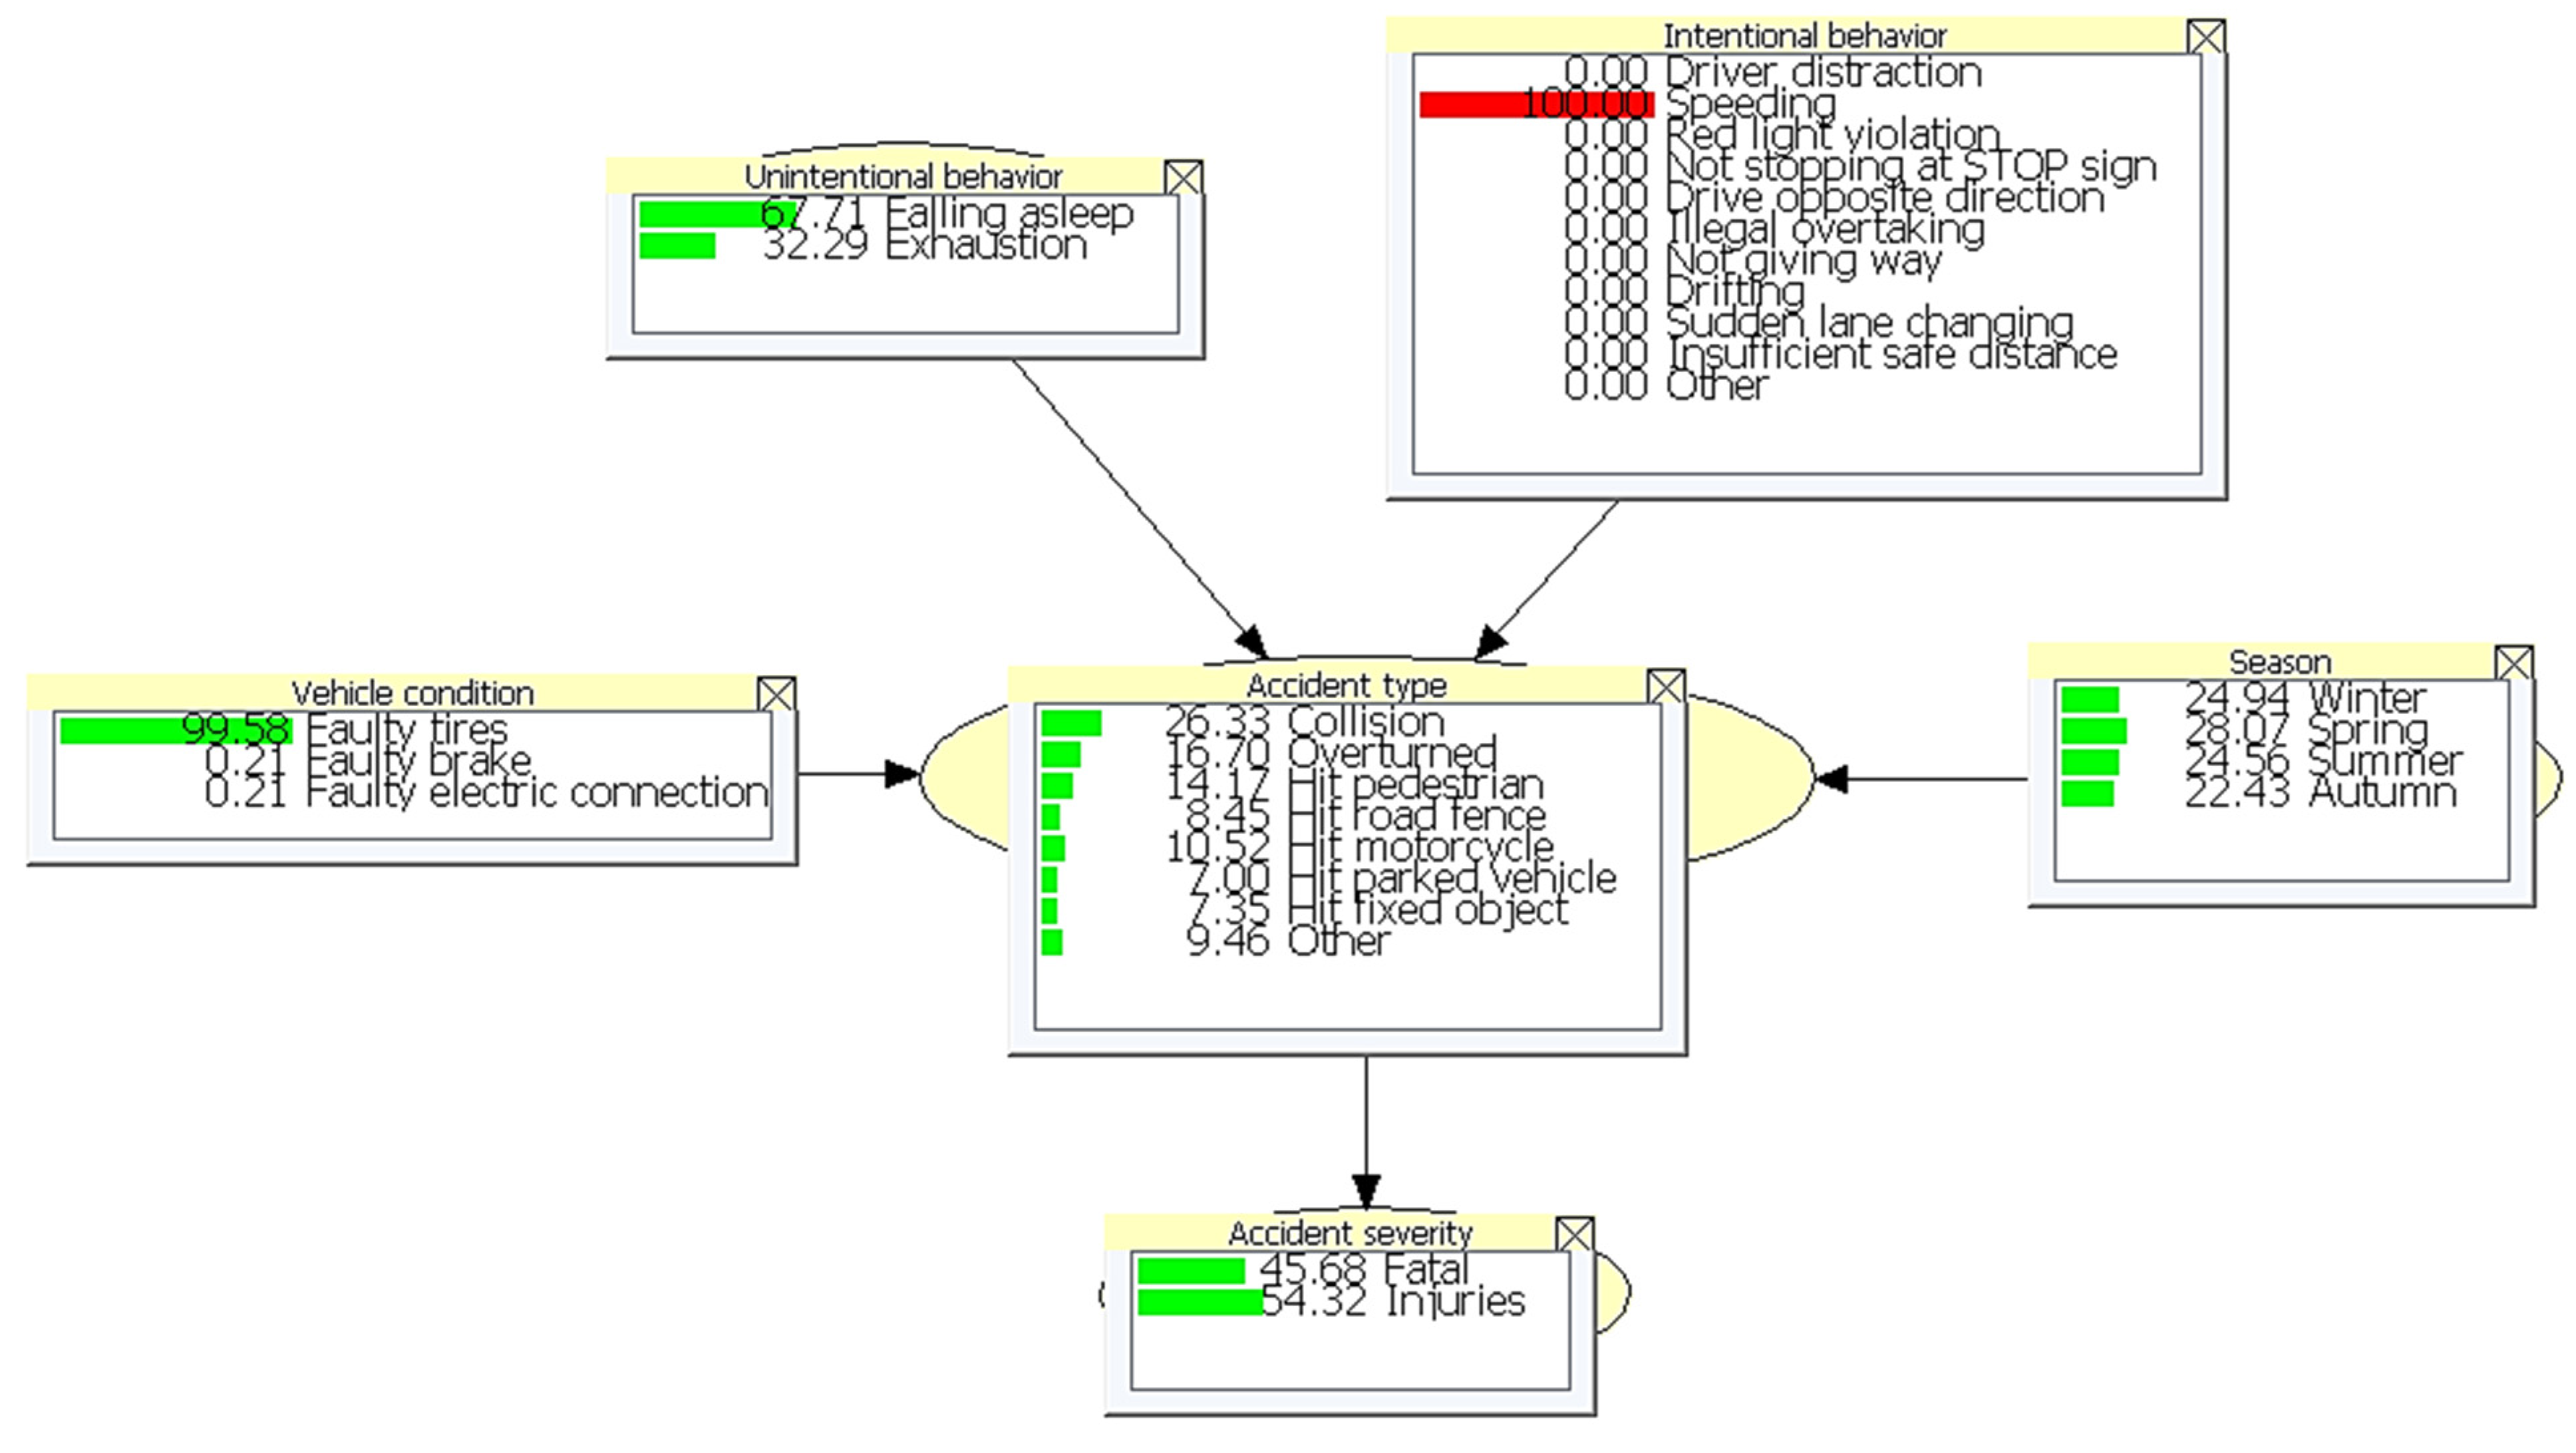
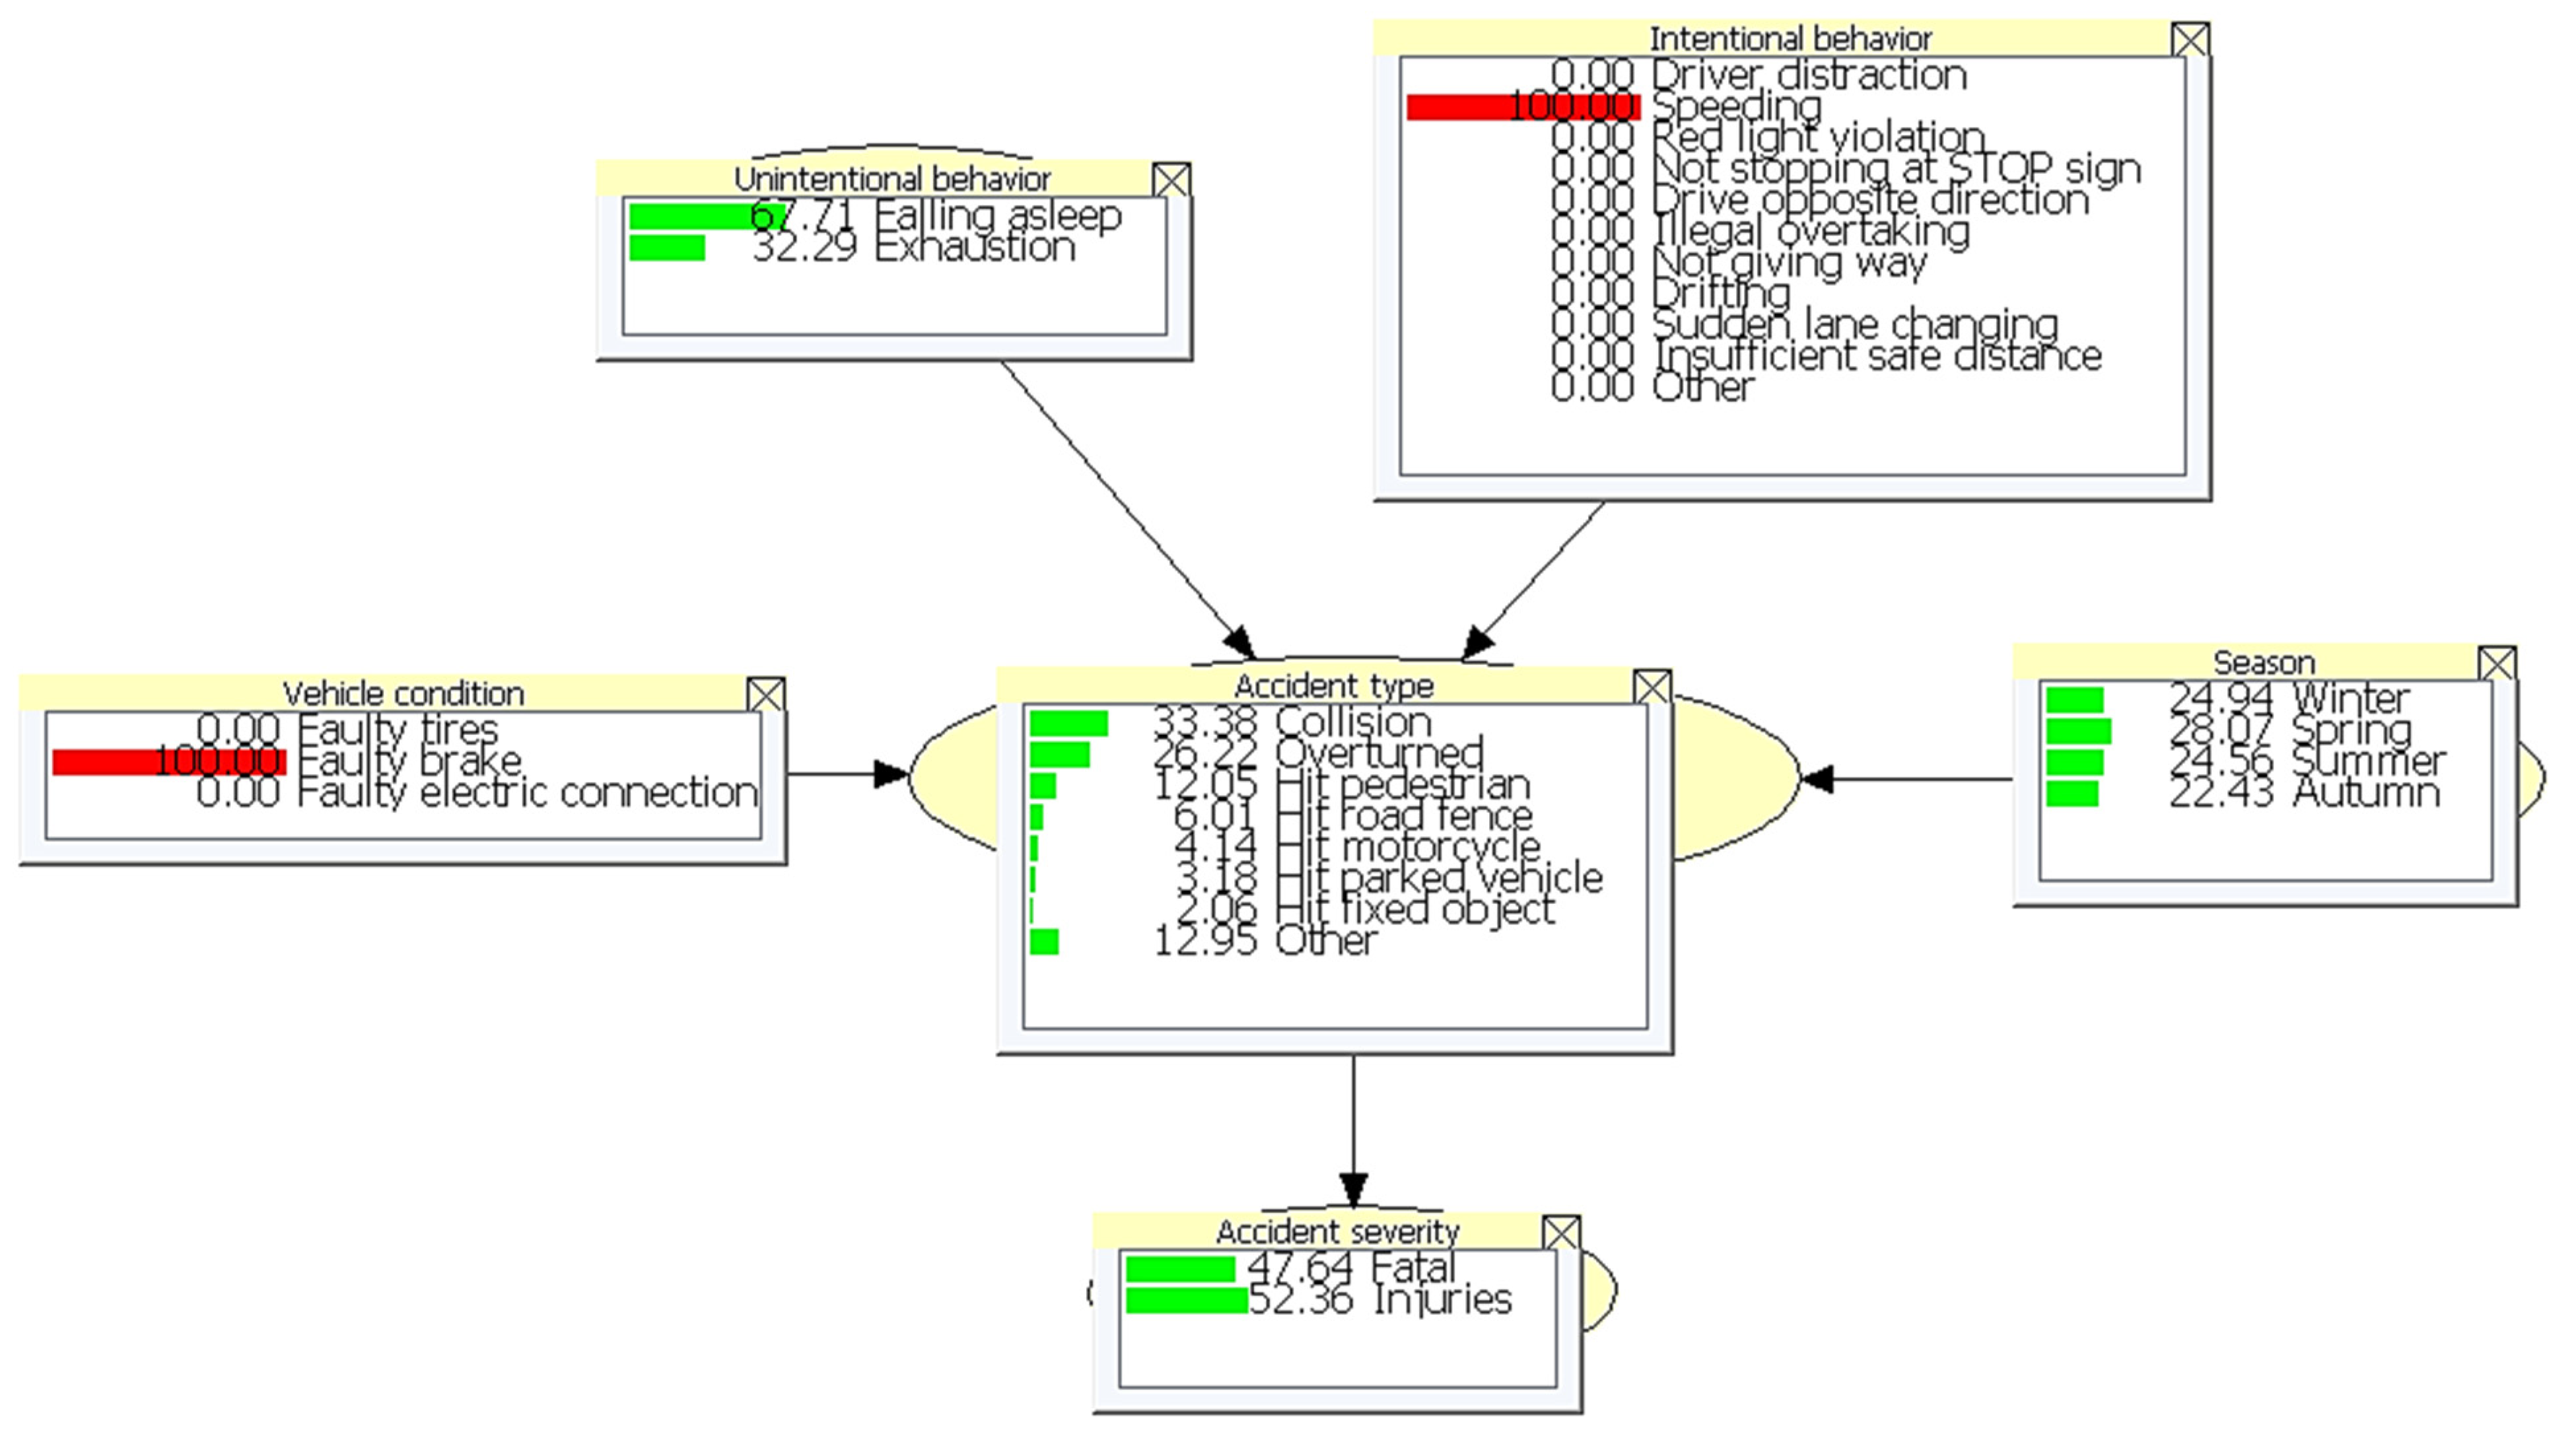
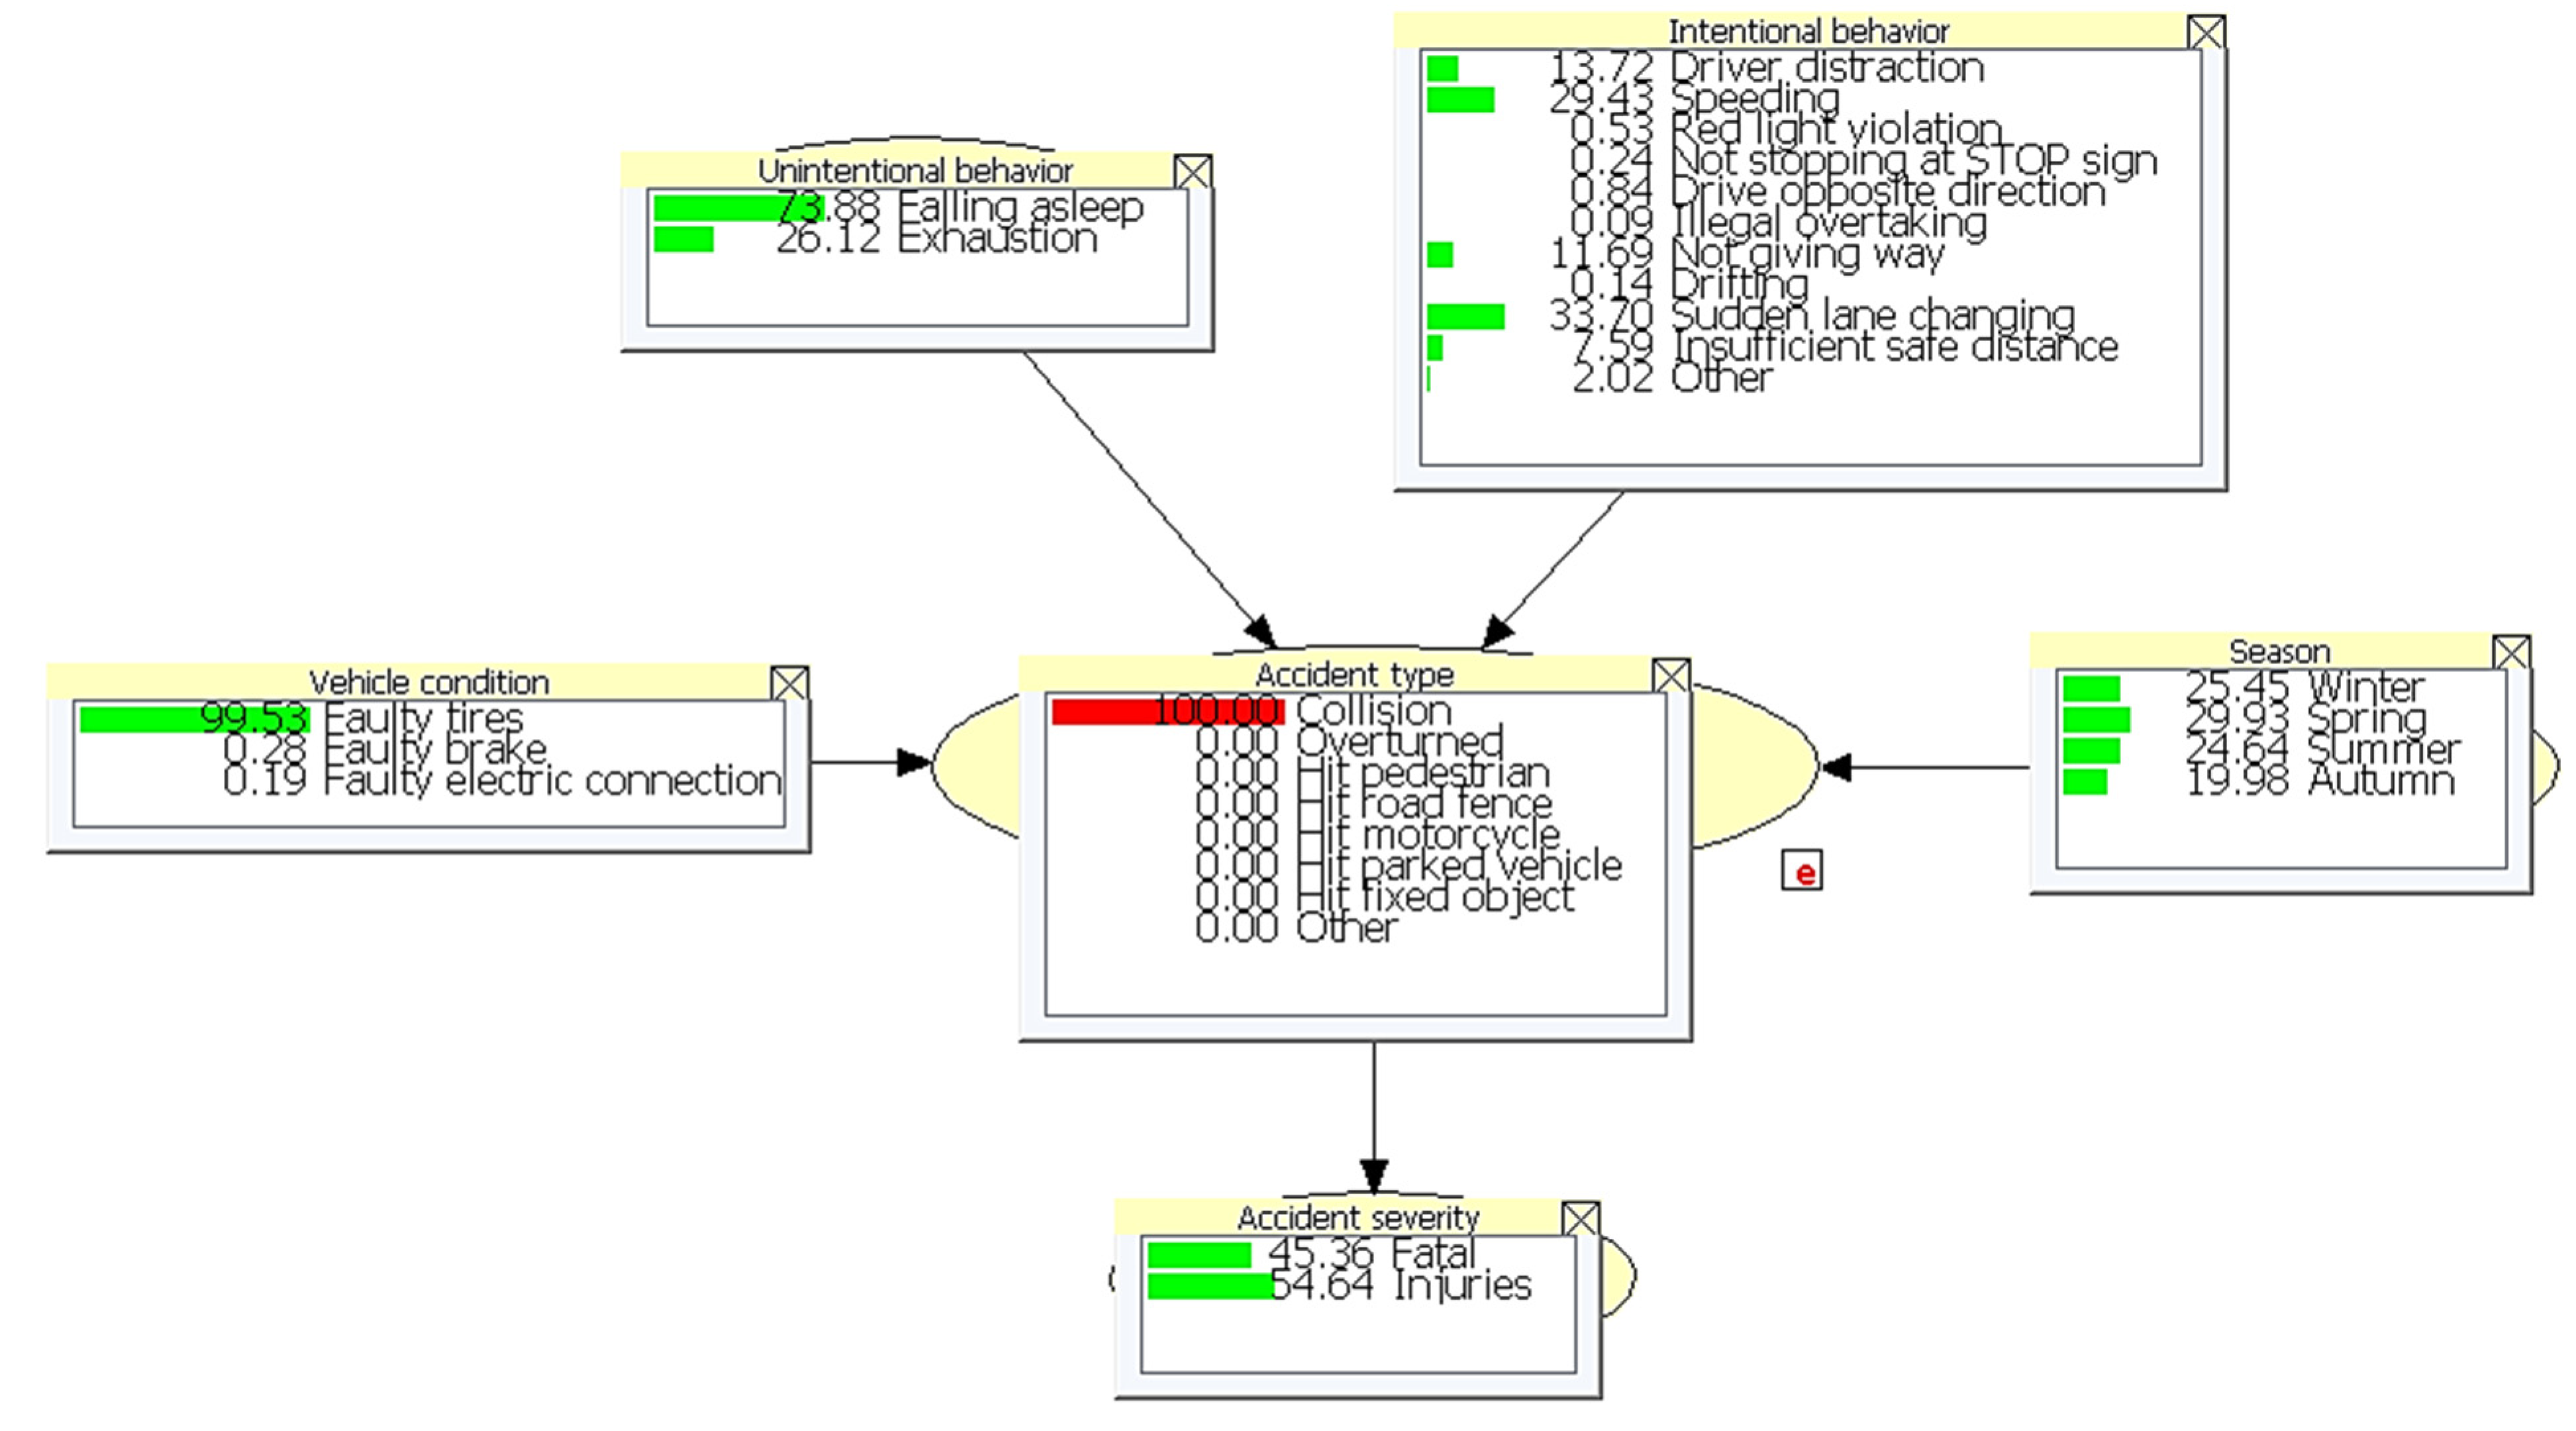
5.2. BBN Model Application to Evaluate Likelihood of Accident Type Due to Drivers’ Behavior
5.2.1. Driver Education, Culture, and Awareness
5.2.2. Application of Modern Technologies
5.2.3. Legislation and Enforcement of Traffic Regulations
5.2.4. Encourage Traffic Studies and Research
6. Conclusions
Author Contributions
Funding
Institutional Review Board Statement
Informed Consent Statement
Data Availability Statement
Acknowledgments
Conflicts of Interest
References
- WHO. Eastern Mediterranean Status Report on Road Safety: Call for Action. 94p; 30 cm. 2010. Available online: https://apps.who.int/iris/handle/10665/119908 (accessed on 21 May 2022).
- WHO. Global launch: Decade of Action for Road Safety 2011–2020, World Health Organization. 2011. Available online: https://apps.who.int/iris/bitstream/handle/10665/82578/WHO_NMH_VIP11.08_eng.pdf (accessed on 19 July 2021).
- Bendak, S. An in-depth analysis of red light crossing problem in Saudi Arabia. Adv. Transp. Stud. 2011, 25, 67–74. [Google Scholar] [CrossRef]
- WHO. Country Cooperation Strategy for WHO and Saudi, 2012–2016. 2012. Available online: https://apps.who.int/iris/bitstream/handle/10665/113227/CCS_Saudia_2013_EN_14914.pdf (accessed on 19 July 2021).
- Arab News. Saudi Arabia 2nd in ME in Accident Fatalities. 2015. Available online: https://www.arabnews.com/saudi-arabia/news/827366 (accessed on 19 July 2021).
- Arab News. Traffic Accidents Occur Every Minute in KSA. 2015. Available online: https://www.arabnews.com/saudi-arabia/news/717596 (accessed on 19 July 2021).
- Hassen, A.; Godesso, A.; Abebe, L.; Girma, E. Risky driving behaviors for road traffic accident among drivers in Mekele city, Northern Ethiopia. BMC Res. Notes 2011, 4, 535. [Google Scholar] [CrossRef] [PubMed] [Green Version]
- Khalil, I. Transport injuries and deaths in the Eastern Mediterranean Region: Findings from the Global Burden of Disease 2015 Study. Int. J. Public Health 2018, 63, 187–198. [Google Scholar] [CrossRef]
- Goniewicz, K.; Goniewicz, M.; Pawłowski, W.; Fiedor, P. Road accident rates: Strategies and programmes for improving road traffic safety. Eur. J. Trauma Emerg. Surg. 2016, 42, 433–438. [Google Scholar] [CrossRef]
- McTish, P.; Park, S. Exploring aggressive driving behavior in Pennsylvania’s Delaware Valley region. Procedia Eng. 2016, 145, 836–843. [Google Scholar] [CrossRef] [Green Version]
- Wang, C.; Fu, R.; Peng, J.; Mao, J. Driving style classification method for lane change warning system. J. Transp. Sys. Eng. Inf. Technol. 2014, 14, 187–193. [Google Scholar]
- Miller, G.; Taubman-Ben-Ari, O. Driving styles among young novice drivers—The contribution of parental driving styles and personal characteristics. Accid. Anal. Prev. 2010, 42, 558–570. [Google Scholar] [CrossRef]
- Eboli, L.; Guido, G.; Mazzulla, G.; Pungillo, G.; Pungillo, R. Investigating car users’ driving behaviour through speed analysis. Promet Traffic Transp. 2017, 29, 193–202. [Google Scholar] [CrossRef]
- Taubman-Ben-Ari, O.; Mikulincer, M.; Gillath, O. The multidimensional driving style inventory—Scale construct and validation. Accid. Anal. Prev. 2004, 36, 323–332. [Google Scholar] [CrossRef]
- Ali, Y.; Zheng, Z.; Haque, M.; Yildirimoglu, M.; Washington, S. Understanding the discretionary lane-changing behaviour in the connected environment. Accid. Anal. Prev. 2020, 137, 105463. [Google Scholar] [CrossRef]
- Ali, Y.; Sharma, A.; Haque, M.; Zheng, Z.; Saifuzzaman, M. The impact of the connected environment on driving behavior and safety: A driving simulator study. Accid. Anal. Prev. 2020, 144, 105643. [Google Scholar] [CrossRef] [PubMed]
- Ali, Y.; Haque, S.M.M.; Zheng, Z.; Washington, S.; Haque, M.; Yildirimoglu, M. A hazard-based duration model to quantify the impact of connected driving environment on safety during mandatory lane-changing. Transp. Res. Part C Emerg. Technol. 2019, 106, 113–131. [Google Scholar] [CrossRef]
- Zhou, Y.; Jiang, X.; Fu, C.; Liu, H. Operational factor analysis of the aggressive taxi speeders using random parameters Bayesian LASSO modeling approach. Accid. Anal. Prev. 2021, 157, 106183. [Google Scholar] [CrossRef] [PubMed]
- Jalayer, M.; Shabanpour, R.; Rouholamin, M.; Golshani, N.; Zhou, H. Wrong-way driving crashes: A random-parameters ordered probit analysis of injury severity. Accid. Anal. Prev. 2018, 117, 128–135. [Google Scholar] [CrossRef]
- Wang, J.; Huang, S.; Wang, J.; Sulaj, D.; Hao, W.; Kuang, A. Risk factors affecting crash injury severity for different groups of e-bike riders: A classification tree-based logistic regression model. J. Safety Res. 2021, 76, 176–183. [Google Scholar] [CrossRef]
- Al-Ghamdi, A.S. Pedestrian–vehicle crashes and analytical techniques for stratified contingency tables. Accid. Anal. Prev. 2002, 34, 205–214. [Google Scholar] [CrossRef]
- Stone, M.; Broughton, J. Getting off your bike: Cycling accidents in Great Britain in 1990–1999. Accid. Anal. Prev. 2003, 35, 549–556. [Google Scholar] [CrossRef]
- Lefler, D.E.; Gabler, H.C. The fatality and injury risk of light truck impacts with pedestrians in the United States. Accid. Anal. Prev. 2004, 36, 295–304. [Google Scholar] [CrossRef]
- Holubowycz, O.T. Age, sex, and blood alcohol concentration of killed and injured pedestrians. Accid. Anal. Prev. 1995, 27, 417–422. [Google Scholar] [CrossRef]
- Lord, D.; Washington, S.P.; Ivan, J.N. Poisson, Poisson-gamma and zero-inflated regression models of motor vehicle crashes: Balancing statistical fit and theory. Accid. Anal. Prev. 2005, 37, 35–46. [Google Scholar] [CrossRef]
- Ng, K.S.; Hung, W.T.; Wong, W.G. An algorithm for assessing the risk of traffic accident. J. Safety Res. 2002, 33, 387–410. [Google Scholar] [CrossRef]
- Martin, J.L. Relationship between crash rate and hourly traffic flow on interurban motorways. Accid. Anal. Prev. 2002, 34, 619–629. [Google Scholar] [CrossRef]
- Poch, M.; Mannering, F. Negative Binomial Analysis of Intersection-Accident Frequencies. J. Transp. Eng. 1996, 122, 105–113. [Google Scholar] [CrossRef] [Green Version]
- Yang, K.; Wang, X.; Yu, R. A Bayesian dynamic updating approach for urban expressway real-time crash risk evaluation. Transp. Res. Part C Emerg. Technol. 2018, 96, 192–207. [Google Scholar] [CrossRef]
- Fu, C.; Sayed, T. Bayesian dynamic extreme value modeling for conflict-based real-time safety analysis. Anal. Methods Accid. Res. 2022, 34, 100204. [Google Scholar] [CrossRef]
- Fei, X.; Lu, C.; Liu, K. A bayesian dynamic linear model approach for real-time short-term freeway travel time prediction. Transp. Res. Part C Emerg. Technol. 2011, 19, 1306–1318. [Google Scholar] [CrossRef]
- Chang, L.Y.; Chen, W.C. Data mining of tree-based models to analyze freeway accident frequency. J. Safety Res. 2005, 36, 365–375. [Google Scholar] [CrossRef]
- Kuhnert, P.M.; Do, K.A.; McClure, R. Combining non-parametric models with logistic regression: An application to motor vehicle injury data. Comput. Stat. Data Anal. 2000, 34, 371–386. [Google Scholar] [CrossRef]
- Abellán, J.; López, G.; de Oña, J. Analysis of traffic accident severity using Decision Rules via Decision Trees. Expert Syst. Appl. 2013, 40, 6047–6054. [Google Scholar] [CrossRef] [Green Version]
- De Oña, J.; Mujalli, R.O.; Calvo, F.J. Analysis of traffic accident injury severity on Spanish rural highways using Bayesian networks. Accid. Anal. Prev. 2011, 43, 402–411. [Google Scholar] [CrossRef]
- Heydari, S.; Miranda-Moreno, L.F.; Lord, D.; Fu, L. Bayesian methodology to estimate and update safety performance functions under limited data conditions: A sensitivity analysis. Accid. Anal. Prev. 2014, 64, 41–51. [Google Scholar] [CrossRef] [PubMed]
- Mbakwe, A.C.; Saka, A.A.; Choi, K.; Lee, Y.J. Alternative method of highway traffic safety analysis for developing countries using delphi technique and Bayesian network. Accid. Anal. Prev. 2016, 93, 135–146. [Google Scholar] [CrossRef] [PubMed]
- Peng, Y.; Cheng, L.; Jiang, Y.; Zhu, S. Examining Bayesian network modeling in identification of dangerous driving behavior. PLoS ONE 2021, 16, e0252484. [Google Scholar] [CrossRef] [PubMed]
- Borg, A.; Bjelland, H.; Njå, O. Reflections on Bayesian Network models for road tunnel safety design: A case study from Norway. Tunn. Undergr. Sp. Technol. 2014, 43, 300–314. [Google Scholar] [CrossRef]
- Chen, C.; Zhang, G.; Tarefder, R.; Ma, J.; Wei, H.; Guan, H. A multinomial logit model-Bayesian network hybrid approach for driver injury severity analyses in rear-end crashes. Accid. Anal. Prev. 2015, 80, 76–88. [Google Scholar] [CrossRef]
- Hossain, M.; Muromachi, Y. A Bayesian network based framework for real-time crash prediction on the basic freeway segments of urban expressways. Accid. Anal. Prev. 2012, 45, 373–381. [Google Scholar] [CrossRef]
- Zhao, L.; Wang, X.; Qian, Y. Analysis of factors that influence hazardous material transportation accidents based on Bayesian networks: A case study in China. Saf. Sci. 2012, 50, 1049–1055. [Google Scholar] [CrossRef]
- Antão, P.; Grande, O.; Trucco, C.S.-P. Safety, reliability, and undefined 2009. Analysis of maritime accident data with BBN models. In Safety, Reliability and Risk Analysis: Theory, Methods and Applications; Martorell, S., Guedes, S.C., Barnett, J., Eds.; Taylor & Francis: London, UK, 2009. [Google Scholar]
- Trucco, P.; Cagno, E.; Ruggeri, F.; Grande, O. A Bayesian Belief Network modelling of organisational factors in risk analysis: A case study in maritime transportation. Reliab. Eng. Syst. Saf. 2008, 93, 6. Available online: https://0-www-sciencedirect-com.brum.beds.ac.uk/science/article/pii/S0951832007001214?casa_token=QZc375Y_mm8AAAAA:9fo47bEbKyOBpe26cJt8B05dAP1ehTYFea6gMS2BtvKuhYndlYmkOYk18PTY0DLuyyZnhKAnIg (accessed on 30 September 2021). [CrossRef]
- Bouejla, A.; Chaze, X.; Guarnieri, F.; Napoli, A. A Bayesian network to manage risks of maritime piracy against offshore oil fields. Saf. Sci. 2014, 68, 222–230. Available online: https://0-www-sciencedirect-com.brum.beds.ac.uk/science/article/pii/S0925753514000952?casa_token=C29p9CbnU9MAAAAA:mBwdW6yHIvQIwQI9EQcLX14p-ym7stQxmruC_Ba_gNo_S4tRU8fNtl4KPcJAf4EhT9I-MNrUiA (accessed on 30 September 2021). [CrossRef] [Green Version]
- Li, K.X.; Yin, J.; Bang, H.S.; Yang, Z.; Wang, J. Bayesian network with quantitative input for maritime risk analysis. Transp. A Transp. Sci. 2014, 10, 89–118. [Google Scholar] [CrossRef]
- Zou, X.; Yue, W.L. A Bayesian Network Approach to Causation Analysis of Road Accidents Using Netica. J. Adv. Transp. 2017, 2017, 2525481. [Google Scholar] [CrossRef] [Green Version]
- Karimnezhad, A.; Moradi, F. Road accident data analysis using Bayesian networks. Transp. Lett. 2017, 9, 12–19. [Google Scholar] [CrossRef]
- Deublein, M.; Schubert, M.; Adey, B.T.; de Soto, B.G. A Bayesian network model to predict accidents on Swiss highways. Infrastruct. Asset Manag. 2015, 2, 145–158. [Google Scholar] [CrossRef] [Green Version]
- Zamzuri, Z.; Shabadin, A.; Ishak, S. Bayesian network of traffic accidents in Malaysia. J. Inf. Commun. Technol. 2019, 18, 473–484. Available online: http://e-journal.uum.edu.my/index.php/jict/article/view/8298 (accessed on 30 September 2021). [CrossRef]
- Jamal, A.; Rahman, M.T.; Al-Ahmadi, H.M.; Mansoor, U. The dilemma of road safety in the eastern province of Saudi Arabia: Consequences and prevention strategies. Int. J. Environ. Res. Public Health 2020, 17, 157. [Google Scholar] [CrossRef] [Green Version]
- Valiente, J.M.A.; Ayerbe, C.G.; Figueras, M.S. Social responsibility practices and evaluation of corporate social performance. J. Clean. Prod. 2012, 35, 25–38. [Google Scholar] [CrossRef]
- Bolstad, W.M. Introduction to Bayesian Statistics; John Wiley & Sons Inc.: Hoboken, NJ, USA, 2004. [Google Scholar]
- Jensen, F.; Nielsen, T. Bayesian Networks and Decision Graphs; Springer: New York, NY, USA, 2007; Volume 2. [Google Scholar]
- Hugin Expert. Hugin Educational Software Package, Version 7.8. 2013. Available online: http://www.hugin.com/products (accessed on 21 May 2022).
- Madsen, A.L.; Lang, M.; Kjærulff, U.B.; Jensen, F. The hugin tool for learning bayesian networks. In Proceedings of the 7th European Conference on Symbolic and Quantitative Approaches to Reasoning and Uncertainty, Aalborg, Denmark, 2–5 July 2003; pp. 594–605. [Google Scholar] [CrossRef]
- Mohamed, M.; Bromfield, N.F. Attitudes, driving behavior, and accident involvement among young male drivers in Saudi Arabia. Transp. Res. Part F Traffic Psychol. Behav. 2017, 47, 59–71. [Google Scholar] [CrossRef]
- Al-Wathinani, A.M.; Schwebel, D.C.; Al-Nasser, A.H.; Alrugaib, A.K.; Al-Suwaidan, H.I.; Al-Rowais, S.S.; AlZahrani, A.N.; Abushryei, R.H.; Mobrad, A.M.; Alhazmi, R.A.; et al. The Prevalence of Risky Driving Habits in Riyadh, Saudi Arabia. Sustainability 2021, 13, 7338. [Google Scholar] [CrossRef]
- Rahman, M.M.; Hagare, D.; Maheshwari, B. Bayesian Belief Network analysis of soil salinity in a peri-urban agricultural field irrigated with recycled water. Agric. Water Manag. 2016, 176, 280–296. [Google Scholar] [CrossRef]
- Rahman, M.M.; Hagare, D.; Maheshwari, B. Framework to assess sources controlling soil salinity resulting from irrigation using recycled water: An application of Bayesian Belief Network. J. Clean. Prod. 2015, 105, 406–419. [Google Scholar] [CrossRef]
- Chan, H.; Darwiche, A. When do Numbers Really Matter? J. Artif. Intell. Res. 2002, 17, 265–287. [Google Scholar] [CrossRef]
- Coupé, V.M.H.; van der Gaag, L.C. Properties of Sensitivity Analysis of Bayesian Belief Networks. Ann. Math. Artif. Intell. 2002, 364, 323–356. [Google Scholar] [CrossRef]
- Al-Hemoud, A.M.; Simmons, R.; Al-Asfoor, M.M.; Al-Hemoud, A.M.; Simmons, R.J. Behavior and lifestyle characteristics of male Kuwaiti drivers. J. Saf. Res. 2010, 41, 307–313. [Google Scholar] [CrossRef] [PubMed]
- Almoshaogeh, M.; Abdulrehman, R.; Haider, H.; Alharbi, F.; Jamal, A.; Alarifi, S.; Shafiquzzaman, M. Traffic accident risk assessment framework for Qassim, Saudi Arabia: Evaluating the impact of speed cameras. Appl. Sci. 2021, 11, 6682. [Google Scholar] [CrossRef]
- Barrimah, I.; Midhet, F.; Sharaf, F. Epidemiology of road traffic injuries in Qassim region, Saudi Arabia: Consistency of police and health data. Int. J. Health Sci. 2012, 6, 31. [Google Scholar] [CrossRef]
- Li, G.; Liao, Y.; Guo, Q.; Shen, C.; Lai, W. Traffic crash characteristics in Shenzhen, China from 2014 to 2016. Int. J. Environ. Res. Public Health 2021, 18, 1176. [Google Scholar] [CrossRef]
- Ramisetty-Mikler, S.; Almakadma, A. Attitudes and behaviors towards risky driving among adolescents in Saudi Arabia. Int. J. Pediatr. Adolesc. Med. 2016, 3, 55–63. [Google Scholar] [CrossRef] [Green Version]
- Uno, N.; Iida, Y.; Itsubo, S.; Yasuhara, S. A microscopic analysis of traffic conflict caused by lane-changing vehicle at weaving section. In Proceedings of the 13th Mini-EURO Conference on Handling Uncertainty in the Analysis of Traffic and Transportation Systems, Bari, Italy, 10–13 June 2003; pp. 143–148. [Google Scholar]
- Ministry of Interior. Traffic Violations and Penalties. 2021. Available online: https://www.moi.gov.sa (accessed on 1 August 2021).
- Rolison, J.J.; Regev, S.; Moutari, S.; Feeney, A. What are the factors that contribute to road accidents? An assessment of law enforcement views, ordinary drivers’ opinions, and road accident records. Accid. Anal. Prev. 2018, 115, 11–24. [Google Scholar] [CrossRef]
- Ponnaluri, R.V. Road traffic crashes and risk groups in India: Analysis, interpretations, and prevention strategies. IATSS Res. 2012, 35, 104–110. [Google Scholar] [CrossRef] [Green Version]
- Al-Ghamdi, A.S.; AlGadhi, S.A. Warning signs as countermeasures to camel–vehicle collisions in Saudi Arabia. Accid. Anal. Prev. 2004, 36, 749–760. [Google Scholar] [CrossRef]
- Jadaan, K.; Almatawah, J. A Review of Strategies to Promote Road Safety in Rich Developing Countries: The Gcc Countries Experience. Int. J. Eng. Res. Appl. 2016, 6, 12–17. Available online: https://www.academia.edu/download/49563202/C060905012017.pdf (accessed on 1 August 2021).
- Zwetsloot, G.I.J.M.; Kines, P.; Wybo, J.L.; Ruotsala, R.; Drupsteen, L.; Bezemer, R.A. Zero Accident Vision based strategies in organisations: Innovative perspectives. Saf. Sci. 2017, 91, 260–268. [Google Scholar] [CrossRef]
- Sharma, B.R. Road traffic injuries: A major global public health crisis. Public Health 2008, 122, 1399–1406. [Google Scholar] [CrossRef] [PubMed]
- Taiebat, M.; Brown, A.L.; Safford, H.R.; Qu, S.; Xu, M. A review on energy, environmental, and sustainability implications of connected and automated vehicles. Environ. Sci. Technol. 2018, 52, 11449–11465. [Google Scholar] [CrossRef] [PubMed]
- Tijerina, L.; Johnston, S.; Parmer, E.; Winterbottom, M. Driver Distraction with Wireless Telecommunications and Route Guidance Systems; National Highway Traffic Safety Administration: Washington, DC, USA, 2000; pp. 069–809. Available online: https://rosap.ntl.bts.gov/view/dot/14090 (accessed on 18 May 2022).
- Uang, S.; Hwang, S. Effects on driving behavior of congestion information and of scale of in-vehicle navigation systems. Transp. Res. Part C Emerg. Technol. 2003, 11, 423–438. [Google Scholar] [CrossRef]
- Eby, D.W.; Kostyniuk, L.P. An on-the-road comparison of in-vehicle navigation assistance systems. Hum. Factors 1999, 41, 295–311. [Google Scholar] [CrossRef] [Green Version]
- Oei, H.; Polak, P. Intelligent speed adaptation (ISA) and road safety. IATSS Res. 2002, 26, 45–51. [Google Scholar] [CrossRef] [Green Version]


| References | Driving Behaviors | Comments |
|---|---|---|
| P. McTish and S. Park (2016) [10] | Aggressive driving in Pennsylvania’s Delaware Valley region in the USA. | Conducted statistical analysis among aggressive crash features (e.g., type, severity level), roadway features (operation and geometric), and driver behavior. |
| C. Wang et al. (2014) [11] | Different driving styles, vision sensors, radar, GPS, and vehicle CAN bus data capture systems were installed in a small passenger car, and a real road driving test was carried out. | Used the fuzzy evaluation method to categorize driving behavior. |
| G. Miller and O. Taubman-Ben-Ari, (2010) [12] | Studied the risky behavior of young novice drivers. | Analyzed the contribution of parental driving styles and personal characteristics on the behavior of young drivers. |
| L. Eboli et al. (2017) [13] | Classified driving behavior into three categories: (1) safe, (2) unsafe, and (3) safe, with potentially dangerous behavior based on speed analysis. | Conducted a survey to collect experimental speeds in a real situation in an Italian rural two-lane road. |
| O. Taubman-Ben-Ari et al. (2004) [14] | Developed a self-report scale assessing four broad domains of driving styles—the multidimensional driving style inventory (MDSI). | Applied factor analysis that revealed eight main factors, with each one representing a specific driving style—dissociative, anxious, risky, angry, high-velocity, distress reduction, patient, and careful. |
| Y. Ali et al. (2020) [15,16,17] | Evaluated various critical driving behaviors across a number of normal driving activities, including car following, interactions with traffic lights, pedestrian crossings, and lane changes. | Conducted simulation studies using the CARRS-Q Advanced Driving Simulator. |
| Yue Zhou et al. (2021) [18] | Operational aspects affecting aggressive taxi speeders. | Applied the random parameter Bayesian least absolute shrinkage and selection operator (LASSO) modeling approach on taxi GPS trajectory data from Chengdu, China. |
| Mohammad Jalayer et al. (2018) [19] | Identified the attributes of wrong-way driving (WWD) crashes and injuries. | Applied random parameter-ordered probit model using 15 years of crash data from Alabama and Illinois, USA. |
| Zhengwu Wang et al. (2021) [20] | Studied the underlying risk factors for severe injuries in different categories of e-bike users. | Combined a classification tree with a logistic regression model using e-bike crash data from Hunan province, China. |
| Name of the Variable | No. | Discretization | Frequency | % |
|---|---|---|---|---|
| Unintentional Driver Behavior | 1 | Falling asleep | 2 | 67.0% |
| 2 | Exhaustion | 1 | 33.0% | |
| Intentional Driver Behavior | 1 | Driver distraction | 230 | 5.8% |
| 2 | Speeding | 725 | 18.4% | |
| 3 | Red light violation | 13 | 0.3% | |
| 4 | Not stopping at STOP sign | 7 | 0.2% | |
| 5 | Driving opposite to traffic | 10 | 0.3% | |
| 6 | Illegal overtaking | 22 | 0.6% | |
| 7 | Not giving way | 615 | 15.6% | |
| 8 | Drifting | 5 | 0.1% | |
| 9 | Sudden lane changes | 1918 | 48.7% | |
| 10 | Insufficient safe distance | 256 | 6.5% | |
| 11 | Other | 138 | 3.5% | |
| Vehicle Condition | 1 | Faulty tires | 46 | 95.8% |
| 2 | Faulty breaks | 1 | 2.1% | |
| 3 | Faulty electric | 1 | 2.1% | |
| Seasons | 1 | Winter (December–February) | 1014 | 25.4% |
| 2 | Spring (March–May) | 1127 | 28.2% | |
| 3 | Summer (June–August) | 960 | 24.0% | |
| 4 | Autumn (September–November) | 893 | 22.4% | |
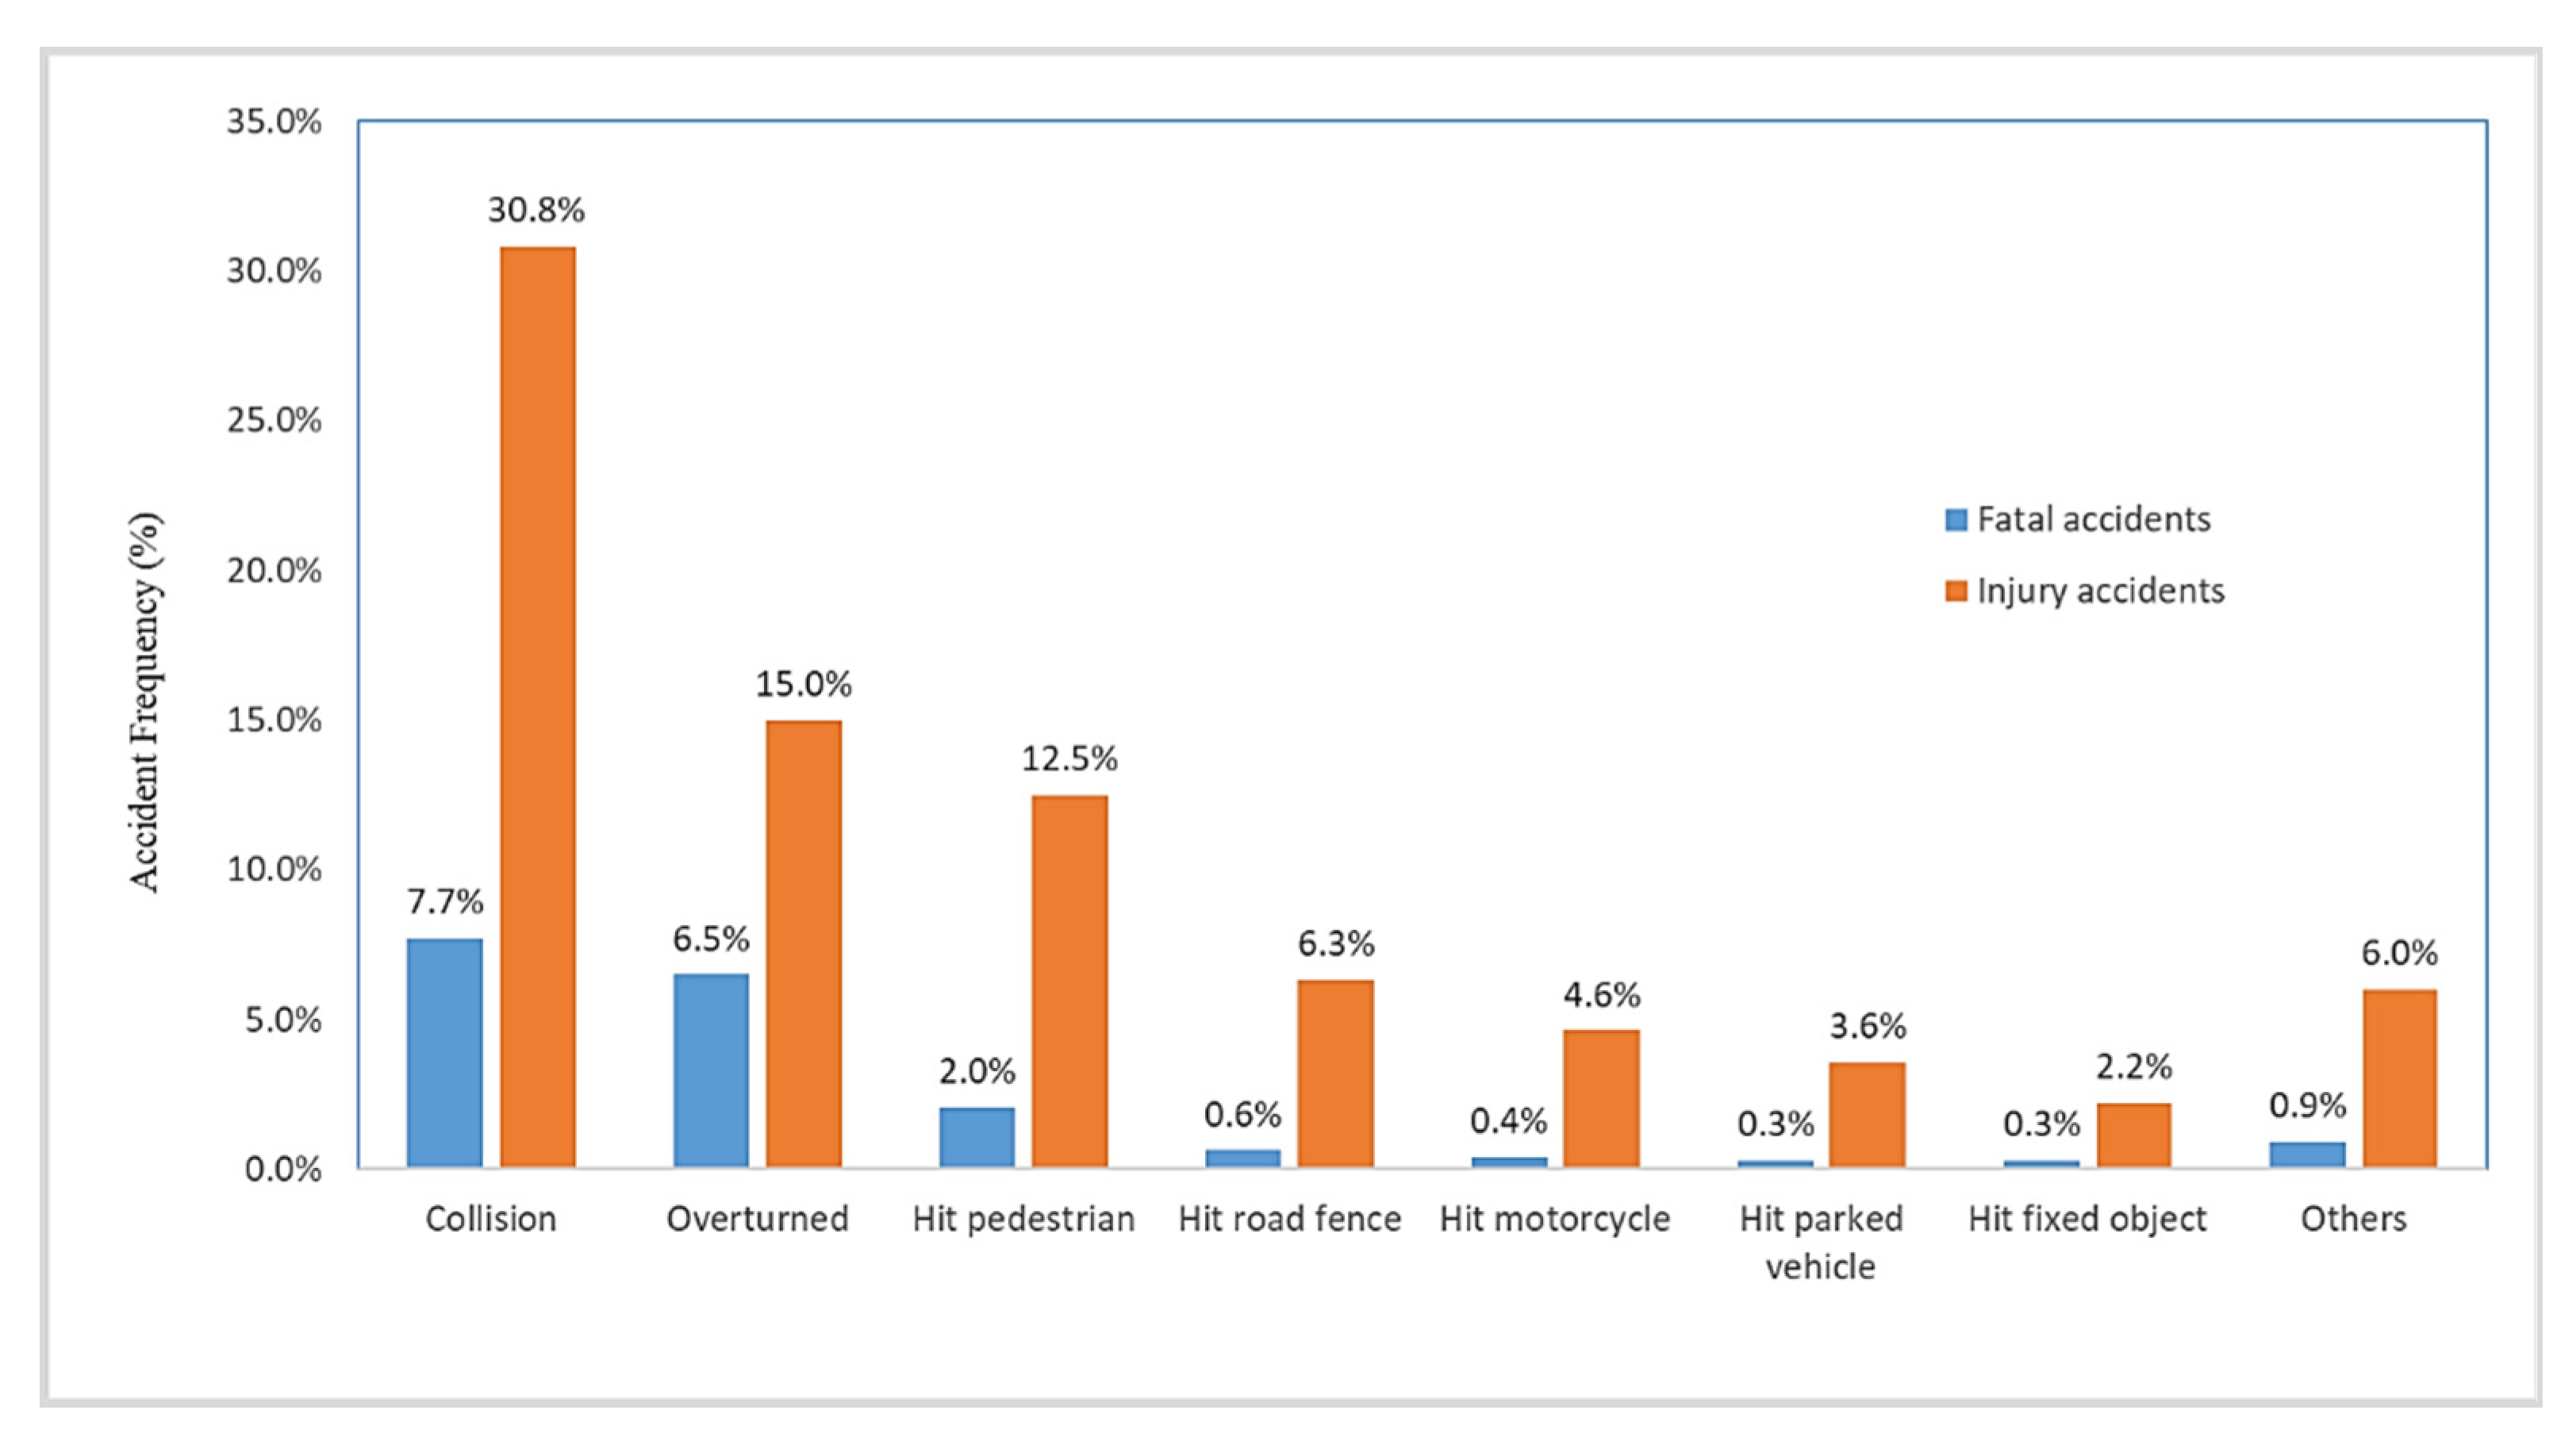
| Accident tType | 1 | Collision (both head-on and rear-end) | 1542 | 38.5% |
| 2 | Overturned | 862 | 21.5% | |
| 3 | Hit pedestrian | 582 | 14.5% | |
| 4 | Hit road fence | 278 | 6.9% | |
| 5 | Hit motorcycle | 201 | 5.0% | |
| 6 | Hit parked vehicle | 154 | 3.8% | |
| 7 | Hit fixed object | 100 | 2.5% | |
| 8 | Other | 275 | 6.9% | |
| Accident severity | 1 | Fatal | 756 | 18.9% |
| 2 | Injuries | 3238 | 81.1% |
| Table | Parent Node | Unintentional Driver Behavior | Intentional Driver Behavior | Vehicle Condition | Season |
|---|---|---|---|---|---|
| All states | Max | 0.05000 | 0.29000 | 0.07000 | 0.03000 |
| Min | −0.00743 | −0.00844 | −0.00844 | −0.00957 | |
| Collision | Max | 0.05000 | 0.29000 | 0.05000 | 0.01000 |
| Min | −0.05000 | −0.09000 | −0.02000 | −0.02000 | |
| Overturned | Max | 0.02000 | 0.23000 | 0.07000 | 0.02000 |
| Min | −0.02000 | −0.00844 | −0.06000 | −0.03000 | |
| Hit pedestrian | Max | 0.00267 | 0.05000 | 0.04000 | 0.01000 |
| Min | −0.00267 | −0.00541 | −0.05000 | −0.0024 | |
| Hit road fence | Max | 0.02000 | 0.14000 | 0.04000 | 0.01000 |
| Min | −0.02000 | −0.00399 | −0.00647 | −0.00925 | |
| Hit motorcycle | Max | 0.00743 | 0.03000 | 0.01000 | 0.02000 |
| Min | −0.00743 | −0.00620 | −0.00844 | −0.00802 | |
| Hit parked vehicle | Max | 0.02000 | 0.05000 | 0.04000 | 0.01000 |
| Min | −0.02000 | −0.08000 | −0.07000 | −0.00957 | |
| Hit fixed object | Max | 0.01000 | 0.04000 | 0.06000 | 0.00539 |
| Min | −0.01000 | −0.08000 | −0.06000 | −0.00790 | |
| Other | Max | 0.00253 | 0.20000 | 0.05000 | 0.03000 |
| Min | −0.00253 | −0.07000 | −0.02000 | −0.02000 |
| Discretization Description | Prior Probability | Evidence in Unintentional Behavior is 100% | Evidence in Intentional Behavior is 100% | |||||||||||
|---|---|---|---|---|---|---|---|---|---|---|---|---|---|---|
| Falling Asleep | Exhaustion | Driver Distraction | Speeding | Red Light Violation | Not Stopping at STOP Sign | Drive Opposite Direction | Illegal Overtaking | Not Giving Way | Drifting | Sudden Lane Change | Insufficient Safe Distance | Other | ||
| Posterior Probability | ||||||||||||||
| Collision | 38.5 | 17.65 | 13.09 | 34.81 | 26.31 | 22.52 | 23.36 | 45.08 | 2.72 | 11.83 | 10.12 | 11.37 | 19.33 | 8.92 |
| Overturned | 21.5 | 14.23 | 12.66 | 19.55 | 16.7 | 25.39 | 11.05 | 6.63 | 11.25 | 13.02 | 37.1 | 11.57 | 16.98 | 13.05 |
| Hit pedestrian | 14.5 | 13.02 | 13.29 | 15.19 | 14.16 | 9.41 | 13.75 | 7.05 | 6.4 | 12.65 | 11.62 | 12.93 | 8.9 | 17.73 |
| Hit road fence | 6.9 | 11.22 | 12.99 | 6.49 | 8.46 | 6.14 | 25.46 | 4.33 | 18.34 | 12.27 | 7.64 | 13.44 | 11.42 | 14.36 |
| Hit motorcycle | 5.0 | 11.93 | 12.67 | 7.15 | 10.54 | 7.25 | 2.52 | 0.98 | 4.42 | 12.75 | 11.63 | 13.6 | 11.59 | 11.78 |
| Hit parked vehicle | 3.8 | 10.85 | 13.29 | 4.77 | 7 | 9.16 | 16.72 | 4.01 | 16.57 | 13.27 | 7.74 | 13.26 | 15.14 | 12.23 |
| Hit electric post (fixed object) | 2.5 | 9.01 | 10.17 | 5.2 | 7.36 | 7.98 | 1.65 | 13.8 | 7.91 | 10.5 | 1.16 | 10.67 | 6.15 | 11.46 |
| Other | 6.9 | 12.10 | 11.84 | 6.84 | 9.47 | 12.16 | 5.50 | 18.12 | 32.38 | 13.71 | 12.99 | 13.17 | 10.49 | 10.47 |
| Fatal | 18.9 | 44.97 | 44.56 | 46.68 | 45.68 | 46.07 | 45.74 | 46.66 | 46.09 | 44.61 | 46.34 | 44.34 | 44.36 | 45.24 |
| Serious injury | 81.1 | 55.03 | 55.44 | 53.32 | 54.32 | 53.93 | 54.26 | 53.34 | 53.91 | 55.39 | 53.66 | 55.66 | 55.64 | 54.76 |
| Variable Name | Discretization Description | Evidence in Accident Type is 100% | ||||||
|---|---|---|---|---|---|---|---|---|
| Collision | Overturned | Hit Pedestrian | Hit Road Fence | Hit Motorcycle | Hit Parked Vehicle | Hit Fixed Object | ||
| Posterior Probability | Posterior Probability | Posterior Probability | Posterior Probability | Posterior Probability | Posterior Probability | Posterior Probability | ||
| Unintentional Driver Behavior | Falling asleep | 73.87 | 70.21 | 67.26 | 64.43 | 66.37 | 63.13 | 65 |
| Exhaustion | 26.13 | 29.79 | 32.74 | 35.57 | 33.63 | 36.87 | 35 | |
| Intentional Driver Behavior | Driver distraction | 13.74 | 9.09 | 7.4 | 3.52 | 3.75 | 2.61 | 3.54 |
| Speeding | 29.41 | 22 | 19.54 | 12.97 | 15.66 | 10.87 | 14.18 | |
| Red light violation | 0.52 | 0.71 | 0.27 | 0.2 | 0.23 | 0.3 | 0.33 | |
| Not stopping at STOP sign | 0.24 | 0.14 | 0.18 | 0.36 | 0.03 | 0.24 | 0.03 | |
| Drive opposite direction | 0.84 | 0.15 | 0.16 | 0.11 | 0.02 | 0.1 | 0.44 | |
| Illegal overtaking | 0.09 | 0.44 | 0.26 | 0.83 | 0.19 | 0.76 | 0.45 | |
| Not giving way | 11.7 | 15.17 | 1.44 | 16.64 | 16.76 | 18.23 | 17.89 | |
| Drifting | 0.14 | 0.59 | 0.19 | 0.14 | 0.21 | 0.14 | 0.03 | |
| Sudden lane change | 33.71 | 40.4 | 47.29 | 54.63 | 53.55 | 54.63 | 54.48 | |
| Insufficient safe distance | 7.57 | 7.84 | 4.3 | 6.13 | 6.03 | 8.24 | 4.15 | |
| Other | 2.03 | 3.49 | 4.97 | 4.48 | 3.56 | 3.86 | 4.49 | |
| Vehicle Condition | Faulty tires | 99.53 | 99.39 | 99.71 | 99.55 | 99.62 | 99.73 | 99.58 |
| Faulty brakes | 0.28 | 0.29 | 0.14 | 0.28 | 0.2 | 0.09 | 0.07 | |
| Faulty electric connection | 0.19 | 0.32 | 0.15 | 0.17 | 0.18 | 0.18 | 0.35 | |
| Season | Winter | 25.59 | 22.91 | 26.55 | 25.33 | 25.94 | 23.53 | 24.55 |
| Spring | 29.53 | 29.94 | 28.25 | 26.12 | 25.39 | 27.38 | 28.84 | |
| Summer | 24.78 | 27.98 | 24.35 | 26.66 | 23.46 | 24.4 | 23.12 | |
| Autumn | 20.09 | 19.17 | 20.84 | 21.89 | 25.21 | 24.68 | 23.48 | |
Publisher’s Note: MDPI stays neutral with regard to jurisdictional claims in published maps and institutional affiliations. |
© 2022 by the authors. Licensee MDPI, Basel, Switzerland. This article is an open access article distributed under the terms and conditions of the Creative Commons Attribution (CC BY) license (https://creativecommons.org/licenses/by/4.0/).
Share and Cite
Rahman, M.M.; Islam, M.K.; Al-Shayeb, A.; Arifuzzaman, M. Towards Sustainable Road Safety in Saudi Arabia: Exploring Traffic Accident Causes Associated with Driving Behavior Using a Bayesian Belief Network. Sustainability 2022, 14, 6315. https://0-doi-org.brum.beds.ac.uk/10.3390/su14106315
Rahman MM, Islam MK, Al-Shayeb A, Arifuzzaman M. Towards Sustainable Road Safety in Saudi Arabia: Exploring Traffic Accident Causes Associated with Driving Behavior Using a Bayesian Belief Network. Sustainability. 2022; 14(10):6315. https://0-doi-org.brum.beds.ac.uk/10.3390/su14106315
Chicago/Turabian StyleRahman, Muhammad Muhitur, Md Kamrul Islam, Ammar Al-Shayeb, and Md Arifuzzaman. 2022. "Towards Sustainable Road Safety in Saudi Arabia: Exploring Traffic Accident Causes Associated with Driving Behavior Using a Bayesian Belief Network" Sustainability 14, no. 10: 6315. https://0-doi-org.brum.beds.ac.uk/10.3390/su14106315