Article

Optimized O3/Fe(II) Using Response Surface Methodology for Organic Phosphorus Removal in Tetrakis(hydroxymethyl)phosphonium Sulfate Wastewater

School of Ecology and Environment, Zhengzhou University, 100 Science Road, Zhengzhou 450001, China
*
Author to whom correspondence should be addressed.
Sustainability 2022, 14(10), 6318; https://0-doi-org.brum.beds.ac.uk/10.3390/su14106318
Submission received: 18 April 2022 / Revised: 19 May 2022 / Accepted: 20 May 2022 / Published: 22 May 2022

Abstract

:
Tetrakis(hydroxymethyl)phosphonium sulfate (THPS) wastewater is a kind of industrial wastewater which is difficult to biodegrade. In this work, O3/Fe(II) was used to remove organic phosphorus from THPS wastewater. The operating conditions in this process were optimized using the Box-Behnken response surface method based on single-factor experimentation. A response model of the organic phosphorus removal rate considering the initial pH, reaction time, ozone concentration, and Fe(II) dosage was established. The results showed that the ozone concentration and initial pH had a significant effect on the removal rate of organic phosphorus, and the model fit well (R2 = 0.98). The maximum removal rate of organic phosphorus predicted by this model was 86.04%, while the deviation between the predicted and experimental values was 0.91%. We concluded that the quadratic model was an effective tool for optimizing the removal of organic phosphorus in the THPS wastewater by O3/Fe(II).

1. Introduction

Tetrakis(hydroxymethyl)phosphonium sulfate (THPS) is an organic phosphorus raw material with strong biological toxicity and is widely used in the industry as a fabric flame retardant, tanning agent, and biocide [1,2,3]. At present, the research on THPS is mainly focused on its preparation and application, but the environmental threat caused by THPS did not get enough attention. Due to the extensive use of THPS, a large number of high-concentration organic phosphorus wastewaters have been discharged, with THPS as the main pollutant. The organic phosphorus it contains may lead to eutrophication without proper treatment. The most commonly used treatment methods of phosphorus-containing wastewater mainly include biological methods and oxidation methods [4,5]. This type of wastewater has characteristics of high pollutant concentration, difficult degradation, and strong biotoxicity [6]. The traditionally activated sludge method has a poor treatment effect on THPS wastewater, and THPS can cause microbial death in the biochemical pool without proper treatment, thus affecting the treatment effect [7]. While some of the current high-concentration wastewater treatment methods, such as wet oxidation process and reverse osmosis method, is limited in large-scale application due to its high costs and strict reaction conditions. Therefore, finding a reliable, efficient, and economical treatment method for THPS wastewater has become an urgent matter.
The ozone oxidation process is widely used in the field of water treatment, and it has been often used to treat toxic pollutants that have difficulty biodegrading [8]. This process can be attributed to the high chemical reactivity of ozone, which can improve the biodegradability of pollutants. In terms of the pollutant ozone degradation mechanisms, O3 can selectively destroy the double-chain structure of organic matter due to its strong oxidation potential [9], and O3 can decompose or oxidize HO with a higher potential (2.87 eV) under the action of a catalyst (Equations (1) and (2)) [10], degrading various organic matter into inorganic matter without selectivity:
O3 + OH→ O2 + HO2·,
O3 + HO2·→ 2O2 + HO·,
The efficiency of pure O3 oxidation for generating HO·is low, and catalysts can be used to promote O3 to generate more HO·and improve the oxidative pollutant degradation ability of the system [11]. As a result, the ozone catalytic oxidation process was developed, which includes the homogeneous ozone catalytic oxidation of metals. Common catalysts include transition metals, such as Fe(II), Mn(II), Ni(II), and Co(II) [12]. Among these, Fe(II) has the advantages of low cost, widely available sources, no toxicity, no secondary pollution, and high catalytic efficiency [13,14,15]. Therefore, O3/Fe(II) advanced oxidation technology offers significant application potential. The mechanism of Fe(II) for catalyzing O3 decomposition and generating HO can be expressed by Equations (3)–(7) [9,16,17]:
Fe2+ + O3 → Fe3+ + O3·,
O3· + H+ → O2 + HO·,
Fe2+ + O3 → FeO2+ + O2,
FeO2+ + H2O → Fe3+ + HO· + OH,
Fe3+ + O3 + H2O → FeO2+ + H+ + HO· + O2,
Excess HO·and HO2·in O3/Fe(II) systems will undergo quenching reactions to generate H2O2 (Equations (8) and (9)) [18]. In a low pH environment, Fe(II) and H2O2 will actually form a Fenton system, which will further promote the generation of hydroxyl radicals (Equations (10) and (11)) [19,20]:
2HO· → H2O2,
2HO2· → H2O2 + O2,
Fe2+ + H2O2 → Fe3+ + HO· + OH,
Fe3+ + H2O2 → Fe2+ + H+ + HO2·.
In 1951, Box put forward a response surface method, which consisted of a comprehensive optimization method comprised of an experimental design and mathematical model [21]. Compared to the orthogonal test method, which has been widely used, the response surface method offers advantages of a shorter testing time, shorter period, high precision, high precision of finding the regression equation, good prediction performance, and it can be used to study the interactions among several factors [22]. The response surface method (RSM) was originally used to fit physical experiments. However, in recent years, it has become a newly developed optimization theory method widely used in the chemical, agricultural, pharmaceutical, environmental, and mechanical engineering industries [23,24]. In practice, the response surface method generally determines the influencing factors and the corresponding value range based on single-factor experiments. Then, by testing the representative local points within the value range of each factor, the regression fitting function relationship between each factor and the test results in the fitting global range can be established, and the optimal level values of each factor can be obtained by mathematical calculations [25]. There have been many response surface design methods, among which the Box-Behnken design (BBD) and central composite design (CCD) are the most commonly used [26].
In this work, Fe(II) was chosen as the catalyst of O3, and its effect on phosphorus removal from THPS wastewater was studied, which was then compared to the O3 oxidation process. First, the effects of reaction time, initial pH, ozone concentration, and Fe(II) dosage on organic phosphorus removal were investigated by single-factor experiments. Then, on the basis of the single factor experiments, a Box-Behnken model was established using the response surface method to explore the synergistic effects of reaction time, initial pH, ozone concentration, and Fe(II) dosage on the removal rate of organic phosphorus in wastewater. After that, the reaction conditions were optimized to provide data support and a theoretical basis for practical applications.

2. Materials and Methods

2.1. Reagents

THPS (75% aqueous solution) and sulfuric acid were purchased from Alladin. All other reagents were purchased from Sinopharm Chemical Reagent Co., Ltd. (Shanghai, China). All other reagents used were of analytical grade. All solutions were prepared with deionized water. THPS was dissolved in deionized water to prepare the water sample used in this work. The total phosphorus (TP) of the water sample was 8.5–9 mg/L, PO43− was 0.01 mg/L, and the initial pH was 3.1.

2.2. Apparatus

A digestion instrument (DRB200), spectrophotometer (DR2800), ozone generator (AKA-100G), constant temperature water bath (HH-2), precision pH meter (PB-10), and analytical balance (AL204) were used in this work.

2.3. Preparation of the Ozone-Saturated Water

The saturated ozone water was prepared by passing the mixed gas produced by an ozone generator into deionized water under a 4 °C ice water bath for 30 min, where the final dissolved ozone concentration was 14 mg/L.

2.4. Single Factor Experiments

The effects of initial pH, ozone concentration, reaction time, and Fe(II) dosage on the removal rate of organic phosphorus were studied by single factor experiments, which were conducted in a 500-mL round bottom flask. The ozone concentration was controlled by changing the volume of deionized water and the saturated ozone water ratios. The initial pH was adjusted by H2SO4 and NaOH, where Na2SO3 was added to stop the reaction when reaching the reaction time. Then, the total phosphorus and orthophosphate in the water samples were analyzed. Three parallel samples were obtained for each group and the mean value and variance were calculated.

2.5. Response Surface Experiments

Based on the results of the single-factor experiments, the Box-Behnken model was used to determine the influencing factors and optimization level according to the design of four factors and three levels. The experiments were designed and calculated by Design Expert 8.0.6 software.

2.6. Analysis Methods

The TP and PO43− concentrations were analyzed by the Hach rapid detection method, where organophosphate was determined by the value of total phosphorus minus the value of orthophosphate. The removal rate of organic phosphorus was calculated according to Equation (12), while the concentration of dissolved ozone in the water was analyzed by the indigo method [27]:
η = ( C P 0 C 0 ) ( C p 1 C 1 ) C P 0 C 0   ×   100 % ,
where η denotes the removal rate of organic phosphorus (%), C1 is the concentration of orthophosphate after the reaction (mg/L), C0 is the concentration of orthophosphate before the reaction (mg/L), Cp0 is the concentration of total phosphorus before the reaction (mg/L), and Cp1 is the concentration of total phosphorus after the reaction (mg/L).

3. Results and Discussion

3.1. Single-Factor Experiments

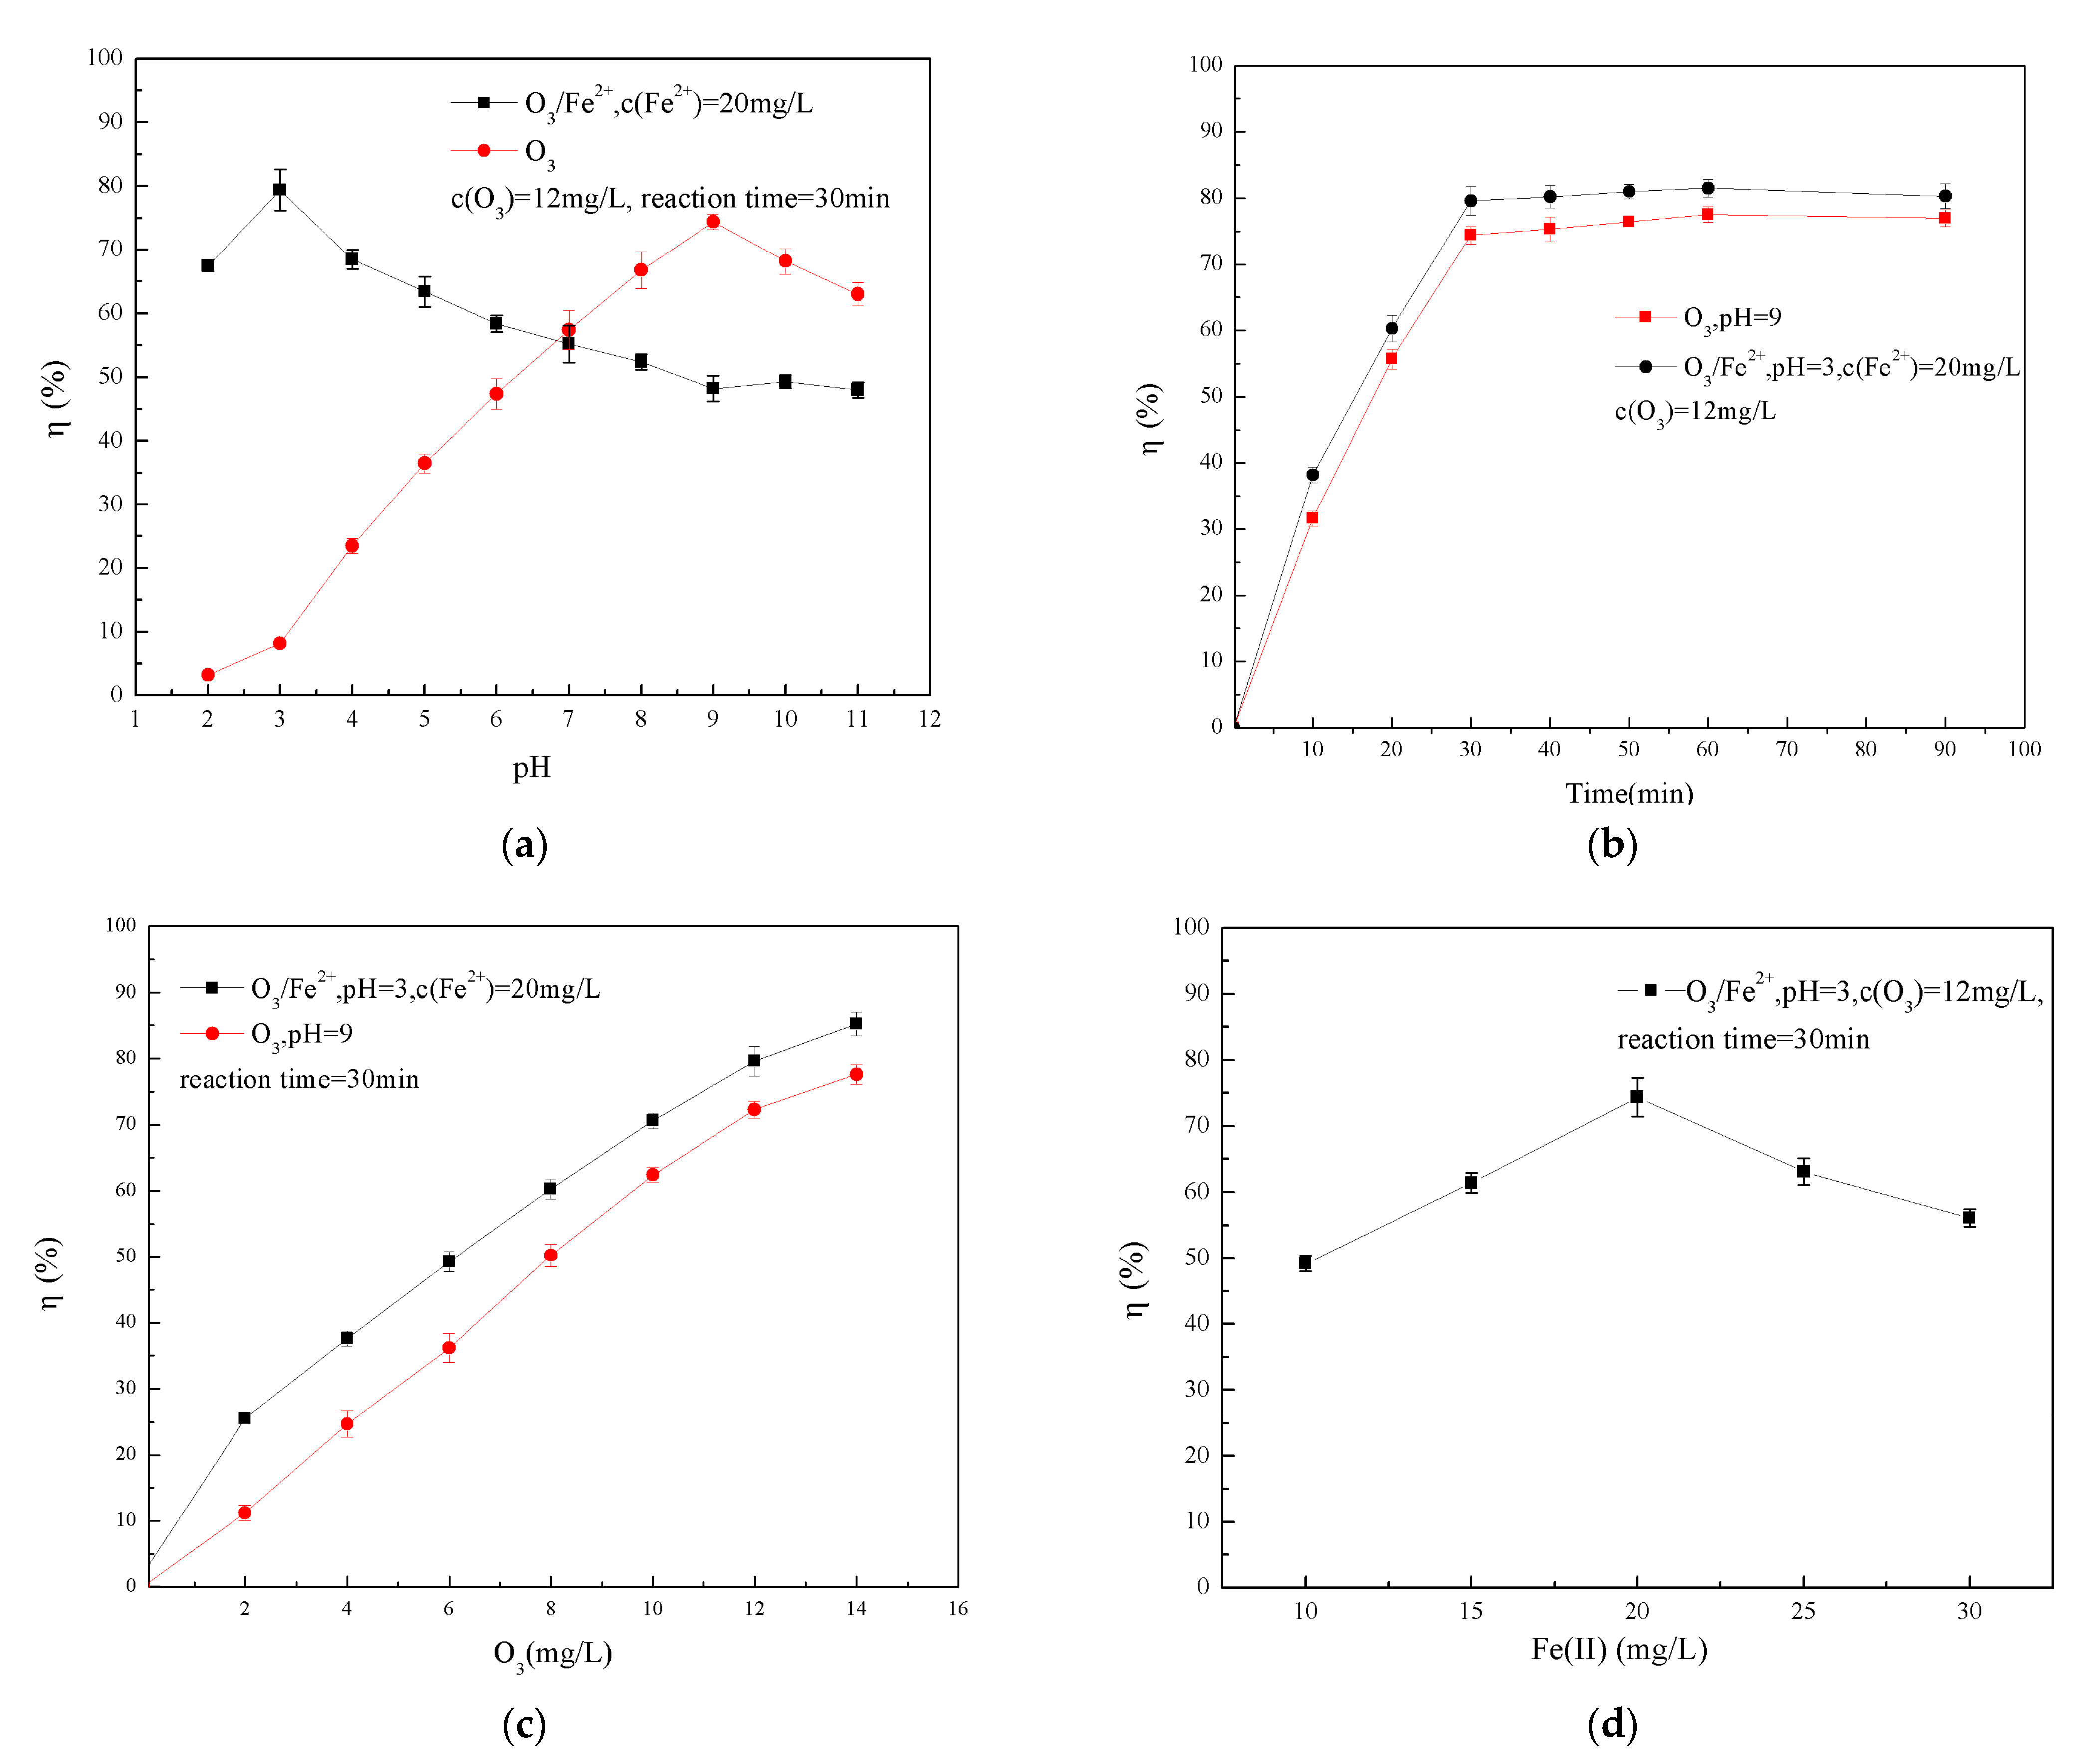
3.1.1. Effect of Initial pH

Figure 1a illustrates the effect of initial pH on the removal of organic phosphorus, in which the ozone concentration was 12 mg/L, the reaction time was 30 min, and the Fe(II) dosage was 20 mg/L.
As shown in Figure 1a, the O3 removal effect under weak alkaline conditions was stronger than under acidic conditions, and at pH values ranging from 2 to 9, the removal rate of organic phosphorus increased from 7.2 to 74%. However, once the pH exceeded 9, the removal rate of organic phosphorus gradually decreased, and the removal rate decreased from 74% to 63% when the pH ranged from 9 to 11. This was mainly attributed to two aspects: the chain reaction of O3 decomposition, which produced HO, was initiated by OH (Equation (1)), and with increasing pH, the rate of O3 decomposition accelerated, in which the reaction efficiency increased accordingly. A previous study showed that the decomposition rate of O3 increased by 10 times for each increase in pH value [28]. However, during the degradation of organic phosphorus, acidic intermediates, such as carboxylic acid were produced, which were neutralized under neutral and alkaline conditions, thus promoting the reaction [29]. However, when the pH continued to increase, the ozone decomposition rate was fast, and a large amount of HO was produced. In addition, HO also reacted with other substances, such as O3 and HO2− in the system, resulting in a decrease in the total amount of oxidants in the system. This led to a decrease in the removal efficiency of organic phosphorus.
When the pH ranged from 2 to 3, the removal rate of organic phosphorus in the THPS wastewater by the O3/Fe(II) system increased from 67.5 to 79.4%. However, with further increases in pH (3–11), the removal rate of organic phosphorus gradually decreased (79.4 to 40.2%), with a large difference between the O3/Fe(II) and O3 systems. This was mainly attributed to the complex existing forms of Fe in the O3/ Fe(II) system, with possible dissolved components, such as Fe(II), Fe(III), Fe(OH)+, Fe(OH)2+, HFeO2, FeO, and FeO2− and insoluble components, such as Fe(OH)2 and Fe(OH)3 [30]. Among these, Fe(II) and Fe(III) were the main effective components in the catalytic reaction, while the solubility of Fe(III) was minimal (Ksp[Fe(OH)3] = 3 × 10−39) in neutral and alkaline environments, and it would completely precipitate when the pH of the solution was greater than 3.7 [31]. Moreover, Fe(II) would be oxidized to Fe(III) by the oxidants in the O3/Fe(II) system, and then precipitate, resulting in the consumption of oxidants and Fe(II), accompanied by a decrease in the oxidation capacity. Therefore, the O3/Fe(II) system had a high removal efficiency under acidic conditions, while the ozone system had a high removal efficiency under weak alkaline conditions.
The removal rates of organic phosphorus in THPS wastewater by the O3 and O3/Fe(II) systems are quite different under different pH conditions. The reason is the difference of reaction mechanism between the two systems. Since THPS does not contain unsaturated bonds, the mechanism of THPS is mainly indirect oxidation, that is, through hydroxyl radicals. In the O3 system, hydroxyl radicals are mainly derived from the decomposition of O3. According to Equations (1) and (2), this is triggered by OH. Therefore, the removal rate is quite low under acidic conditions and will increase with increasing pH. In the O3/Fe(II) system, hydroxyl radicals are mainly generated by the decomposition of O3 catalyzed by Fe(II) (Equations (3)–(7)). Under alkaline conditions, Fe(II) will form an insoluble precipitate with OH, so the removal rate of organic phosphorus were lower under alkaline conditions than that under acid conditions. Meanwhile, parts of Fe(II) were oxidized to Fe(III) by O3, which leads to the additional consumption of O3. Therefore, under alkaline conditions, the removal efficiency of organic phosphorus by the O3/Fe(II) system is lower than that by the O3 system.

3.1.2. Effect of the Reaction Time

Figure 1b illustrates the effect of reaction time on the removal of organic phosphorus (ozone concentration of 12 mg/L, Fe(II) dosage of 20 mg/L). With increased reaction time, the removal rate of organic phosphorus in the THPS wastewater by the O3 and O3/Fe(II) systems gradually increased. When the reaction time ranged from 0 to 30 min, the removal rate of organic phosphorus increased rapidly, which was attributed to the fact that a large amount of organic phosphorus in the wastewater was oxidized to inorganic phosphorus. However, once the reaction time exceeded 30 min, the removal rate of organic phosphorus slowly increased, mainly because O3 in the system was continuously consumed and the oxidant concentration decreased, which decreased the reaction rate. After 60 min, the removal rate of organic phosphorus decreased slightly. At a reaction time of 90 min, the removal rate of organic phosphorus in the water samples was 80.3%, which was 1.2% lower than at 60 min.

3.1.3. Effect of Ozone Concentration

Figure 1c illustrates the effect of ozone concentration on the removal of organic phosphorus (ozone concentration of 12 mg/L, Fe(II) dosage of 20 mg/L, reaction time of 30 min). The removal efficiency of organic phosphorus in the THPS wastewater by the O3/Fe(II) system increased with increasing ozone concentration. The removal rate of organic phosphorus in the wastewater was only 2% when the ozone concentration was 0 mg/L, indicating that Fe(II) alone had almost no degradation effect on THPS. When the ozone concentration increased from 4 to 14 mg/L, the removal rate of organic phosphorus in the wastewater increased from 37.6 to 85.2%. This indicated that O3 played a major role in the degradation of phosphorus in the THPS wastewater by the O3/Fe(II) system, and the removal rate of organic phosphorus was effectively increased by increasing the ozone concentration.

3.1.4. Effect of Fe(II) Dosage

Figure 1d illustrates the effect of Fe(II) dosage on the removal of organic phosphorus (ozone concentration of 12 mg/L, reaction time of 30 min). With an increase in the Fe(II) dosage (10–20 mg/L), the removal rate of organic phosphorus increased (49.2–74.4%). This was attributed to the fact that a higher concentration of Fe(II) produced more HO, and the oxidizing ability for organic phosphorus was stronger [32]. However, with further dosage increases (from 20–30 mg/L), the removal rate decreased to 56.1%. This was because excessive Fe(II) would react with HO in the system (Eq. 13) and consume a part of HO·[33], and our research indicated that a 20 mg/L dose of Fe(II) in the O3/Fe(II) system was appropriate.
Fe2+ + HO· = Fe3+ + OH,

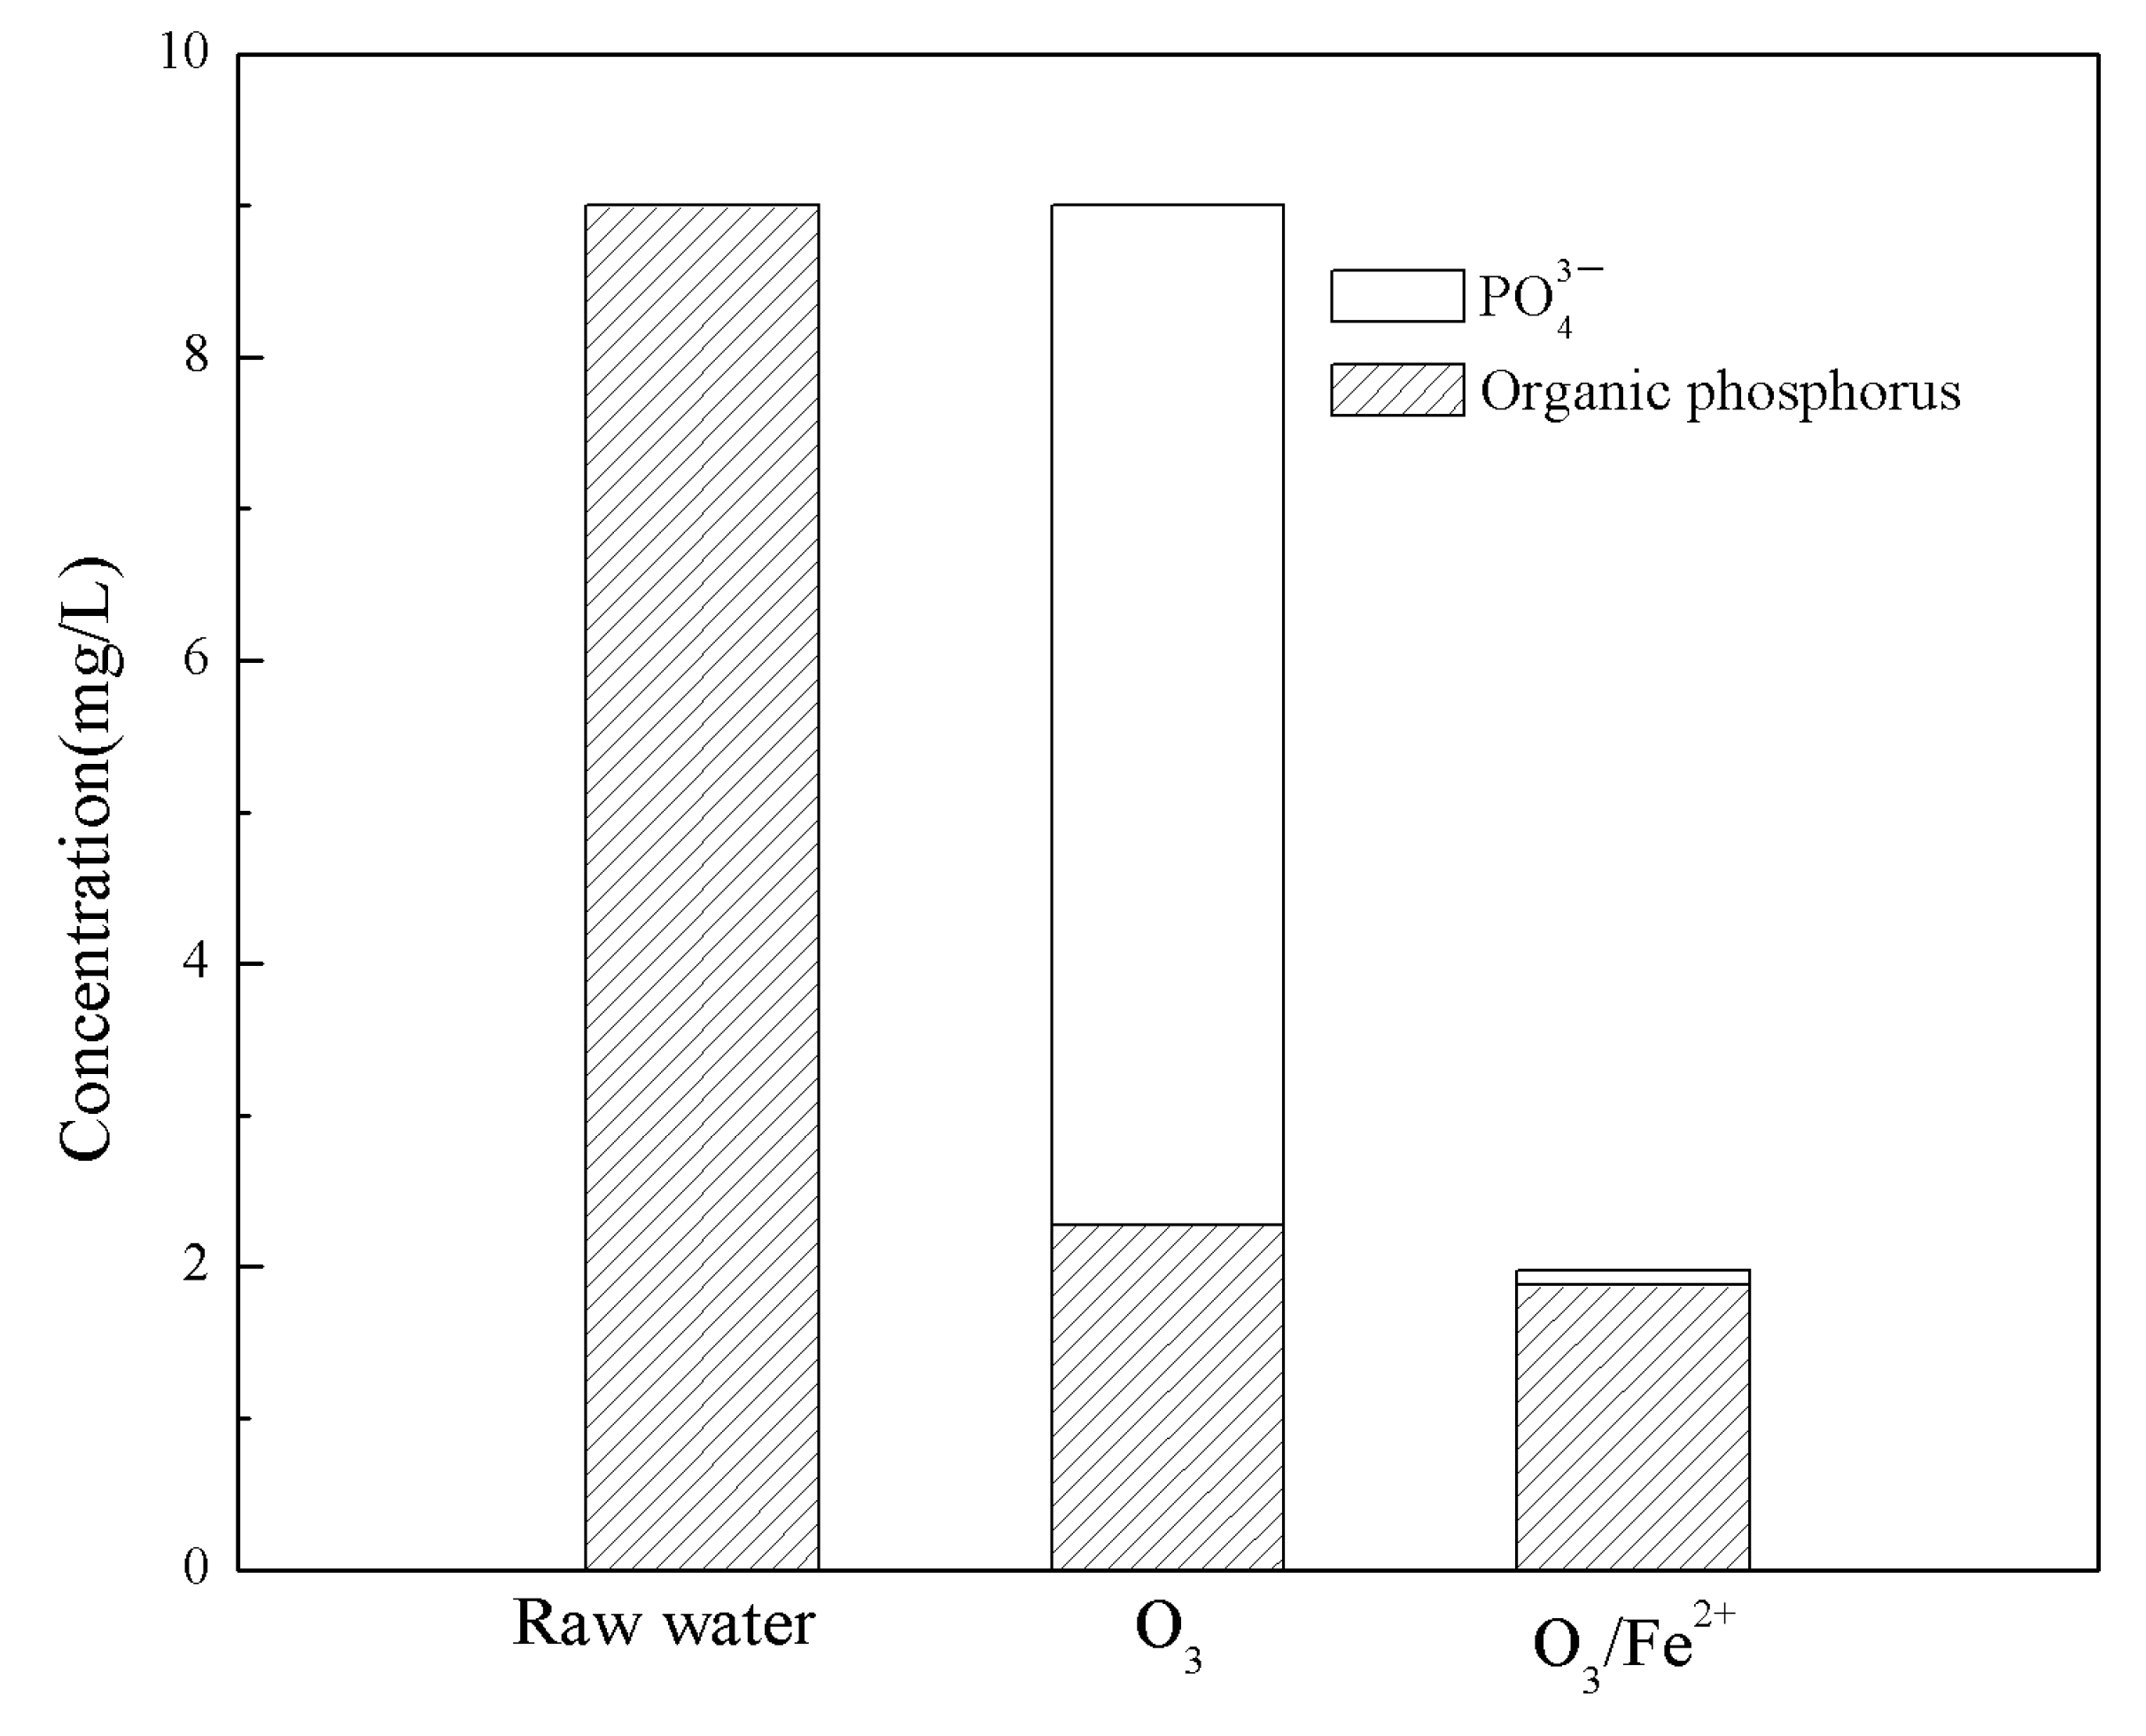
3.1.5. Changes in Phosphorus Form during the Reaction

Phosphorus morphology changes in the O3 and O3/Fe(II) reaction systems were also explored (Figure 2). As shown in Figure 2, ozonation only converted a portion of organic phosphorus in the THPS wastewater into inorganic phosphorus, but did not remove total phosphorus from the wastewater. Therefore, O3 oxidation would have to be combined with other processes, such as coagulation, to remove total phosphorus in THPS wastewater. In the O3/Fe(II) system, inorganic phosphorus can form insoluble precipitates Fe3(PO4)2(Ksp[Fe3(PO4)2] = 1.0 × 10−39) with Fe(II) and FePO4(Ksp(FePO4) = 1.0 × 10⁻²²) with Fe(III); thus, organic phosphorus and total phosphorus could be effectively removed. Therefore, the O3/Fe(II) system could be used as a separate treatment process for THPS wastewater.

3.2. Response Surface Experiments

3.2.1. Design of the Test Scheme

According to the single-factor experiments, the values of each factor were as follows: initial pH (A) of 2–4, reaction time (B) of 30–90 min, ozone concentration (C) of 10–14 mg/L, and Fe(II) dosage (D) of 4–6 mg/L. The Box-Behnken model was established using Design Expert software, and four factors and three levels of experiments were designed, as shown in Table 1. Each factor and level were input into the system in turn, and the software automatically generated 29 experimental runs. The experimental scheme and results are shown in Table 2.

3.2.2. Establishment and Fitting Analysis of the Regression Model

The test data in Table 2 were fitted by Design Expert software, where the quadric polynomial for establishing the removal rate of organic phosphorus (Y) with respect to the pH (A), reaction time (B), ozone concentration (C) and Fe(II) dosage (D) was established (Equation (14)), and the results of variance analysis and significance test are shown in Table 3.
Y = 79.48 + 2.31A + 0.075B + 5.64C − 0.39D − 0.45AB − 0.53AD + 0.55BC + 0.28BD − 0.63CD − 10.29A2 − 0.61B2 − 0.37C2 − 10.27D2
The F values in the table represent the significance of the correlation coefficient, where the significance of the correlation coefficient was stronger with a larger F value [34]. The F value of the regression model was 57.44, and (Prob > F) < 0.0001, which indicated that the model was extremely remarkable and exhibited good fitting accuracy. In addition, Pr = 0.1688 > 0.05, which indicated a very small gap between the model and the experiment, and there was no false fitting factor. This showed a good degree of fit in the set regression area for the entire study. The order of significance of each factor for the organic phosphorus removal rate results followed C (180) > A (30) > D (0.87) > B (0.03), which was consistent with the correlation coefficient order of the quadric equation. The error of the regression equation was further analyzed, and the precision, reliability, and multiple correlation coefficient of the statistical equation are shown in Table 4.
The value of R2 for the model was 0.98, indicating that the model could meet 98% of the response changes within the variable study range. The difference between the corrected coefficient R2adj (0.97) and R2pred (0.91) was less than 0.2, indicating that the model had a high degree of fit. In addition, AP (27) > 4, indicating a sufficient regression response signal. Moreover, the coefficient of variation CV (2.06%) < 10%, indicating that 2.06% of the variation could not be explained by this model, and the precision of this model was high. Therefore, this model could accurately describe the real relationship between the initial pH, reaction time, Fe(II) dosage, ozone concentration, and the organic phosphorus removal rate. Therefore, the regression model could be used to optimize and analyze the reaction conditions of treating THPS wastewater with O3/Fe(II).

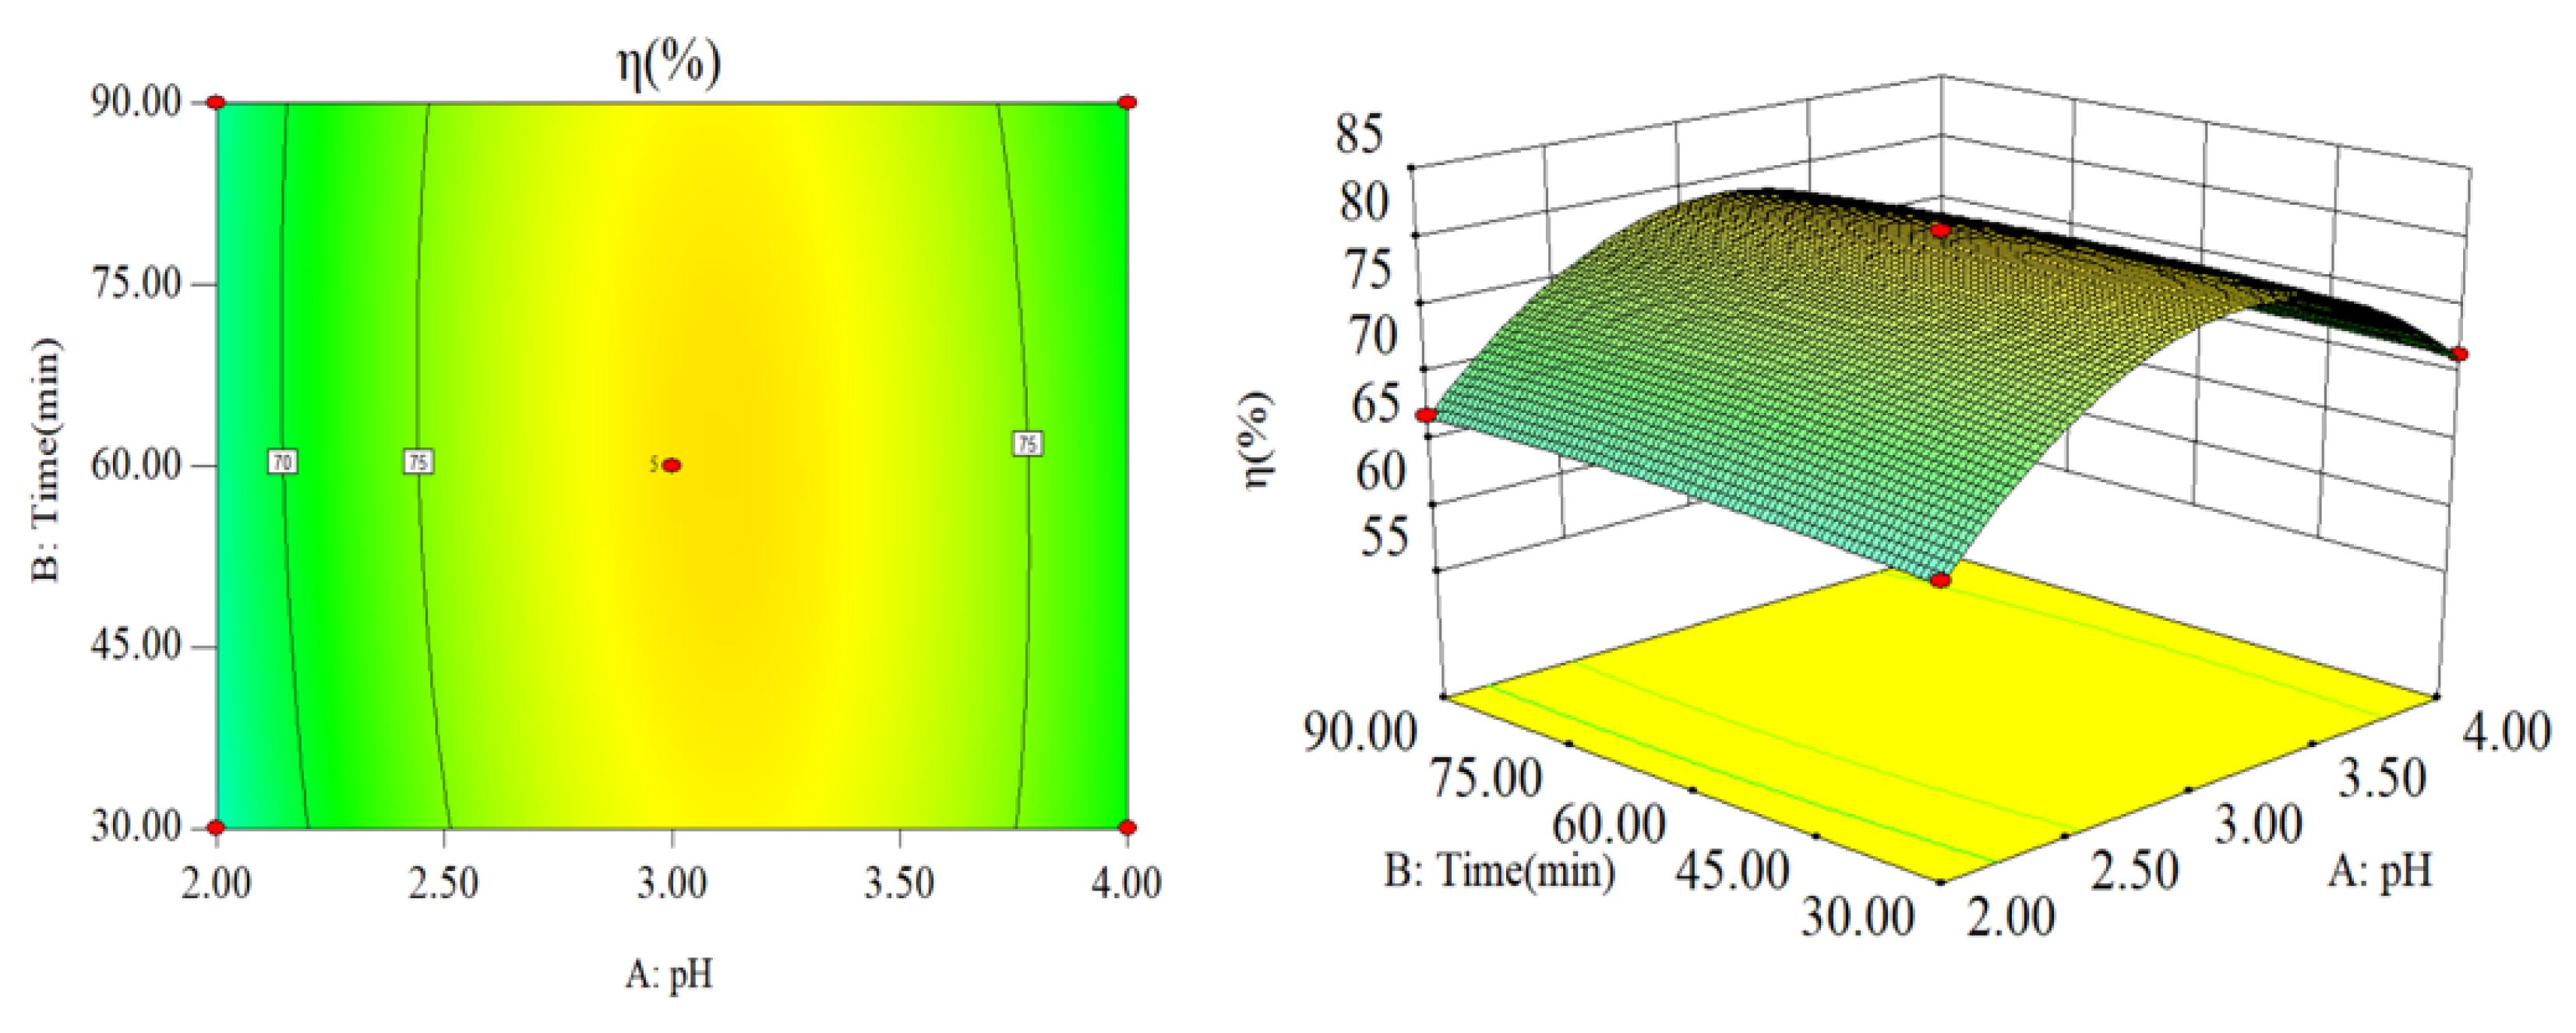
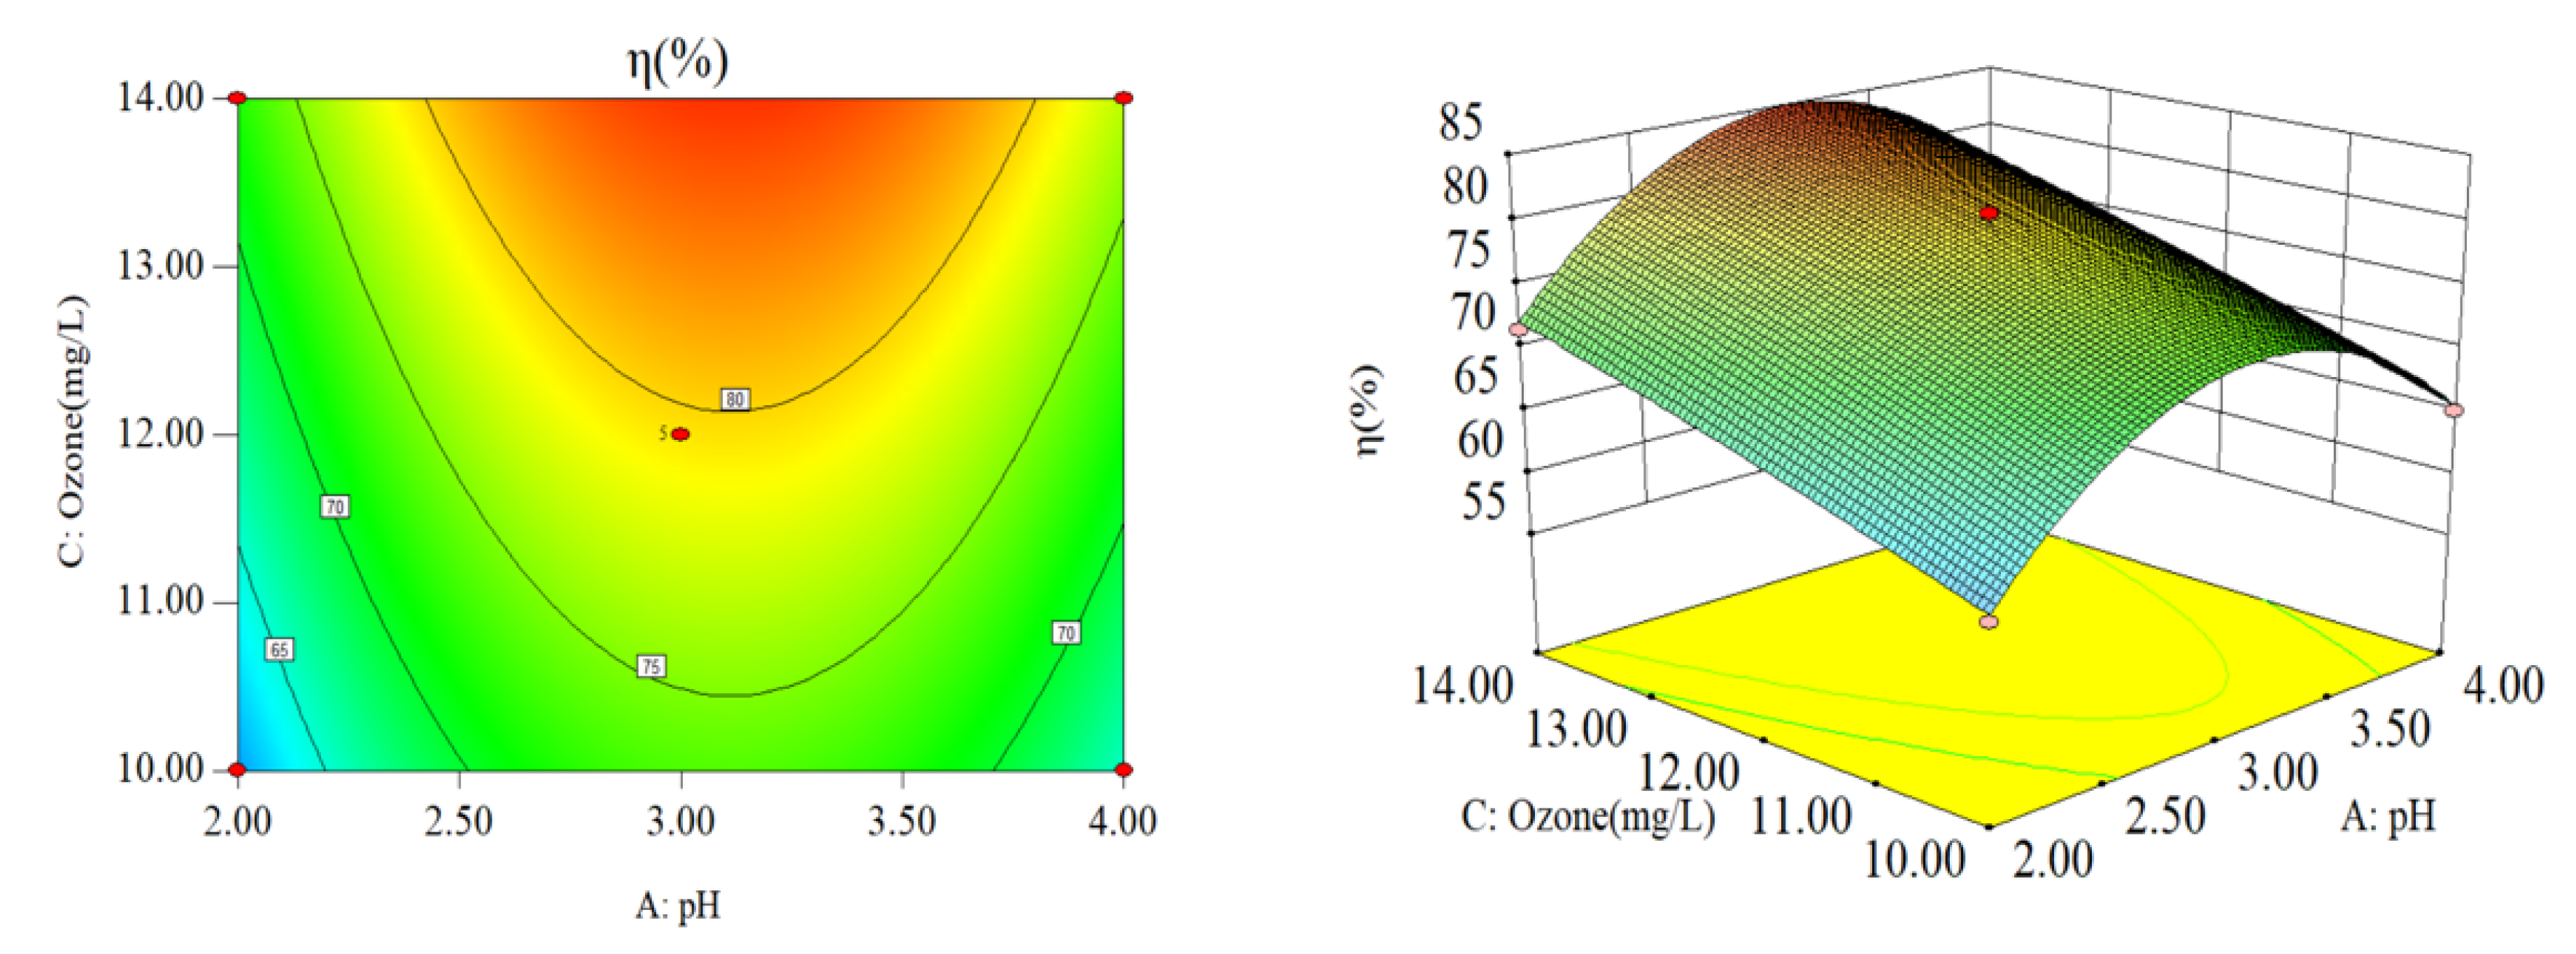
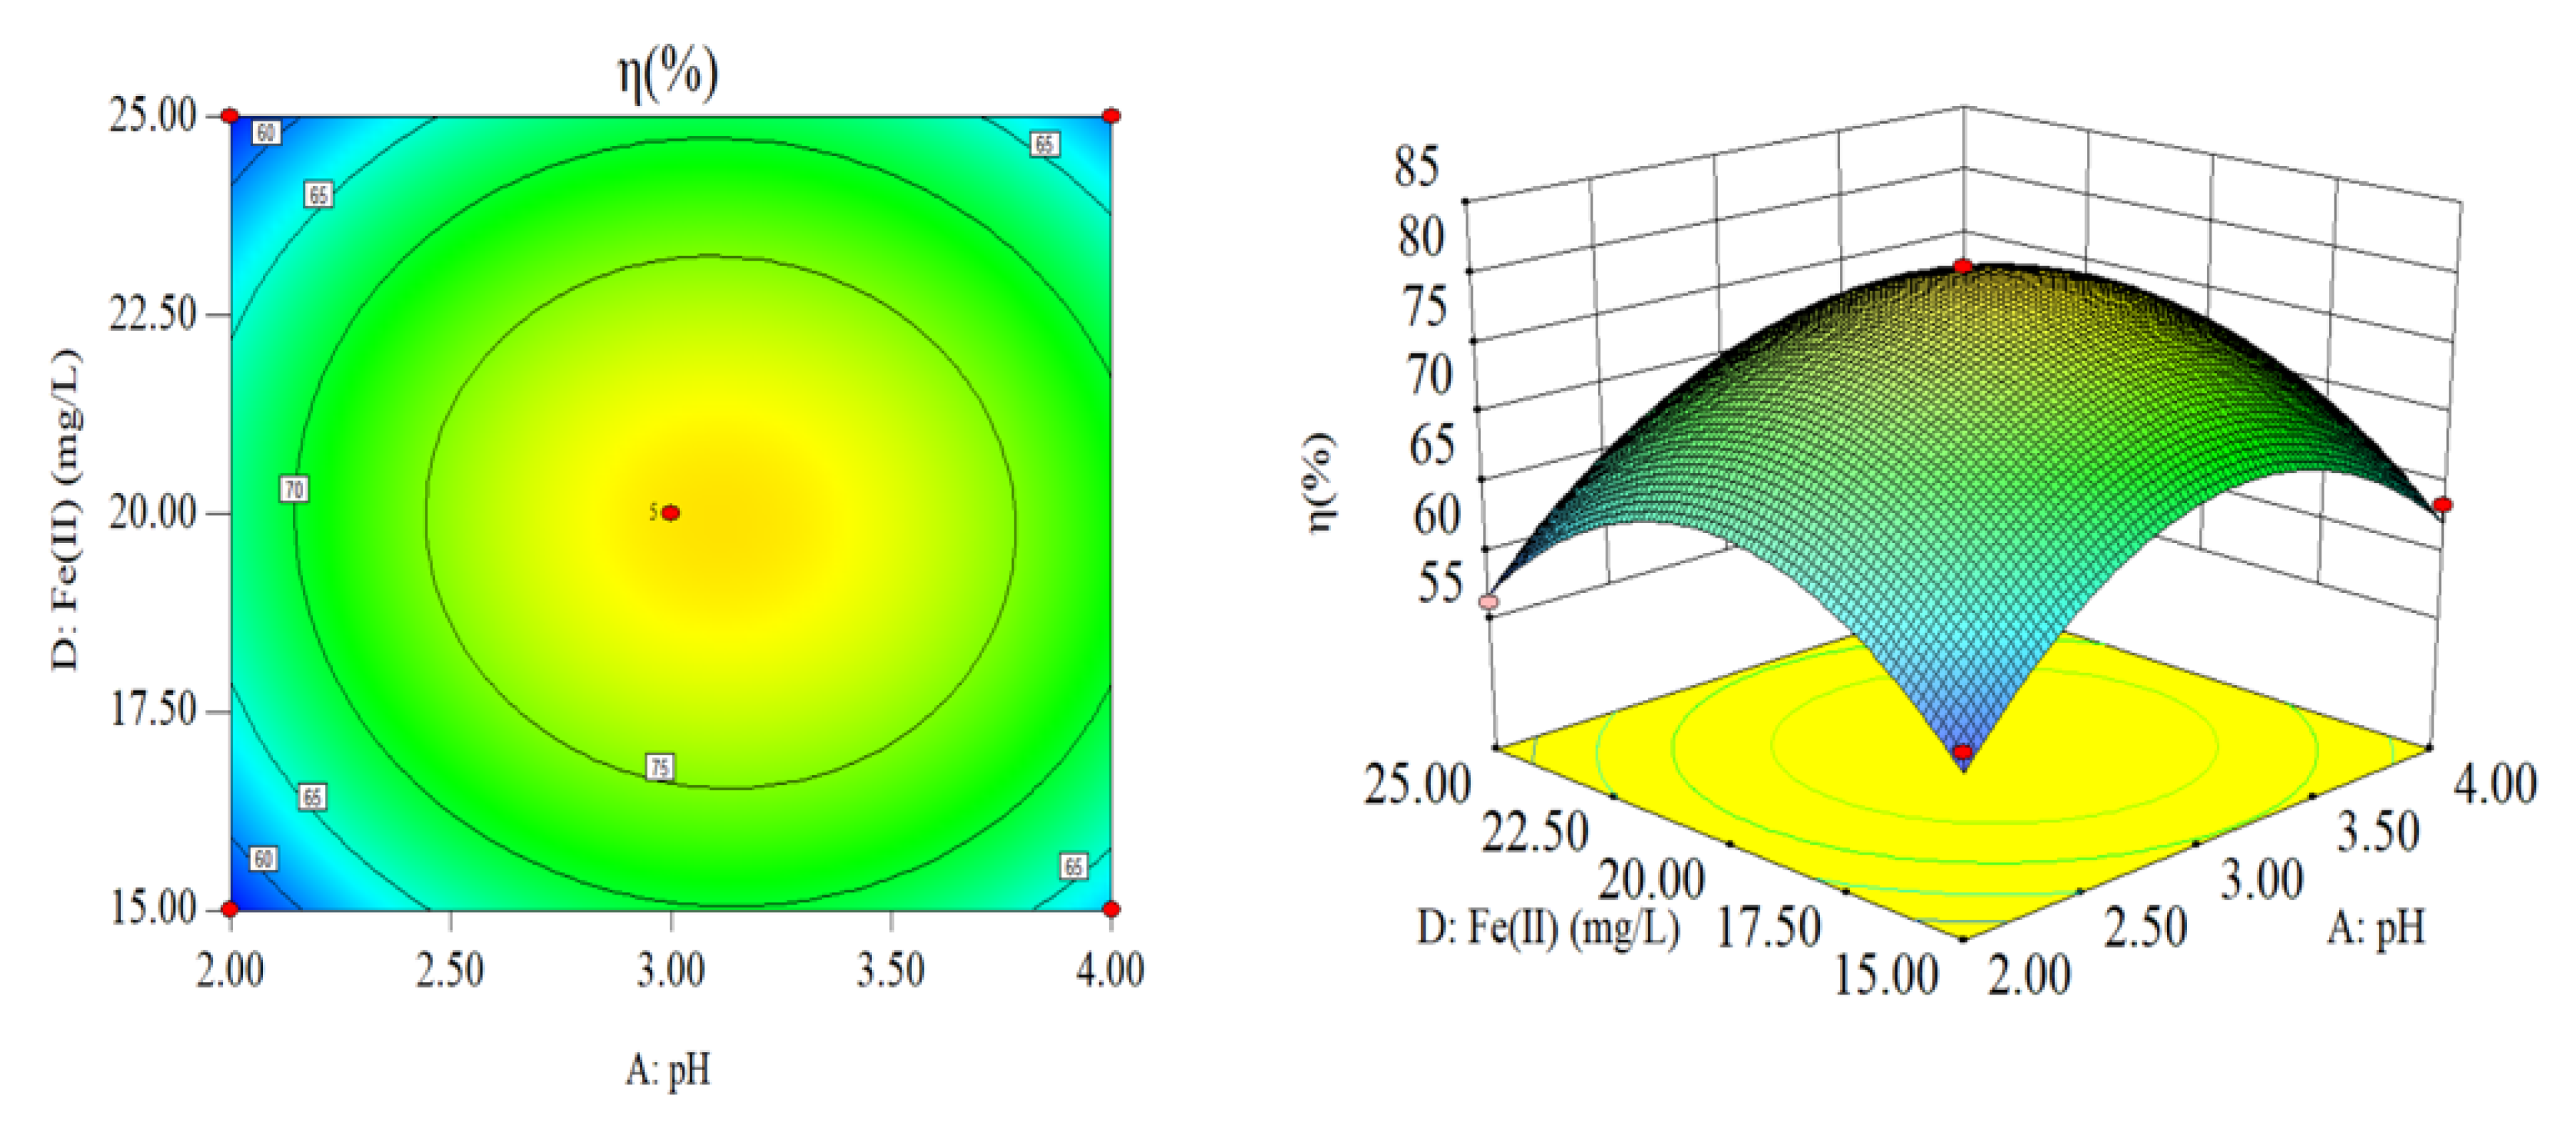
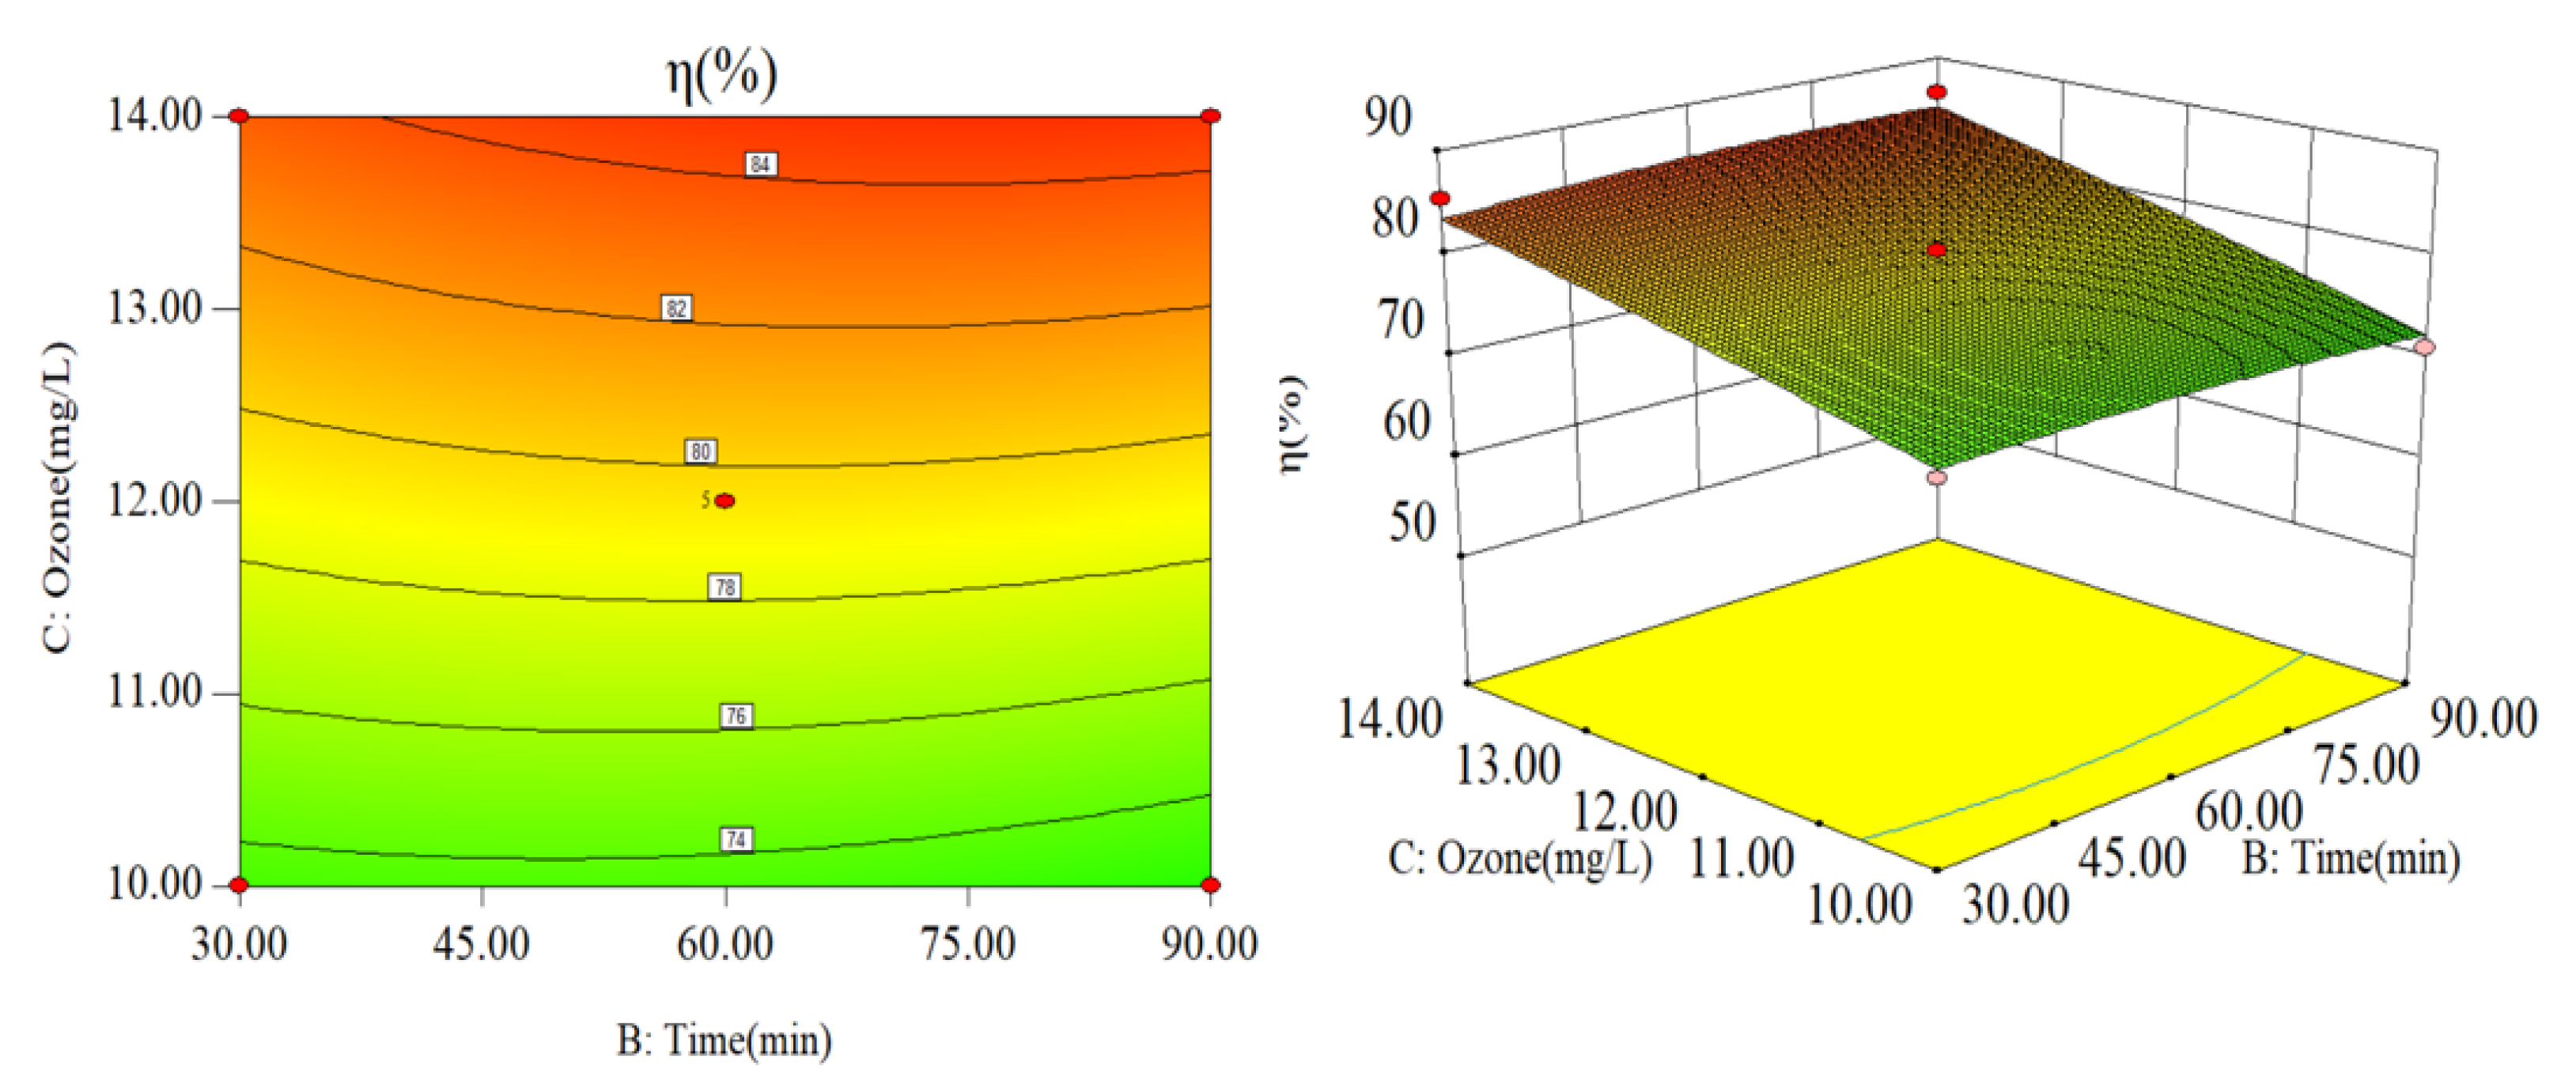
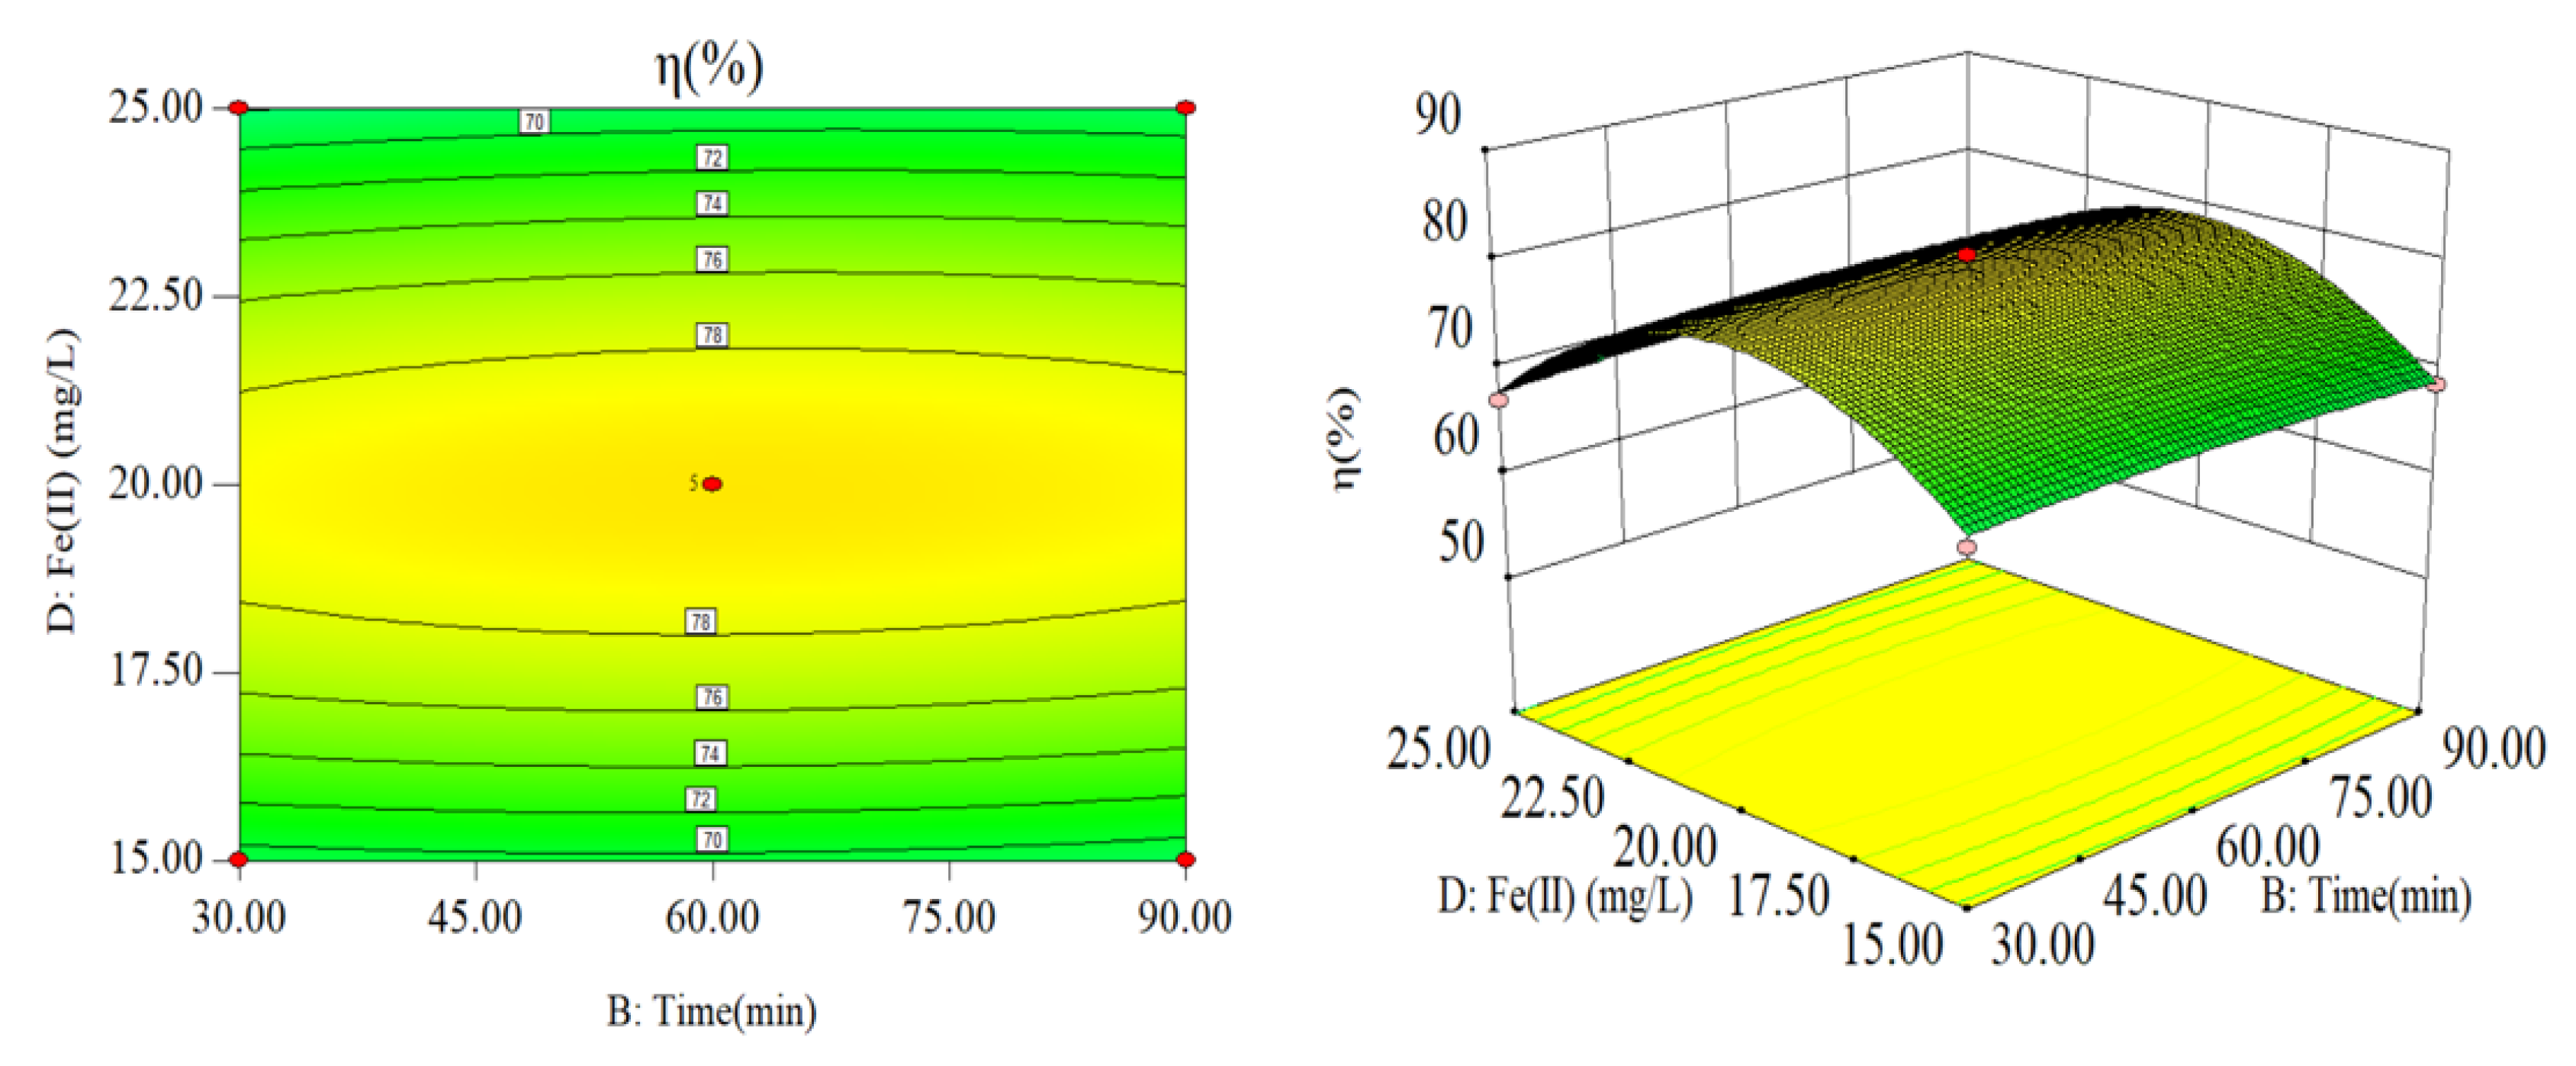
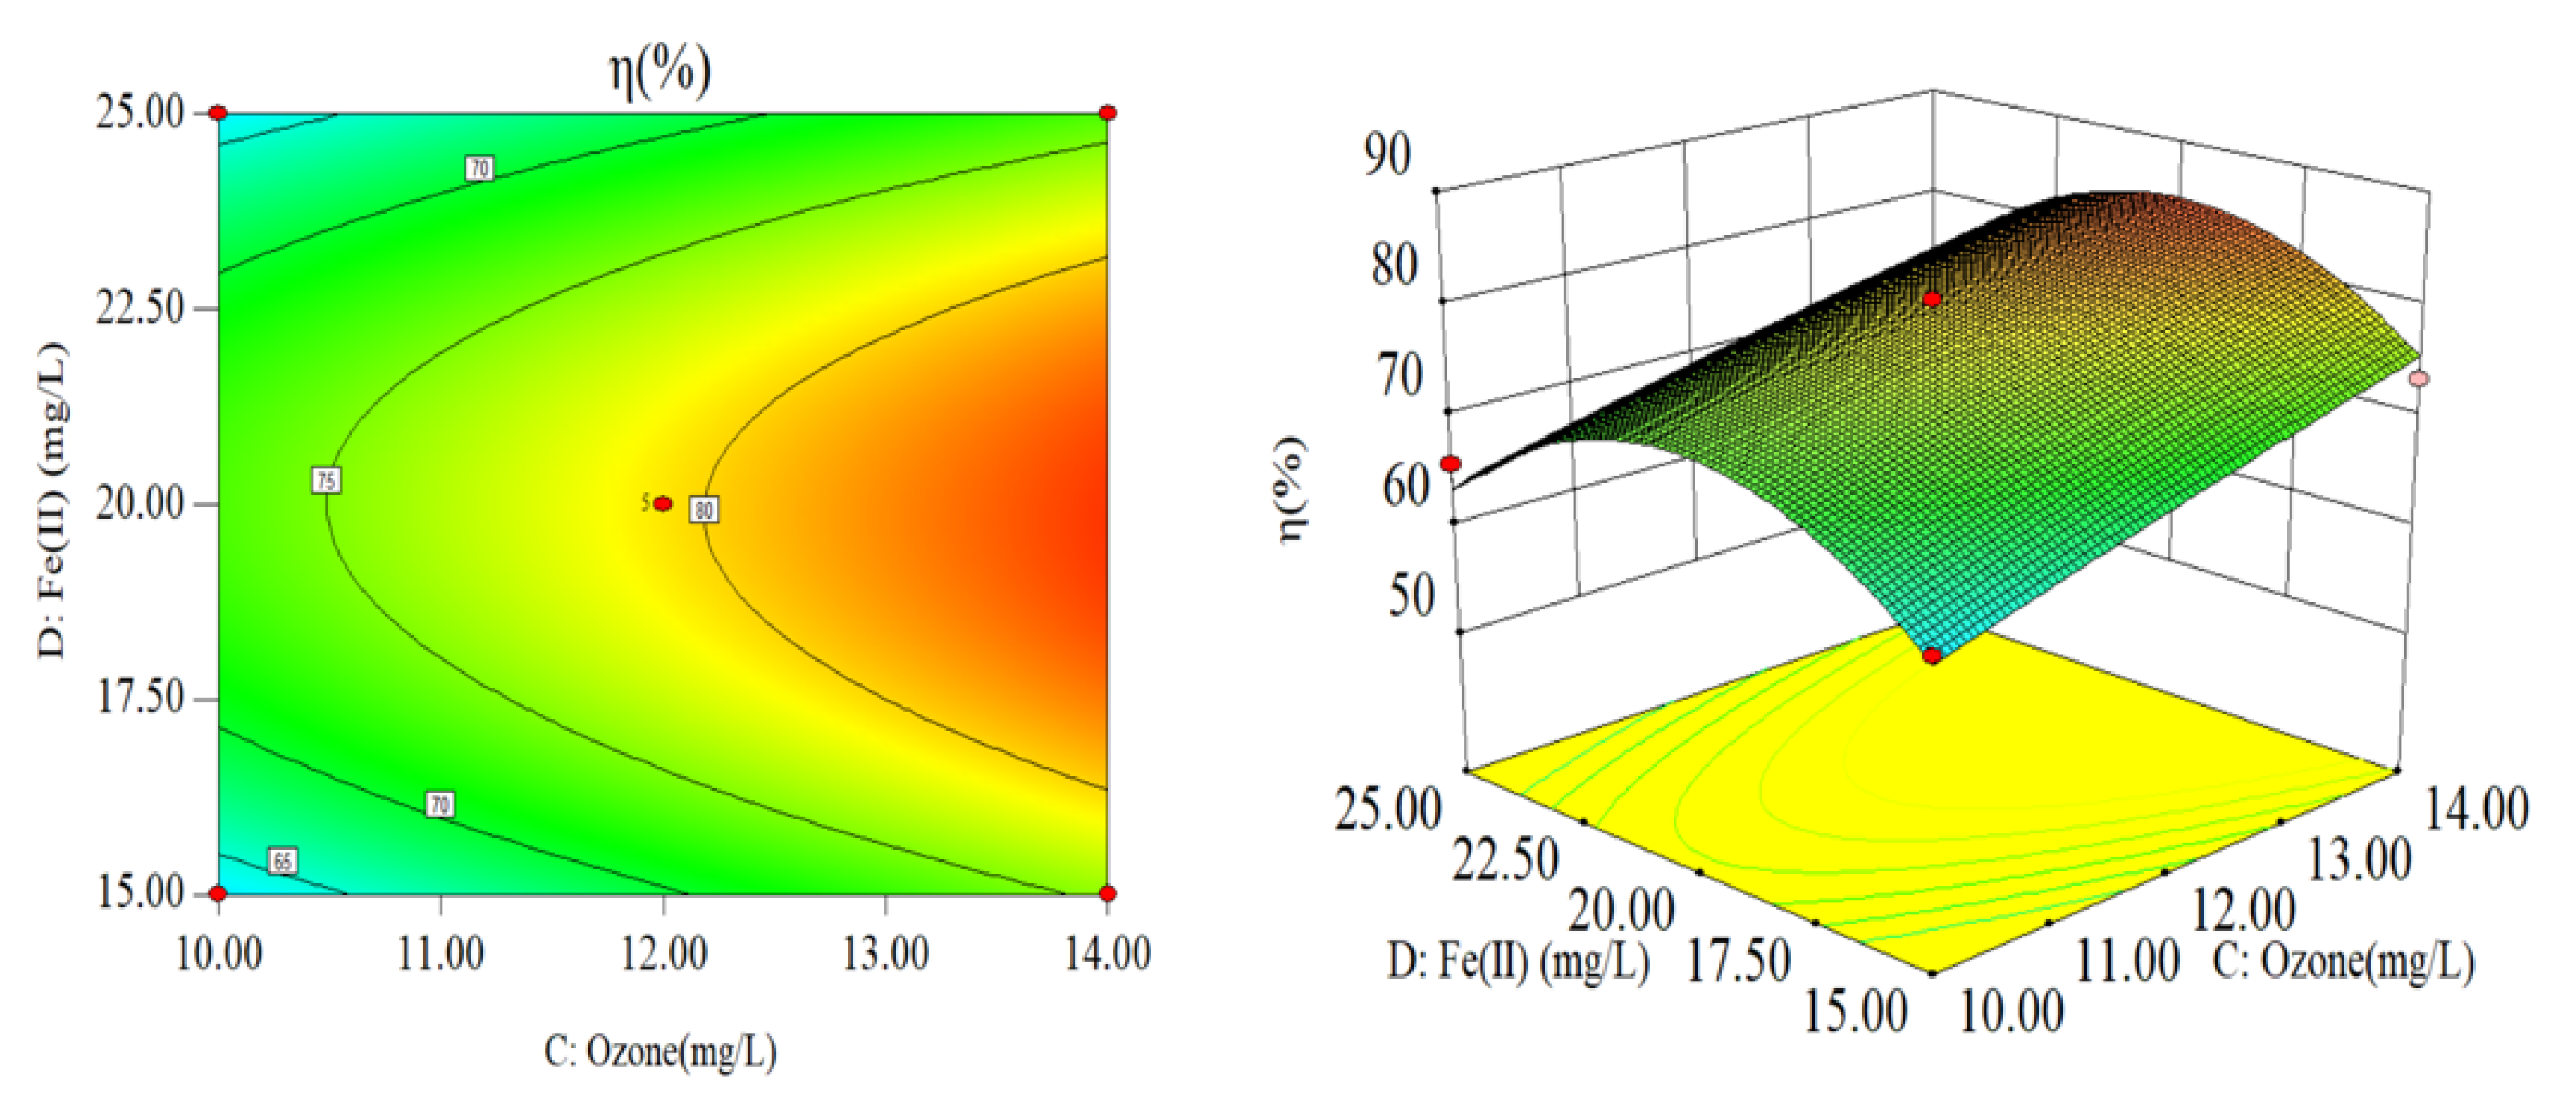
3.2.3. Response Surface Analysis

The contour and response surface diagram directly showed the influence of the other two factors on the results when the other factors remained the same; thus, the interactions between the different factors could be observed, where in the response surface graphs, the darker colors indicate a high removal efficiency [35]. As shown in Figure 3, Figure 4, Figure 5, Figure 6, Figure 7 and Figure 8, the contour and three-dimensional response surface maps of the interactions between the various test factors were drawn using Design Expert software according to regression Equation (14).
As shown in Figure 4, Figure 6 and Figure 8, the values of η increased with increasing ozone concentration. As shown in Figure 3, Figure 4, Figure 5, Figure 6, Figure 7 and Figure 8, under certain conditions, the initial pH, reaction time, and Fe(II) dosage all had an optimal value to optimize the effects of organic phosphorus (η). Thus, the quadratic models obtained by RSM could be used to optimize the operating conditions to obtain a maximum value of η within the experimental design range.

3.2.4. Optimization and Validation Experiments

A, B, C, and D, which corresponded to the extreme points obtained by solving the quadric polynomial of the four variables, were the optimal test conditions within the experimental range. The optimal conditions were as follows: pH of 3.10, a reaction time of 73.88 min, Fe(II) dosage of 19.77 mg/L, and ozone concentration of 14.00 mg/L. The predicted removal rate of organic phosphorus reached 86.04%. To verify the reliability of this regression model, three parallel experiments were carried out under the above optimal conditions.
The experimental results showed that the average removal rate of organic phosphorus was 86.95%, which was higher than the predicted value. In addition, the error between the experimental and predicted values was small (0.91%), indicating that the experimental value fit well with the predicted value. This showed that the regression equation was more accurate and reliable for predicting the experimental conditions and results of O3/Fe(II) for removing organic phosphorus from THPS wastewater, with a certain practical application value.

4. Conclusions

In this experiment, the effects of initial pH, reaction time, ozone concentration, and Fe(II) dosage on the removal efficiency of organic phosphorus in the THPS wastewater by O3/Fe(II) were studied by single-factor experiments, and the reaction conditions were optimized by Box-Behnken design in response to surface analysis. The main conclusions follow.
(1)
Ozone oxidation could only convert most of the organic phosphorus in the THPS wastewater into inorganic phosphorus, and it could not remove phosphorus from the water. However, O3/Fe(II) could remove orthophosphate after oxidation via precipitation.
(2)
The single factor experiment results showed that the optimal experimental conditions of O3/Fe(II) removal of organic phosphorus in the THPS wastewater were: initial pH of 3, reaction time of 60 min, and Fe(II) dosage of 20 mg/L. Due to the limitations of the laboratory conditions, 14 mg/L was the maximum and best ozone concentration conditions. The optimal value of ozone concentration needs to be founded in further research.
(3)
The response surface experiment results showed that the model had good regression, and the lack of fit was not significant. The initial pH and ozone concentration had significant effects on the removal of organic phosphorus.
(4)
The optimal reaction conditions predicted by the response surface model were: pH of 3.10, reaction time of 74.77 min, Fe(II) dosage of 19.77 mg/L, and ozone concentration of 14 mg/L. The removal rate of organic phosphorus in the verification experiment was 86.04%, and the experimental value fit well with the simulation value, with a deviation of 0.91%.
Overall, O3/Fe(II) is an effective method to remove organic phosphorus method in THPS wastewater, and its comparison with other methods is shown in Table 5 [4,36,37].

Author Contributions

Conceptualization, H.X. and Y.P.; methodology, Y.P.; investigation, Y.P., Y.Z., Y.L., D.D. and M.R.; resources, Y.P. and M.R.; writing—original draft preparation, Y.P.; writing—review and editing, Y.P.; project administration, H.X.; funding acquisition, H.X. All authors have read and agreed to the published version of the manuscript.

Funding

This research was funded by Central Plains Environment Protection Co., Ltd. and the Major Science and Technology Program for Water Pollution Control and Treatment of China. Grant number: 2017ZX07602-001-002.

Data Availability Statement

This paper has presented the valid data of all the experiments in this study, and the original data are available on request from the corresponding author.

Conflicts of Interest

The authors declare no conflict of interest.

References

  1. Okoro, C.C. The Biocidal Efficacy of Tetrakis–hydroxymethyl Phosphonium Sulfate (THPS) Based Biocides on Oil Pipeline PigRuns Liquid Biofilms. Pet. Sci. Technol. 2015, 33, 1366–1372. [Google Scholar] [CrossRef]
  2. Xiao, B.; Li, H.; Yan, H.; Guo, X. Evaluation of the sludge reduction effectiveness of a metabolic uncoupler–tetrakis (hydroxymethyl) phosphonium sulfate in anaerobic/anoxic/oxic process. Desalin. Water Treat. 2016, 57, 5772–5780. [Google Scholar] [CrossRef]
  3. Fathima, N.N.; Chandrabose, M.; Aravindhan, R.; Rao, J.R.; Nair, B.U. Iron phosphonium combination tanning: Towards a win–win approach. J. Am. Leather Chem. Assoc. 2005, 100, 273–281. [Google Scholar]
  4. Liu, F.Y.; Hong, M.Z.; Liu, D.M.; Li, Y.W.; Shou, P.S.; Yan, H.; Shi, G.Q. Biodegradation of methyl parathion by Acinetobacter radioresistens USTB-04. J. Environ. Sci. 2007, 19, 1257–1260. [Google Scholar] [CrossRef]
  5. Zhao, J.W.; Yuan, Q.J.; Sun, Y.J.; Zhang, J.; Zhang, D.L.; Bian, R.X. Effect of fluoxetine on enhanced biological phosphorus removal using a sequencing batch reactor. Bioresour. Technol. 2021, 320, 124396. [Google Scholar] [CrossRef]
  6. Okoro, C.C.; Samuel, O.; Lin, J. The effects of Tetrakis-hydroxymethyl phosphonium sulfate (THPS), nitrite and sodium chloride on methanogenesis and corrosion rates by methanogen populations of corroded pipelines. Corros. Sci. 2006, 112, 507–516. [Google Scholar] [CrossRef]
  7. Moiseev, D.V.; James, B.R. Tetrakis(hydroxymethyl)phosphonium salts: Their properties, hazards and toxicities. Phosphorus Sulfur Silicon Relat. Elem. 2019, 195, 263–279. [Google Scholar] [CrossRef]
  8. Sillanpaa, M.; Ncibi, M.C.; Matilainen, A. Advanced oxidation processes for the removal of natural organic matter from drinking water sources: A comprehensive review. J. Environ. Manag. 2018, 208, 56–76. [Google Scholar] [CrossRef]
  9. Wang, J.; Xu, L. Advanced Oxidation Processes for Wastewater Treatment: Formation of Hydroxyl Radical and Application. Crit. Rev. Environ. Sci. Technol. 2012, 42, 251–325. [Google Scholar] [CrossRef]
  10. Wang, J.; Chen, H. Catalytic ozonation for water and wastewater treatment: Recent advances and perspective. Sci. Total Environ. 2020, 704, 135249. [Google Scholar] [CrossRef]
  11. Ma, D.; Yi, H.; Lai, C.; Liu, X.; Huo, X.; An, Z.; Li, L.; Fu, Y.; Li, B.; Zhang, M.; et al. Critical review of advanced oxidation processes in organic wastewater treatment. Chemosphere 2021, 275, 130104. [Google Scholar] [CrossRef] [PubMed]
  12. Malik, S.N.; Ghosh, P.C.; Vaidya, A.N.; Mudliar, S.N. Hybrid ozonation process for industrial wastewater treatment: Principles and applications: A review. J. Water Process. Eng. 2020, 35, 101193. [Google Scholar] [CrossRef]
  13. Yang, L.; Sheng, M.; Li, Y.; Xue, W.; Li, K.; Cao, G. A hybrid process of Fe-based catalytic ozonation and biodegradation for the treatment of industrial wastewater reverse osmosis concentrate. Chemosphere 2020, 138, 124639. [Google Scholar] [CrossRef] [PubMed]
  14. Zeng, Z.; Zou, H.; Xin, L.; Sun, B.; Chen, J.; Shao, L. Ozonation of Phenol with O3/Fe(II) in Acidic Environment in a Rotating Packed Bed. Ind. Eng. Chem. Res. 2012, 51, 10509–10516. [Google Scholar] [CrossRef]
  15. Zeng, Z.; Zou, H.; Xin, L.; Sun, B.; Chen, J.; Shao, L. Ozonation of acidic phenol wastewater with O3/Fe(II) in a rotating packed bed reactor: Optimization by response surface methodology. Chem. Eng. Process. 2012, 60, 1–8. [Google Scholar] [CrossRef]
  16. Yu, D.; Wu, M.; Hu, Q.; Wang, L.; Lv, C.; Zhang, L. Iron–based metal–organic frameworks as novel platforms for catalytic ozonation of organic pollutant: Efficiency and mechanism. J. Hazard. Mater. 2019, 367, 456–464. [Google Scholar] [CrossRef]
  17. Yu, D.; Wang, L.; Yang, T.; Yang, G.; Wang, D.; Ni, D.; Wu, M. Tuning Lewis acidity of iron–based metal–organic frameworks for enhanced catalytic ozonation. Chem. Eng. J. 2021, 404, 0127075. [Google Scholar] [CrossRef]
  18. Nawrocki, J.; Kasprzyk–Hordern, B. The efficiency and mechanisms of catalytic ozonation. Appl. Catal. B Environ. 2010, 99, 27–42. [Google Scholar] [CrossRef]
  19. Wu, C.; Kuo, C.; Chang, C. Homogeneous catalytic ozonation of CI Reactive Red 2 by metallic ions in a bubble column reactor. J. Hazard. Mater. 2008, 154, 748–755. [Google Scholar] [CrossRef]
  20. Nidheesh, P.V. Heterogeneous Fenton catalysts for the abatement of organic pollutants from aqueous solution: A review. RSC Adv. 2015, 5, 40552–40577. [Google Scholar] [CrossRef]
  21. Box, G.; Wilson, K. On the experimental attainment of optimum conditions. J. R. Stat. Soc. Ser. B Stat. Methodol. 1951, 13, 1–38. [Google Scholar] [CrossRef]
  22. Candioti, L.V.; De Zan, M.M.; Camara, M.S.; Goicoechea, H.C. Experimental design and multiple response optimization. Using the desirability function in analytical methods development. Talanta 2014, 124, 123–138. [Google Scholar] [CrossRef] [PubMed]
  23. Zhou, Z.; Li, D.; Xiao, T.; Cao, Z.; Du, W. Response surface guided adaptive slope reliability analysis in spatially varying soils. Comput. Geotech. 2021, 132, 103966. [Google Scholar] [CrossRef]
  24. Witek–Krowiak, A.; Chojnacka, K.; Podstawczyk, D.; Dawiec, A.; Pokomeda, K. Application of response surface methodology and artificial neural network methods in modelling and optimization of biosorption process. Bioresour. Technol. 2014, 160, 150–160. [Google Scholar] [CrossRef]
  25. Danmaliki, G.I.; Saleh, T.A.; Shamsuddeen, A.A. Response surface methodology optimization of adsorptive desulfurization on nickel/activated carbon. Chem. Eng. J. 2017, 313, 993–1003. [Google Scholar] [CrossRef]
  26. Ruqayyah, T.I.D.; Jamal, P.; Alam, M.Z.; Mirghani, M.E.S.; Jaswir, I.; Ramli, N. Application of response surface methodology for protein enrichment of cassava peel as animal feed by the white–rot fungus Panus tigrinus M609RQY. Food Hydrocoll. 2014, 42, 298–303. [Google Scholar] [CrossRef]
  27. Bader, H.; Hoigne, J. Determination of ozone in water by the indigo method. Water Res. 1981, 15, 449–456. [Google Scholar] [CrossRef]
  28. Wei, C.; Ma, C. Quantitative prediction of direct and indirect dye ozonation kinetics. Water Res. 2000, 34, 3153–3160. [Google Scholar]
  29. Sumegová, L. Degradation of Benzothiazole by Ozonation and Adsorptive Ozonation. Chem. Biochem. Eng. Q. 2015, 29, 63–66. [Google Scholar] [CrossRef]
  30. Chen, Y.; Hsu, Y.; Lin, C.; Tai, C.; Liu, H. Volatile organic compounds absorption in a cross–flow rotating packed bed. Environ. Sci. Technol. 2008, 42, 2631–2636. [Google Scholar] [CrossRef]
  31. Piera, E.; Calpe, J.C.; Brillas, E.; Domenech, X.; Peral, J. 2,4–Dichlorophenoxyacetic acid degradation by catalyzed ozonation: TiO2/UVA/O–3 and Fe(II)/UVA/O–3 systems. Appl. Catal. B Environ. 2000, 27, 169–177. [Google Scholar] [CrossRef]
  32. Li, X.; Chen, W.; Ma, L.; Huang, Y.; Wang, H. Characteristics and mechanisms of catalytic ozonation with Fe–shaving–based catalyst in industrial wastewater advanced treatment. J. Clean Prod. 2019, 222, 174–181. [Google Scholar] [CrossRef]
  33. Beltran, F.J.; Rivas, F.J.; Montero-de-Espinosa, R. Iron type catalysts for the ozonation of oxalic acid in water. Water Res. 2005, 39, 3553–3564. [Google Scholar] [CrossRef] [PubMed]
  34. Gadekar, M.R.; Ahammed, M.M. Modelling dye removal by adsorption onto water treatment residuals using combined response surface methodology-artificial neural network approach. J. Environ. Manag. 2019, 231, 241–248. [Google Scholar] [CrossRef]
  35. Mohammad, A.T.; Abdulhameed, A.S.; Jawad, A.H. Box-Behnken design to optimize the synthesis of new crosslinked chitosan-glyoxal/TiO2 nanocomposite: Methyl orange adsorption and mechanism studies. Int. J. Biol. Macromol. 2019, 129, 98–109. [Google Scholar] [CrossRef] [PubMed]
  36. Chaturvedi, S.; Dave, P.N. Removal of iron for safe drinking water. Desalination 2012, 303, 1–11. [Google Scholar] [CrossRef]
  37. Xu, X.Y.; Cheng, Y.; Zhang, T.T.; Ji, F.Y.; Xu, X. Treatment of pharmaceutical wastewater using interior micro-electrolysis/Fenton oxidation-coagulation and biological degradation. Chemosphere 2016, 152, 23–30. [Google Scholar] [CrossRef]
Figure 1. Effect of pH (a), reaction time (b), ozone concentration (c), and Fe(II) dosage (d) on the organic phosphorus removal rate (η) in THPS wastewater.
Sustainability 14 06318 g001
Figure 2. Changes in phosphorus morphology during the reaction.
Sustainability 14 06318 g002
Figure 3. Response surface and contour diagram showing the interactions between pH and reaction time on the removal rate of organic phosphorus (ozone concentration of 12 mg/L, Fe(II) dosage of 20 mg/L).
Sustainability 14 06318 g003
Figure 4. Response surface and contour diagram showing the interactions between pH and ozone concentration on the removal rate of organic phosphorus (reaction time of 30 min, Fe(II) dosage of 20 mg/L).
Sustainability 14 06318 g004
Figure 5. Response surface and contour diagram of the interactions between pH and ozone concentration on the removal rate of organic phosphorus (reaction time of 30 min, Fe(II) dosage of 20 mg/L).
Sustainability 14 06318 g005
Figure 6. Response surface and contour diagram of the interactions between the reaction and ozone concentration on the removal rate of organic phosphorus (initial pH of 3, Fe(II) dosage of 20 mg/L).
Sustainability 14 06318 g006
Figure 7. Response surface and contour diagram of the interactions between the reaction time and Fe(II) dosage on the removal rate of organic phosphorus (initial pH of 3, ozone concentration of 12 mg/L).
Sustainability 14 06318 g007
Figure 8. Response surface and contour diagram of the interactions between the ozone concentration and Fe(II) dosage on the removal rate of organic phosphorus (initial pH of 3, reaction time of 30 min).
Sustainability 14 06318 g008
Table 1. Experimental factors, coding, and levels of the Box-Behnken model.
LevelFactor A
pH
Factor B
Reaction Time (min)
Factor C
Ozone Concentration (mg/L)
Factor D
Fe(II) Dosage (mg/L)
−12301015
03601220
14901425
Table 2. Experimental scheme and results.
Run No.pHReaction Time (min)Ozone Concentration (mg/L)Fe(II) Dosage (mg/L)η (%)
1390102071.1
2460142076.3
3460122559.7
4360122079.1
5390142086.3
6460121563.4
7360141573.5
8330122567.1
9360142573.1
10360122078.4
11390121568.5
12490122070.5
13290122066.9
14260122556.2
15260121557.8
16460102065.1
17330121568.2
18260142071.5
19230122066.1
20360101563.7
21260102060.3
22360122078.9
23330102072.5
24330142085.5
25360102565.8
26360122080.5
27390122568.5
28360122080.5
29430122071.5
Table 3. Analysis of variance of the regression model.
SourceSum of SquaresDF *Mean SquareF Valuep-Value, Prob > F
Model1699.1414121.3757.44<0.0001
A-pH63.94163.9430.26<0.0001
B-Time0.0710.070.030.8607
C-O3381.941381.94180.75<0.0001
D-Fe(II)1.8411.840.870.3665
AB0.8110.810.380.5458
AC01001.0000
AD1.1011.100.520.4820
BC1.2111.210.570.4618
BD0.3010.300.140.7108
CD1.5611.560.740.4043
A2686.821686.82325.03<0.0001
B22.4512.451.160.2995
C20.8610.860.410.5328
D2683.481683.48323.45<0.0001
Residual29.58142.11
Lack of fit25.86102.592.770.1688
Pure error3.7340.93
* Degree of freedom.
Table 4. Quadratic model analysis of variance.
ProjectValueProjectValue
Std. Dev.1.45R-Squared0.9829
Mean70.57Adj R-Squared0.9658
CV/%2.06Pred R-Squared0.9105
PRESS154.75Adeq Precision27.054
Table 5. Comparation of methods.
MethodsRemove Efficiency (%)Reaction TimepHOperating Condition
O3/Fe(II)80–8560 min2.5–3.5Normal pressure and temperature
Biological method324–48 h6.5–8.0, depends on the bacteriaNormal pressure and temperature, depends on the bacteria
Wet oxidation9815 minUnlimited470–550 K, 4–10 MPa
Fenton-like50–601–3 h1–3Normal pressure and temperature
Publisher’s Note: MDPI stays neutral with regard to jurisdictional claims in published maps and institutional affiliations.

