Article

The Multi-Objective Optimization of Powertrain Design and Energy Management Strategy for Fuel Cell–Battery Electric Vehicle

1
School of Mechanical Engineering, Beijing Institute of Technology, Beijing 100081, China
2
Yangtze Delta Region Academy, Beijing Institute of Technology, Jiaxing 314019, China
3
School of Automotive Engineering, Shandong Jiaotong University, Jinan 250357, China
4
Yutong Bus Co., Ltd., Zhengzhou 450016, China
5
Zhongtong Bus Holding Co., Ltd., Liaocheng 252000, China
6
Department of Materials and Manufacturing, Beijing University of Technology, Beijing 100124, China
7
China Transport Telecommunications & Information Center, Beijing 100011, China
8
School of Automobile and Transportation Engineering, Jiangsu University, Zhenjiang 212013, China
*
Author to whom correspondence should be addressed.
Sustainability 2022, 14(10), 6320; https://0-doi-org.brum.beds.ac.uk/10.3390/su14106320
Submission received: 10 April 2022 / Revised: 13 May 2022 / Accepted: 19 May 2022 / Published: 22 May 2022

Abstract

:
Considering the limited driving range and inconvenient energy replenishment way of battery electric vehicle, fuel cell electric vehicles (FC EVs) are taken as a promising way to meet the requirements for long-distance low-carbon driving. However, due to the limitation of FC power ability, a battery is usually adopted as the supplement power source to fill the gap between the requirement of driving and the serviceability of FC. In consequence, energy management is essential and crucial to an efficient power flow to the wheel. In this paper, a self-optimizing power matching strategy is proposed, considering the energy efficiency and battery degradation, via implementing a deep deterministic policy gradient. Based on the proposed strategy, less energy consumption and longer FC and battery life can be expected in FC EV powertrain with optimal hybridization degree.

1. Introduction

1.1. The Need for a Hybrid System

As a substantial effort of the carbon neutrality and environment protection promise around the world [1], transportation electrification roadmaps for different vehicle types are proposed with varying propelling energy [2,3]. Zero-emission battery electric vehicle (BEV) attracts great attention, especially in the passenger vehicle sector, with an acceptable driving range per charge and charging schedule at home or workplace in the spare time. However, current battery capacity and charging technologies are insufficient to meet the requirements of commercial vehicles, e.g., logistic vehicles, interstate buses, and garbage trucks, which require long-time, long-range traveling and account for around 7% of global carbon emission [4]. Thus, another green energy source is required to cover the hundred kilometers target range and refuel the energy source in minutes, consequently decarbonizing this transportation sector. Compared to the internal combustion engine (ICE)-based hybrid powertrain, hydrogen–chemical battery-based fuel cell hybrid electric vehicle (FC EV) could realize a longer driving range with lower energy consumption and zero carbon emission [5]. FC stack uses an expensive proton exchange membrane (PEM) to generate electricity [6]. The primary challenge for FC EV’s larger-scale commercialization is the cost, which is currently several times that of its ICE counterparts [7].
Although the FC shows an excellent energy density to meet the range requirements, the relatively weak dynamic performance, i.e., power variation, necessitates the request for a power-oriented energy source as the supplementary source. Since frequent and significant power fluctuation has a negative effect on FC service life, it is wise to adopt a battery to alleviate the peak power impulse by the outstanding dynamic performance of the battery. Furthermore, the chargeable battery offers the capability of energy recovery, which is missing in FC. Given the energy density of FC is significantly superior to that of a battery, FC generally provides the average power when the battery is responsible for the extreme power variation in climbing, overtaking, or launching, as an auxiliary power source. On the other hand, the opposite configuration has also been studied [8], in which the battery takes the primary responsibility to meet the driving power demand. The hybrid system can cover the high-power events and, at the same time, keep the FC working in an efficient zone [9]. Fuel cell and battery (FC–BAT) EV prefers to use a series-parallel powertrain structure to enable the FC to power the electric machine directly or charge the battery when extra power is available [10]. Thus, it is obvious that a larger battery is involved, and more improvement room is available for FC but at the expense of cost and electricity dependency. The ratio of maximum power capability of FC and battery, which is defined as the degree of hybridization (DoH) of a hybrid powertrain, plays a key role in FC EV overall performance. Ref. [11] studied the impact of DoHs on vehicle mass, ownership, and energy efficiency, however, lacking an optimized solution.
Huang et al. [12] offered an optimized solution for balancing the energy consumption and the dynamic performance via establishing a control model without the mention of cost. Since the frequent high-power discharge and charging current will deteriorate the battery health [13], the concept design of powertrain specification needs a comprehensive optimization considering the system cost, performance, and the service life period. Furthermore, as the role of the battery is to regulate the power flow in the system, the power matching strategy is another key role in energy efficiency and dynamic performance [14].

1.2. Review of EMS Development for FC EV

The objective of an ordinary energy management strategy (EMS) is to determine the energy flow path between different energy/power sources properly to minimize a quantity, e.g., fuel consumption [15]. However, the performance of FC and battery degrades with aging [16]. A competent and comprehensive EMS for FC EV should not only work to minimize fuel consumption but also prolong its lifetime [17].
Traditional EMS can be classified as model-based optimization and rule-based optimization. Each of them has its priority and compromises to achieve targeted performance. Model-based optimization is characterized as global or near-global optimum [18], computationally complex, time consuming, and difficult to apply in practice due to the requirement of prior knowledge. Rule-based EMS (RL EMS) is relatively easy, generally based on (i) experience, (ii) offline-optimized algorithm for individual components, (iii) optimized strategy for the integrated system in a certain state, e.g., cruising, accelerating, or hill climbing. The level of expertise, the accuracy of the models, and the ability of vehicle state identification all play important roles in RL EMS performance.
Regarding the RL EMS, Ettihir [19] developed an extremum-seeking process to trace the maximum power and maximum efficiency of FC considering the FC aging. Sharing a similar idea, Ghaderi1 et al. [20] proposed an online parameters identification model to tackle the EMS uncertainties owing to the performance drifts of the power sources. Davis [21] proposed a rule-based two-mode EMS for low-power and high-power events according to the total cost of ownership, which includes fuel consumption, FC, and battery lifetime degradation.
Regarding the optimization model-based EMS, Feng et al. [22] introduced the remaining useful life models for FC and battery regarding performance degradation and then adopted an adaptive balanced equivalent consumption minimization strategy (BCMS) to minimize the overall cost considering the hydrogen consumption, FC, and battery degradation. Mend et al. [23] designed a dual-mode ECMS for FC EV by establishing time-varying models of hydrogen consumption and FC efficiency considering the fuel cell degradation rate.
Artificial intelligence technologies are being applied more and more in vehicle-related control problems in recent years. Specific to EMS, machine learning, e.g., neural network, Q-learning, deep Q-learning network, attracts great attention. The agent (strategy) generated via massive training under certain policy requires no prior knowledge of the upcoming driving conditions, at the same time reaching near-optimal results compared to DP. Zhou et al. [24] adopted a reinforcement learning algorithm in a long-term energy management strategy to prolong FC life, but energy consumption is missing in the optimization target. Meng [25] proposed a double Q-learning-based energy management strategy for the overall energy consumption optimization of FC EV. Yavasoglu et al. [26] proposed a neural network (NN)-based machine-learning algorithm for an FC-, battery-, and supercapacitor-based dual-motor powertrain to properly split the power in propelling machines and hybrid energy storage system [27], which has a negative effect on practicality and real-time performance, while the deep deterministic policy gradient (DDPG) turns discrete outputs into continuous outputs by adding two extra layers of networks to DQN. In this paper, aiming at improving the equivalent hydrogen consumption, prolonging FC and battery service life, and reducing the cost of ownership, DDPG is adopted and modified, accordingly, to optimize EMS.

2. Optimization of FC–Battery Powertrain Configurations

2.1. Structure and Specifications

The FC EV powertrain, as shown in Figure 1, is selected, which is propelled by a single motor via fixed-ratio transmission mounted on the front axle to evaluate the equivalent hydrogen consumption, FC, and battery performance degradation in different degrees of system hybridization and EMS. Figure 1 shows the powertrain structure [28].
The aim of the concept design for the selected vehicle with specifications shown in Table 1 is to be able to run at 120 km/h, complete 0–100 km/h acceleration in 10 s, and climb 30% hill at 30 km/h.

2.2. Electric Machine

According to the target performance in Table 1, the required motor power is calculated by Equation (1).
{ P s p d = v top 3600 η T ( M g f + C d A f v t o p 2 21.15 ) P φ = v i 3600 η T ( M g f cos φ max + m g sin φ max + C d A f v i 2 21.15 ) P a c c = v a 3600 t a η T ( δ M v a 2 t a + M g f 1 1.5 t a + C d A f v a 2 21.15 × 2.5 t a ) P m , p e a k max [ P s p d , P φ , P a c c ]
where g, f, Cd, δ , M, Af, φmax, and ηT are gravitational acceleration, rolling resistance coefficient, aerodynamic drag coefficient, the equivalent mass of rotating parts, vehicle mass and frontal area, maximum climbing angle, energy efficiency from the electric machine to wheels, respectively; Pspd, Pφ, and Pacc are required power for cruising at top speed vtop, climbing maximum grade with speed vi and accelerate the vehicle to va in ta. The rest of the performance concept design, e.g., maximum and rated torque, maximum speed, will be determined by top speed, acceleration, and gradeability, as well as being crossed checked subsequently. The electric machine specification is presented in Table 2.
According to the requirements in Table 2, a permanent magnet synchronous motor is selected, whose efficiency map is shown in Figure 2.

2.3. Fuel Cell Model

FC operation is usually explained as a steady-state energy conversion process where hydrogen is supplied to the anode and oxygen to the cathode. It is possible for FC stack to last over 25,000 h lifetimes in steady-state benign conditions, while some conditions may significantly degrade FC, e.g., load-cycling, stop–start, high-power, and low current (idling) conditions [29]. Results found in an accelerated lifetime testing of an FC stack from a bus [30] showed that 56% of FC degradation was due to load cycling and 33% due to stop–start operating. In simple terms, fewer start–stop cycles and power fluctuations will benefit FC lifetime. Considering all FC degradation rates formulas are experienced and testing cycles depended on, the power fluctuation rate is selected to refer to the FC service time degradation; at the same time, an extra penalty factor is applied to suppress frequent start–stop in FC. The following FC degradation formula is adopted from Ref [21]:
Δ FC ( t ) = Δ Cycle N Cycle + 0 t δ ( t )
The degradation function concerning operating power is
δ ( t ) = δ 0 3600 ( 1 + α P F C 2 [ P F C ( t ) P F C _ r a t e ] 2 )
ΔCycle represents the FC degradation coefficient in one start–stop cycle; NCycle is the number of cycles; δ0 and α are empirical coefficients of FC operating-power degradation; PFC_rate is the rated power of the FC. All parameters of FC are summarized in Table 3.
The operating efficiency of FC is determined by the normalized power, which is the ratio of output to peak value, shown in Figure 3.
Then, the instantaneous hydrogen consumption of FC can be derived by Equation (4).
M H 2 f c = P F C H f η F C ( n o r m o l i z e d F C p o w e r )
Hf is the hydrogen lower heating value 120 MJ/kg; ηFC is FC efficiency.

2.4. Battery Model

Since the battery integrated into this hybrid powertrain is the supplement power source, lithium-ion-based electrochemical battery is selected in this study due to its extraordinary energy density and acceptable ownership. Considering the focus of this study is system configuration and energy flow management, rather than the dynamic performance of the battery, the Li-ion battery model can be expressed by an ideal voltage source and a resistor, as shown in Figure 4.
The motor model specifies the HESS’s power requirements; thus, the maps of the motor’s driving and recovered states are measured in trials for modeling. The motor efficiency map is shown in Figure 2.
The output current is determined by open-circuit voltage U0, internal resistance RBAT and battery power PBAT:
I B A T = U 0 U 0 2 4 R B A T P B A T 2 R B A T
The state-of-charge (SoC) is expressed by Equation (6) with output current and total capacity QBAT:
S o C = 100 % t 0 t I B A T Q B A T ( A h )
The charging/discharging current, as the primary factor, with ambient temperature and natural aging have an influence on the degradation rate of battery capacity [31]. Since DoH determines the power ratio of battery and FC, it defines the capability boundary of current regulating and then plays a role in battery aging. An Arrhenius-based numerical model [32] with four parameters is adopted to investigate the influence of DoH on battery capacity degradation service life:
B a t l o s s = A e ( E a + B × C R a t e R T b a t ) ( A h t h r o u g h ) z = 0.0032 e ( 15162 1516 C R a t e ) R T b a t ) ( A h t h r o u g h ) 0.824
where A and B are pre-defined experience parameters and compensation factors for discharging rate CRate, respectively; Ea and R stand for the activation energy and constant gas values, which equal 78.06 (J) and 8.314 J/mol/K−1, respectively; Tbat represents the absolute temperature in Kelvin; the accumulative current going through the battery is represented by Ah through , which is a time-related exponential factor. Then, the model was evaluated in a field testing of Li-ion battery and achieved the following experimental calibration [33]:

2.5. System Configurations

As discussed in the literature review Section 1.1, there are two different schemes for FC EV, where battery and FC work as the primary energy source, respectively. The varying DoH reflects the different powertrain characteristics:
D o H = P f c , M a x P f c , M a x + P b a t , M a x
where Pfc,Max and Pbat,Max are the maximum power of the FC and battery. If DoH is relatively low, most of the required power will be fed by the battery, leading to a long electric range compared to that, which FC takes the primary responsibility for in propelling. If DoH is relatively high, FC is responsible for driving the vehicle most of the time, while the battery provides power when FC is underpowered or required to alleviate the power fluctuation in FC to prolong its service time.
In this study, FC–BAT hybrid powertrains with different DoH will be examined to investigate the energy consumption, ownership, and performance degradation of each scheme. Referring to Ref. [34], 0.375 is selected as the initial threshold of DoH for searching for the optimal value to achieve a pre-defined target. When DoH > 0.375, FC takes the primary responsibility for providing power to the electric machine, which leads to an energy-oriented battery model. When DoH < 0.375, FC works as a secondary power bank to charge the battery and reduce the harm of significant current fluctuation to the battery, which leads to a power-oriented battery model. Given the different batteries play in two powertrain schemes, the concept design for the battery will be different. One of them should be power density oriented, while the other one should be energy density oriented. The specifications of the two battery models are shown in Table 4.
The FC system cost varies dramatically depending on the volume and manufacturer, from 1000 to 2000 USD/kW [35]. In this study, the average price, i.e., USD 1000/kW, is adopted to calculate the cost of the FC system:
C o s t F C = P f c , M a x 1000 ( $ / k w )
According to the latest annual survey by BloombergNEF, the mean price of a battery pack in the current market is 137 USD/kWh. Then:
When the power-density-oriented battery (DoH > 0.375) is selected
C o s t B a t 1 = 0.156 125 137 = 2671 ( U S D )
When the energy-density-oriented battery (DoH < 0.375) is selected
C o s t B a t 2 = 0.156 31.25 137 = 668 ( U S D )
Since the FC provides all the energy, including the electricity in the battery, the consumed electricity can be converted into hydrogen consumption via Equation (9), MEtoH:
M H 2 E l e c t r i c i t y = P B a t η d i s η c h g H f η F C ( n o r m o l i z e d F C p o w e r )
MH2-Electricity is the equivalent energy from electricity to hydrogen consumption of electricity, ηdis, and ηchg are the efficiency of discharging and charging, respectively.

3. Optimum Design of Hybrid Powertrain

3.1. Method

The configuration of the FC–BAT hybrid powertrain defines the characteristics of each component, performance limit, and degradation. Thus, an optimum design of a hybrid powertrain should balance fuel consumption, system ownership, and performance degradation. The particle swarm optimization (PSO) algorithm, which is inspired by the social behavior of a group of birds, is adopted in this study to realize a multi-objective optimization. By implementing PSO, the target to be optimized is the “particle”, which is iteratively updated through its position (optimal value of target) and the rate of position changing. In the beginning, PSO randomly initializes the particle (optimization objective) position and the velocity of moving to the next position. After reaching the next position, the best position of each particle (p_best) and the best position of all particles (p_best) will be updated, followed by the updates of velocity. The searching process for the local and global optimal values is heuristic and will not stop until reaching the pre-defined constraints. In each iteration, the position, which represents the best fitness value, is obtained, as shown in Equation (10).
{ V i j N = ϖ V i j N 1 + c 1 r 1 ( p b e s t i j N 1 X i j N 1 ) + c 2 r 2 ( g b e s t i j N 1 X i j N 1 ) X i j N = X i j N 1 + V i j N
where VijN and XijN are the velocity and position of the ith particle with jth dimension in Nth iteration; N stands for the iteration number; ϖ represents the inertial weight of velocity; c1 and c2 are learning factors; r1 and r2 are random numbers between 0 and 1.
In this study, the goal is to achieve an acceptable result of balancing equivalent hydrogen consumption, system cost, and performance degradation in hybrid powertrain design via DoH optimization. Therefore, the optimization objective consists of three items, i.e., energy consumption, cost, and degradation, with the optimization variable DoH.
Considering the powertrain design is a multi-objective optimization process, reference values are necessary for each item in the optimization function, i.e., hydrogen consumption, system cost, and performance degradation. It needs to be emphasized that the reference values are NOT the goal of optimization; they are a benchmark for further improvement with different preferences by tuning the factors, i.e., a1, a2, a3, to achieve a specific goal. Thus, specifications of the hybrid powertrain with DoH = 0.5 are selected at the very beginning. In addition, 1.2 kg/100 km hydrogen consumption and 0.0377/100 km capacity degradation of battery are adopted based on state-of-the-art situation.
R e f = a 1 C H 2 1.2 + a 2 C o s t F C + C o s t B a t 120 0.5 1000 + 2671 + a 3 Q l o s s 0.0377
where CH2 is the hydrogen consumption, including the energy used to generate electricity; CostFC is the cost of FC in terms of power; CostBat is the cost of the battery in terms of energy capacity; are the power bank cost; Qloss is the battery degradation; weighting factors a1, a2 and a3 are adopted to set the real optimization goal that reflects the preference of the designer. In this study, each group of weighing factors for the balanced energy consumption/cost/performance/degradation preferred is investigated.
The following constraints are applied in the optimization algorithm:
{ v min v v max 0 P o s D o H 1
The optimum position (DoH) searching rate of each particle is constrained between [vmin, vmax], specifically, [−0.05, 0.05] in this study; Pos_DoH stands for the position of each particle, which is DoH in this study.
A typical PSO process, which is illustrated in Algorithm 1, is adopted to find the best concept design with different preferred objective. The following procedures are realized in a script in Matlab®:
Step 1: Initialize the optimum searching rate v and fitness value standing of objective Pos_DoH for each particle.
Step 2: Find the best Pos_DoH of each particle (p_best) and the best Pos_DoH of all particles (g_best).
Step 3: Update v and p_best of each particle, check if the values meet the constraints of the speed and position.
Step 4: Update p_best and g_best.
Step 5: Repeat Steps 3~4 until the constraints or iteration number are reached.
Substitute Equation (9) to Equation (4) to calculate the overall hydrogen consumption, i.e., MH2_Total:
M H 2 _ T o t a l = ( M ˙ H 2 f c + M ˙ H 2 E l e c t r i c i t y ) d t
The pseudocode of PSO for powertrain sizing is realized in a script in Matlab® and described in Algorithm 1.
Algorithm 1 PSO-based multi-objective DoH optimization
1: for each particle i
2:   for each dimension j
3:     Initialize velocity Vij and position Xij for particle i
4:     Calculate the fitness value fit(Xij) and set p_bestij = Xij,
5:   end for
6: end for
7: Choose the particle having the best fitness value as the g_bestj
8: for iteration N = 2, M do
9: for each particle i
10:    for each dimension j
11:     Updata the velocity of particle i:
12:        V i j N = ϖ V i j N 1 + c 1 r 1 ( p _ b e s t i j N 1 X i j N 1 ) + c 2 r 2 ( g _ b e s t j N 1 X i j N 1 )
13:     Updata the position of particle i:
14:      X i j N = X i j N 1 + V i j N
15:   end for
16:   if fit ( X i j N )   <   fit ( p _ b e s t i j N 1 )
17:     p _ b e s t i j N 1 = X i j N
18:   end if
19:   if fit ( p _ b e s t i j N 1 )   <   fit ( g _ b e s t j N 1 )
20:     g _ b e s t j N 1 = p _ b e s t i j N 1
21:   end if
22:  end for
23: end for
24: print the last g_best value

3.2. Concept Design Optimization Results

To investigate the effectiveness of PSO for FC–BAT hybrid powertrain design, several groups of weighting factors with different preferences in hydrogen consumption, system cost, and performance degradation are implemented in an algorithm to find the optimum DoHs. The first group of weighting factors a1 = 0.34, a2 = 0.33, a3 = 0.33 are applied to 0 < DoH < 0.375, which indicates no preference for any item in the objective function. The corresponding optimized DoH is 0.2016 with 24.19 kW maximum fuel cell power; if the objective function prefers to extend battery lifetime by applying weighting factors a1 = 0.2, a2 = 0.2, a3 = 0.6, the final DoH is 0.2323 with 0.6703 fitness value. The third group of weighting factors, i.e., a1 = 0.2, a2 = 0.6, a3 = 0.2 is adopted to reduce system cost, which needs the DoH to be 0.0347 and leads to 4.16 kW maximum fuel cell power. If hydrogen consumption is preferred via applying weighting factors a1 = 0.6, a2 = 0.2, a3 = 0.2 to the objective function, the optimum DoH is 0.3493, and the corresponding Max power of FC is 41.92 kW. The process of optimization and convergence of each preference is shown in Figure 5.
The same four groups of weighting factors are applied for 0.375 < DoH < 1. Figure 6 illustrates the fitness value of each optimization process. Similar to Figure 5, the fitness value converges quickly in several iterations.
The objective optimization fitness value and the corresponding optimal value are summarized in Table 5. Relatively high DoH is beneficial in preventing battery degradation and reducing hydrogen consumption, demonstrating higher DoH preference. Relatively low DoH is good for reducing system cost, which shows lower DoH preference in two different ranges; for the FC hybrid powertrain involved in a high-energy density battery, a relatively high DoH should balance cost, fuel consumption, and battery degradation prevention needs; for the high battery density FC hybrid powertrain involved, the trend is reversed.

4. RL EMS

The EMS in a traditional engine–motor-based hybrid powertrain is only designed to achieve optimum energy consumption by regulating the power flow between different power sources. However, EMS in FC EV is not only responsible for reducing the energy consumption but is also expected to prolong the service time of battery and fuel cell. Furthermore, the solution performance of the multi-objective optimization problem is subjected to real-world driving conditions, as it is sensitive to the unknown power requirement.
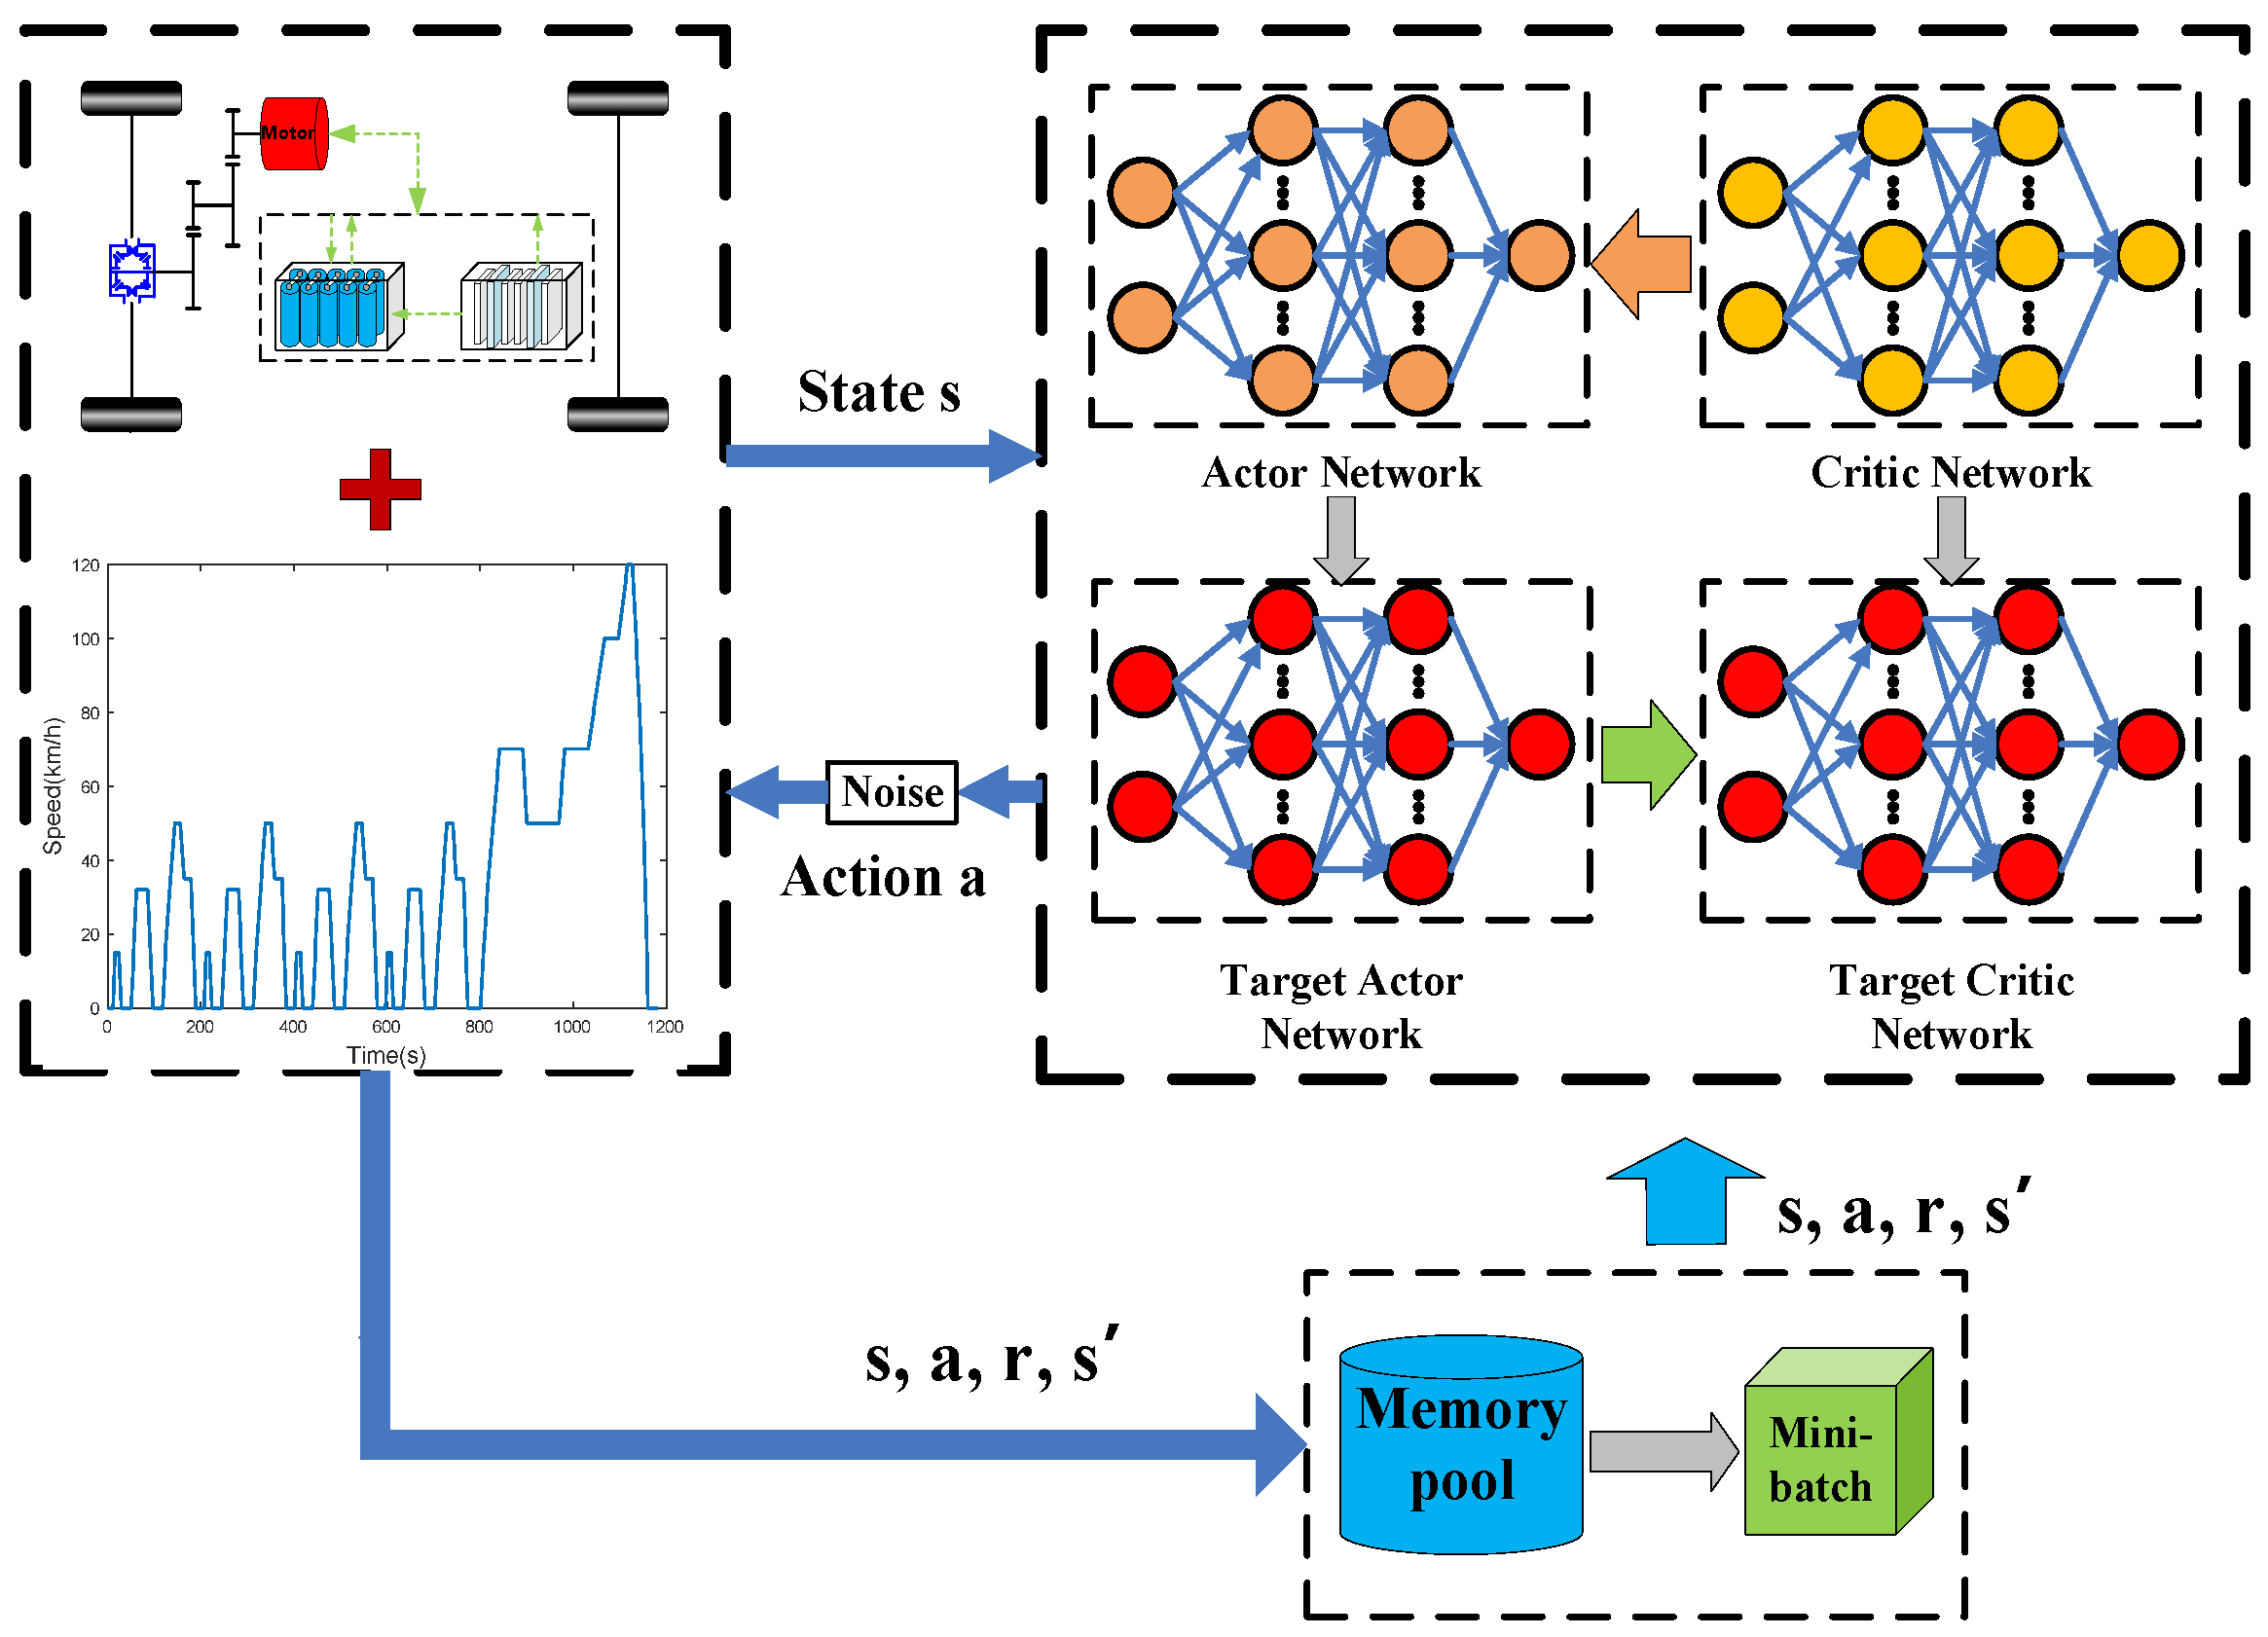
Traditional EMS can be classified as rule based and optimization theory based. Although the advantages they have are different, neither of them achieves a good balance between performance and practicality. Deep deterministic policy gradient (DDPG) is a deep-reinforcement learning method based on an actor–critic architecture network. DDPG is good at solving continuous state/action optimization problems by updating the network parameters in the back propagation of the gradient. A memory pool that stores the previous results can accelerate calculation and avoid overfitting by weakening the correlation of training data. The reward function plays a key role in the reinforcement learning model, which includes the current and future rewards. A discount factor will be applied to the future reward to reflect the influence of the future on the current [35].
As the name of DDPG suggests, the deterministic policy is adopted to select the action for the network (agent). Specific to the EMS in this study, the SoC of the battery and required power is selected as a state variable, while the ratio of FC output power and the total required power is selected as an action variable to optimize EMS by training the agent under various driving conditions. Then, the reward and state of the next step are returned after the action is applied to the environment (vehicle). To prompt the agent to explore a better solution in the environment, a normally distributed noise is applied in action. Then, the action of the agent can be expressed as
A = π θ ( s , a ) + N
The reward function consists of three parts, i.e., the equivalent hydrogen consumption, battery capacity loss, and FC performance degradation in terms of efficiency. The reward function is expressed in Equation (15):
R t = i = t T γ i t r t
where Rt is the total rewards, γ is the discount factor to introduce the influence of the future on the current, and rt represents the current reward.
Since FC tends to achieve longer service time by keeping the generated power around the rated value, as shown in Equation (3), the performance degradation coefficient at constant rated power is selected as the target optimum value of FC degradation. The target optimum value of battery capacity degradation is determined by Equation (9), where Ah-throughput in a testing cycle is based on 0.5 DoH. The target equivalent hydrogen consumption is 1.2 kg/100 km. The instant reward consists of equivalent hydrogen consumption, battery capacity loss, and FC performance degradation coefficient and is expressed by Equation (16).
r t = 1 ( a 1 × C H 2 1.2 + a 2 × Q loss 0.037 + a 3 × F C loss 2.664 × 10 4 ) 20
where CH2 is instant equivalent hydrogen consumption per 100 km; Qloss is the capacity loss of battery at t; FCloss is the performance degradation coefficient at t; a 1 , a 2 , a 3 are weighting factors.
The parameters are updated via the loss function of the actor network and critic network, as shown in Equations (17) and (18).
{ J ( ϕ ) = min ϕ E π [ 1 2 ( y t Q ϕ ( s t , a t ) ) 2 ] J ( θ ) = max θ E π [ Q ϕ ( s t , u ( s t ) ) ]
y t = r t + γ Q ϕ ( s t + 1 , a t + 1 )
where St, at are the state and action at time t, respectively; Qϕ is the output function of critic network at time t, while Qϕ, is the output function of critic network at time t + 1.
Only part of the parameters of the critic–target network and the actor–target network will be updated, which is called “Soft-updating” and used to avoid “over-estimating” and stabilize the learning process of the agent to achieve optimal EMS. The parameters of the target network are updated by Equation (19).
{ ϕ τ ϕ + ( 1 τ ) ϕ θ τ θ + ( 1 τ ) θ
ϕ and ϕ′ are parameters of the critic network and the critic–target network; θ and θ′ are parameters of the actor network and the actor–target network; τ is the smoothing factor. The DDPG-based EMS optimization procedures are shown in Figure 7.
Since DoH = 0.375 is the optimal value for a balanced target between hydrogen consumption, cost, and battery life, as shown in Table 6, it is adopted to evaluate the performance of RL-based EMS. 
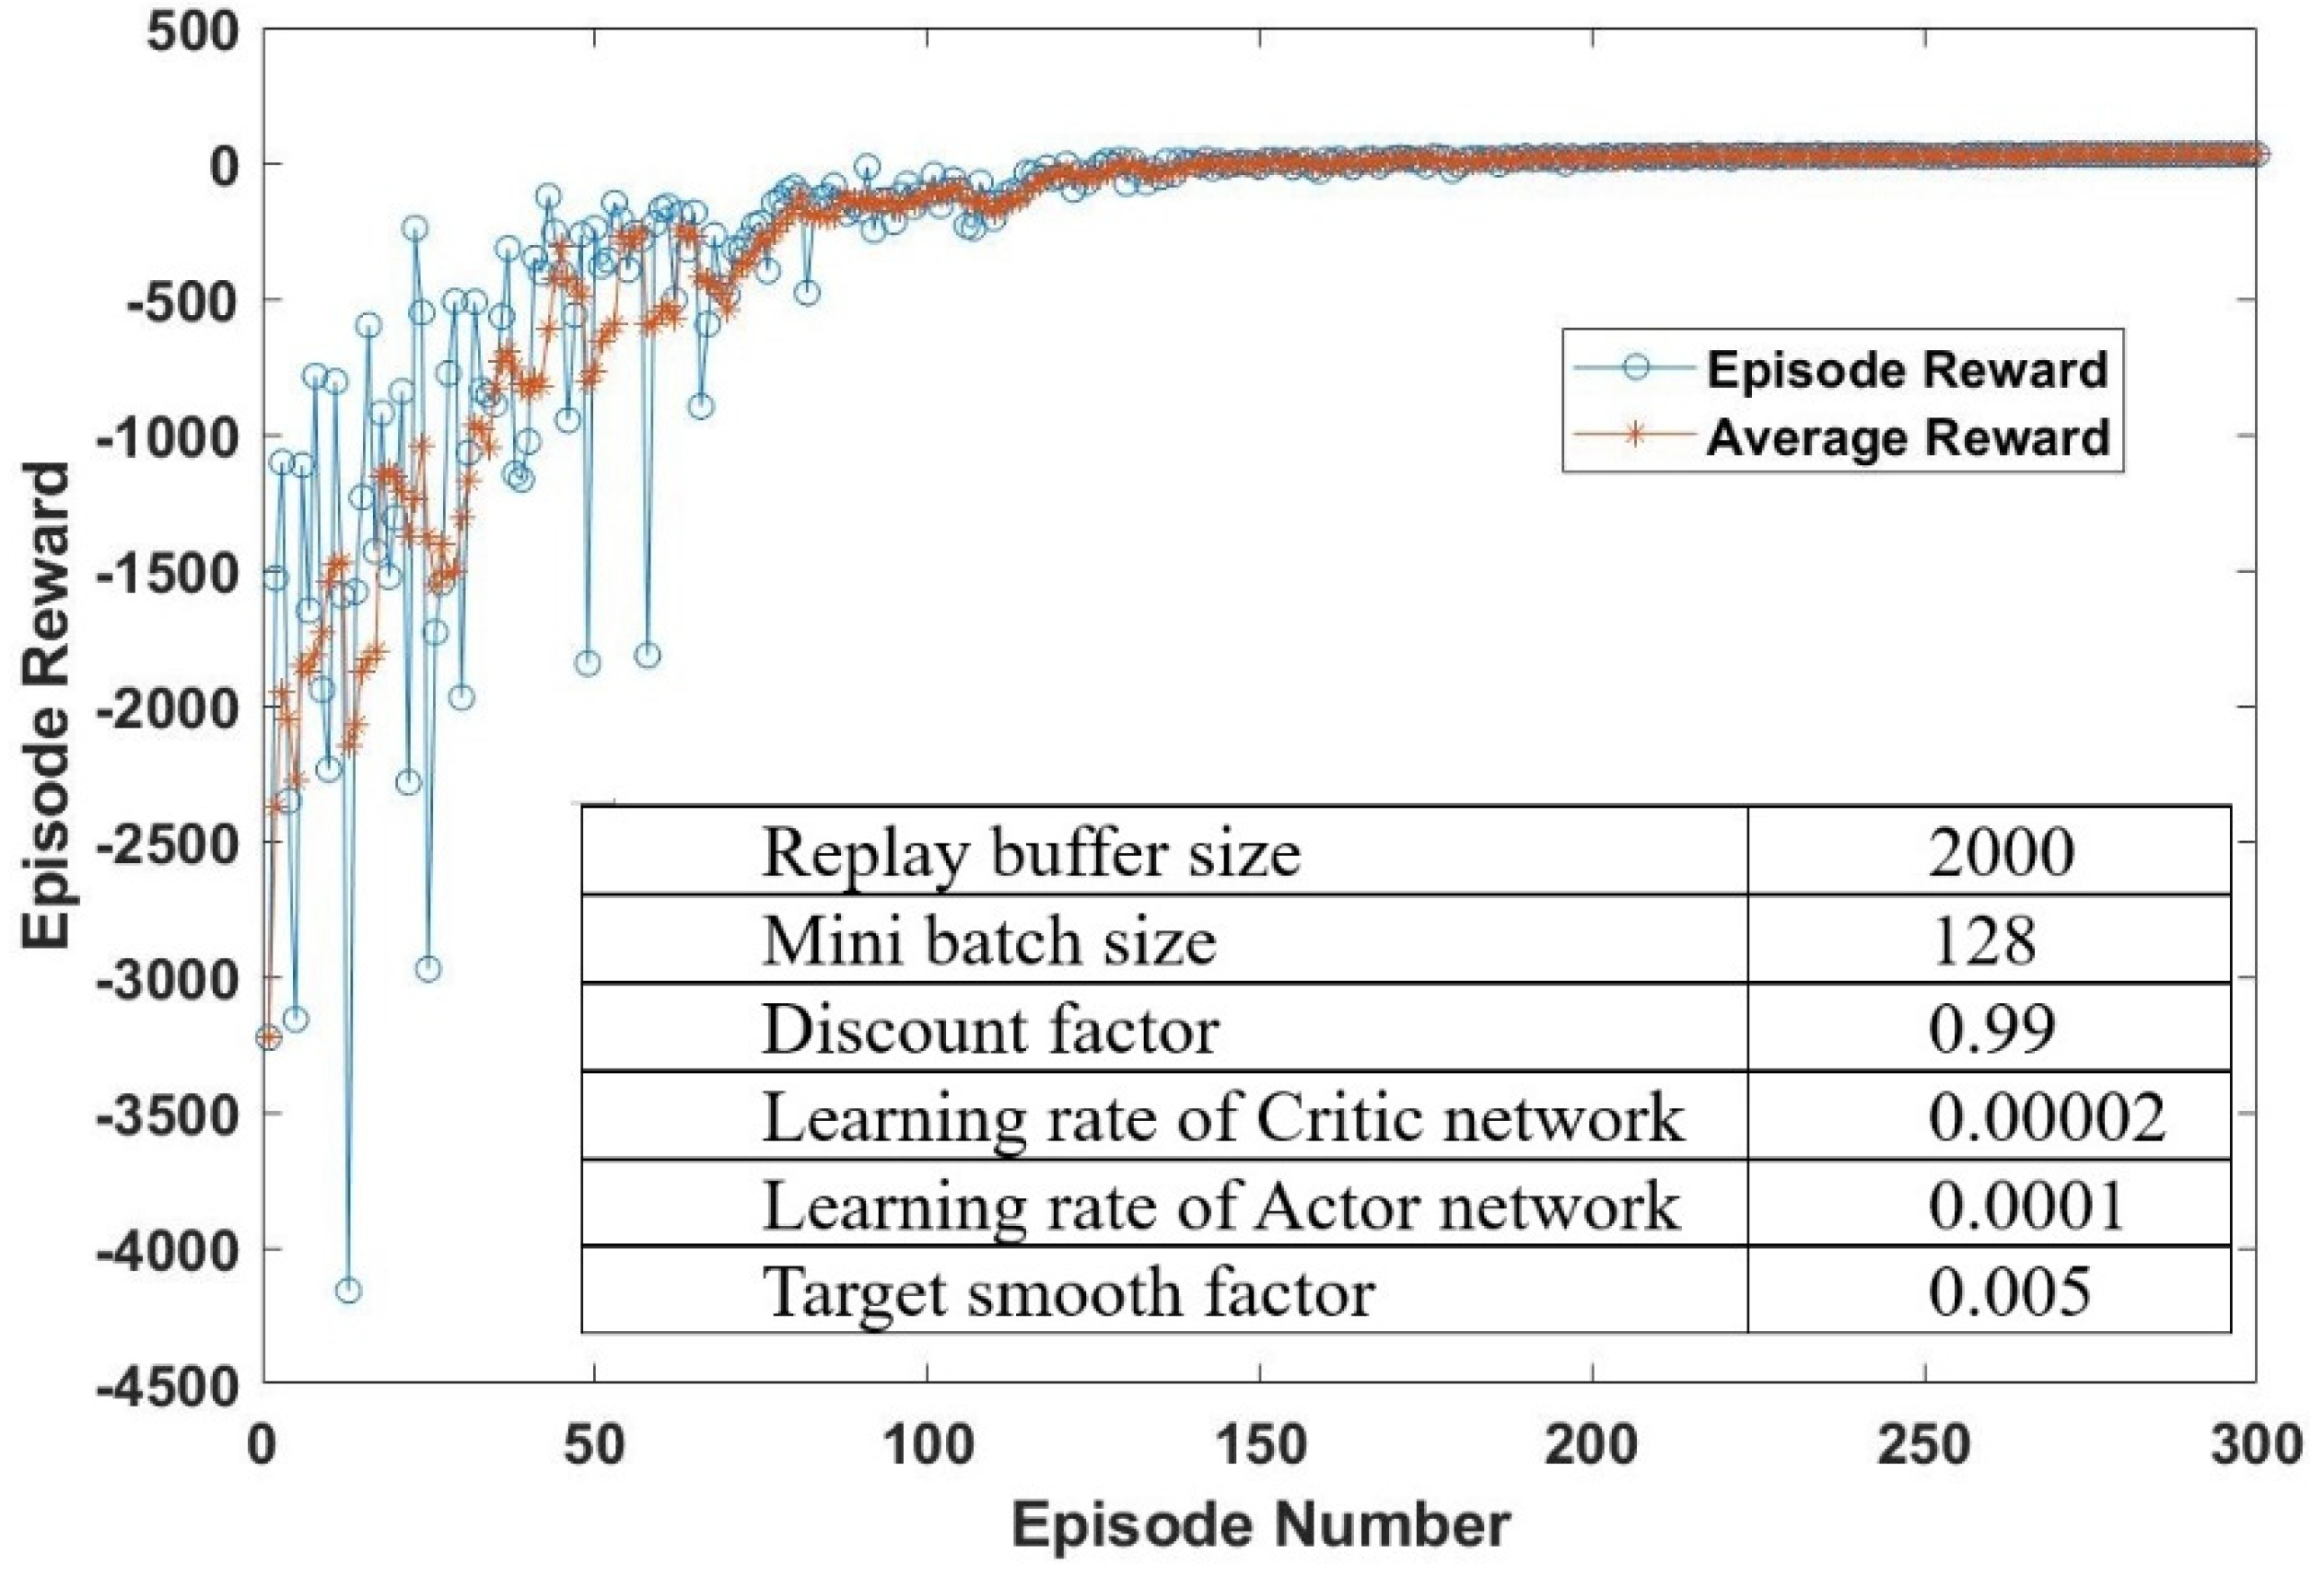
Figure 8 illustrates the training process for 300 rounds with weighting factors a1 = 0.34, a2 = 0.33, a3 = 0.33 for hydrogen consumption, battery, and FC degradation, respectively, in the worldwide harmonized light-duty test cycle (WLTC). The total reward of each training episode converges to the highest reward in the end, which is usually taken as a successful training process for an optimal agent. The DDPG-based optimization of EMS is optimized by Matlab® as well. The agent of optimal EMS is derived from 300 training episodes with converged reward; specifically, the 200th round is selected, as shown in Figure 8.
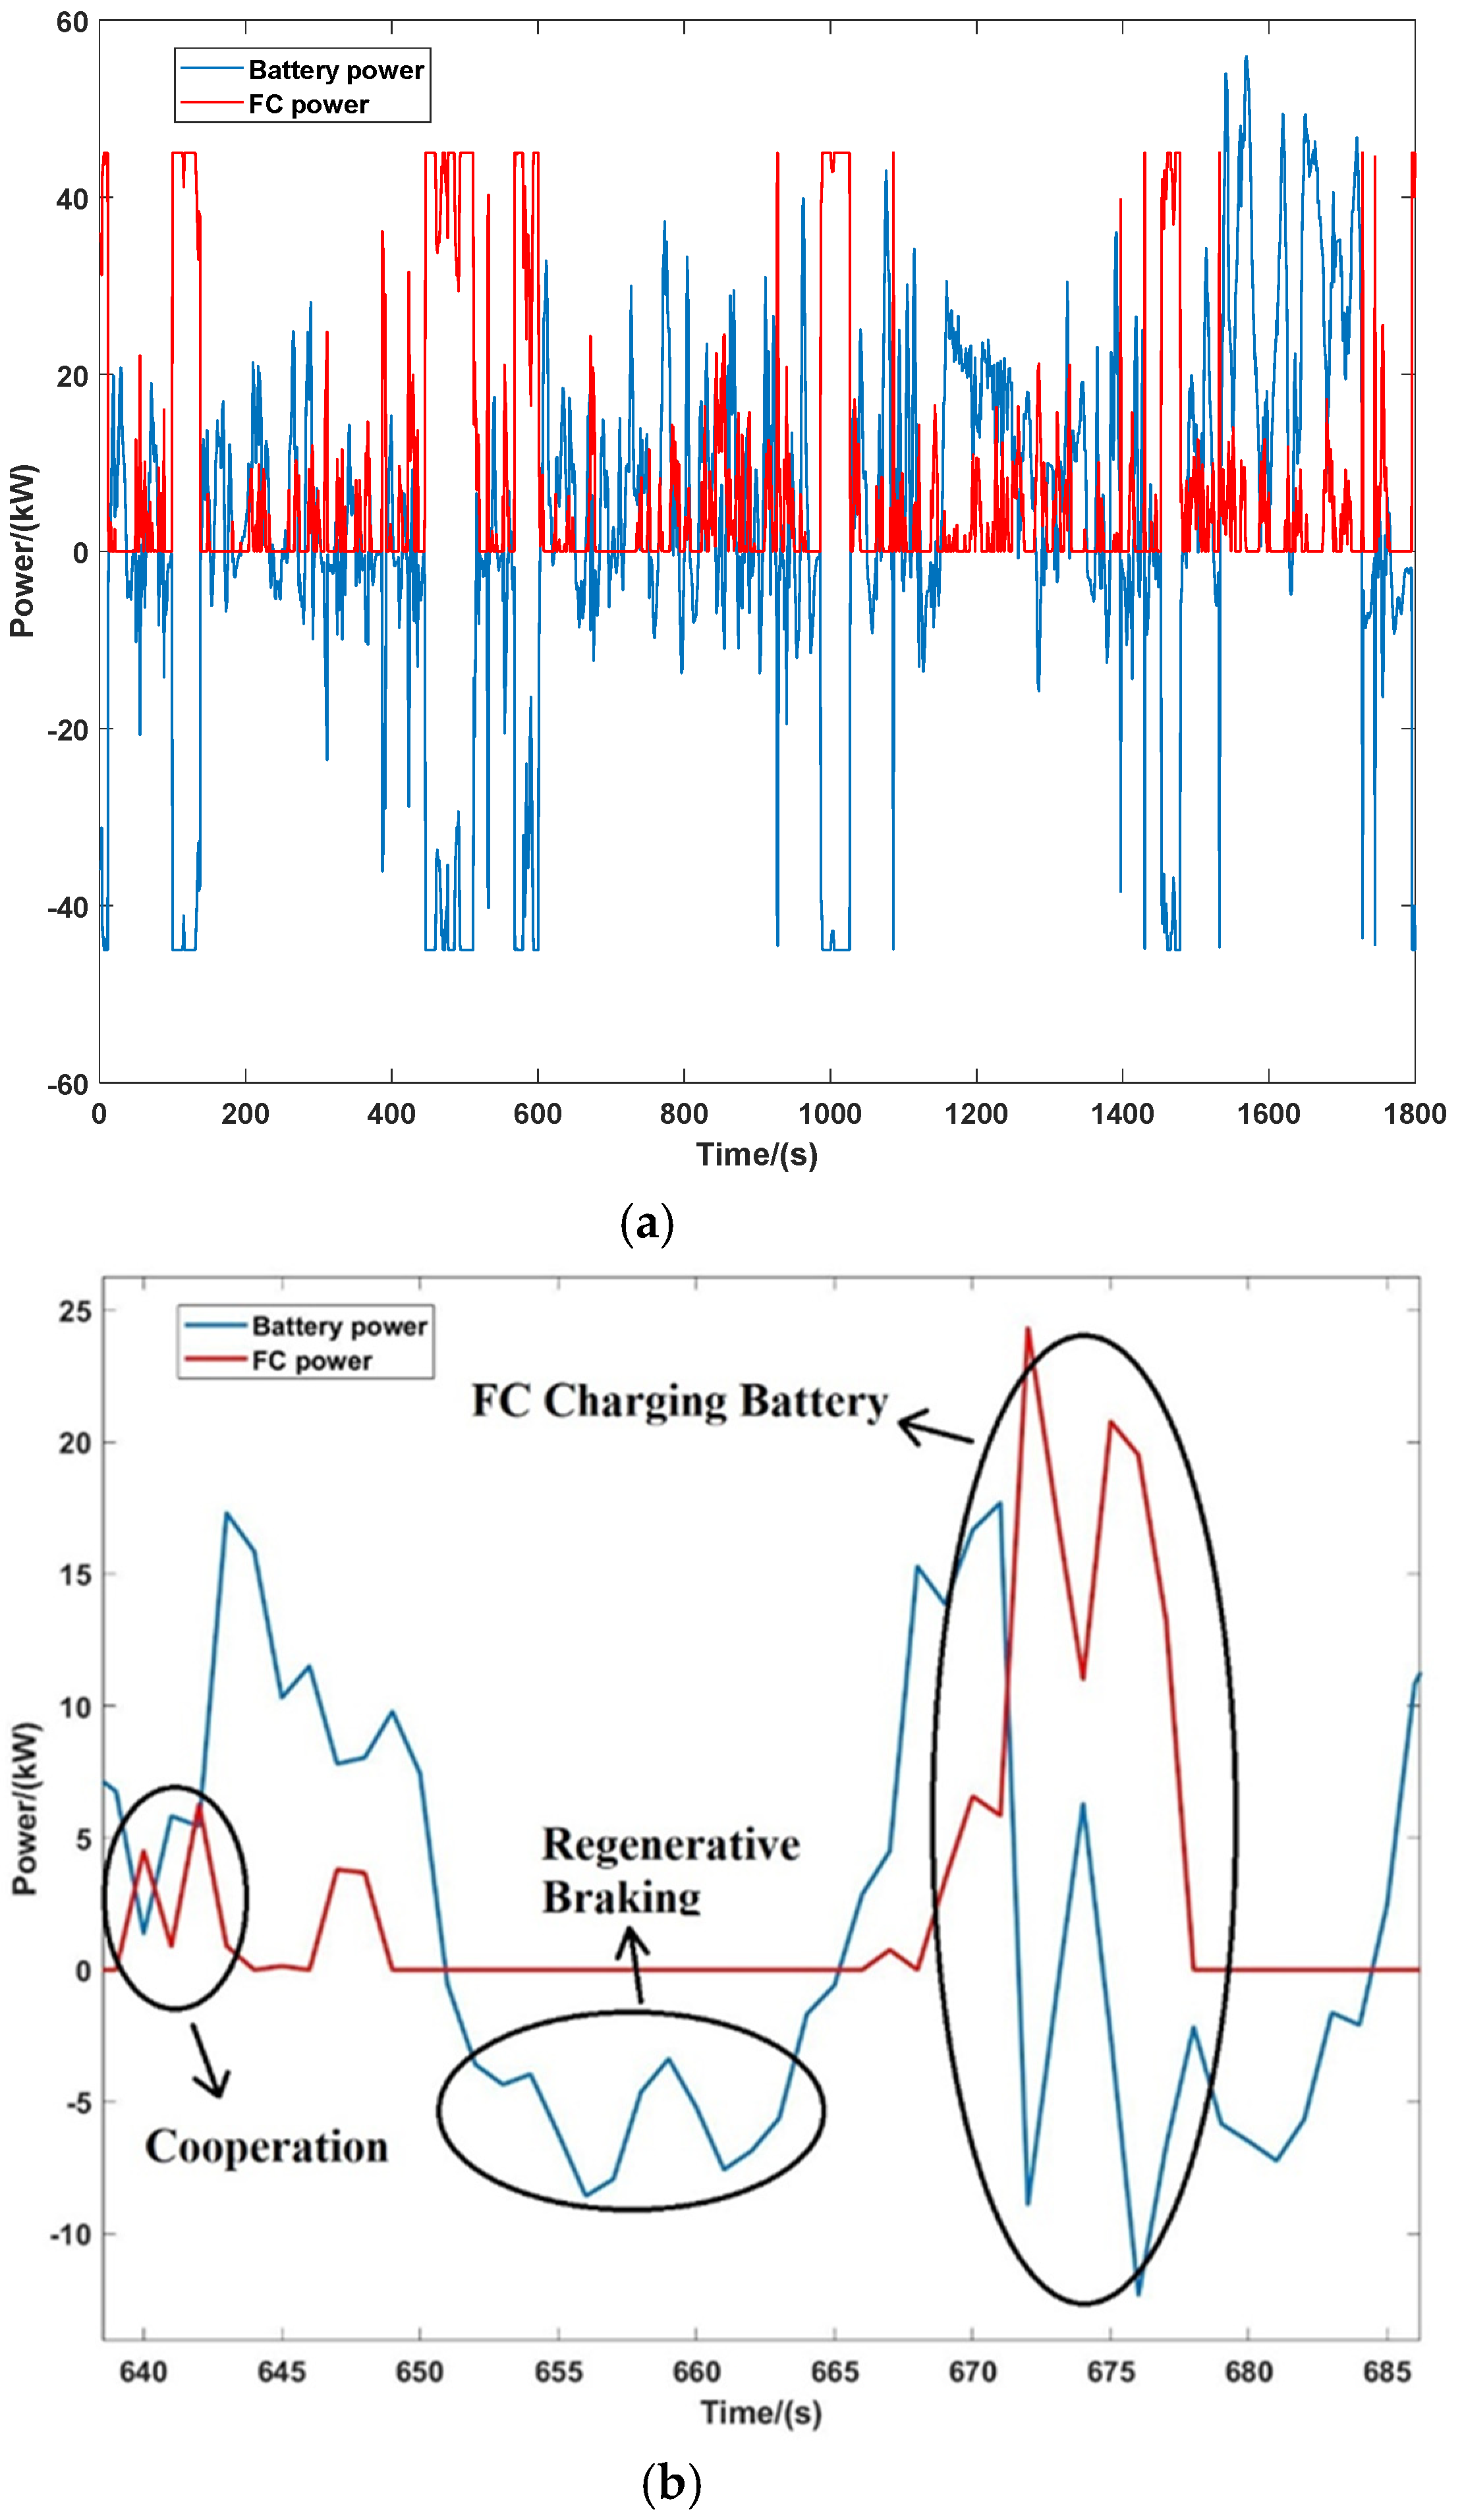
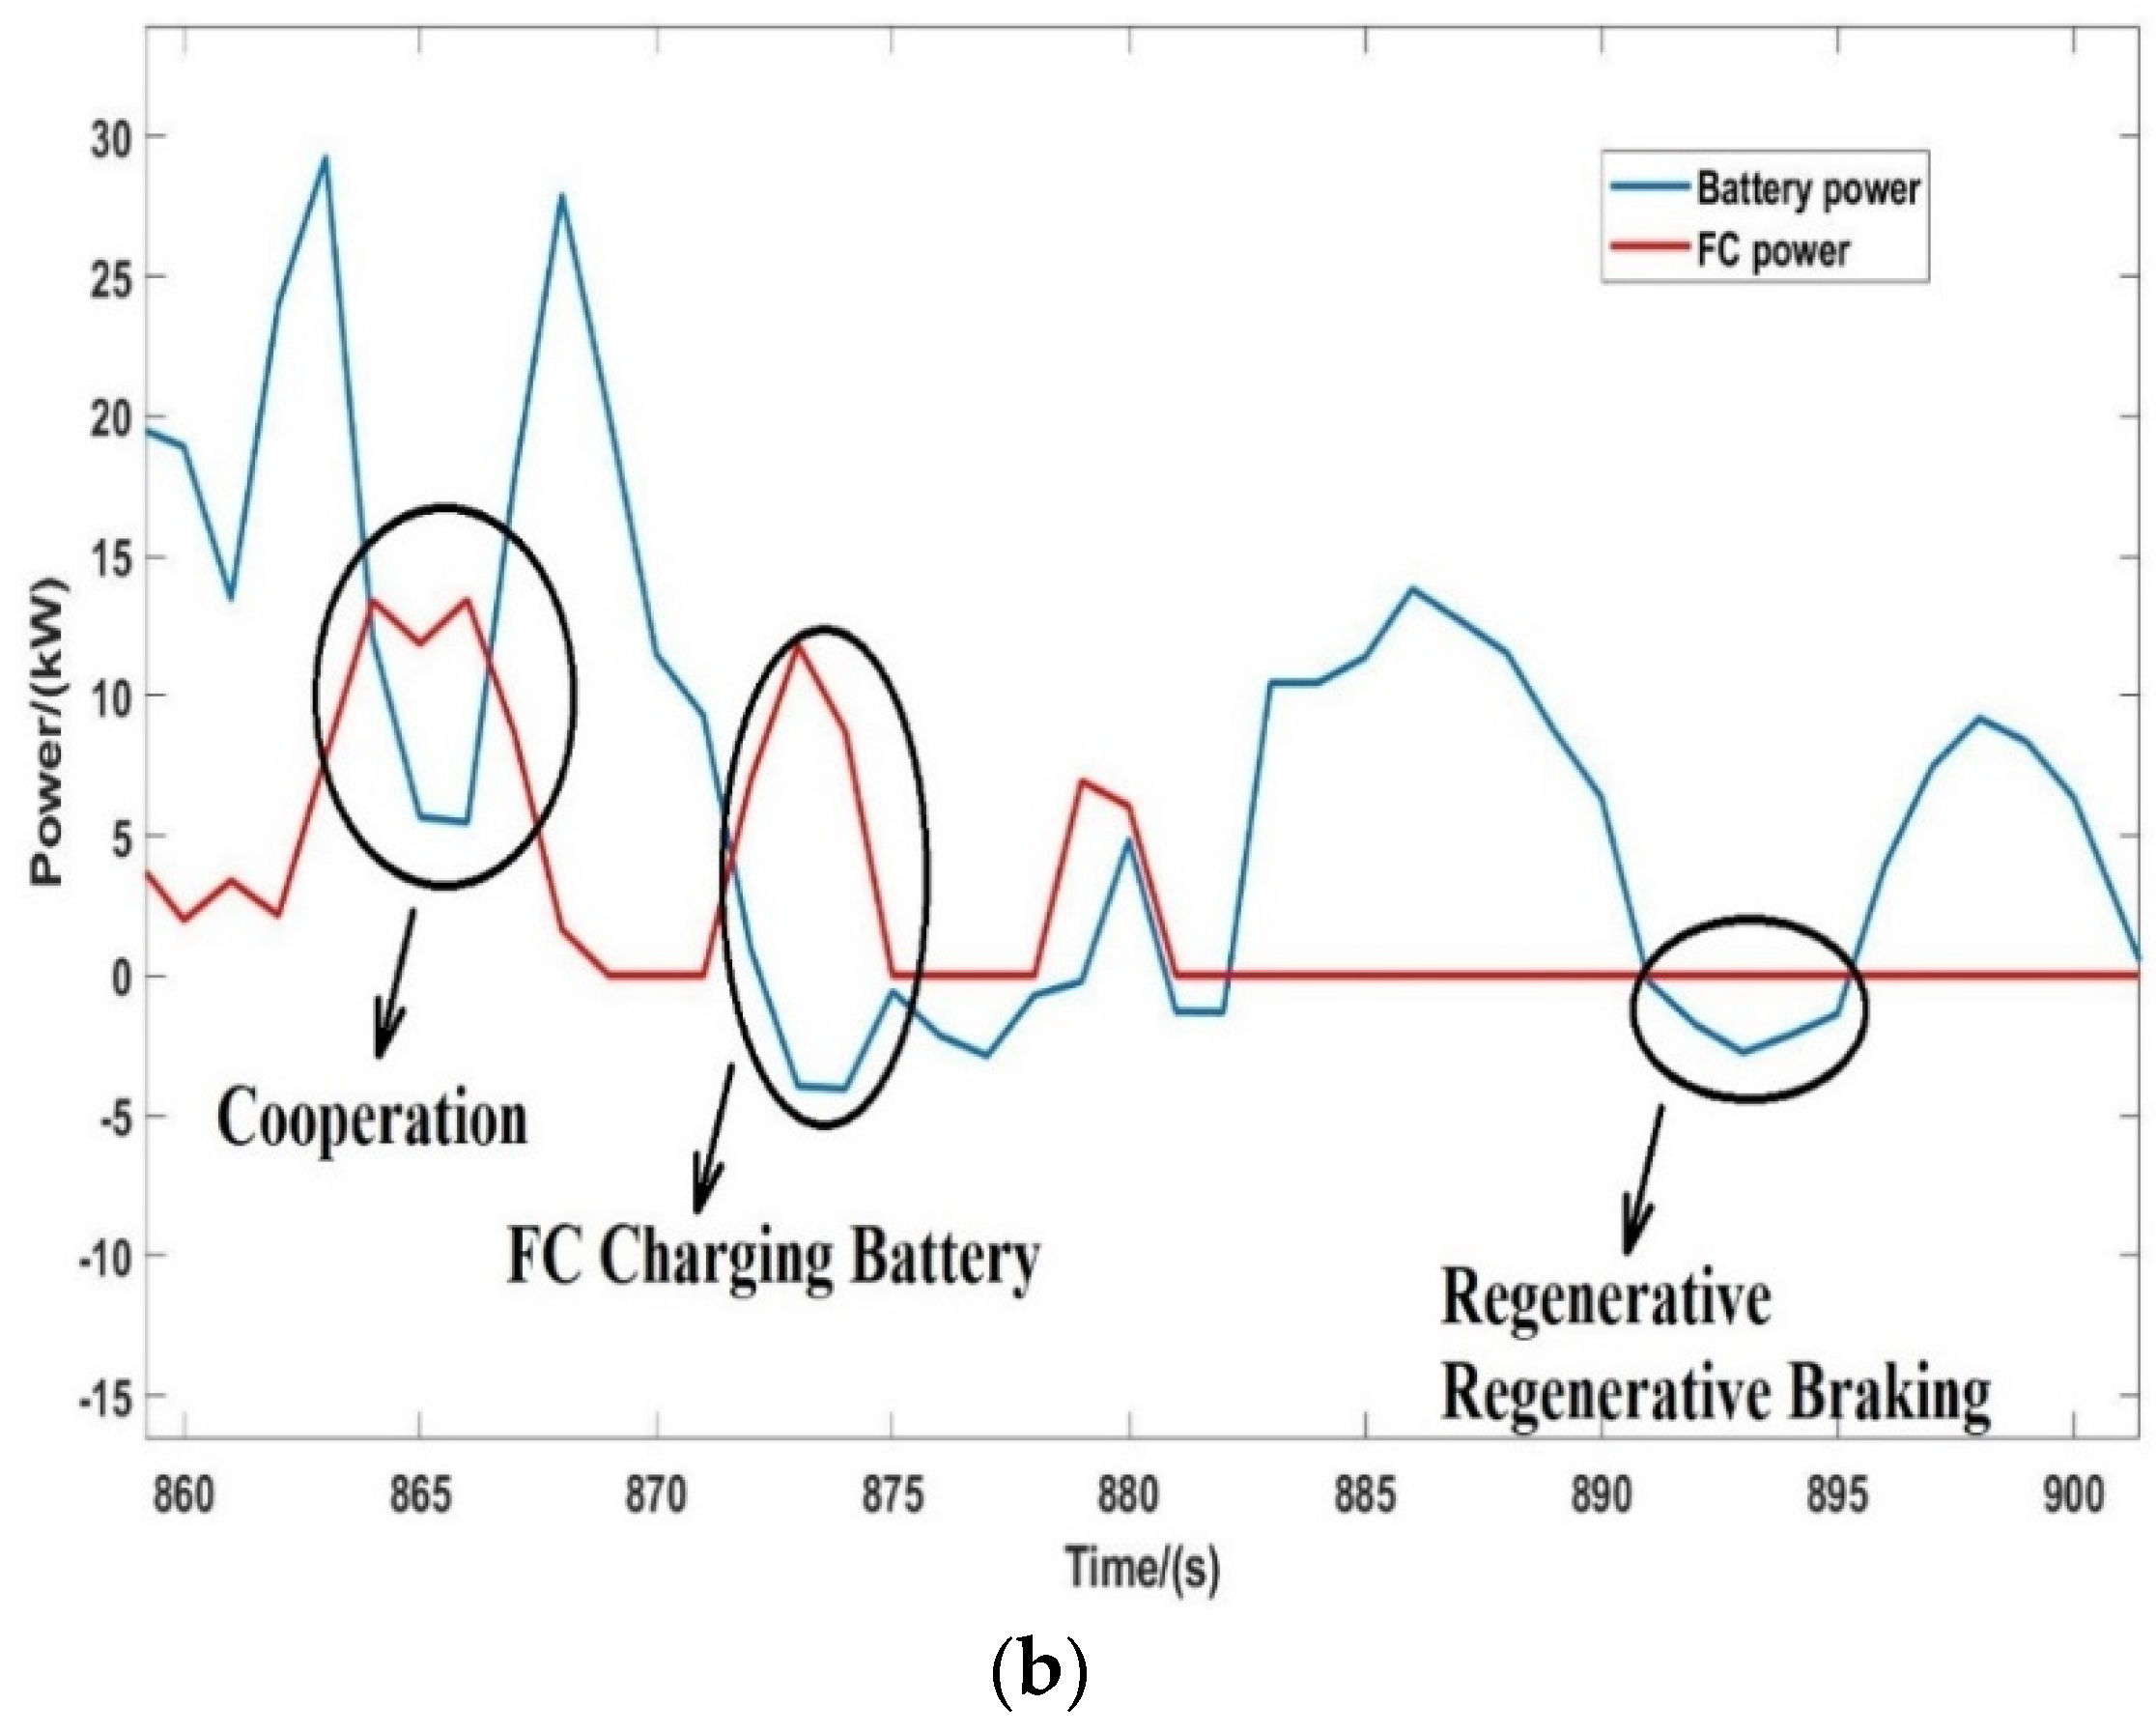
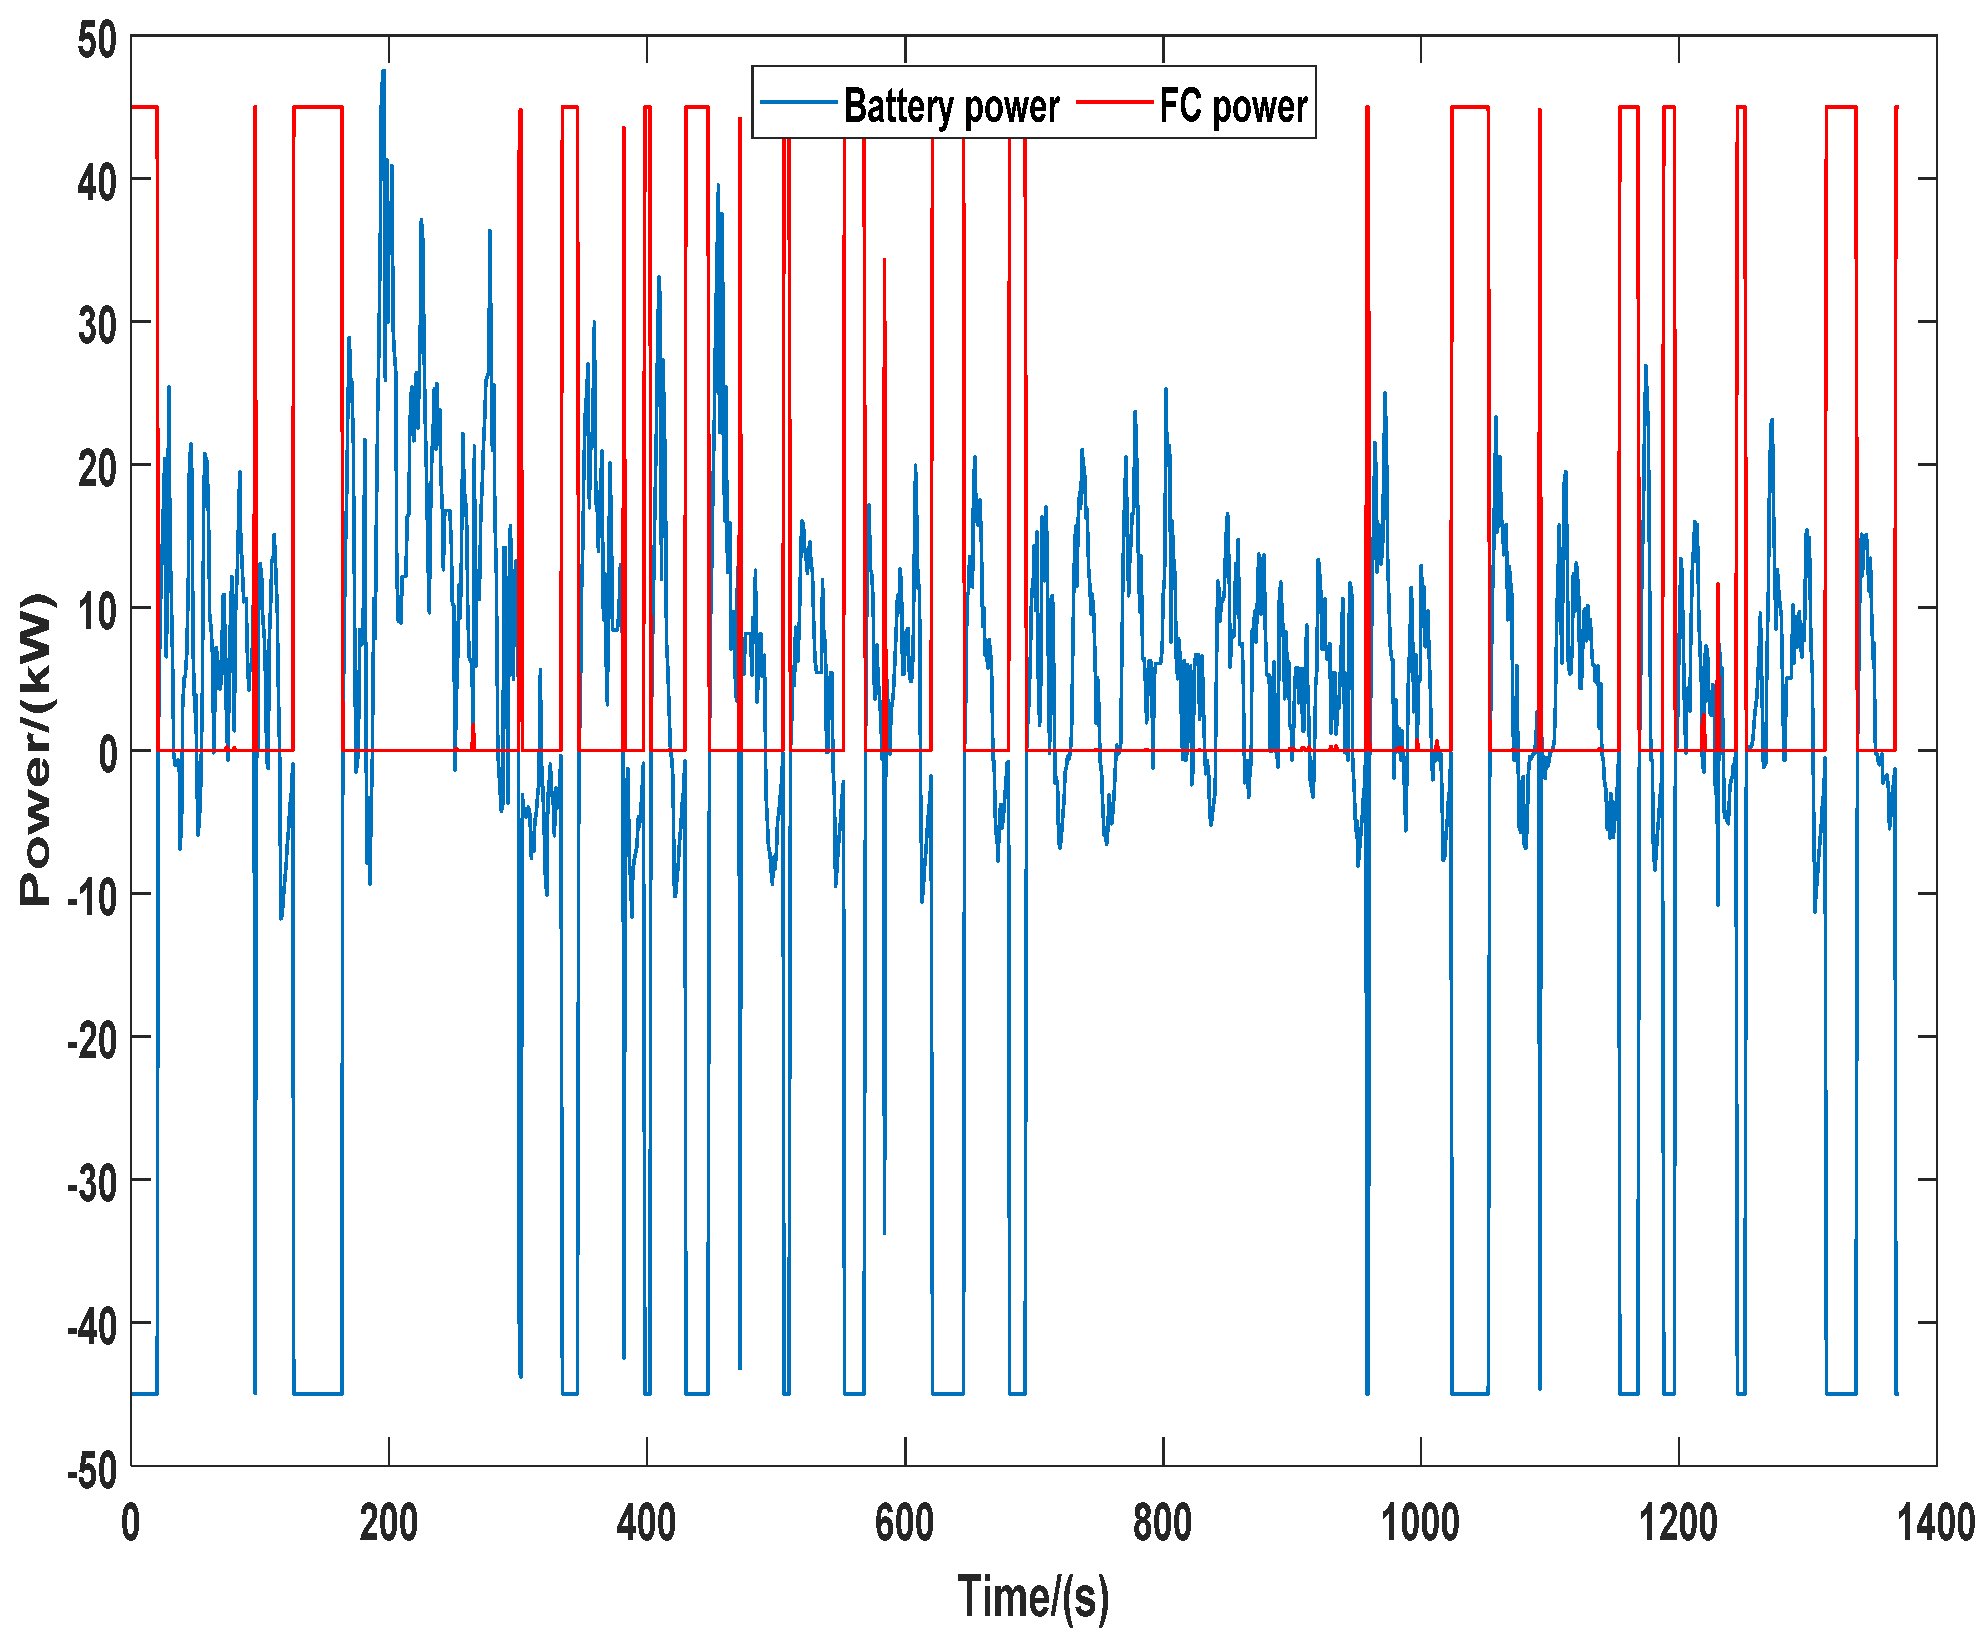
In this particular episode, the power distribution between the FC and battery is shown in Figure 9. To provide a better readership of the power allocating process, a partial enlarged picture in shown in Figure 9b, in which the power burden on FC was reduced by battery in a cooperation mode, the battery recapturing the energy in vehicle braking, and the battery was charged by FC when extra power was available, as clearly demonstrated. It is worth noting that FC reaches its peak power, i.e., 45 kW, several times with the balanced preferences weighting factors.
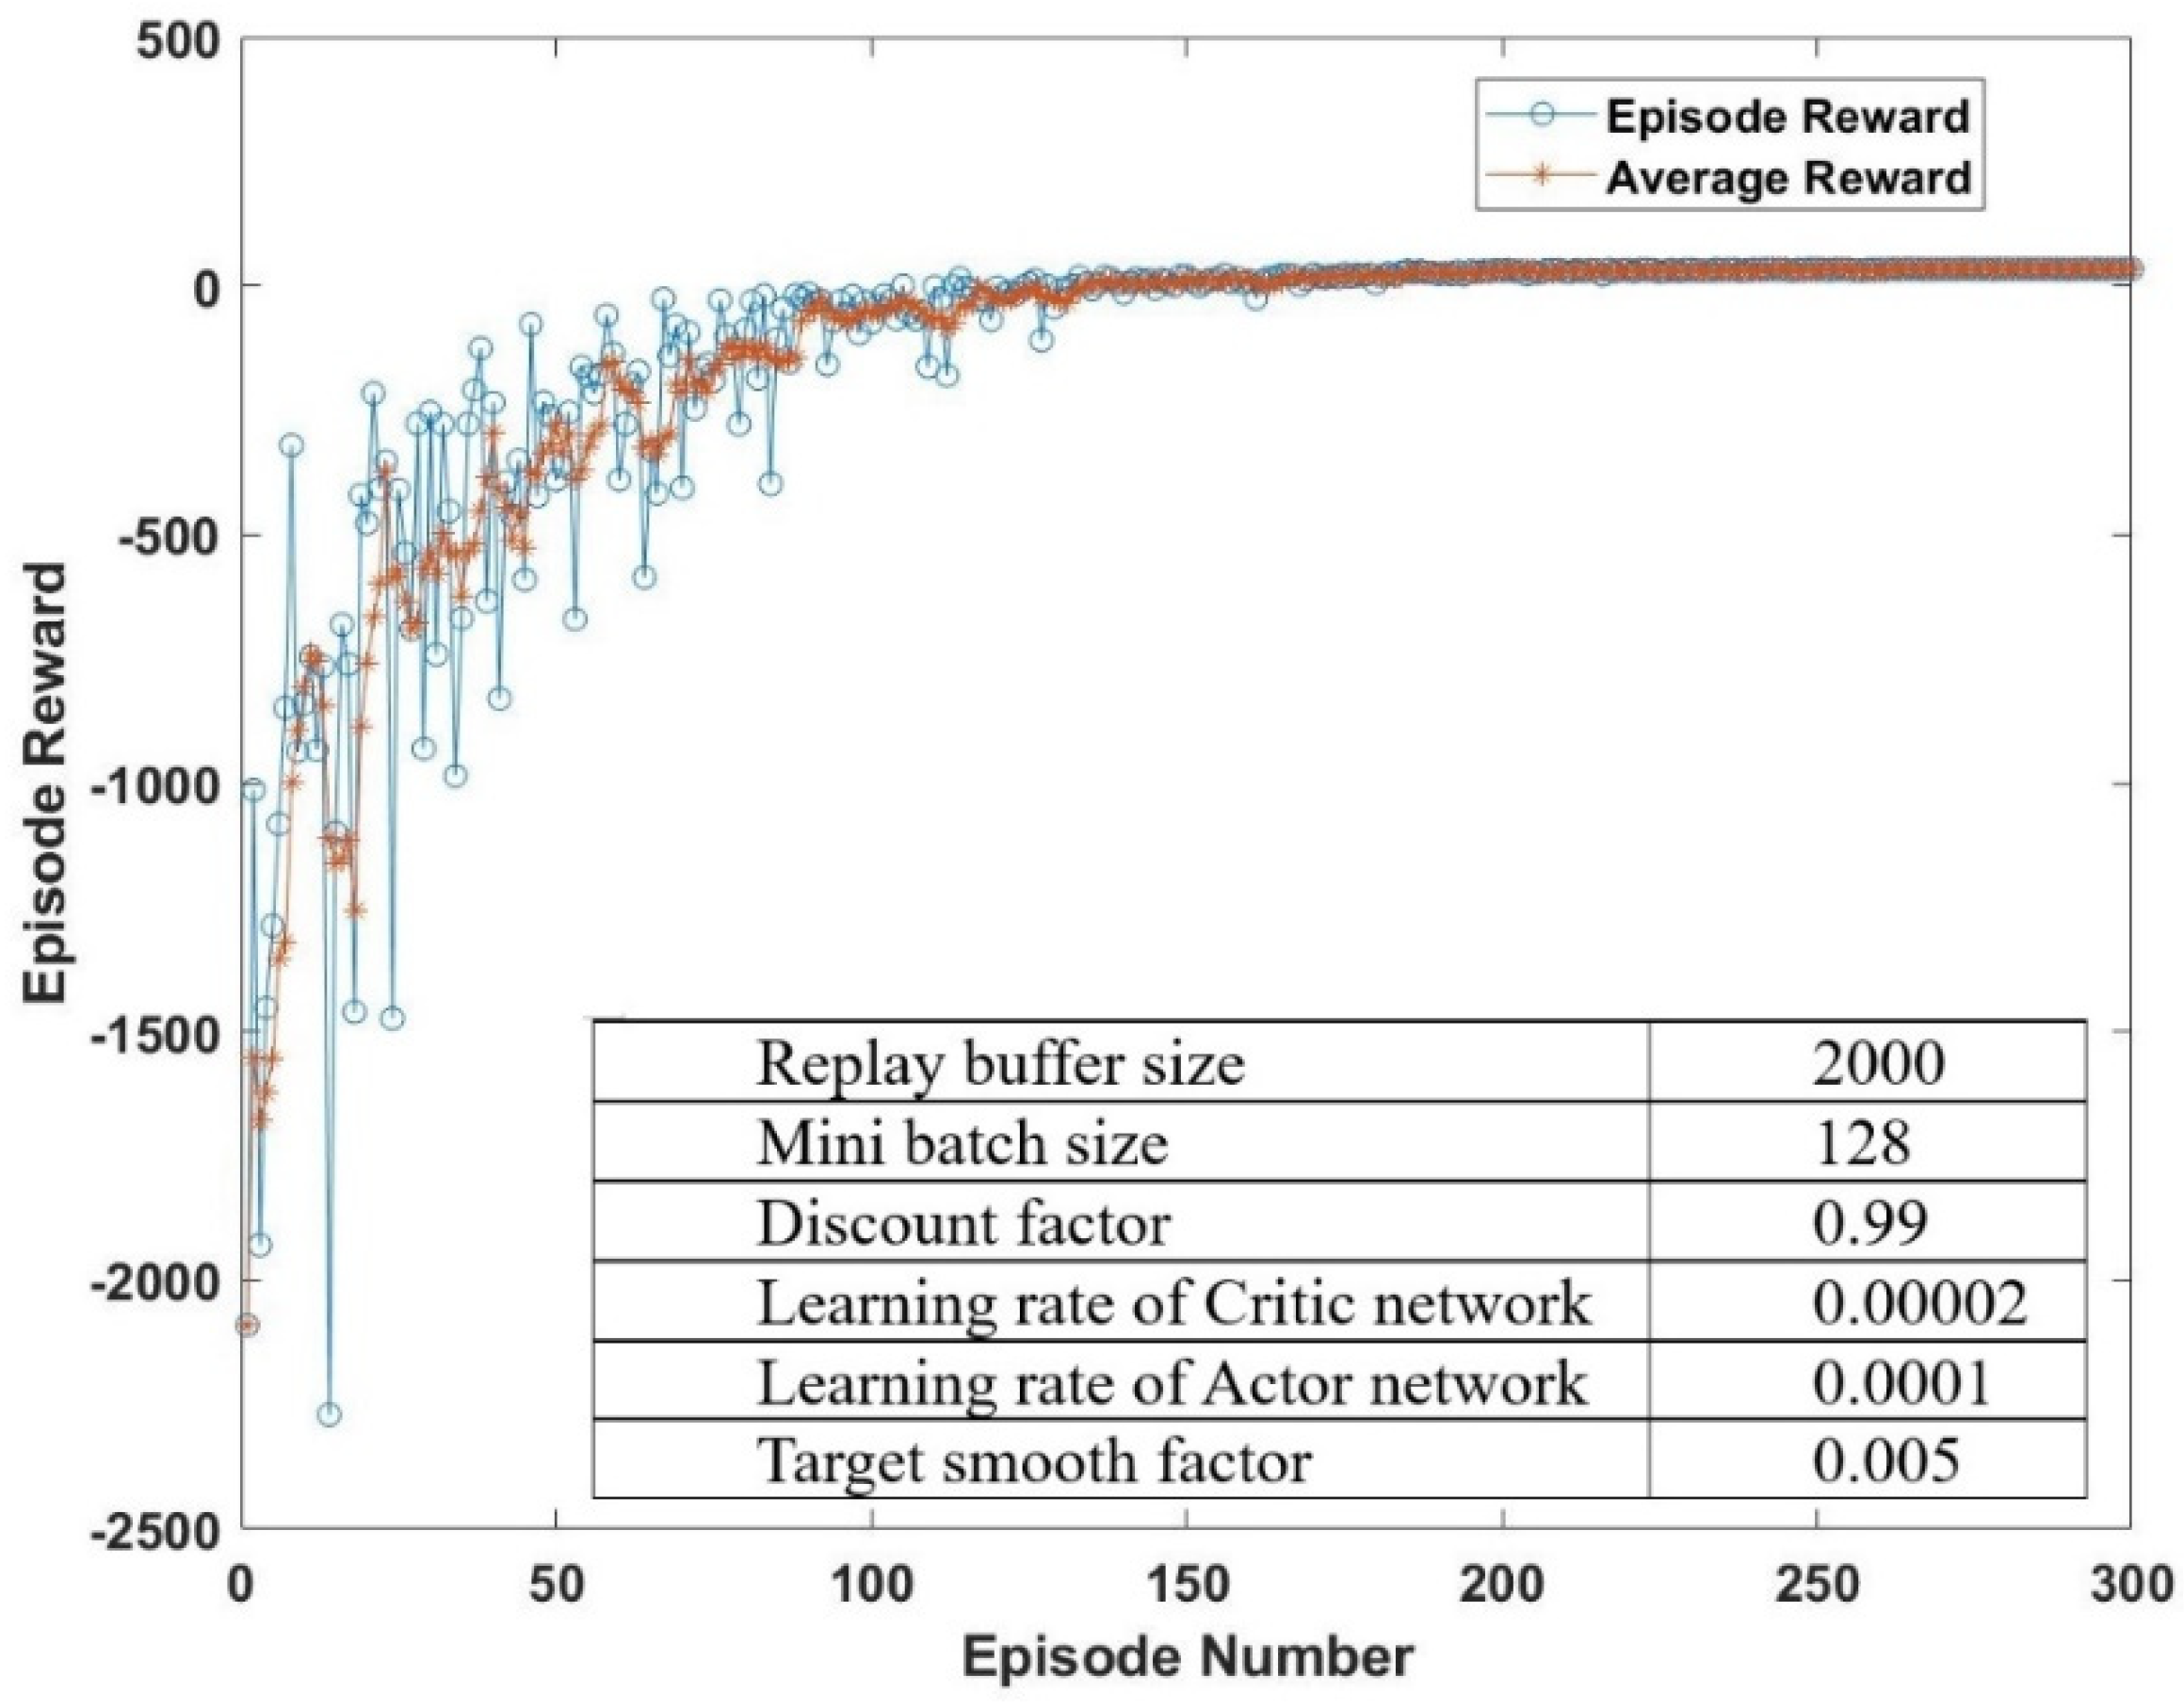
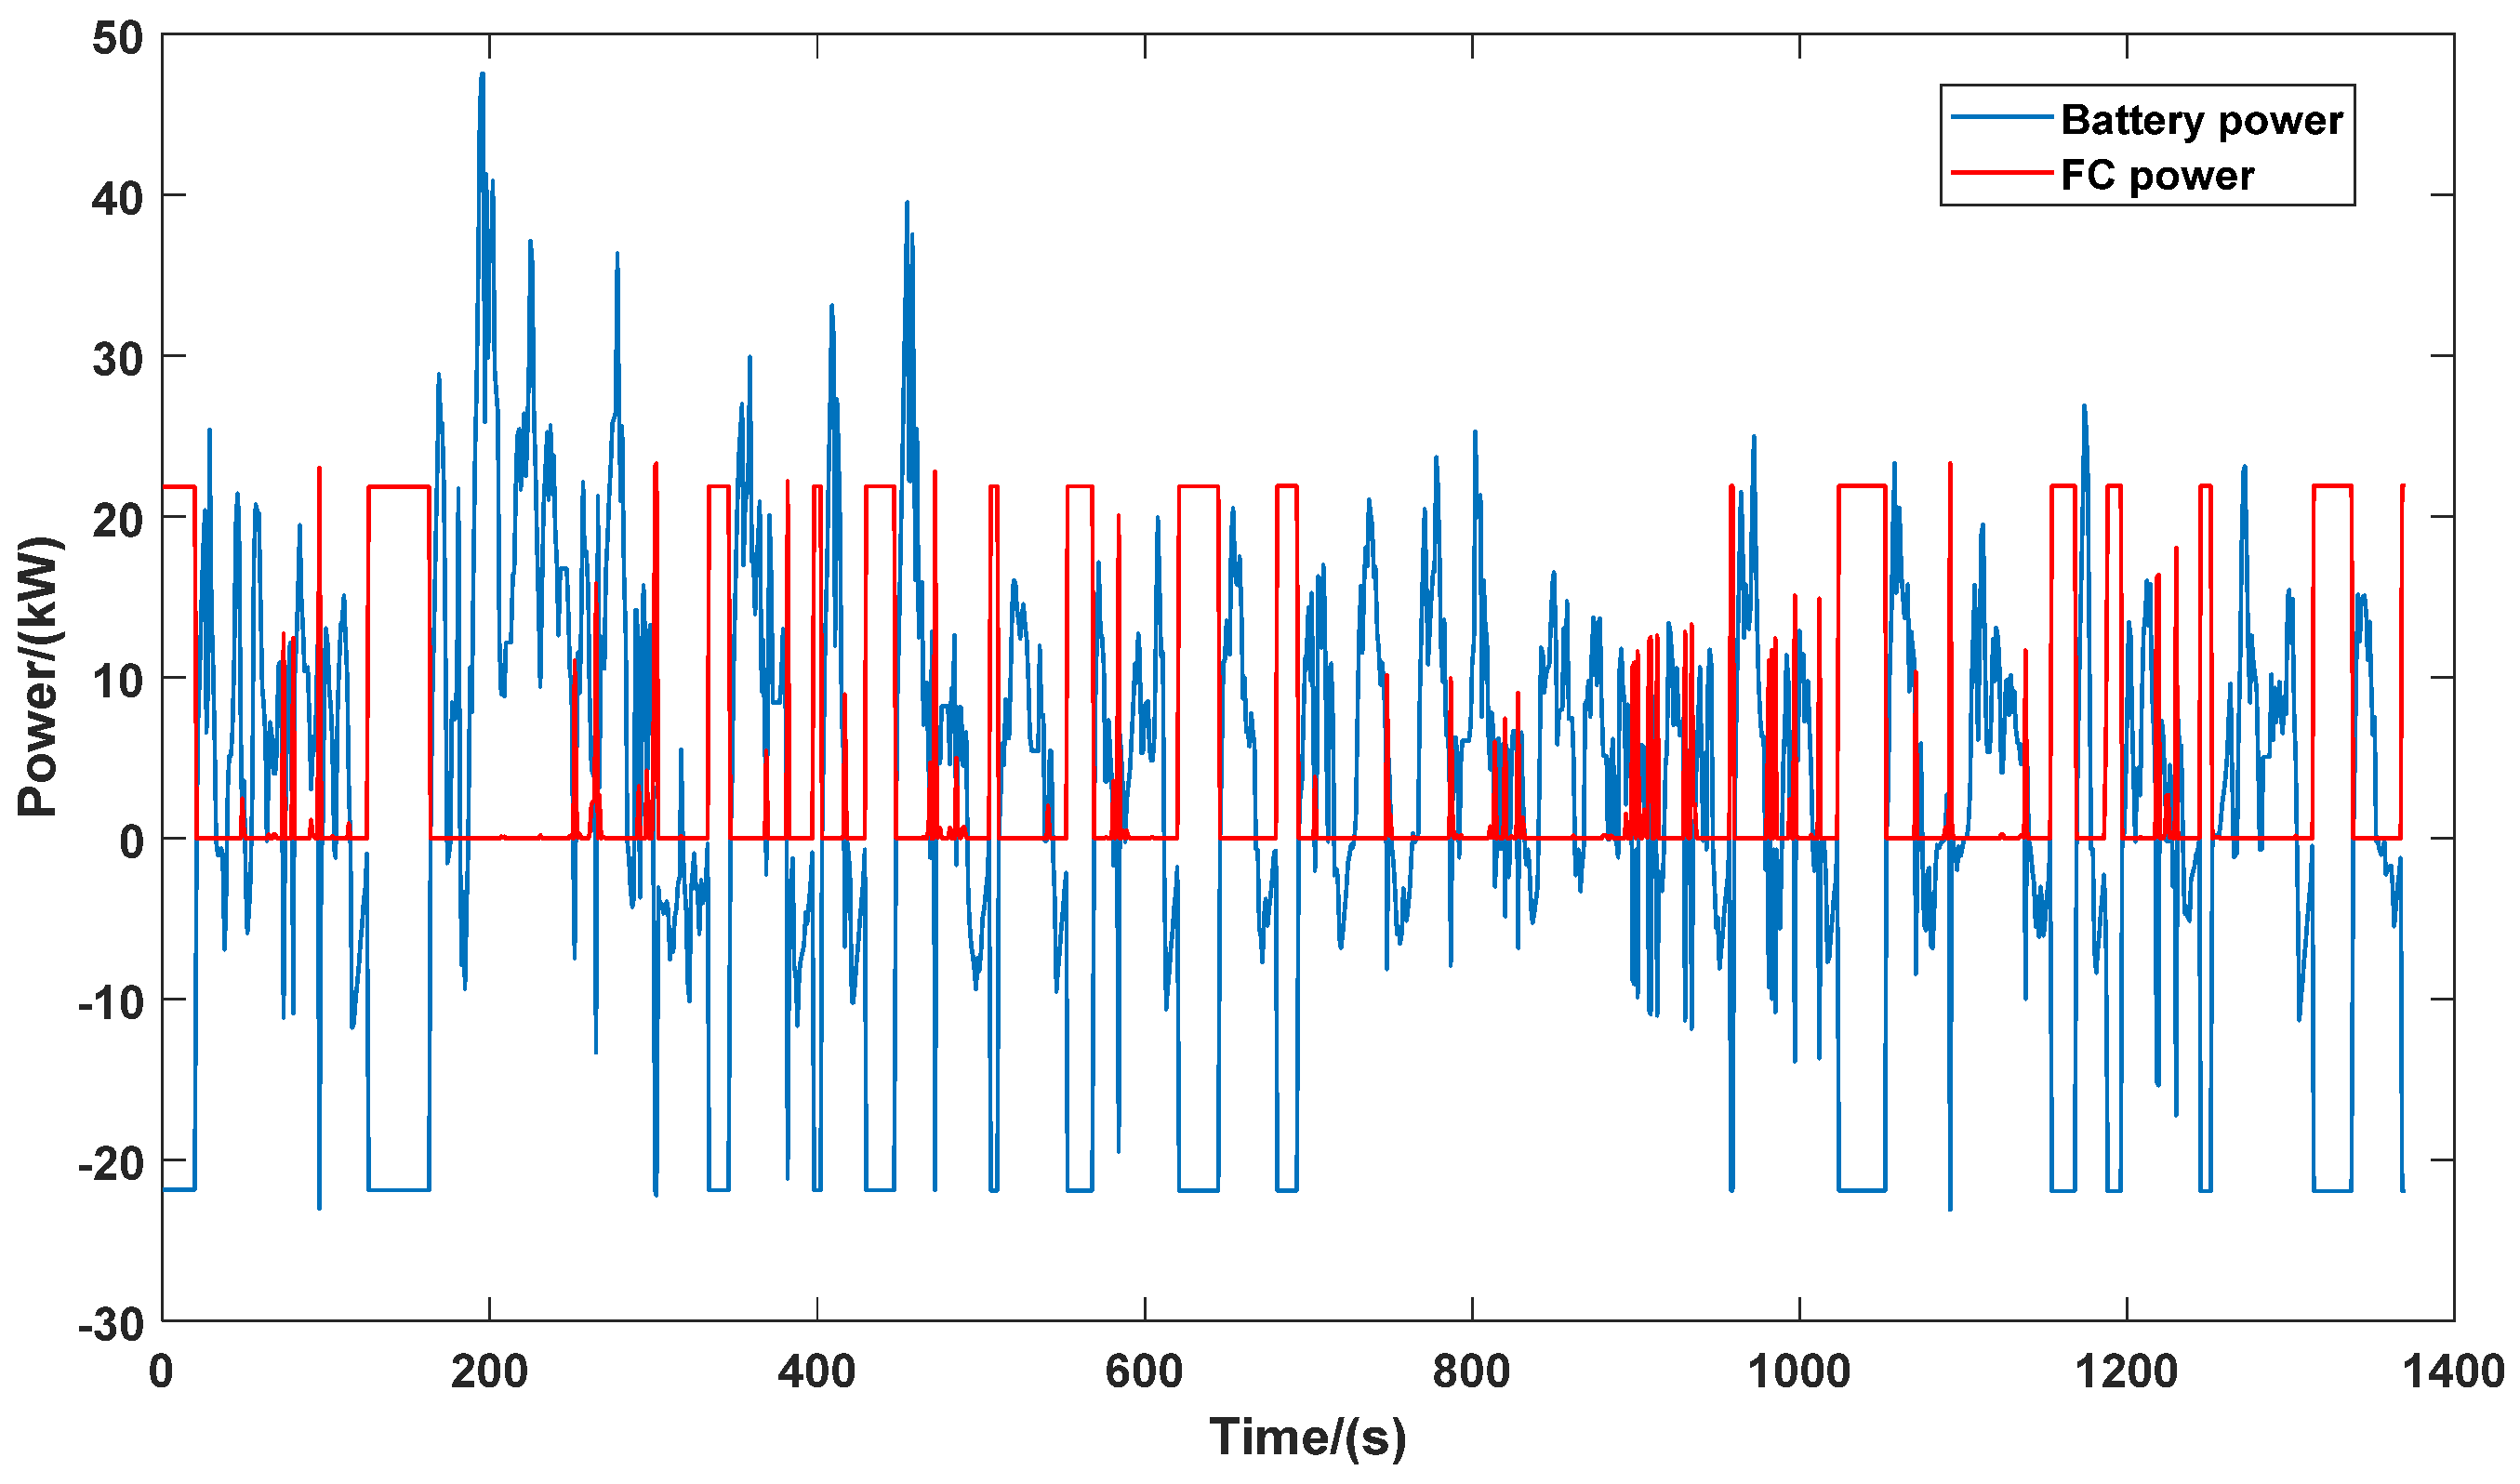
The weighting factors of hydrogen consumption, battery capacity degradation, and FC performance degradation are changed to a1 = 0.2, a2 = 0.2, and a3 = 0.6, given the preference for FC performance maintenance. The training process shown in Figure 10 also illustrates the convergent total rewards, which is taken as a successful training process of the EMS agent.
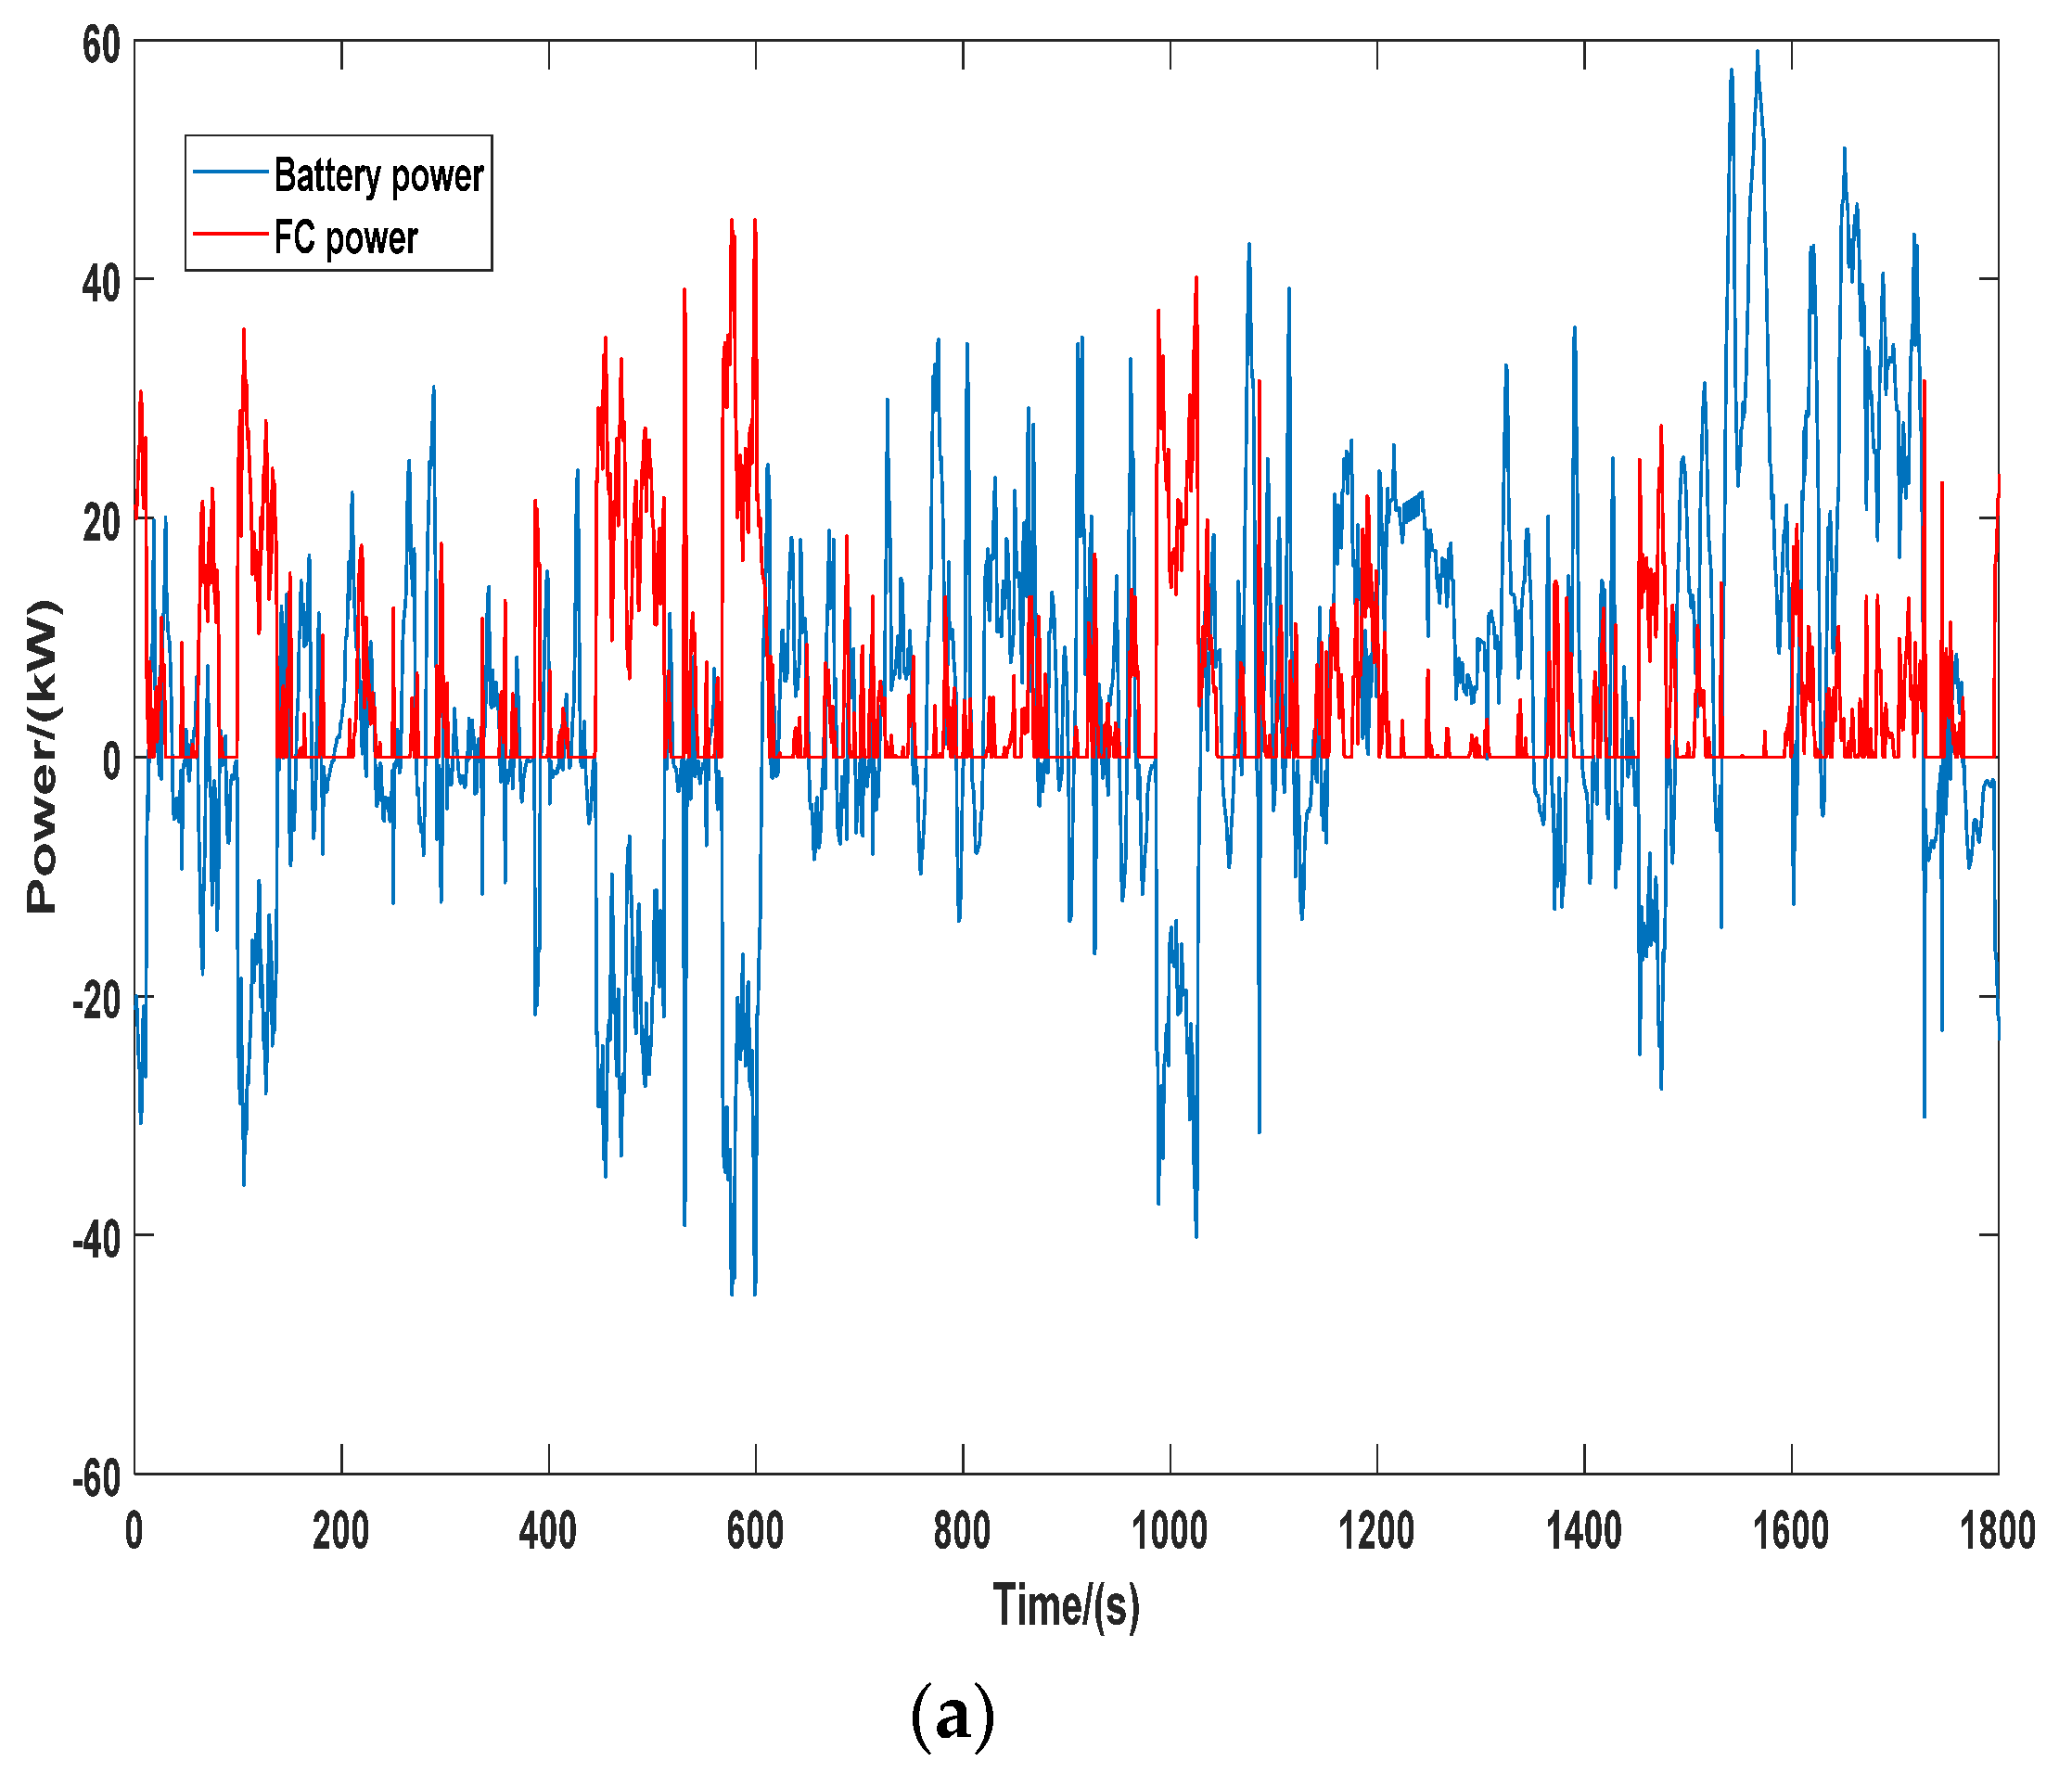
Compared to the EMS agent with balanced weight factors a1 = 0.34, a2 = 0.33, a3 = 0.33, the power distribution between the battery and FC shown in Figure 11 shows a lower threshold for battery participation; in other words, the battery takes the responsibility of taking care of FC degradation by providing power more frequently together with FC. In addition, compared to the balanced weighting factors group, the FC performance maintenance preferred weighting factors that significantly reduced the participation of FC and limited the FC power to lower than 40 kW through the cycle.
The detailed comparison of equivalent hydrogen consumption, battery capacity degradation, and FC performance degradation of EMS agents in WLTC and UDDS is summarized in Table 6. Given a FC life extension preference weighting factor, i.e., a3 = 0.6, 39.4% improvement is recorded by reducing the FC performance degradation per cycle from 0.0071 to 0.0043, while hydrogen consumption increases 12.3% from 0.3652 kg to 0.41 kg, and a significant increase in battery capacity degradation ensues.
The derived EMS agent is implemented in a new driving cycle, e.g., United States Urban Dynamometer Driving Schedule (UDDS), to validate the effectiveness of EMS in unknown driving conditions. Figure 12 and Figure 13 show the power distribution with weighting factors group of a1 = 0.34, a2 = 0.33, a3 = 0.33 and a1 = 0.2, a2 = 0.2, a3 = 0.6, respectively. Comparing these two figures, it is clear that EMS with FC performance maintenance weight factors successfully limit the participation of FC in large power events, while the battery takes the principal role in driving the vehicle. In addition, the power of FC charging battery is well restricted, with a 50% drop.
Table 7 demonstrates the performance of EMS agent in UDDS with balanced weighting factors and FC life extension preference weighting factors. Similar to the training cycle WLTC, the FC performance degradation improved 27%, while hydrogen consumption increased 10% with a tremendous deterioration of battery capacity.
It is worth noting that the comparison of EMS agent performance between WLTC and UDDS demonstrates the effectiveness of EMS agent in unknown driving conditions by showing a similar trend of the varying hydrogen consumption, battery degradation, and FC degradation. Specifically, by altering the weight factors, the EMS agent effectively reduces FC performance degradation, although at a significant cost of battery capacity degradation, which is avoidable via a different preference.

5. Conclusions

In this study, a design method based on a PSO algorithm is proposed to optimize the DoH of a FC EV. The main contribution of this article lies in the comprehensive consideration of factors affecting FC EV performance, including system cost, fuel consumption, and battery degradation. Different powertrain design schemes are discussed to meet individual needs in reducing system cost, cutting fuel consumption, or slowing the battery degradation before giving an optimized DoH solution. A DDPG-based RL EMS is developed to achieve pre-defined targets in unknown driving conditions. The EMS is derived from the WLTC-based training process and then, implemented in UDDS to investigate its effectiveness. The simulation results demonstrate that the proposed EMS agent successfully achieves the pre-defined preference, which contributes a useful tool to the academic and industry players to reach optimization via varying the weighting factors accordingly.

Author Contributions

Conceptualization, S.S. and L.H.; Data curation, Q.S.; Formal analysis, S.S.; Investigation, Q.S. and S.J.; Methodology, J.Z.; Software, Z.F. and J.R.; Supervision, Z.F., J.R. and L.H.; Visualization, S.J.; Writing—original draft, J.Z.; Writing—review & editing, C.F. All authors have read and agreed to the published version of the manuscript.

Funding

This research was founded by the national key research and development plan [2018YFB1600303], the National Natural Science Foundation of China [U1842620], the national key research and development plan [2018YFB0106501], the natural science foundation of Shandong Province [ZR2019MEE029] and Graduate Interdisciplinary Innovation Project of Yangtze Delta Region Academy of Beijing Institute of Technology (Jiaxing) [NO.GIRP2021-017].

Institutional Review Board Statement

Not applicable.

Informed Consent Statement

Not applicable.

Data Availability Statement

Not applicable.

Conflicts of Interest

The authors declare no conflict of interest.

References

  1. Ghosh, A. Possibilities and Challenges for the Inclusion of the Electric Vehicle (EV) to Reduce the Carbon Footprint in the Transport Sector: A Review. Energies 2020, 13, 2602. [Google Scholar] [CrossRef]
  2. International Energy Agency. Global EV Outlook 2017. Available online: https://www.iea.org/reports/global-ev-outlook-2017 (accessed on 9 April 2022).
  3. International Energy Agency. Global EV Outlook 2018. Available online: https://www.iea.org/reports/global-ev-outlook-2018 (accessed on 9 April 2022).
  4. Environmental Protection Agency. Fast Facts on Transportation Greenhouse Gas Emissions|US EPA. 2019. Available online: https://www.epa.gov/greenvehicles/fast-facts-transportation-greenhouse-gas-emissions (accessed on 31 January 2022).
  5. Ally, J.; Pryor, T. Life cycle costing of diesel, natural gas, hybrid, and hydrogen fuel cell bus systems: An Australian case study. Energy Policy 2016, 94, 285–294. [Google Scholar] [CrossRef]
  6. Hu, D.; Wang, Y.; Li, J.; Yang, Q.; Wang, J. Investigation of optimal operating temperature for the PEMFC and its tracking control for energy saving in vehicle applications. Energy Convers. Manag. 2021, 249, 114842. [Google Scholar] [CrossRef]
  7. Meyer, Q.; Mansor, N.; Iacoviello, F.; Cullen, P.; Jervis, R.; Finegan, D.; Tan, C.; Bailey, J.; Shearing, P.; Brett, D. Investigation of Hot Pressed Polymer Electrolyte Fuel Cell Assemblies via X-ray Computed Tomography. Electrochim. Acta 2017, 242, 125–136. [Google Scholar] [CrossRef]
  8. Mokrani, Z.; Rekioua, D.; Mebarki, N.; Rekioua, T.; Bacha, S. Energy Management of Battery-PEM Fuel Cells Hybrid Energy Storage System for Electric Vehicle. In Proceedings of the 2016 International Renewable and Sustainable Energy Conference (IRSEC), Marrakech, Morocco, 14–17 November 2016. [Google Scholar]
  9. Bethoux, O. Hydrogen Fuel Cell Road Vehicles: State of the Art and Perspectives. Energies 2020, 13, 5843. [Google Scholar] [CrossRef]
  10. Sabri, M.; Danapalasingam, K.; Rahmat, M. A review on hybrid electric vehicles architecture and energy management strategies. Renew. Sustain. Energy Rev. 2016, 53, 1433–1442. [Google Scholar] [CrossRef]
  11. Sorrentino, M.; Pianese, C.; Maiorino, M. An integrated mathematical tool aimed at developing highly performing and cost-effective fuel cell hybrid vehicles. J. Power Sources 2013, 221, 308–317. [Google Scholar] [CrossRef]
  12. Huang, M.; Wen, P.; Zhang, Z.; Wang, B.; Mao, W.; Deng, J.; Ni, H. Research on hybrid ratio of fuel cell hybrid vehicle based on ADVISOR. Int. J. Hydrogen Energy 2016, 41, 16282–16286. [Google Scholar] [CrossRef]
  13. Hu, M.; Wang, J.; Fu, C.; Qin, D.; Xie, S. Study on Cycle-Life Prediction Model of Lithium-Ion Battery for Electric Vehicles. Int. J. Electrochem. Sci. 2016, 11, 577–589. [Google Scholar]
  14. Yang, Q.; Li, J.; Yang, R.; Zhu, J.; Wang, X.; He, H. New hybrid scheme with local battery energy storages and electric vehicles for the power frequency service. eTransportation 2022, 11, 100151. [Google Scholar] [CrossRef]
  15. Yi, F.; Lu, D.; Wang, X.; Pan, C.; Tao, Y.; Zhou, J.; Zhao, C. Energy Management Strategy for Hybrid Energy Storage Electric Vehicles Based on Pontryagin’s Minimum Principle Considering Battery Degradation. Sustainability 2022, 14, 1214. [Google Scholar] [CrossRef]
  16. Yao, W.; Keil, P.; Schuster, S.; Jossen, A. Impact of Temperature and Discharge Rate on the Aging of a LiCoO2/LiNi0.8Co0.15Al0.05O2 Lithium-Ion Pouch Cell. J. Electrochem. Soc. 2017, 164, A1438–A1445. [Google Scholar]
  17. Li, J.; Wang, H.; He, H.; Wei, Z.; Yang, Q.; Igic, P. Battery Optimal Sizing under a Synergistic Framework with DQN Based Power Managements for the Fuel Cell Hybrid Powertrain. IEEE Trans. Transp. Electrif. 2021, 1, 36–47. [Google Scholar] [CrossRef]
  18. Hu, D.; Cheng, S.; Zhou, J.; Hu, L. Energy management optimization method of plug-in hybrid electric bus based on incremental learning. IEEE J. Emerg. Sel. Top. Power Electron. 2021. [Google Scholar] [CrossRef]
  19. Ettihir, K.; Boulon, L.; Agbossou, K. Energy management strategy for a fuel cell hybrid vehicle based on maximum efficiency and maximum power identification. IET Electr. Syst. Transp. 2016, 6, 261–268. [Google Scholar] [CrossRef]
  20. Ghaderi, R.; Kandidayeni, M.; Soleymani, M.; Boulon, L.; Chaoui, H. Online energy management of a hybrid fuel cell vehicle considering the performance variation of the power sources. IET Electr. Syst. Transp. 2020, 10, 360–368. [Google Scholar] [CrossRef]
  21. Davis, K.; Hayes, J. Fuel cell vehicle energy management strategy based on the cost of ownership. IET Electr. Syst. Transp. 2019, 9, 226–236. [Google Scholar] [CrossRef]
  22. Feng, Y.; Dong, Z. Optimal energy management strategy of fuel-cell battery hybrid electric mining truck to achieve minimum lifecycle operation costs. Int. J. Energy Res. 2020, 44, 10797–10808. [Google Scholar] [CrossRef]
  23. Meng, X.; Li, Q.; Zhang, G.; Wang, T.; Chen, W.; Cao, T. A Dual-Mode Energy Management Strategy Considering Fuel Cell Degradation for Energy Consumption and Fuel Cell Efficiency Comprehensive Optimization of Hybrid Vehicle. IEEE Access 2019, 7, 134475–134487. [Google Scholar] [CrossRef]
  24. Zhou, Y.; Huang, L.; Sun, X.; Li, H.; Lian, J. A Long-term Energy Management Strategy for Fuel Cell Electric Vehicles Using Reinforcement Learning. Fuel Cells 2020, 20, 753–761. [Google Scholar] [CrossRef]
  25. Meng, X.; Li, Q.; Zhang, G.; Wang, X.; Chen, W. Double Q-learning-based Energy Management Strategy for Overall Energy Consumption Optimization of Fuel Cell/Battery Vehicle. In Proceedings of the 2021 IEEE Transportation Electrification Conference and Expo, Chicago, IL, USA, 21–25 June 2021. [Google Scholar]
  26. Yavasoglu, H.; Tetik, Y.; Ozcan, H. Neural network-based energy management of multi-source (battery/UC/FC) powered electric vehicle. Int. J. Energy Res. 2020, 44, 12416–12429. [Google Scholar] [CrossRef]
  27. Shi, X.; Li, Y.; Sun, B.; Xu, H.; Yang, C.; Zhu, H. Optimizing zinc electrowinning processes with current switching via Deep Deterministic Policy Gradient learning. Neurocomputing 2020, 380, 190–200. [Google Scholar] [CrossRef]
  28. Ruan, J.; Zhang, B.; Liu, B.; Wang, S. The Multi-objective Optimization of Cost, Energy Consumption and Battery Degradation for Fuel Cell-Battery Hybrid Electric Vehicle. In Proceedings of the 2021 11th International Conference on Power, Energy and Electrical Engineering (CPEEE), Shiga, Japan, 26–28 February 2021. [Google Scholar]
  29. Pei, P.; Chen, H. Main factors affecting the lifetime of Proton Exchange Membrane fuel cells in vehicle applications: A review. Appl. Energy 2014, 125, 60–75. [Google Scholar] [CrossRef]
  30. Pei, P.; Chang, Q.; Tang, T. A quick evaluating method for automotive fuel cell lifetime. Int. J. Hydrogen Energy 2008, 33, 3829–3836. [Google Scholar] [CrossRef]
  31. Omar, N.; Monem, M.; Firouz, Y.; Salminen, J.; Smekens, J.; Hegazy, O.; Gaulous, H.; Mulder, G.; Van den Bossche, P.; Coosemans, T.; et al. Lithium iron phosphate based battery—Assessment of the aging parameters and development of cycle life model. Appl. Energy 2014, 113, 1575–1585. [Google Scholar] [CrossRef]
  32. Song, Z.; Li, J.; Han, X.; Xu, L.; Lu, L.; Ouyang, M.; Hofmann, H. Multi-objective optimization of a semi-active battery/supercapacitor energy storage system for electric vehicles. Appl. Energy 2014, 135, 212–224. [Google Scholar] [CrossRef]
  33. Song, Z.; Hofmann, H.; Li, J.; Han, X.; Ouyang, M. Optimization for a hybrid energy storage system in electric vehicles using dynamic programing approach. Appl. Energy 2015, 139, 151–162. [Google Scholar] [CrossRef]
  34. Song, K.; Liu, L.; Li, F.; Feng, C. Degree of Hybridization Design for a Fuel Cell/Battery Hybrid Electric Vehicle Based on Multi-objective Particle Swarm Optimization. In Proceedings of the 3rd Conference on Vehicle Control and Intelligence, Hefei, China, 21–22 September 2019. [Google Scholar]
  35. Max, W.; Gregorio, L.; Ahmad, M. Reversible Fuel Cell Cost Analysis; Energy Analysis & Environmental Impacts Division: Berkeley, CA, USA, 2020. [Google Scholar]
Figure 1. Structure of the fuel cell hybrid electric vehicle.
Sustainability 14 06320 g001
Figure 2. Motor efficiency map.
Sustainability 14 06320 g002
Figure 3. PEMFC system efficiency.
Sustainability 14 06320 g003
Figure 4. Battery Rint model.
Sustainability 14 06320 g004
Figure 5. (a) Fitness value searching for balanced optimization. (b) Fitness value searching for battery performance degradation preferred optimization. (c) Fitness value searching for system cost preferred optimization. (d) Fitness value searching for hydrogen consumption preferred optimization.
Sustainability 14 06320 g005aSustainability 14 06320 g005b
Figure 6. (a) Fitness value searching for balanced optimization. (b) Fitness value searching for battery performance degradation preferred optimization. (c) Fitness value searching for system cost preferred optimization (d) Fitness value searching for hydrogen consumption preferred optimization.
Sustainability 14 06320 g006
Figure 7. DDPG algorithm for EMS optimization.
Sustainability 14 06320 g007
Figure 8. Training process of EMS agent with weighting factors a1 = 0.34, a2 = 0.33, a3 = 0.33.
Sustainability 14 06320 g008
Figure 9. Power distribution between FC and battery in WLTC in selected training episode with weighting factors a1 = 0.34, a2 = 0.33, a3 = 0.33 (a) Complete cycle; (b) Part of the cycle.
Sustainability 14 06320 g009
Figure 10. Training process of EMS agent with weighting factors a1 = 0.2, a2 = 0.2, a3 = 0.6.
Sustainability 14 06320 g010
Figure 11. Power distribution between FC and battery in WLTC in selected training episode with weighting factors a1 = 0.2, a2 = 0.2, a3 = 0.6, (a) Complete cycle; (b) Part of the cycle.
Sustainability 14 06320 g011aSustainability 14 06320 g011b
Figure 12. Power distribution between FC and battery in UDDS in selected training episode with weighting factors a1 = 0.34, a2 = 0.33, a3 = 0.33.
Sustainability 14 06320 g012
Figure 13. Power distribution between FC and battery in UDDS in selected training episode with weighting factors a1 = 0.2, a2 = 0.2, a3 = 0.6.
Sustainability 14 06320 g013
Table 1. Vehicle specifications.
ParameterValueUnit
Front area2.18m2
Aerodynamic drag coefficient0.32N/A
Coefficient of rolling resistance0.0105N/A
Equipped mass1750kg
Correction coefficient of rotating mass1.05N/A
Acc performance (0–100 km/h)10s
Hill-climbing capability30@30 km/h° (degree)
Top speed120km/h
Table 2. Specification of selected electric machine.
ParameterValueUnit
Rated power50kW
Peak power120kW
Rated speed5500rpm
Max speed14,000rpm
Rated torque90Nm
Max torque215Nm
Table 3. FC specifications.
ParameterVariableValueUnit
Cell numbersN80
Peak powerPfc,Max45kW
Peak currentIst,Max300A
Stack massFCMass13.1kg
Table 4. Specifications of two battery types.
Battery ParametersDoH < ThresholdDoH > Threshold
Energy density0.156 kWh/kg0.156 kWh/kg
Power density2.4 kW/kg0.96 kW/kg
Weight31.25 kg125 kg
Voltage375 V375 V
Table 5. Optimization results of the DoH.
DoH RangeWeight CoefficientsOptimal DoHFitness Value
[0, 0.375]a1 = 0.34, a2 = 0.33, a3 = 0.330.20161.1088
a1 = 0.2, a2 = 0.2, a3 = 0.60.23230.6703
a1 = 0.2, a2 = 0.6, a3 = 0.20.03470.7399
a1 = 0.6, a2 = 0.2, a3 = 0.20.34931.711
[0.375, 1]a1 = 0.34, a2 = 0.33, a3 = 0.330.37551.1337
a1 = 0.2, a2 = 0.2, a3 = 0.60.38210.6794
a1 = 0.2, a2 = 0.6, a3 = 0.20.37500.8507
a1 = 0.6, a2 = 0.2, a3 = 0.20.37501.7060
Table 6. Results comparison of DDPG-based EMS agent with different weighting factors in WLTC.
Weighting Factors (a1,a2,a3)Equivalent Hydrogen ConsumptionBattery Capacity DegradationFC Performance Degradation
0.34–0.3–0.330.558 kg0.01260.0073
0.2–0.2–0.60.629 kg0.01420.0068
Table 7. Results comparison of DDPG-based EMS agent with different weighting factors in WLTC.
Weighting Factors (a1,a2,a3)Equivalent Hydrogen ConsumptionBattery Capacity DegradationFC Performance Degradation
0.34–0.3–0.330.4284 kg0.00360.0618
0.2–0.2–0.60.6447 kg0.00610.0535
Publisher’s Note: MDPI stays neutral with regard to jurisdictional claims in published maps and institutional affiliations.

