
Risk Network Evaluation of Prefabricated Building Projects in Underdeveloped Areas: A Case Study in Qinghai

1
School of Civil Engineering, Qinghai University, Xining 810016, China
2
Qinghai Building and Materials Research Co., Ltd., Xining 810008, China
3
Qinghai Provincial Key Laboratory of Plateau Green Building and Eco-Community, Xining 810008, China
*
Author to whom correspondence should be addressed.
Sustainability 2022, 14(10), 6335; https://0-doi-org.brum.beds.ac.uk/10.3390/su14106335
Submission received: 14 April 2022
/
Revised: 18 May 2022
/
Accepted: 18 May 2022
/
Published: 23 May 2022
(This article belongs to the Topic Advances in Construction and Project Management)
Abstract
:Prefabricated building projects (PBPs) face more risks than traditional construction projects, especially in underdeveloped areas. This study takes Qinghai Province as a study case. Social network analysis (SNA) is adopted to develop a risk network of PBPs, and nine core risk factors and five key risk relationships are identified. Risk effect detection reveals the effectiveness of risk response strategies. The research shows that PBPs in underdeveloped areas are still in the early stage of development, and developers generally lack a leading role. There are prominent problems in the design stage of PBPs, so the stakeholders pay special attention to them. In underdeveloped regions, the development of PBPs must rely on the strong promotion of the government. Limited by natural and economic conditions, the market mechanism of PBPs in underdeveloped areas is not perfect, and policy regulation greatly affects the spread of the risk network. Therefore, local governments need to actively introduce corresponding supportive policies and mobilize the enthusiasm of stakeholders. This is the first study to consider the risk within the life cycle of PBPs in underdeveloped plateau areas. This study expands the research system of risk management of PBPs and provides valuable risk response strategies for the stakeholders.
1. Introduction
Compared with traditional buildings, prefabricated building projects (PBPs) can reduce construction energy consumption by 20%, conserve construction materials by 60%, save labor by 40%, and shorten the construction period by one-third [1]. Therefore, PBPs have significant advantages in protecting the environment and conserving resources [2,3], which are regarded as the key to the industrialization and upgrading of the construction industry [4,5]. During China’s “13th Five-Year Plan” period, the national prefabrication rate is required to reach 15% [6]. In 2020, the national prefabrication rate reached 20.5% [7], and the work target of the “13th Five-Year Plan of Action for Prefabricated Buildings” has been completed.
However, the development of PBPs in China shows obvious regional distribution characteristics of “strong in the east and weak in the west”. The plateau areas in western China are restricted by natural and economic conditions [8]. Therefore, unlike the rapid development of PBPs in eastern, coastal China, PBPs in the western plateau develop slowly [7]. Qinghai Province is one of the typical underdeveloped plateau regions in China [9]. By the end of 2021, the new PBPs area in Qinghai Province has reached 1,557,900 square meters in the past five years [10], and the prefabrication rate is still less than 10%. The low degree of industrialization [11] and the prominent contradiction between economic development and the ecological environment [12] restrict the development of these regions [13]. Furthermore, the promotion and construction costs of PBPs are much higher than traditional buildings [14], and the climate and geological conditions in the plateau region have greatly increased labor costs and material transportation costs [15]. There are also problems in respect of unsound policies and inconsistent design standards. In short, the unique characteristics of construction projects, such as large construction investment, long periods, complex natural and technical conditions, and unpredictable external environmental impacts [16], expose them to many risks [17].
Due to the changes in construction methods, PBPs face more risks than traditional construction projects [18], especially in underdeveloped plateau areas. In order to control the risk factors that hinder the success of PBPs to the greatest extent, improve the risk management level of projects effectively, reduce project losses, and promote the development of PBPs, experts and scholars in the construction project industry have been keen on risk management research.
When exploring the risks of PBPs in China, “imperfect policies and regulations” [1,19] have been listed as the primary risk many times, reflecting the importance of policies. In terms of supply chain management risks of PBPs, “poor planning of resources and schedules”, “poor control of working flows”, and “poor information sharing” were the three major challenges in Hong Kong [20], and “component supply” [21] also required attention. The “economic situation” ranked first in the cost and schedule risk of PBPs in North America [22] and the investment risk of PBPs in China [23]. The construction cost risk of PBPs in South Korea mainly came from the design stage and construction stage [24]. Furthermore, the core stakeholders of a project in Nanjing were developers and contractors [25].
In previous studies, the content of risk management of PBPs has great regional differences. The core risks faced by PBPs in different regions were different, so there was no universal risk response strategy. In addition, the risk stages of each study were also different. Some studies only focused on the risk factors of a single construction stage, while others integrated risk across the life cycle of PBPs.
These studies provide diversified perspectives and personalized cases for the risk research of PBPs. However, most studies were carried out in countries with relatively developed economies and prosperous construction industries [20,22,24,26,27,28], which could not provide specific management ideas and development strategies for the risk management of PBPs in underdeveloped areas in China. The PBPs are in a complex social network environment, and various risk factors will also change due to different stakeholders. In addition, the current risk management system of PBPs in China is not perfect. Most of the existing research on risk assessment of PBPs regard risk factors as isolated points, and there are many studies on the influence of independent risk factors [29,30,31,32,33]. These studies did not consider the complex relationships among risks and the perspective of interrelationships among risk factors.
Therefore, exploring the relative importance of risk factors is significant for developing PBPs in underdeveloped areas. This paper takes Qinghai Province as a study case to develop and analyze the risk network of PBPs and control core risks and key relationships to block the spread of risks. The research can provide valuable information for developing PBPs in underdeveloped plateau areas.
2. Literature Review
2.1. Development of PBPs in China
The concept of PBPs first appeared in China in the 1950s [34]. In the 1980s, China began to promote industrialized buildings, and PBPs gradually developed [5]. However, by the 1990s, the development of PBPs remained stagnant due to the constraints of the technical level, economic conditions, and people’s cognition [26]. Although China introduced PBPs decades ago, the application of PBPs still faces major problems [31]. Since the General Office of the State Council issued a policy on vigorously developing PBPs in 2016, China’s PBPs have developed rapidly. The PBPs are very attractive to China’s construction industry [14] because they conform to the construction concept of “sustainable green development” [35]. With the increasing demand for PBPs in China’s construction industry, the central government has promulgated many policies to promote the development of PBPs [34]. However, the development of PBPs in China, including related technical levels, is still in its infancy [23], resulting in a relatively low proportion of PBPs in the existing building stock [36].
Many researchers have explored the reasons that hinder the development of PBPs from finding effective solutions. Lu et al. [37] developed a PBP analysis framework with 13 unfavorable factors to study the optimal level of prefabrication and clarify the prevailing misconception that “the higher the prefabrication level, the better”. Xie et al. [28] used the importance–performance analysis (IPA) to explore the sustainability importance and performance levels of PBPs from three dimensions (economic, social, and ecological sustainability) and proposed key sustainability criteria. Hong et al. [38] established a framework for cost-benefit analysis of PBPs and suggested that future development should focus on providing financial support for advancing technology development, optimizing structural integrity, and increasing market maturity. Liang et al. [39] used the fuzzy analytic hierarchy process (fuzzy AHP) to develop a performance evaluation model, which provided reliable support for the decision-making stage of PBPs. These studies used different methods and provided suggestions for promoting the development of PBPs from different dimensions but ignored the geographical situation. The economic level and natural conditions of different regions are quite different. For example, PBPs are better developed in the eastern provinces of China and lag behind in the western and northwestern provinces [40]. Even though the implementation of some PBP incentive policies is not effective [41], the government plays a leading role in the promotion of new things [42]. Therefore, relying on policies to promote the development of PBPs is still considered a strong strategy in less developed regions [43].
2.2. Risk Management of PBPs
The Project Management Institute [44] defines risk as “an uncertain event or condition that, if it occurs, has a positive or negative effect on a project’s objectives.” Construction is a highly risk-prone industry [45], and the risks of PBPs are more prominent than those of traditional buildings [30]. No project is risk-free [46], but effective risk management can minimize the impact of risk [47]. Therefore, many researchers believe that it is necessary to take risk management as an important part of project management in PBPs [48].
The construction goals of PBPs are wider and longer than those of traditional construction. In addition, PBPs have the typical expression of economic externality. The long-term benefits of PBPs are difficult to quantify and cannot be directly reflected, making risk management more difficult for stakeholders [30]. The high initial investment is one of the most significant risks of PBPs [29]. The PBPs face the uncertainty of future investment income and the possible loss of investment principal. The PBPs will face serious risks if risk management measures are inadequate [49]. Li [23] used structural equation modeling (SEM) to explore the factors of an investment risk evaluation system from the policy, market, technology, economy, and management perspectives, and proposed a method that can evaluate the investment risk. Li et al. [30] constructed a risk identification feedback graph and a risk flow chart using the system dynamics method to comprehensively identify investment risks that projects in China may face, and identify four key risk factors. Ye et al. [35] established a dynamic evolution model of PBP cost risk based on the dynamic Bayesian network (DBN) and studied the construction cost risk evolution and transfer mechanism of PBPs. Rose [27] used an interactive research approach to conduct a case study of a Swedish PBP and proposed solutions for three major risks. Xia et al. [26] analyzed the risks faced by PBPs using EPC from the perspective of general contractors, conducted an empirical study in Nanjing, China, and found that construction and design are the main factors that determine the level of project risk.
In addition to the risks at various stages, the overall risks in the life cycle of PBPs are also worthy of attention. Yuan et al. [19] established a risk network containing 41 factors based on the life cycle theory and proposed ten challenges that must be solved for PBPs. Wang et al. [36] identified 77 risk factors covering the life cycle of PBPs using an important performance analysis method and revealed eight key risks. Luo et al. [20] explored the supply chain risks of the identified 30 PBPs in Hong Kong using social network analysis (SNA), and finally came up with three main challenges and gave specific response strategies. Identifying the risks in PBPs accurately and proposing strategies for different types of risks is a common research process in the current risk management of PBPs [46,47].
3. Methodology
SNA originated from sociological research [50]. SNA is a quantitative analysis method that uses graph theory and mathematical methods to quantitatively analyze the relationship between actors (nodes) in the network. The whole network analysis is suitable for exploring the overall characteristics of the network relationship structure, and the ego-network analysis is applied to quantify the impact of the attributes, positions, and degrees of individuals in the network [51]. Combined with the characteristics of multiple parallel processes, complex stakeholder relations, and emphasis on the integration of PBPs, SNA has its unique advantages over classical risk network research methods such as interpretative structural modeling (ISM) and the bayesian network (BN). This study constructs and evaluates the risk network of PBPs in Qinghai Province based on SNA, and follows a classical risk management framework [19,20,44]. The research framework is shown in Figure 1.
In the risk identification stage, boundary identification is the first step. The main stakeholders and key risk factors are explored to determine the risk list by combining literature review and expert interviews. Then, the relationship between risks is determined through a questionnaire survey and consensus analysis, thus building a risk network adjacency matrix. In the risk assessment stage, a risk network model is constructed for PBPs in Qinghai Province, and the relationship between the risk factors is revealed based on SNA to identify the core risk. The risk network model and field investigations are analyzed comprehensively in the risk response stage. Then, the actual risk response strategy is put forward according to expert suggestions. Finally, the effect of various indicators of the risk network is evaluated to test the criticality and effectiveness of the risk response strategy.
The respondents who filled out the questionnaire and were interviewed were the same experts in the research process. This study followed the principle of stakeholder sampling [52], and experts were selected and invited. Based on our stakeholder analysis (Section 4.1.1), six stakeholder groups (Developer, Designer, Contractor, Manufacturer, Government, and Facility) were surveyed in Qinghai Province. A total of 12 experts (two people in each stakeholder group) in the field of PBPs in Qinghai Province were contacted through the internet and recommendations from cooperative schools and enterprises. One of the experts was not willing to be interviewed, so 11 experts were finally interviewed. The background information of the 11 experts is shown in Table 1. Experts meet the following requirements:
- They have more than six years of work experience in PBPs in Qinghai Province.
- They participated in and completed at least two PBPs in Qinghai Province.
- They have senior titles or hold senior positions in their organizations.

Table 1.
Profiles of respondents.
| Experts | Position | Years of Working in PBPs | Number of PBPs | Professional Title | |
|---|---|---|---|---|---|
| Developer | 1 | Technology | 6–10 years | At least 5 projects | Intermediate title |
| 2 | Research | 6–10 years | At least 5 projects | Intermediate title | |
| Designer | 1 | Management | More than 20 years | 2 projects | Senior title |
| 2 | Technology | 11–15 years | 2 projects | Senior title | |
| Contractor | 1 | Management | 16–20 years | 2 projects | Senior title |
| 2 | Technology | 6–10 years | At least 5 projects | Intermediate title | |
| Manufacturer | 1 | Management | More than 20 years | At least 5 projects | Senior title |
| 2 | Technology | 6–10 years | At least 5 projects | Intermediate title | |
| Government | 1 | Management | More than 20 years | 3 projects | Senior title |
| 2 | Administration | 11–15 years | 4 projects | Intermediate title | |
| Facility | 1 | Management | 6–10 years | At least 5 projects | Intermediate title |
Before the first face-to-face interview, the research background, purpose, and risk factors collated from a literature review were emailed to experts. Short interviews with experts were completed by phone and email. Experts were invited to review the representativeness of risk factors and judge whether they fit the actual situation in Qinghai Province. Some experts had proposed new risk factors and given reasons. Then, the questionnaire was designed according to the compiled list of risk factors (Section 4.2) and the special data form [52] required for SNA. Two points should be noticed when designing the questionnaire:
- The relationship between risks may be mutual, but the effects may be different. For example, risk A directly affects risk B, but risk B does not directly affect risk A.
- It is necessary for respondents to theoretically judge 1600 groups (40 × 40) of relations to obtain the data in the matrix form. However, overwork may lead to unclear thinking and judgment of respondents, resulting in larger errors.
Based on the above key points and design skills, the questionnaire consists of the introduction, basic information, the judgment of the interaction between risk factors, and thanks. The binary matrix is used to quantify the relationship between the risks of each group, and the judgment of the risk relationship is the core part of data collection. The risk factors of the line and the column are compared. If the respondents think that the line risk factor directly affects the column risk factor, “1” will be filled at the intersection of the line and column; otherwise, respondents will fill “0”. The questionnaire has eliminated the intersection of risk factors that almost have no mutual influence, and the respondents only judge the possible relationship, thus improving the quality of the questionnaire.
We made an appointment with each expert before the one-on-one interview and informed them that the interview was expected to take 60–90 min. The first face-to-face interview was mainly divided into three processes:
- General Introduction. Experts were provided with the background, purpose, and refined list of risk factors.
- Questionnaire. Experts were invited to fill out the questionnaire on-site.
- Semistructured interview. Experts talked about their opinions and suggestions on the development of prefabricated buildings in Qinghai Province.
Each interview took an average of 70 min, and the interview time was adequate and effective [19]. After obtaining the consent of experts, interview processes were recorded to ensure the completeness of the materials.
During the risk response phase, a second interview was conducted to invite the above 11 experts to propose some targeted risk response strategies based on our research findings. Because of the experience of the first interview, the second interview process went smoothly. After the expert interview, field research was conducted at a national prefabricated construction industry demonstration base in Qinghai Province to ensure the strategy was on the ground. The views and demands of managers and operational workers were adopted to help refine the risk response strategy.
4. Risk Identification
4.1. Boundary Identification
4.1.1. Critical Stakeholders
Freeman [53] defines “stakeholders” as individuals and collectives that can influence the realization of or be affected by organizational goals. In the PBP, stakeholders are individuals or organizations that work hard to achieve the project goals or are affected by the construction process of the project. PBP risks run through the life cycle of the project that involves many stakeholders, and different stakeholders have different priorities [54] that should be taken into account.
As shown in Figure 2, core stakeholders and the relevant statistics are selected from 10 papers related to stakeholders of PBPs [19,20,25,36,55,56,57,58,59,60]. Since the focus of this research is not on the project contracting model, the main contractor and subcontractors are collectively referred to as contractors. The transportation of prefabricated components in Qinghai Province is arranged by manufacturers, and there is almost no independent transporter. Therefore, component manufacturers and transporters are collectively called manufacturers. Finally, six types of stakeholders are selected as the core stakeholders of the life cycle of PBPs in Qinghai Province: developer, designer, contractor, manufacturer, government, and facility, as shown in Table 2.
4.1.2. The Life Cycle
PBP’s management focuses on integrated management [61]. Therefore, the analysis of PBP risk needs to be based on the life cycle theory [52,62]. The life cycle of construction projects covers the stages of planning, design, construction, operation, and demolition, and there are interactions between different stages. Compared with the traditional construction method, the new component supply stage of the PBP will affect the realization of the project goal to a greater extent.
At present, the development of PBPs in underdeveloped areas is in the primary stage, and it does not involve the operation and maintenance stage and the demolition and recovery stage. However, it is still necessary to consider the risks of the two stages for ensuring the integrity of the research [63] and provide some forward-looking and instructive suggestions to promote the development of PBPs in underdeveloped regions.
According to the literature review and expert interviews, the life cycle of PBPs is divided into seven stages: feasibility study stage, design stage, component supply stage, construction stage, acceptance stage, operation and maintenance stage, and demolition and recovery stage.
4.2. Risk List
The risk factors involved in 20 highly relevant papers were reviewed and supplemented by experts. Finally, a risk list of PBPs containing 40 factors was determined. This process was widely used in previous studies [19,20,64]. Furthermore, according to experts’ suggestions, six risk factors (R7, R8, R22, R23, R39, and R40) that were not covered much in references were included in the list of risk factors. Risk factors have been classified based on stakeholder perspective and life cycle theory, as shown in Table 3.
5. Construction of Risk Network
5.1. Consistency Analysis
“Consistency analysis” explores the consistency of different experts’ answers to the direct relationship between risk factors [76]. Then, the risk network of PBPs is constructed according to the final consistent answers of experts, and the steps are shown in Figure 3. First, the “Respondent–Answer” binary matrix is constructed using the 11 valid questionnaires recovered in the data sorting part. Then, the consistency matrix is calculated in the software operation part to obtain analysis results using Ucinet 6.0. Finally, in the result-analysis part, the ratio of the first largest to the second largest eigenvalue is 9.196, and the ratio is greater than three, proving that the answer data have a single answer mode. The analysis results can be used to construct an adjacency matrix of the risk factor relationship of PBPs.
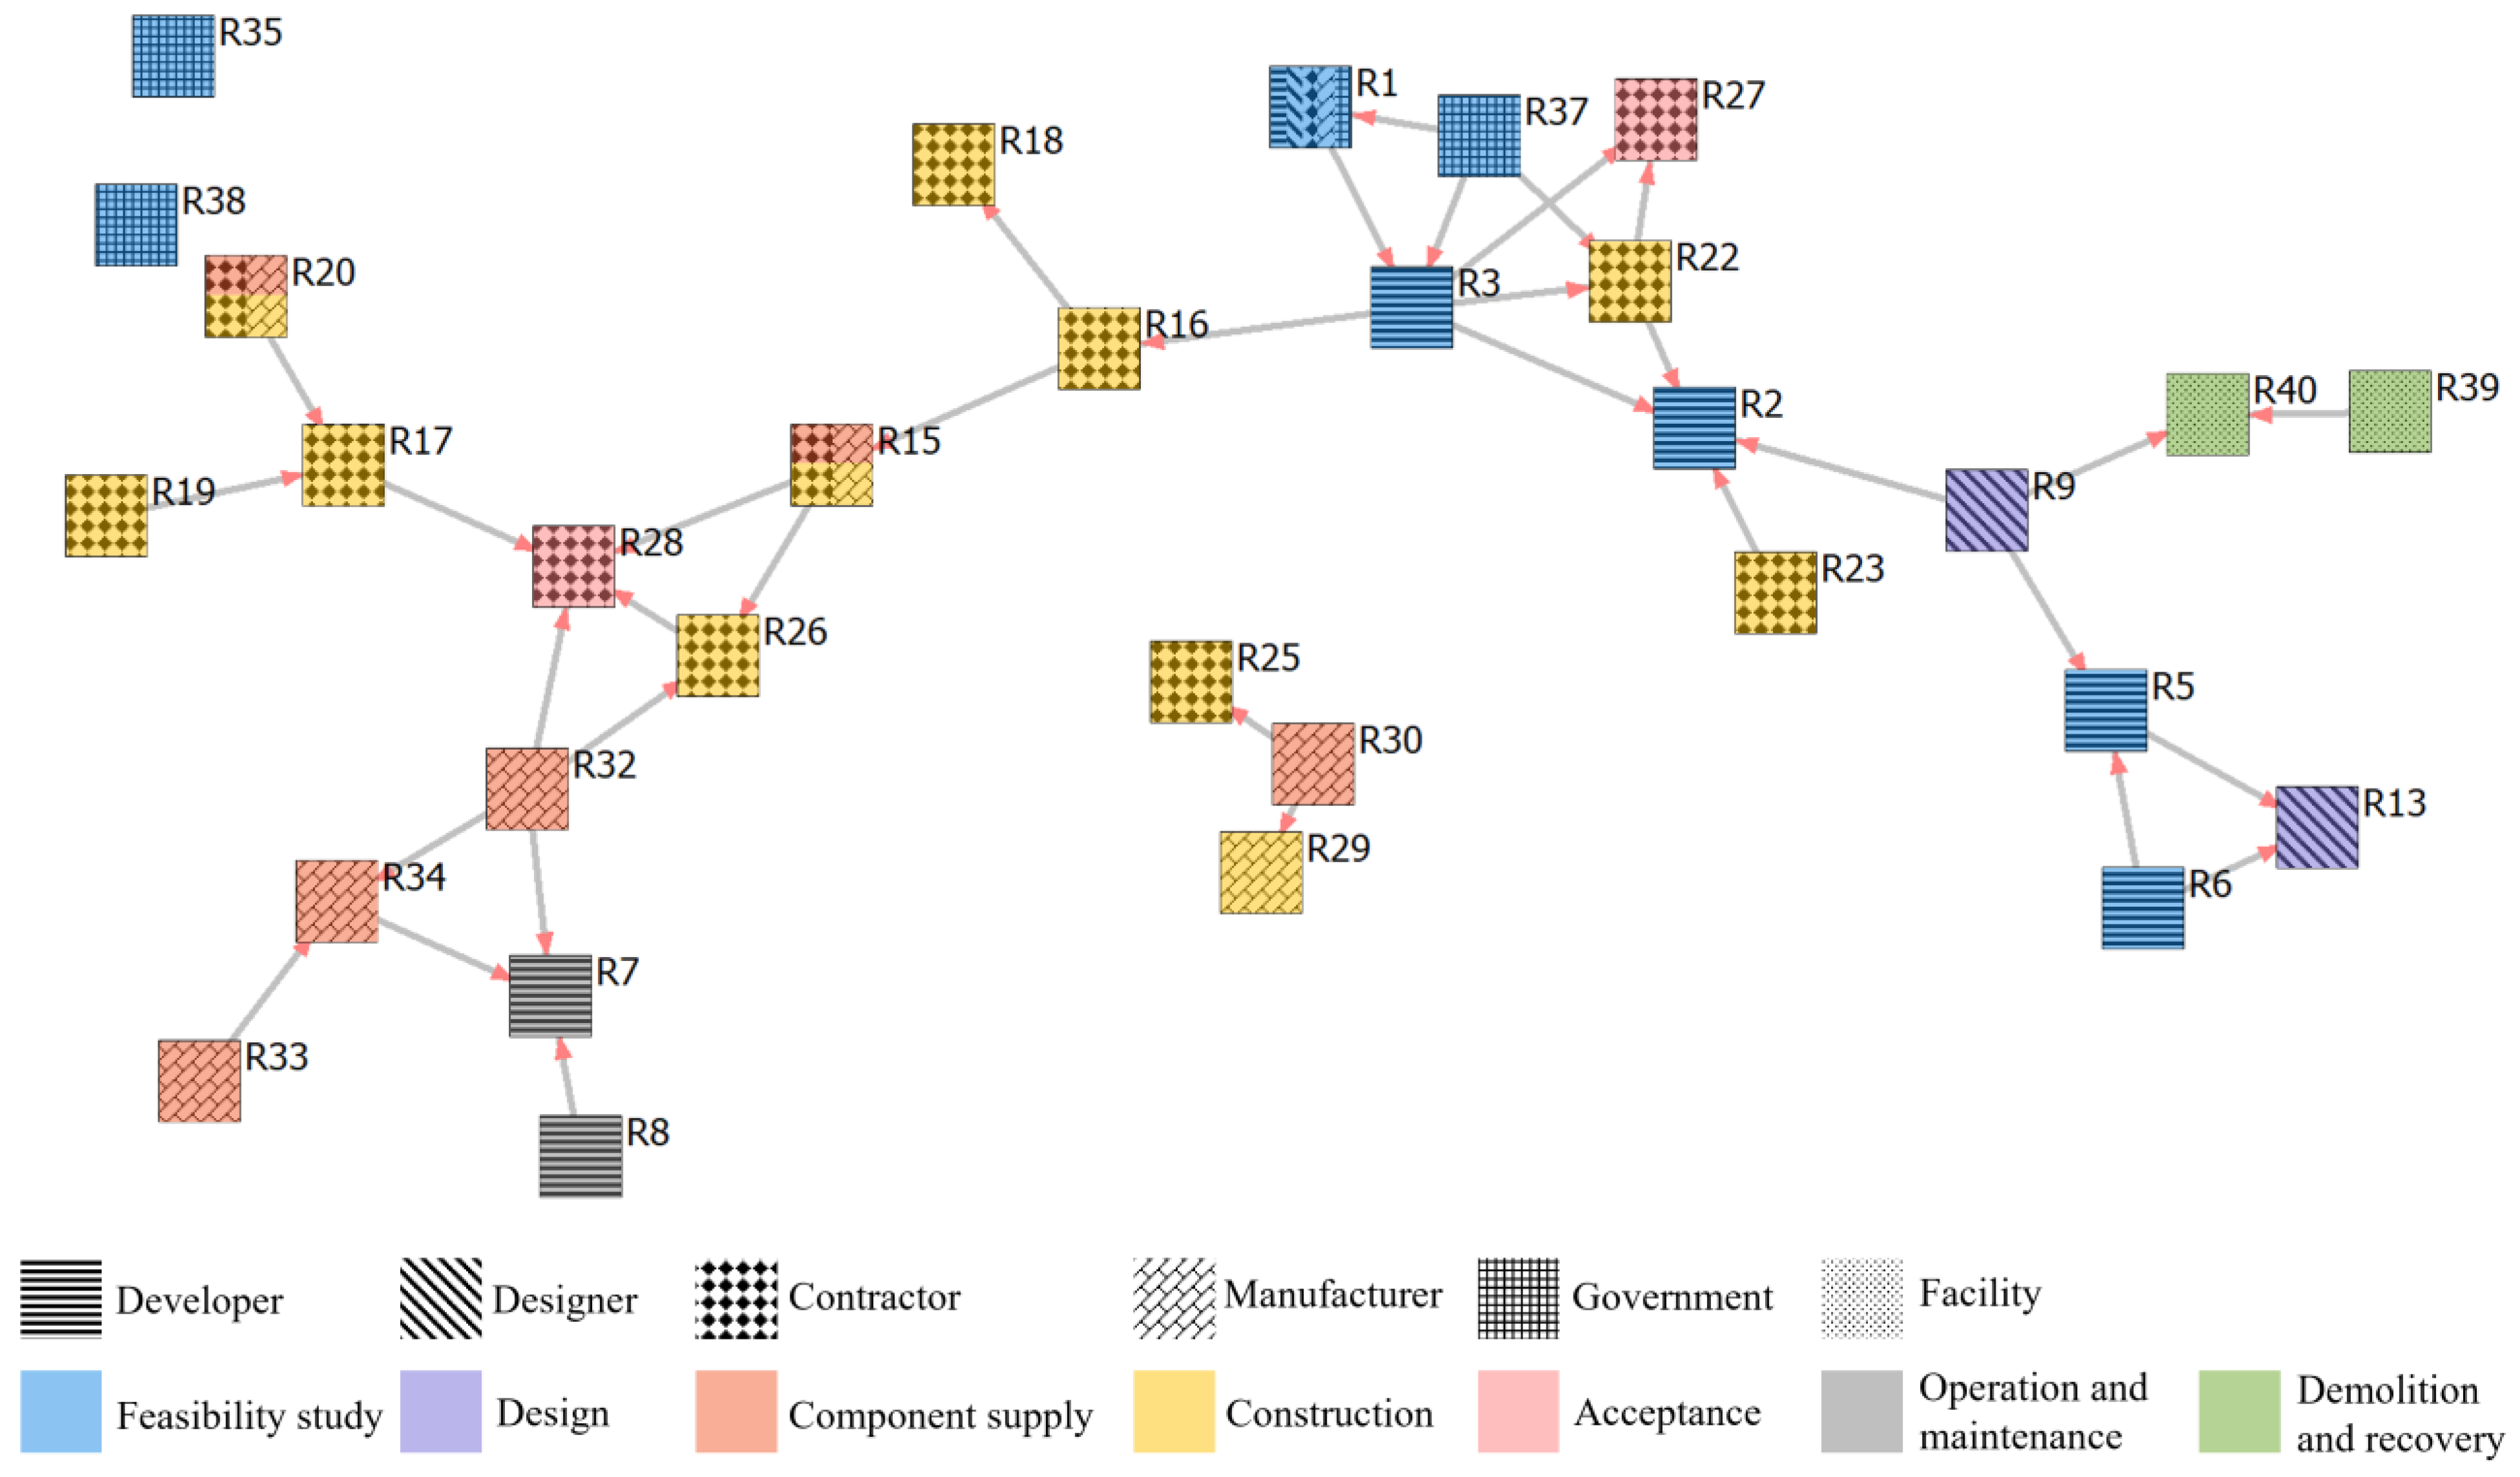
5.2. Risk Network Model
The adjacency matrix of the PBP risk relationship is imported into NetDraw, and a risk network model composed of 40 nodes and 129 directed arrow lines is obtained, as shown in Figure 4. Each risk factor is represented by a node (square). Different patterns in the node represent different stakeholders, and different colors represent different stages of the entire life cycle of the risk node. The arrow tail of the connection between the two nodes is the sender of the risk factor, and the arrow is the receiver of the risk factor.
6. Key Risk Analysis
6.1. Key Risk Factor
6.1.1. Whole Network Analysis
The whole network analysis can comprehensively study the whole network relationship and reveal various structural characteristics [77]. According to the block model theory of White et al. [78], the most basic characteristics of a network can be shown by the relationships between various point sets, and these relationships can be reflected by the image matrix of the block model. In the whole network analysis, the block model theory can be used to make the relationship of the entire risk network clearer. Following the block model construction ideas of Wasserman and Faust [79], the block model is constructed and analyzed for the risk network of PBPs. In Ucinet 6.0, the CONCOR algorithm is used to block the risk network nodes of PBPs. The block matrix is shown in Table 4. Furthermore, the density matrix of the risk network block model is shown in Table 5.
The high network density of the whole network indicates the close links between network members, thus resulting in the strong impact of the network on the attitude and behavior of the actors [80]. The whole network density of the risk network is calculated to be 0.0647. The value greater than 0.0647 in Table 5 is replaced by 1, and the value less than 0.0647 is replaced by 0 to obtain the image matrix of the risk network block model, as shown in Table 6.
Based on the descriptive analysis and classification research of various positions in the network structure from the study of Burt [81], it can be analyzed from Table 6 that: ① Block 2, Block 4, and Block 6 have both transmitting and receiving relationships, and are closely related to each other, indicating that they are in the primary position. ② Block 5 has both transmitting and receiving relationships, and the internal connection is not close, implying it is in the broker position. ③ Block 1, Block 3, Block 7, and Block 8 have only transmit or receive relationships, showing that they are in isolated positions. To sum up, the nodes in the core position of the network should have many external connections and close internal connections. Therefore, Block 2, Block 4, Block 5, and Block 6 are the core positions in the risk network.
6.1.2. Ego-Network Analysis
The ego-network analysis mainly measures the importance of a single risk factor in the risk network, which helps to identify key risk factors. Generally, brokerage roles, node degree centrality, and node betweenness centrality analyses are used for individual network analysis. The top 20% risk factors in the three analysis methods are taken as the key factors, and the union is taken as the list of key risk factors in the ego-network analysis.
- Brokerage Roles Analysis
The brokerage roles analysis focuses on the characteristics of the ego-network. The broker occupies an essential position in the network because they often hold the secrets between multiple groups [82]. Gould and Fernandez [83] classified brokers into five categories: Coordinator, Gatekeeper, Representative, Consultant, and Liaison.
The frequency of the brokers in a node is proportional to the influence of the node and the complexity of the network. Based on the PBP risk network constructed above, the nodes are classified from the perspective of stakeholders and the life cycle (Table 3). Five types of brokerage roles analysis are obtained using Ucinet 6.0. The risk factors for the top eight brokerage roles with the consideration of 20% of the 40 risk factors are shown in Table 7.
The above eight risk factors act as 118 brokerage roles, accounting for 74.68% of all brokerage roles (40 risk factors act as a total of 158 brokerage roles). R10 (design changes frequently) plays all brokerage roles in both dimensions and ranks first in number. Both R3 (difficulties in financing) and R5 (low level of decision making) play the role of four types of brokerage roles in a certain perspective, but the number of R5 is small with little influence. R14 (unreasonable construction scheme), R24 (immature key technologies), R31 (problems in factory management), R9 (low level of information technology), and R6 (lack of professional consultants) all play three types of brokerage roles in at least one perspective. Among them, R6 only plays two types of brokerage roles from the perspective of stakeholders, and the number of R6 is small. Considering the types and number of brokerage roles, R10, R14, R24, R31, R9, and R3 are key risk factors.
- 2.
- Node Degree Centrality Analysis
The node degree centrality is proportional to the importance of risks in the risk network [84]. The influence between risk factors is directional. In the digraph, the degree of each point can be divided into “out-degree” and “in-degree”. The “out-degree” of a risk factor is large, and the “in-degree” is small, showing that the risk has a large influence on other risks, and there are many uncontrollable factors. Such risk factors easily become risk sources and should be avoided from the source. The “in-degree” is large, and the “out-degree” is small, indicating that the risk factor is easily affected by other risk factors, but it is not easy to cause new risks. The degree difference equals the “out-degree” minus the “in-degree”. A large degree difference means that the impact of the risk on other risks is significant, while the impact on itself is relatively small. The top eight risk factors based on node degree centrality are shown in Table 8.
The “in-degree” of R21 (lack of management experience) and R36 (imperfect regulations and standards) are both 0, which are trigger nodes and the source of affecting the transmission of risk relationships, and they need to be controlled and contained from the source of risk. The “out-degree” and “in-degree” of other nodes are all greater than 0, which are path nodes. The node degree difference of R6 (lack of professional consultants) and R9 (low level of information technology) is relatively high, indicating that they have a greater impact on other risk nodes, but they are not easily affected. R6 and R9 belong to risk sources, which need attention. The node degree difference of R32 (poor quality of prefabricated components), R3 (difficulties in financing), and R11 (lack of standardized design system) is small, but the “out-degree” is still greater than the “in-degree”, and they tend to be risk sources. The “in-degree” of R31 (problems in factory management) is the largest among the top eight nodes, indicating that this risk is vulnerable to other risks.
- 3.
- Node Betweenness Centrality Analysis
The node betweenness centrality can reflect the control ability of each risk node in the network to risk transmission and act as an “intermediary” connecting each node. The centrality is proportional to the “mediation effect” and the control power. The top eight risk factors ranked by node betweenness centrality are shown in Table 9.
In Table 9, the node betweenness centrality of the eight risks is large, and the influence on other risk nodes is relatively strong. The eight risks can be listed as key risks. The node betweenness centrality of R24 (immature key technologies) is greater than 100, indicating that R24 belongs to the super influential node, and the risk control of this node should be paid special attention.
Table 9 shows that the key risk factors obtained from the brokerage roles analysis are: R10, R14, R24, R31, R9, and R3; from the node degree centrality analysis are: R21, R6, R9, R36, R32, R31, R3, and R11; from the node betweenness centrality analysis are: R24, R10, R31, R5, R11, R4, R12, and R14. The union of key risk factors from three dimensions is taken as the final key risk list for ego-network analysis, containing 14 risk factors: R3, R4, R5, R6, R9, R10, R11, R12, R14, R21, R24, R31, R32, and R36.
6.2. Key Risk Relationship
The directed arrow between nodes represents the interaction relationship in the risk network, and the key risk interaction relationship is identified by line betweenness centrality analysis. Line betweenness centrality measures the control advantage of the relationship between two nodes in the whole network [51]. The betweenness centrality of a line is proportional to the ability to control risk transmission and the importance of the control. The line betweenness centrality of the risk network can be calculated by Ucinet 6.0. There are 101 lines (relationships) greater than 0, and the top 20 (20% of the 101 lines) are shown in Table 10.
The betweenness centrality of the above 20 relationships is relatively large, indicating that the ability to “control information” is strong. The above 20 relationships have a greater impact on the structure of the entire risk network and should be controlled as key risk relationships. In addition, there are 15 relationships among 14 key risk factors in Table 10, indicating that the key risk factors in the above analysis have a great control advantage in the risk network.
7. Risk Control and Effect Detection
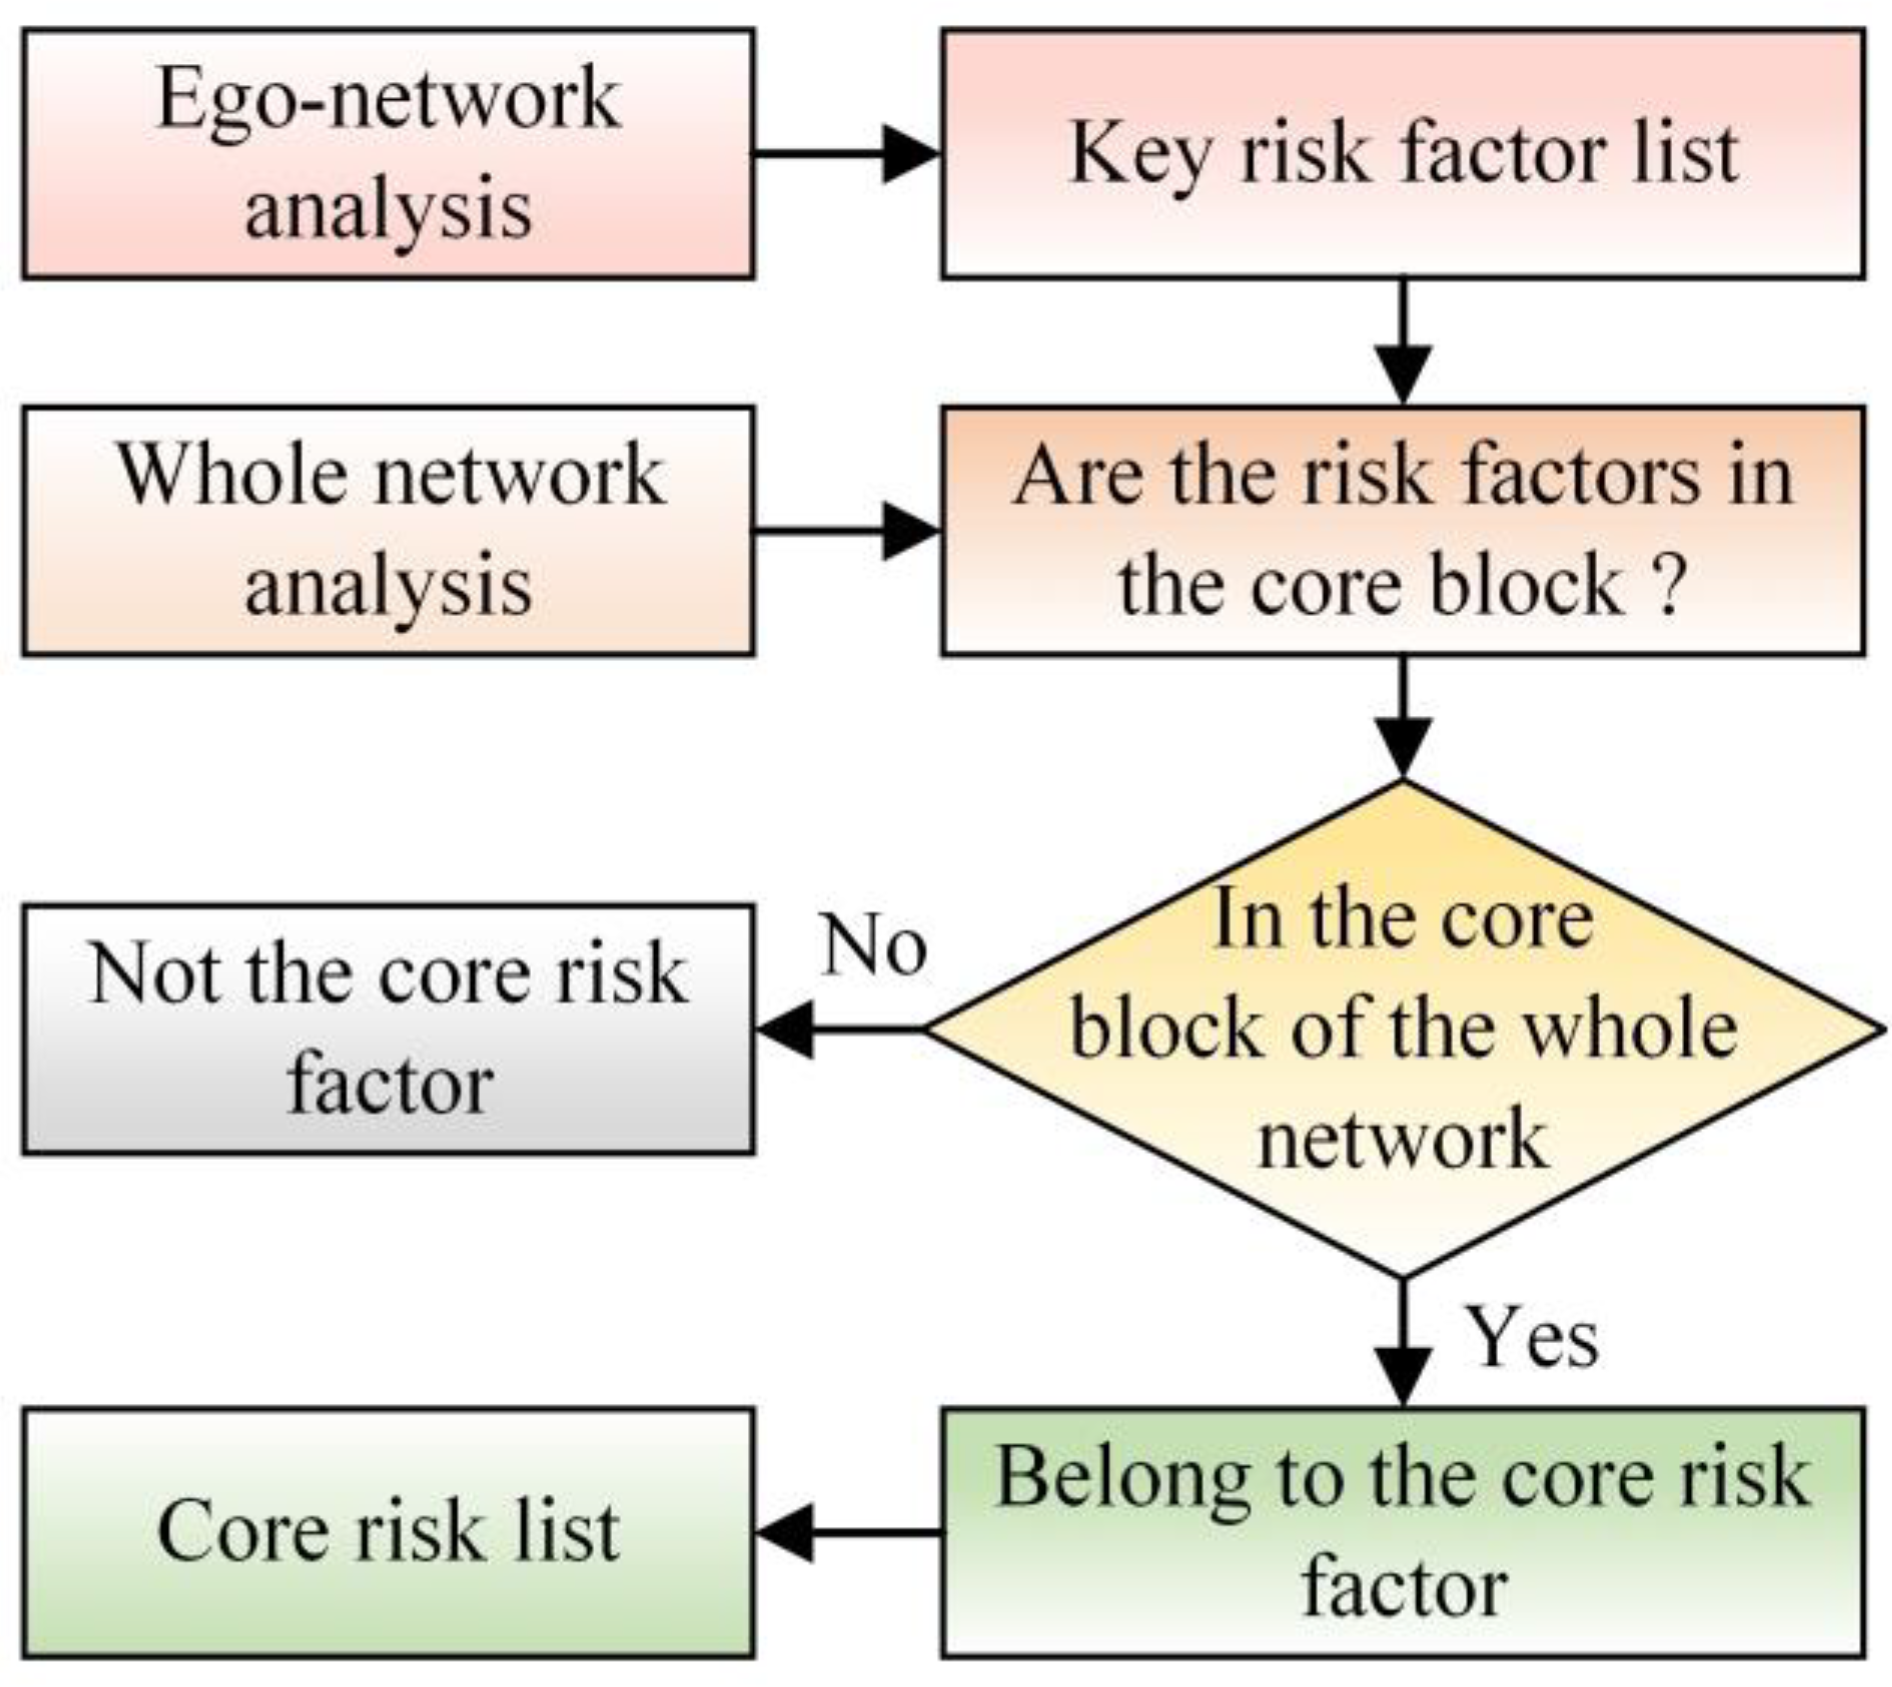
7.1. Core Risk Identification
Identifying core risks relies on the results of ego-network analysis and whether the key risk factors are in the core block of the whole network. The key risk in the core block is the core risk. The identification process of the core risk factors is shown in Figure 5.
The whole network analysis shows that only Block 2, Block 4, Block 5, and Block 6 are at the core position in the risk network. R3 belongs to Block 1; R5, R6, and R9 belong to Block 3; and R32 belongs to Block 7. Therefore, the core risks consist of R4, R10, R11, R12, R14, R21, R24, R31, and R36 (Table 11).
7.1.1. Communication
R4 (low communication efficiency between partners) is a core risk throughout the main stage of PBPs, involving many stakeholders led by developers. During the promotion of PBPs in underdeveloped areas, the communication between partners does not belong to the technical or economic aspects, which can easily lead all stakeholders to ignore the importance and influence of this risk.
7.1.2. Design
The stakeholders involved in R10 (design changes frequently), R11 (lack of standardized design system), and R12 (imperfect design paper) are mainly designers, and they are relatively single from the perspective of the life cycle. R10, R11, and R12 are concentrated in the design stage. Many experts highlight the above design risks in field research.
- R10 is mainly caused by the developer’s insufficient experience and incomprehensive overall control of the PBP, leading to the heavy task of design changes.
- R11 mainly stems from the fact that underdeveloped areas did not adjust the relevant design standards for PBPs to local conditions and lacked a specific and unified design system during construction.
- R12 and R11 are closely related. The lack of a targeted standard design system results in problems for designers, such as insufficient construction drawings and undetailed component drawings. Therefore, many risks in the design stage have seriously hindered the development of PBPs.
7.1.3. Construction
R14 (unreasonable construction scheme), R21 (lack of management experience), and R24 (immature key technologies) are mainly concentrated in the construction stage.
- At present, there are few PBPs and few contractors with rich experience in underdeveloped plateau areas. Therefore, lack of management experience is one of the core risks.
- Compared with the developed areas in the east, the theoretical and technical aspects are still backward. Some key technologies of PBPs are not mature enough. There are generally problems such as large errors in on-site installation components and insufficient node processing.
- When formulating the construction scheme, the contractor follows the experience of traditional construction projects and copies the construction mode of PBPs in other regions but fails to adjust the construction scheme to local conditions, thus leading to an unreasonable construction plan.
7.1.4. Component Supply
R31 (problems in factory management) is mainly caused by the problems of component manufacturers (which contains PC components and steel structures), including unreasonable production line scheduling, long-term storage of components, and a small supply radius of factory components. In fact, there are fewer component factories in less-developed areas. At present, there are only two large component manufacturers in Qinghai Province, which has almost formed a monopoly in the market. Qinghai Baoheng Green Building Industry Co., Ltd., Haidong, China mainly produces PC components, and Qinghai Xikuang Hangxiao Steel Structure Co., Ltd., Xining, China mainly produces steel structure components. From a long-term perspective, this is detrimental to the development of the PBP market. Additionally, these two large-scale manufacturers are currently facing a situation of “no order to do”.
- The current PBP market in underdeveloped areas is oversupplied. Although the production line operation of steel structure components is slightly better than that of PC components, it is still not optimistic.
- The transportation distance of PC components is limited and even cannot be transported to other provinces. However, since the production line of PC components is generally not interrupted, there is a conflict in production line scheduling, leading to the long-term stacking of components.
The PBP market environment in underdeveloped areas is not very friendly to manufacturers, and factory management naturally faces many problems. It is necessary to control such risks to find a balance between market supply and demand.
7.1.5. Policy
R36 (imperfect regulations and standards) is mainly due to the lack of comprehensive policies, regulations, and standards in underdeveloped areas. Although the local government strongly supports the development of PBPs and promulgates many supporting policies, there are still two problems.
- The relevant construction departments are actively promoting PBPs, but the funds are difficult to implement. Compared with other plain areas, the plateau area has higher construction costs, such as artificial construction costs, material transportation costs, and mechanical maintenance costs. Therefore, financial support is particularly important.
- The relevant regulations and standards are not targeted enough, and the operability and supervision ability of policies are poor. When learning from the experience of PBPs in developed areas, it is easy to ignore whether certain aspects apply to local development. For example, it is difficult to achieve a high prefabrication rate in the short term under the current situation.
7.2. Risk Response Strategy
There are usually four risk response strategies: risk avoidance, risk mitigation, risk transfer, and risk acceptance. Given the above nine core risk factors and five key risk relationships, 11 experts have been interviewed again, and specific measures have been put forward accordingly. Then, field research has been conducted on a national prefabricated construction industry demonstration base in Qinghai Province and improved various strategies according to the research situation.
7.2.1. Core Risk Factors
- For R4, the risk mitigation strategy is adopted.
- With the help of building information modeling (BIM) technology, developers can establish a network information management platform for PBPs that includes all stakeholders to strengthen project progress management, expand information sharing channels, and improve communication efficiency among all parties.
- The government should speed up the implementation of the engineering, procurement, and construction (EPC), and strengthen the connection between design, construction, manufacturer, and management personnel. By doing so, the efficiency of information transmission is improved, the common goals of all stakeholders are promoted, and inefficient communication and ineffective management are avoided.
- For R10, the risk mitigation strategy is adopted.
- Designers should fully understand the needs of developers in the early stage of design and keep in touch with all participants at any time to reduce design changes caused by information asymmetry.
- Designers can visualize the design scheme through BIM technology and try to standardize and modularize the design drawings to avoid excessive design changes.
- For R11, the risk avoidance strategy is adopted.
- Designers can use BIM to create a component library for checking collisions and optimizing the design. Then, a standardized design system can be gradually built.
- The government can actively promote the creation of a standardized design system for PBPs, encourage relevant enterprises to formulate design standards, and prepare for the formation of a complete standardized design system for PBPs.
- For R12, the risk avoidance strategy is adopted.
- Designers need to improve their professional ability, master the specifications of PBP design drawings, and use BIM technology appropriately to improve the design level to ensure the accuracy and completeness of drawings.
- Designers can establish a drawing control system, complete the design according to laws, regulations, and industry standards, and focus on reviewing drawings involving project quality and safety. According to the characteristics of PBPs, the drawing control system can ensure the design quality effectively.
- For R14, the risk mitigation strategy is adopted.
- When formulating construction schemes, contractors should strengthen communication with developers to clarify their goals. The scheme should also be dynamically adjusted according to the construction progress to reduce rework during the construction process.
- Contractors should be involved in the design of the project scheme at the design stage, which can improve the constructability of the design scheme.
- For R21, risk mitigation and risk transfer strategies are adopted.
- Contractors should use reasonable construction technology and scientific management methods to implement the construction scheme seriously, report and solve problems found on-site promptly, and do a good job in construction organization and coordination.
- Contractors should pay attention to management innovation, establish a management system in line with PBPs, and strengthen mechanism innovation in quality management and progress management.
- According to the actual situation of the contractor, the developer can reasonably transfer the construction risk through subcontracting and engineering insurance.
- For R24, the risk avoidance strategy is adopted.
- Contractors should strengthen the technical training of construction personnel of PBPs and build a skilled prefabricated construction team.
- The government can organize colleges and universities, scientific research institutes, and relevant large enterprises to pool scientific research resources and promote industry–university–research cooperation. Furthermore, the bottleneck of key technologies in PBPs should be broken in plateau areas, and especially research on prefabricated structural systems should be strengthened to promote the development of key prefabricated technologies in a large-scale and systematic manner.
- For R31, the risk mitigation strategy is adopted.
- Manufacturers should actively adjust component production tasks and innovate the industrial structure according to the market environment to optimize factory management.
- Manufacturers can build a factory information management system combined with emerging technologies to provide a collaborative work platform for all stakeholders, efficiently assisting in information management, production scheduling, and on-site assembly tasks for components.
- For R36, the risk mitigation strategy is adopted.
- The government should establish and improve relevant laws and regulations as soon as possible, gradually standardize the PBP market, and improve the whole-process supervision mechanism to reduce construction risks.
- The government should formulate policies scientifically based on the actual local conditions. PBPs in underdeveloped areas are still in the promotion stage, and financial subsidies need to be implemented. Dynamic adjustments will be made later according to the development situation.
7.2.2. Other Key Relationships
Since the core risk factors can be controlled to a certain extent through the above risk response strategies, the related key relationships are no longer considered. The list of other key risk relationships is shown in Table 12, and the specific response strategies are as follows.
- For R1→R6, risk mitigation and risk transfer strategies are adopted.
- The government can issue relevant policies to strongly support the development of consulting companies whose main business is PBP professional consulting.
- Universities and enterprises should strengthen the training of BIM talents, which can improve the ability of practitioners to use information technology to solve engineering problems and cultivate more talents for the PBP consulting industry in underdeveloped areas.
- For R2→R15, the risk avoidance strategy is adopted.
- Developers should fully consider the particularity of plateau projects and appropriately increase the cost budget of PBPs.
- Contractors should keep the labor cost of PBPs and market conditions abreast in underdeveloped areas and try to maintain long-term cooperation with experienced and reliable construction teams.
- For R35→R1, the risk mitigation strategy is adopted
- The government should guide relevant enterprises to establish a unified, fair, and open construction market, break down regional barriers, remove unreasonable local market access restrictions, and minimize market downturns caused by excessive market demand fluctuations.
- The government should actively evaluate the support policy of PBPs, consider the factors such as construction cost and market promotion comprehensively, and continue or increase the policy support of credit financing appropriately. The government should also actively promote the prefabrication of public buildings to increase the production orders of components, offset the impact of high costs, and expand market applications.
- For R6→R9, the risk avoidance strategy is adopted.
- The government can support enterprises in carrying out professional training by pretax exemption or by setting up special funds. Furthermore, support funds can be weighted towards the development of higher education, encouraging colleges and universities to open related majors or courses, which can cultivate more professional talents.
- The government needs to actively guide relevant enterprises to create an integrated cooperation platform based on BIM, which will help designers achieve “forward design”. In addition, the platform is conducive to information sharing and resource integration in the industrial chain, thus improving the information technology level of the PBP industry.
- For R40→R8, the risk mitigation strategy is adopted.
- Developers and facilities can introduce BIM technology into the operation and maintenance stage of PBPs to achieve information sharing throughout the life cycle. BIM technology can monitor the usage and safety performance of PBPs in real-time and provide data support for the recycling and utilization of PBP resources in the future.
- Facilities need to strengthen training in the maintenance of PBPs for ensuring reasonable and safe construction of PBPs.
7.3. Risk Effect Detection
Core risk factors play an essential role in different dimensions of the risk network. Removing these core nodes and lines can effectively reduce the overall complexity of the network. To test the effectiveness of the above risk response strategies, the methods proposed by Yu et al. [52] and Yang et al. [85] are adopted to eliminate all core risks and relationships and construct a new risk network (Figure 6). Then, the network integrity, network cohesion, and network reachability are measured to analyze their impact on the network.
If all proposed risk response strategies are implemented effectively, core risks and key relationships in the risk network can be eliminated. The calculation results show that the number of risk factors is reduced from 40 to 31, and the number of risk relationships is reduced from 129 to 35. Compared with Figure 4, the risk network in Figure 6 becomes sparse, and the risk relationship is significantly reduced, indicating that the tightness between nodes in the network is significantly reduced. The specific indicators are analyzed as follows.
- Network integrity. The whole network density can reflect the completeness of the network [80]. High network density is proportional to the connections between nodes and network integrity. After controlling the risk, the whole network density decreases from 0.0647 to 0.0376, reduced by 41.89%. The network density is significantly reduced, and the integrity of the risk network structure is weakened.
- Network cohesion. The average distance and cohesion index of each node in the network are large, showing that the whole network is cohesive and the network structure is strong [79]. The average distance of each point decreases from 2.92 to 1.65, decreasing by 43.49%, and the cohesion index decreases from 0.151 to 0.049, decreasing by 67.55%. The results indicate that the network structure is no longer solid, and the risk control measures block the influence between risks.
- Network reachability. Analyzing network reachability can explore the ways of risk transmission and determine the impact of risk transmission. The value is proportional to the number of ways that the risk spreads and the reachability, thus affecting the degree of the impact. The statistical number of reachable matrices before and after the risk control is shown in Table 13. Before the risk control, the reachable number between risks in the reachability matrix is 486, accounting for 31.53% of the maximum reachable number (40 × 39 = 1560). After the risk control, the reachable number between risks in the reachability matrix is 60, accounting for 6.45% of the maximum reachable number (31 × 30 = 930), which is much lower than before. The results indicate that the risk control is effective. It can block the reachability between a large number of risks.
In addition, R35 and R38 become isolated nodes, and the subgroup consisting of R25, R29, and R30 are also independent of the main risk network. Therefore, these nodes can be treated separately. In summary, after removing the core risk nodes and key relationships, the complexity of the entire risk network is significantly reduced, indicating that the above risk response strategies are very effective.
8. Discussions
This study follows the classic risk management framework and builds a risk network model for PBPs, which provides response strategies for stakeholders to control the risks of PBPs in the life cycle. Few studies combine the two dimensions of stakeholders and the life cycle for risk analysis of PBPs. However, risks exist at every stage and are closely related to every stakeholder. Compared with other studies, the interaction between risks has been considered in this paper to identify and analyze risks effectively. However, this study has been conducted in an underdeveloped plateau region, and the value for promotion and application in other areas needs to be improved.
Through an in-depth investigation into the underdeveloped plateau area of Qinghai Province, the developers of PBPs, as the core stakeholders, did not show a strong “existence” and did not play a leading role in this study. The results are different from some previous studies. In previous studies, developers and contractors are the core stakeholders of the risk management of PBPs [20,24,25]. Among the core risk factors identified in this study, the risks involved by designers and contractors, respectively, account for more than 33%. Except for the construction stage, the design stage occupies most of the risks, which is closely related to the particularity of underdeveloped plateau areas. Consistent with the research conclusions of Jiang et al. [43] and Wuni et al. [32], the design stage should receive the attention of the stakeholders of the PBP to reduce problems in the component production and construction stages. When dealing with risks, the government and other core stakeholders are not at the same level in promoting the development of PBPs. Many risk issues need to be solved by the government’s policy of regulation or incentives in China’s underdeveloped areas [29,31,86], which is different from other studies conducted in developed regions [67]. Therefore, it is significant to explore specific and effective PBP policies in further research. In addition, the lack of the facility is also a problem worth considering. Underdeveloped areas lack professional operation and maintenance teams or enterprises, developers, and contractors, making the public generally have “worries” about the maintenance of PBPs.
9. Conclusions
The SNA is adopted to develop a risk network of PBPs, and nine core risk factors and five key risk relationships are identified. Finally, the effectiveness of relevant risk response strategies through risk effect detection is shown. The main conclusions are as follows:
- Developers of PBPs in underdeveloped areas fail to play a leading role. Among the nine core risks, developers are only involved in one risk, showing that developers have not yet fully understood the PBPs, resulting in insufficient awareness of developers in the entire construction process.
- There are prominent problems in the design stage of PBPs. Stakeholders should focus on the design stage of PBPs. While other regions are already advancing the technical breakthroughs in the construction stage, the PBPs in underdeveloped areas are still in the early stage of development, where many design problems still need to be solved. Additionally, these regions lack a unified design system, and there is a phenomenon of “each speaks its own words”.
- In less-developed regions, the development of PBPs must rely on the strong promotion of the government. The market mechanism of PBPs in underdeveloped areas is not perfect, the supply and demand risks are relatively large, and policy regulation greatly affects the spread of the risk network. Therefore, in underdeveloped areas, local governments need to actively introduce corresponding supporting policies to strengthen market cultivation and industrial chain integration and mobilize the enthusiasm of stakeholders.
This is the first study to consider the risk within the life cycle of PBPs in underdeveloped plateau areas, providing theoretical support for the development of PBPs in similar regions. The risk interdependence has been considered, the limitations of traditional risk analysis have been overcome, and the research system of risk management of PBPs has been expanded in this paper. In practice, this study provides valuable risk response strategies for the stakeholders and a reference for the government to formulate targeted incentive policies, thus helping to improve the risk management level of PBPs in underdeveloped areas. The government of underdeveloped areas should actively introduce various policies to improve developers’ willingness and the dominant consciousness of PBPs. Furthermore, the design specifications should be standardized and unified to effectively reduce the bottleneck problem in the design stage of PBPs.
Limitations and further research on this topic area should mainly focus on the following two aspects:
- Although the risk network model of this study can reflect the relationship between risks, it ignores the intensity of the impact. There are solid or weak relationships between risk factors, and the quantitative evaluation of the risk relationship will be realized in future research.
- The risk strategy proposed in this study is subjective, and some empirical analysis may be required for the actual effect of risk control. In the future, case studies will be conducted on more suitable PBPs to improve risk management strategies.
Author Contributions
Conceptualization, Z.G. and C.L.; methodology, Q.W.; software, Q.W.; investigation, Z.G. and Q.W.; writing—original draft preparation, Q.W.; writing—review and editing, Z.G.; supervision, C.L.; funding acquisition, Z.G. All authors have read and agreed to the published version of the manuscript.
Funding
This research was funded by the Science and Technology Department of Qinghai Province (grant number 2018-ZJ-734) and the Qinghai Provincial Key Laboratory of Plateau Green Building and Eco-community (grant number KLKF-2021-005).
Institutional Review Board Statement
Not applicable.
Informed Consent Statement
Not applicable.
Data Availability Statement
The datasets used and analyzed during the current study are available from the corresponding author on reasonable request.
Conflicts of Interest
The authors declare no conflict of interest.
References
- Gan, X.L.; Chang, R.D.; Zuo, J.; Wen, T.; Zillante, G. Barriers to the transition towards off-site construction in China: An Interpretive structural modeling approach. J. Clean. Prod. 2018, 197, 8–18. [Google Scholar] [CrossRef]
- Han, Y.; Wang, L. Identifying barriers to off-site construction using grey DEMATEL approach: Case of China. J. Civ. Eng. Manag. 2018, 24, 364–377. [Google Scholar] [CrossRef]
- Ma, L.; Le, Y.; Li, H.; Jin, R.; Piroozfar, P.; Liu, M. Regional Comparisons of Contemporary Construction Industry Sustainable Concepts in the Chinese Context. Sustainability 2018, 10, 3831. [Google Scholar] [CrossRef] [Green Version]
- Khalili, A.; Chua, D.K. Integrated prefabrication configuration and component grouping for resource optimization of precast production. J. Constr. Eng. Manag. 2014, 140, 04013052. [Google Scholar] [CrossRef]
- Zhang, X.L.; Skitmore, M.; Peng, Y. Exploring the challenges to industrialized residential building in China. Habitat Int. 2014, 41, 176–184. [Google Scholar] [CrossRef] [Green Version]
- MOHURD. Circular of the Ministry of Housing and Urban-Rural Development on the Issuance of the 13th Five-Year Plan for Prefabricated Buildings. 2017. Available online: http://www.mohurd.gov.cn/gongkai/fdzdgknr/tzgg/201703/20170329_231283.html (accessed on 5 March 2022).
- MOHURD. Circular of the Department of Standard Quota of the Ministry of Housing and Urban-Rural Development on Development of Prefabricated Buildings in China in 2020. Available online: http://www.mohurd.gov.cn/gongkai/fdzdgknr/tzgg/202103/20210312_249438.html (accessed on 5 March 2022).
- Zhao, Y.Y.; Yu, F.W. The Evaluation of Coordinated Development of Economic and Eco-Environment in Qinghai Province. Ecol. Econ. 2015, 31, 63–66. [Google Scholar] [CrossRef]
- Han, L.H.; Gong, Z.Q. Impact Factors of Off-Site Construction Development in Xining. J. Eng. Manag. 2020, 34, 31–36. [Google Scholar] [CrossRef]
- Wang, F.C. Qinghai: Writing the Answer Sheet of The Times, Drawing the New Look of Urban and Rural Areas. 2020. Available online: http://www.chinajsb.cn/html/202012/21/16351.html (accessed on 11 March 2022).
- Gao, H.C.; Cao, H.H. Industrial Development and Policy Evaluation of Northwest China in 70 Years of New China—Based on the Perspective of Low-carbon Economy. J. Lanzhou Univ. Soc. Sci. 2019, 47, 11–23. [Google Scholar] [CrossRef]
- Su, W.L.; LI, W.L.; Zu, Y.L.; Cai, D.; Yu, C.; Xu, J.; Wei, W. Evaluation of sustainable development in Qinghai based on energy ecological footprint model. Pratacult. Sci. 2019, 36, 1445–1456. [Google Scholar] [CrossRef]
- Xie, W.J.; Wang, S.X. Research on the Coupling Coordination between Economic Development and Ecological Environment. Plateau Sci. Res. 2020, 4, 36–45. [Google Scholar] [CrossRef]
- Li, X.J.; Wang, C.; Alashwal, A.; Bora, S. Game analysis on prefabricated building evolution based on dynamic revenue risks in China. J. Clean. Prod. 2020, 267, 121730. [Google Scholar] [CrossRef]
- Lv, Z.Q. Research on Economic Evaluation and Application of Prefabricated Buildings Based on BIM. Master’s Thesis, Qinghai University, Xining, China, 2021. [Google Scholar]
- Zhou, L.; Ma, J.P. Modeling and Analysis of Bayesian Network in Engineering Project Schedule Risk Management. J. Eng. Manag. 2012, 26, 69–74. [Google Scholar] [CrossRef]
- Qin, X.; Li, A.L.; Zhang, R.; Xie, X. Research on the relationship between the influencing factors of construction industrialization based on ISM: Survey from Xiamen. J. Chongqing Univ. Soc. Sci. Ed. 2017, 23, 30–40. [Google Scholar] [CrossRef]
- Luo, L.Z.; Mao, C.; Shen, L.Y.; Li, Z.D. Risk factors affecting practitioners’ attitudes toward the implementation of an industrialized building system. Eng. Constr. Archit. Manag. 2015, 22, 622–643. [Google Scholar] [CrossRef]
- Yuan, M.Q.; Li, Z.F.; Li, X.D.; Luo, X.W. Managing stakeholder-associated risks and their interactions in the life cycle of prefabricated building projects: A social network analysis approach. J. Clean. Prod. 2021, 323, 129102. [Google Scholar] [CrossRef]
- Luo, L.Z.; Shen, G.Q.; Xu, G.Y.; Liu, Y.L.; Wang, Y.J. Stakeholder-Associated Supply Chain Risks and Their Interactions in a Prefabricated Building Project in Hong Kong. J. Manag. Eng. 2019, 35, 05018015. [Google Scholar] [CrossRef]
- Stroebele, B.S.; Kiessling, A.J. Impact Analysis of Complexity Drivers in the Supply Chain of Prefabricated Houses. J. Manag. Strategy 2017, 8, 1–9. [Google Scholar] [CrossRef] [Green Version]
- Li, H.X.; Al-Hussein, M.; Lei, Z.; Ajweh, Z. Risk identification and assessment of modular construction utilizing fuzzy analytic hierarchy process (AHP) and simulation. Can. J. Civ. Eng. 2013, 40, 1184–1195. [Google Scholar] [CrossRef]
- Li, X.J. Research on Investment Risk Influence Factors of Prefabricated Building Projects. J. Civ. Eng. Manag. 2020, 26, 599–613. [Google Scholar] [CrossRef]
- Lee, J.S.; Kim, Y.S. Analysis of cost-increasing risk factors in modular construction in Korea using FMEA. KSCE J. Civ. Eng. 2016, 21, 1999–2010. [Google Scholar] [CrossRef]
- Bian, Y. Research on the Stakeholders’ Risk Control Capability of Prefabricated Buildings. Master’s Thesis, Shenzhen University, Shenzhen, China, 2019. [Google Scholar]
- Xia, M.; Zhao, L.; Zhao, L. A Comprehensive Risk-Assessment Method for Prefabricated Buildings Using EPC: A Case Study from China. Sustainability 2022, 14, 1910. [Google Scholar] [CrossRef]
- Rose, L. Risk management project for work with precast concrete shells. Work 2012, 41, 4157–4162. [Google Scholar] [CrossRef] [PubMed] [Green Version]
- Xie, L.; Chen, Y.; Xia, B.; Hua, C. Importance-Performance Analysis of Prefabricated Building Sustainability: A Case Study of Guangzhou. Adv. Civ. Eng. 2020, 2020, 8839118. [Google Scholar] [CrossRef]
- Mao, C.; Shen, Q.; Pan, W.; Ye, K. Major barriers to off-site construction: The developer’s perspective in China. J. Manag. Eng. 2015, 31, 04014043. [Google Scholar] [CrossRef]
- Li, M.; Li, G.B.; Huang, Y.Q.; Deng, L.Y. Research on Investment Risk Management of Chinese Prefabricated Construction Projects Based on a System Dynamics Model. Buildings 2017, 7, 83. [Google Scholar] [CrossRef] [Green Version]
- Wu, G.B.; Yang, R.S.; Li, L.; Bi, X.; Liu, B.S.; Li, S.Y.; Zhou, S.X. Factors influencing the application of prefabricated construction in China: From perspectives of technology promotion and cleaner production. J. Clean. Prod. 2019, 219, 753–762. [Google Scholar] [CrossRef]
- Wuni, I.Y.; Shen, G.Q.P. Critical success factors for management of the early stages of prefabricated prefinished volumetric construction project life cycle. Eng. Constr. Archit. Manag. 2020, 27, 2315–2333. [Google Scholar] [CrossRef]
- Hwang, B.G.; Shan, M.; Looi, K.Y. Key constraints and mitigation strategies for prefabricated prefinished volumetric construction. J. Clean. Prod. 2018, 183, 183–193. [Google Scholar] [CrossRef]
- Luo, T.; Xue, X.; Wang, Y.; Xue, W.; Tan, Y. A systematic overview of prefabricated construction policies in China. J. Clean. Prod. 2021, 280, 124371. [Google Scholar] [CrossRef]
- Ye, M.; Wang, J.; Si, X.; Zhao, S.; Huang, Q. Analysis on Dynamic Evolution of the Cost Risk of Prefabricated Building Based on DBN. Sustainability 2022, 14, 1864. [Google Scholar] [CrossRef]
- Wang, Z.L.; Shen, H.C.; Zuo, J. Risks in Prefabricated Buildings in China: Importance-Performance Analysis Approach. Sustainability 2019, 11, 3450. [Google Scholar] [CrossRef] [Green Version]
- Lu, W.; Chen, K.; Xue, F.; Pan, W. Searching for an optimal level of prefabrication in construction: An analytical framework. J. Clean. Prod. 2018, 201, 236–245. [Google Scholar] [CrossRef]
- Hong, J.; Shen, G.Q.; Li, Z.; Zhang, B.; Zhang, W. Barriers to promoting prefabricated construction in China: A cost–benefit analysis. J. Clean. Prod. 2018, 172, 649–660. [Google Scholar] [CrossRef]
- Liang, H.; Zhang, S.; Su, Y. Evaluating the Efficiency of Industrialization Process in Prefabricated Residential Buildings Using a Fuzzy Multicriteria Decision-Making Method. Math. Probl. Eng. 2017, 2017, 6078490. [Google Scholar] [CrossRef] [Green Version]
- Dou, Y.; Xue, X.; Wang, Y.; Luo, X.; Shang, S. New media data-driven measurement for the development level of prefabricated construction in China. J. Clean. Prod. 2019, 241, 118353. [Google Scholar] [CrossRef]
- Jiang, W.; Luo, L.; Wu, Z.; Fei, J.; Antwi-Afari, M.F.; Yu, T. An investigation of the effectiveness of prefabrication incentive policies in China. Sustainability 2019, 11, 5149. [Google Scholar] [CrossRef] [Green Version]
- Park, M.; Ingawale-Verma, Y.; Kim, W.; Ham, Y. Construction policymaking: With an example of Singaporean government’s policy to diffuse prefabrication to private sector. KSCE J. Civ. Eng. 2011, 15, 771–779. [Google Scholar] [CrossRef]
- Jiang, L.; Li, Z.; Li, L.; Gao, Y. Constraints on the promotion of prefabricated construction in China. Sustainability 2018, 10, 2516. [Google Scholar] [CrossRef] [Green Version]
- PMI. The Project Management Body of Knowledge (PMBOK Guide); Project Management Institute: Newtown Township, PA, USA, 2013. [Google Scholar]
- Zeng, J.; An, M.; Smith, N.J. Application of a fuzzy based decision making methodology to construction project risk assessment. Int. J. Proj. Manag. 2007, 25, 589–600. [Google Scholar] [CrossRef]
- Deep, S.; Bhoola, V.; Verma, S.; Ranasinghe, U. Identifying the risk factors in real estate construction projects: An analytical study to propose a control structure for decision-making. J. Financ. Manag. Prop. Constr. 2021. [Google Scholar] [CrossRef]
- Rahimi, Y.; Tavakkoli-Moghaddam, R.; Iranmanesh, S.H.; Vaez-Alaei, M. Hybrid Approach to Construction Project Risk Management with Simultaneous FMEA/ISO 31000/Evolutionary Algorithms: Empirical Optimization Study. J. Constr. Eng. Manag. 2018, 144, 04018043. [Google Scholar] [CrossRef]
- Zou, P.X.W.; Zhang, G. Managing risks in construction projects: Life cycle and stakeholder perspectives. Int. J. Constr. Manag. 2009, 9, 61–77. [Google Scholar] [CrossRef]
- Kaliszewski, J. The Project of Building a Concrete Prefabrication Plant Using the Innovative Production Technologies. Ph.D. Thesis, Warsaw University of Technology, Warsaw, Poland, 2019. [Google Scholar]
- Sun, G.Q.; Zhang, B.J.; Xu, L.F. A Review of Theoretical Research Frontier of Power in Networks and Prospects. Foreign Econ. Manag. 2014, 36, 47–55. [Google Scholar] [CrossRef]
- Liu, J. Lectures on Whole Network Approach: A Practical Guide to UCINET; Truth & Wisdom Press: Shanghai, China, 2009. [Google Scholar]
- Yu, T.; Shen, G.Q.; Shi, Q.; Lai, X.; Li, C.Z.; Xu, K. Managing social risks at the housing demolition stage of urban redevelopment projects: A stakeholder-oriented study using social network analysis. Int. J. Proj. Manag. 2017, 35, 925–941. [Google Scholar] [CrossRef]
- Freeman, R.E. Strategic Management: A Stakeholder Approach; Cambridge University Press: New York, NY, USA, 2010. [Google Scholar]
- Goswein, V.; Rodrigues, C.; Silvestre, J.D.; Freire, F.; Habert, G.; Konig, J. Using anticipatory life cycle assessment to enable future sustainable construction. J. Ind. Ecol. 2020, 24, 15. [Google Scholar] [CrossRef]
- Gan, X.L.; Chang, R.D.; Langston, C.; Wen, T. Exploring the interactions among factors impeding the diffusion of prefabricated building technologies. Eng. Constr. Archit. Manag. 2019, 26, 535–553. [Google Scholar] [CrossRef]
- Liu, W.F.; Wang, J.T. Multi-Agent Behavior Risk Analysis of Fabricated Building Projects Based on SNA. J. Tianjin Chengjian Univ. 2020, 26, 112–117. [Google Scholar] [CrossRef]
- Luo, L.Z.; Jin, X.; Shen, G.Q.; Wang, Y.J.; Liang, X.; Li, X.; Li, C.Z. Supply Chain Management for Prefabricated Building Projects in Hong Kong. J. Manag. Eng. 2020, 36, 05020001. [Google Scholar] [CrossRef]
- Luo, L.Z.; Liang, X.; Fang, C.; Wu, Z.Z.; Wang, X.; Wang, Y.J. How to promote prefabricated building projects through internet of things? A game theory-based analysis. J. Clean. Prod. 2020, 276, 124325. [Google Scholar] [CrossRef]
- Teng, Y.; Mao, C.; Liu, G.W.; Wang, X.Y. Analysis of stakeholder relationships in the industry chain of industrialized building in China. J. Clean. Prod. 2017, 152, 387–398. [Google Scholar] [CrossRef]
- Wang, R.J.; Wang, C.J. Identification and Countermeasure for Key Risk Factors in Fabricated Building Projects on SNA. J. Shandong Agric. Univ. Nat. Sci. Ed. 2019, 50, 247–250. [Google Scholar] [CrossRef]
- Kamali, M.; Hewage, K. Life cycle performance of modular buildings: A critical review. Renew. Sustain. Energy Rev. 2016, 62, 1171–1183. [Google Scholar] [CrossRef]
- Koc, K.; Gurgun, A.P. Stakeholder-Associated Life Cycle Risks in Construction Supply Chain. J. Manag. Eng. 2021, 37, 04020107. [Google Scholar] [CrossRef]
- Mok, K.Y.; Shen, G.Q.; Yang, R.J.; Li, C.Z. Investigating key challenges in major public engineering projects by a network-theory based analysis of stakeholder concerns: A case study. Int. J. Proj. Manag. 2017, 35, 78–94. [Google Scholar] [CrossRef]
- Hu, X.; Chong, H.Y.; Wang, X.; London, K. Understanding Stakeholders in Off-Site Manufacturing: A Literature Review. J. Constr. Eng. Manag. 2019, 145, 03119003. [Google Scholar] [CrossRef]
- Rostamzadeh, R.; Ghorabaee, M.K.; Govindan, K.; Esmaeili, A.; Nobar, H.B.K. Evaluation of sustainable supply chain risk management using an integrated fuzzy TOPSIS-CRITIC approach. J. Clean. Prod. 2018, 175, 651–669. [Google Scholar] [CrossRef]
- Mangla, S.K.; Kumar, P.; Barua, M.K. Prioritizing the responses to manage risks in green supply chain: An Indian plastic manufacturer perspective. Sustain. Prod. Consum. 2015, 1, 67–86. [Google Scholar] [CrossRef]
- Yang, R.J.; Zou, P.X.W. Stakeholder-associated risks and their interactions in complex green building projects: A social network model. Build. Environ. 2014, 73, 208–222. [Google Scholar] [CrossRef]
- Govindan, K.; Kaliyan, M.; Kannan, D.; Haq, A.N. Barriers analysis for green supply chain management implementation in Indian industries using analytic hierarchy process. Int. J. Prod. Econ. 2014, 147, 555–568. [Google Scholar] [CrossRef]
- Mojtahedi, S.M.H.; Mousavi, S.M.; Makui, A. Project risk identification and assessment simultaneously using multi-attribute group decision making technique. Saf. Sci. 2010, 48, 499–507. [Google Scholar] [CrossRef]
- Taylan, O.; Bafail, A.O.; Abdulaal, R.M.S.; Kabli, M.R. Construction projects selection and risk assessment by fuzzy AHP and fuzzy TOPSIS methodologies. Appl. Soft Comput. 2014, 17, 105–116. [Google Scholar] [CrossRef]
- Li, C.Z.; Hong, J.K.; Fan, C.; Xu, X.X.; Shen, G.Q. Schedule delay analysis of prefabricated housing production: A hybrid dynamic approach. J. Clean. Prod. 2018, 195, 1533–1545. [Google Scholar] [CrossRef]
- Wu, P.; Low, S.P. Barriers to achieving green precast concrete stock management—A survey of current stock management practices in Singapore. Int. J. Constr. Manag. 2014, 14, 78–89. [Google Scholar] [CrossRef]
- Wu, Z.; Luo, L.; Li, H.; Wang, Y.; Bi, G.; Antwi-Afari, M.F. An Analysis on Promoting Prefabrication Implementation in Construction Industry towards Sustainability. Int. J. Environ. Res. Public Health 2021, 18, 11493. [Google Scholar] [CrossRef] [PubMed]
- Qin, X.; Li, H.Q.; Mo, Y.Y. Study on establishment and evaluation of risk network in green building projects based on SNA. China Civ. Eng. J. 2017, 50, 119–131. [Google Scholar] [CrossRef]
- Liu, T.L. Research of Prefabricated Construction Enterprise Supply Chain Risk Management. Master’s Thesis, Chongqing University, Chongqing, China, 2016. [Google Scholar]
- Borgatti, S.P.; Everett, M.G. Network analysis of 2-mode data. Soc. Netw. 1997, 19, 243–269. [Google Scholar] [CrossRef]
- Freeman, L.C. The Development of Social Network Analysis; Empirical Press: Vancouver, BC, Canada, 2004. [Google Scholar]
- White, H.C.; Boorman, S.A.; Breiger, R.L. Social Structure from Multiple Networks. I. Block models of Roles and Positions. Am. J. Sociol. 1976, 81, 730–780. [Google Scholar] [CrossRef]
- Wasserman, S.; Faust, K. Social Network Analysis: Methods and Applications; Cambridge University Press: New York, NY, USA, 1994. [Google Scholar]
- Liu, J. An Introduction to Social Network Analysis; Social Sciences Academic Press: Beijing, China, 2004. [Google Scholar]
- Burt, R.S. Positions in Networks. Soc. Forces 1976, 55, 93–122. [Google Scholar] [CrossRef]
- Ghinoi, S.; Silvestri, F.; Steiner, B. The role of local stakeholders in disseminating knowledge for supporting the circular economy: A network analysis approach. Ecol. Econ. 2020, 169, 106446. [Google Scholar] [CrossRef]
- Gould, R.V.; Fernandez, R.M. Structures of Mediation: A Formal Approach to Brokerage in Transaction Networks. Sociol. Methodol. 1989, 19, 89. [Google Scholar] [CrossRef]
- Freeman, L.C. Centrality in Social Networks: Conceptual Clarification. Soc. Netw. 1978, 1, 215–239. [Google Scholar] [CrossRef] [Green Version]
- Yang, R.J.; Zou, P.X.W.; Wang, J. Modelling stakeholder-associated risk networks in green building projects. Int. J. Proj. Manag. 2016, 34, 66–81. [Google Scholar] [CrossRef]
- Gao, Y.; Tian, X.L. Prefabrication policies and the performance of construction industry in China. J. Clean. Prod. 2020, 253, 120042. [Google Scholar] [CrossRef]
Figure 1.
Research framework.

Figure 2.
Literature statistical analysis for stakeholders.

Figure 3.
Consistency analysis process.

Figure 4.
Risk network model.

Figure 5.
The identification process of the core risk factors.

Figure 6.
Risk network model after taking risk response strategies.

Table 2.
Core stakeholders of PBPs in Qinghai province.
| ID | Stakeholder | Position |
|---|---|---|
| 1 | Developer | Responsible for project development, decision making, and integrated management |
| 2 | Designer | Responsible for the design task of the whole process of the project |
| 3 | Contractor | Responsible for site construction and coordinated management |
| 4 | Manufacturer | Responsible for the production and transportation of components |
| 5 | Government | Formulate relevant policies and approve and supervise projects |
| 6 | Facility | Daily management and regular maintenance of PBPs |
Table 3.
Risk list of PBPs.
| Risk ID | Risk | Classification | References | |
|---|---|---|---|---|
| Stakeholder | Life Cycle | |||
| R1 | Market demand fluctuation | Developer/Designer/ Contractor/Manufacturer | Feasibility study | F1, F2, F3, F4, F16, F17, F18 |
| R2 | Underestimate cost | Developer | F1, F2, F5, F18 | |
| R3 | Difficulties in financing | F1, F4, F6, F8, F14, F16, F17 | ||
| R4 | Low communication efficiency between partners | Developer/Designer/ Contractor/Manufacturer | Feasibility study/Design/ Construction/Component supply | F3, F4, F6, F7, F8, F9, F10, F11, F12, F14, F15 |
| R5 | Low level of decision-making | Developer | Feasibility study | F5, F6, F9, F10, F11, F15, F18, F20 |
| R6 | Lack of professional consultants | F5, F6, F17, F18 | ||
| R7 | Low material reuse | Demolition and recovery | F6, F15 | |
| R8 | Difficult to recycle resources | F6, F15 | ||
| R9 | Low level of information technology | Designer | Design | F5, F10, F15, F17 |
| R10 | Design changes frequently | F2, F3, F4, F7, F8, F12, F20 | ||
| R11 | Lack of standardized design system | F1, F3, F4, F5, F10, F11, F12, F14, F16, F17, F19 | ||
| R12 | Imperfect design paper | F2, F3, F4, F5, F7, F8, F10, F14, F17, F19 | ||
| R13 | Inadequate design review | F3, F4, F7, F8, F12, F17 | ||
| R14 | Unreasonable construction scheme | Contractor | Construction | F2, F3, F5, F7, F9, F10, F14, F16, F19, F20 |
| R15 | Lack of skilled labor | F1, F2, F4, F6, F7, F14, F17, F18, F20 | ||
| R16 | Frequent personnel flow | F5, F13, F19, F20 | ||
| R17 | Safety accidents | F5, F7, F15, F20 | ||
| R18 | Labor disputes | F3, F5, F7, F8 | ||
| R19 | Mechanical failure | F3, F4, F7, F12, F17, F18 | ||
| R20 | Irresistible force | F3, F5, F7, F8, F17, F20 | ||
| R21 | Lack of management experience | F2, F3, F4, F6, F8, F10, F14, F16, F18, F19 | ||
| R22 | Turnover of own funds | F4, F5 | ||
| R23 | Project scope changes | F2, F8 | ||
| R24 | Immature key technologies | F1, F6, F10, F14, F15, F18 | ||
| R25 | Unreasonable storage of components | F12, F13, F14, F17 | ||
| R26 | Installation error of prefabricated components | F2, F7, F12, F14, F17 | ||
| R27 | Delayed payment | Acceptance | F3, F4, F7, F9 | |
| R28 | Construction quality accident | F2, F3, F18, F20 | ||
| R29 | Delayed delivery of components to the site | Manufacturer | Component supply | F2, F3, F4, F7, F8, F12, F13, F17 |
| R30 | Unclear prefabricated components | F7, F12, F13 | ||
| R31 | Problems in factory management | F2, F3, F7, F17 | ||
| R32 | Poor quality of prefabricated components | F2, F4, F7, F8, F14, F15, F17, F18, F20 | ||
| R33 | Does not meet shipping standards | F4, F11, F15, F17, F20 | ||
| R34 | Transportation damage of components | F2, F7, F14, F15, F17, F20 | ||
| R35 | Policy changes | Government | Feasibility study | F3, F4, F7, F15, F16, F17, F18 |
| R36 | Imperfect regulations and standards | F1, F2, F3, F4, F14, F15, F16, F17, F18, F20 | ||
| R37 | Lack of financial support policies | F1, F2, F4, F6, F14, F16, F17, F18, F20 | ||
| R38 | Complex or inefficient approval procedures | F6, F7, F9, F13, F18 | ||
| R39 | Lack of experienced facility companies | Facility | Operation and maintenance | F19, F20 |
| R40 | Lack of reasonable and scientific maintenance | F2, F13, F19 | ||
Table 4.
Block matrix of risk network.
| Block | Risk Factor |
|---|---|
| 1 | R1, R37, R3 |
| 2 | R16, R2, R22, R27 |
| 3 | R9, R5, R23, R6, R35, R36 |
| 4 | R24, R13, R12, R10, R11 |
| 5 | R4, R18, R19, R40, R39, R31 |
| 6 | R28, R15, R17, R20, R14, R26, R21 |
| 7 | R8, R33, R32, R7, R34, R38 |
| 8 | R25, R29, R30 |
Table 5.
Density matrix of risk network block model.
| Block | 1 | 2 | 3 | 4 | 5 | 6 | 7 | 8 |
|---|---|---|---|---|---|---|---|---|
| 1 | 0.500 | 0.417 | 0.056 | 0.067 | 0.000 | 0.000 | 0.000 | 0.000 |
| 2 | 0.000 | 0.167 | 0.000 | 0.000 | 0.042 | 0.071 | 0.000 | 0.000 |
| 3 | 0.056 | 0.083 | 0.133 | 0.500 | 0.139 | 0.048 | 0.000 | 0.000 |
| 4 | 0.000 | 0.050 | 0.000 | 0.500 | 0.033 | 0.114 | 0.033 | 0.067 |
| 5 | 0.000 | 0.000 | 0.056 | 0.000 | 0.033 | 0.024 | 0.083 | 0.167 |
| 6 | 0.000 | 0.000 | 0.024 | 0.000 | 0.119 | 0.286 | 0.000 | 0.048 |
| 7 | 0.000 | 0.000 | 0.000 | 0.033 | 0.000 | 0.048 | 0.167 | 0.000 |
| 8 | 0.000 | 0.000 | 0.000 | 0.000 | 0.000 | 0.000 | 0.000 | 0.333 |
Table 6.
Image matrix of risk network block model.
| Block 1 | Block 2 | Block 3 | Block 4 | Block 5 | Block 6 | Block 7 | Block 8 | Transmit | Relations with Oneself | |
|---|---|---|---|---|---|---|---|---|---|---|
| Block 1 | 1 | 1 | 0 | 1 | 0 | 0 | 0 | 0 | 2 | 1 |
| Block 2 | 0 | 1 | 0 | 0 | 0 | 1 | 0 | 0 | 1 | 1 |
| Block 3 | 0 | 1 | 1 | 1 | 1 | 0 | 0 | 0 | 3 | 1 |
| Block 4 | 0 | 0 | 0 | 1 | 0 | 1 | 0 | 1 | 2 | 1 |
| Block 5 | 0 | 0 | 0 | 0 | 0 | 0 | 1 | 1 | 2 | 0 |
| Block 6 | 0 | 0 | 0 | 0 | 1 | 1 | 0 | 0 | 1 | 1 |
| Block 7 | 0 | 0 | 0 | 0 | 0 | 0 | 1 | 0 | 0 | 1 |
| Block 8 | 0 | 0 | 0 | 0 | 0 | 0 | 0 | 1 | 0 | 1 |
| Receive | 0 | 2 | 0 | 2 | 2 | 2 | 1 | 2 | ||
| Relations with oneself | 1 | 1 | 1 | 1 | 0 | 1 | 1 | 1 |
Table 7.
The risk factors for the top eight brokerage roles.
| Rank | Risk ID | Based on the Stakeholder Perspective | Based on the Life Cycle Perspective | Total | ||||||||
|---|---|---|---|---|---|---|---|---|---|---|---|---|
| Coordinator | Gatekeeper | Representative | Consultant | Liaison | Coordinator | Gatekeeper | Representative | Consultant | Liaison | |||
| 1 | R10 | 2 | 8 | 4 | 3 | 14 | 2 | 8 | 4 | 7 | 10 | 31 |
| 2 | R14 | 6 | 12 | 0 | 0 | 0 | 6 | 9 | 0 | 0 | 3 | 18 |
| 3 | R24 | 0 | 12 | 0 | 2 | 4 | 0 | 8 | 0 | 2 | 8 | 18 |
| 4 | R31 | 0 | 12 | 0 | 1 | 4 | 0 | 9 | 0 | 2 | 6 | 17 |
| 5 | R9 | 0 | 2 | 0 | 1 | 7 | 0 | 2 | 0 | 1 | 7 | 10 |
| 6 | R3 | 1 | 1 | 4 | 0 | 3 | 2 | 0 | 7 | 0 | 0 | 9 |
| 7 | R6 | 2 | 0 | 6 | 0 | 0 | 2 | 0 | 6 | 0 | 0 | 8 |
| 8 | R5 | 0 | 0 | 4 | 1 | 2 | 0 | 0 | 4 | 1 | 2 | 7 |
Table 8.
The top eight risk factors based on node degree centrality.
| Risk ID | Out-Degree | In-Degree | Normalized Out-Degree | Normalized In-Degree | Degree Difference |
|---|---|---|---|---|---|
| R21 | 9 | 0 | 23.077 | 0 | 9 |
| R6 | 8 | 1 | 20.513 | 2.564 | 7 |
| R9 | 8 | 2 | 20.513 | 5.128 | 6 |
| R36 | 6 | 0 | 15.385 | 0 | 6 |
| R32 | 5 | 1 | 12.821 | 2.564 | 4 |
| R31 | 6 | 3 | 15.385 | 7.692 | 3 |
| R3 | 5 | 2 | 12.821 | 5.128 | 3 |
| R11 | 5 | 2 | 12.821 | 5.128 | 3 |
Table 9.
The top eight risk factors ranked by node betweenness centrality.
| Rank | 1 | 2 | 3 | 4 | 5 | 6 | 7 | 8 |
|---|---|---|---|---|---|---|---|---|
| Risk ID | R24 | R10 | R31 | R5 | R11 | R4 | R12 | R14 |
| Node Betweenness Centrality | 113.333 | 97.167 | 96.833 | 91.667 | 78.000 | 67.000 | 63.167 | 52.333 |
Table 10.
The top 20 relationships according to line betweenness centrality analysis.
| Rank | Relationships | Betweenness Centrality Analysis |
|---|---|---|
| 1 | R5→R31 | 89.333 |
| 2 | R4→R5 | 89.000 |
| 3 | R24→R11 | 87.000 |
| 4 | R12→R24 | 85.167 |
| 5 | R11→R4 | 76.000 |
| 6 | R1→R6 | 52.667 |
| 7 | R31→R9 | 45.333 |
| 8 | R10→R12 | 44.667 |
| 9 | R9→R40 | 34.333 |
| 10 | R2→R15 | 31.000 |
| 11 | R31→R32 | 28.667 |
| 12 | R10→R14 | 28.500 |
| 13 | R35→R1 | 27.500 |
| 14 | R3→R10 | 25.500 |
| 15 | R13→R12 | 24.667 |
| 16 | R6→R9 | 24.000 |
| 17 | R32→R24 | 23.333 |
| 18 | R40→R8 | 22.333 |
| 19 | R10→R2 | 22.000 |
| 20 | R14→R17 | 22.000 |
Table 11.
Core risk factors of PBPs in Qinghai Province.
| Risk ID | Risk | Classification | |
|---|---|---|---|
| Stakeholder | Life Cycle | ||
| R4 | Low communication efficiency between partners | Developer/Designer/ Contractor/Manufacturer | Feasibility study/Design/ Construction/Component supply |
| R10 | Design changes frequently | Designer | Design |
| R11 | Lack of standardized design system | ||
| R12 | Imperfect design paper | ||
| R14 | Unreasonable construction scheme | Contractor | Construction |
| R21 | Lack of management experience | ||
| R24 | Immature key technologies | ||
| R31 | Problems in factory management | Manufacturer | Component supply |
| R36 | Imperfect regulations and standards | Government | Feasibility study |
Table 12.
List of other key risk relationships.
| Rank | Relationships | Betweenness Centrality Analysis | |
|---|---|---|---|
| 6 | R1→R6 | Market demand fluctuation → Lack of professional consultants | 52.667 |
| 10 | R2→R15 | Underestimate cost → Lack of skilled labor | 31 |
| 13 | R35→R1 | Policy changes → Market demand fluctuation | 27.5 |
| 16 | R6→R9 | Lack of professional consultants → Low level of information technology | 24 |
| 18 | R40→R8 | Lack of reasonable and scientific maintenance → Difficult to recycle resources | 22.333 |
Table 13.
The statistical number of reachable matrices before and after the risk control.
| Risk ID | Before the Risk Control | After the Risk Control | Risk ID | Before the Risk Control | After the Risk Control | Risk ID | Before the Risk Control | After the Risk Control |
|---|---|---|---|---|---|---|---|---|
| R1 | 29 | 9 | R15 | 5 | 2 | R29 | 0 | 0 |
| R2 | 6 | 0 | R16 | 7 | 4 | R30 | 2 | 2 |
| R3 | 27 | 8 | R17 | 1 | 1 | R31 | 22 | 0 |
| R4 | 22 | 0 | R18 | 0 | 0 | R32 | 22 | 4 |
| R5 | 22 | 1 | R19 | 2 | 2 | R33 | 2 | 2 |
| R6 | 23 | 2 | R20 | 2 | 2 | R34 | 1 | 1 |
| R7 | 0 | 0 | R21 | 26 | 0 | R35 | 30 | 0 |
| R8 | 1 | 1 | R22 | 8 | 2 | R36 | 31 | 0 |
| R9 | 22 | 4 | R23 | 23 | 1 | R37 | 30 | 10 |
| R10 | 22 | 0 | R24 | 22 | 0 | R38 | 0 | 0 |
| R11 | 22 | 0 | R25 | 0 | 0 | R39 | 3 | 1 |
| R12 | 22 | 0 | R26 | 1 | 1 | R40 | 2 | 0 |
| R13 | 22 | 0 | R27 | 0 | 0 | Total | 486 | 60 |
| R14 | 4 | 0 | R28 | 0 | 0 |
Publisher’s Note: MDPI stays neutral with regard to jurisdictional claims in published maps and institutional affiliations. |
© 2022 by the authors. Licensee MDPI, Basel, Switzerland. This article is an open access article distributed under the terms and conditions of the Creative Commons Attribution (CC BY) license (https://creativecommons.org/licenses/by/4.0/).
Share and Cite
MDPI and ACS Style
Wang, Q.; Gong, Z.; Liu, C. Risk Network Evaluation of Prefabricated Building Projects in Underdeveloped Areas: A Case Study in Qinghai. Sustainability 2022, 14, 6335. https://0-doi-org.brum.beds.ac.uk/10.3390/su14106335
AMA Style
Wang Q, Gong Z, Liu C. Risk Network Evaluation of Prefabricated Building Projects in Underdeveloped Areas: A Case Study in Qinghai. Sustainability. 2022; 14(10):6335. https://0-doi-org.brum.beds.ac.uk/10.3390/su14106335
Chicago/Turabian StyleWang, Qiuyu, Zhiqi Gong, and Chengkui Liu. 2022. "Risk Network Evaluation of Prefabricated Building Projects in Underdeveloped Areas: A Case Study in Qinghai" Sustainability 14, no. 10: 6335. https://0-doi-org.brum.beds.ac.uk/10.3390/su14106335
Note that from the first issue of 2016, this journal uses article numbers instead of page numbers. See further details here.