
Modified Hydrological Drought Risk Assessment Based on Spatial and Temporal Approaches


1
Department of Civil Engineering, Faculty of Engineering & Built Environment, Universiti Kebangsaan Malaysia, UKM, Bangi 43600, Selangor, Malaysia
2
Office of Klang River Basin, Department of Irrigation & Drainage Kuala Lumpur, Kolam Takungan Batu, Batu 4 ½ Off Jalan Ipoh, Kuala Lumpur 51200, Malaysia
*
Author to whom correspondence should be addressed.
Sustainability 2022, 14(10), 6337; https://0-doi-org.brum.beds.ac.uk/10.3390/su14106337
Submission received: 28 March 2022
/
Revised: 23 April 2022
/
Accepted: 12 May 2022
/
Published: 23 May 2022
Abstract
:This study was conducted using a modified drought risk assessment in which hydrological data were processed to assess the hazards and risk of hydrological drought in Peninsular Malaysia. Although drought vulnerability and risk assessment are critical components of the drought phenomenon, the lack of a comprehensive integrated drought risk assessment in Malaysia has led to increased socio-economic impacts. The Hydrological Drought Risk Index (HDRI) illustrates the relative importance of hazard and vulnerability assessments in drought risk management for Peninsular Malaysia using the Streamflow Drought Index (SDI). This study presents an integrated drought characteristics-based risk assessment framework to improve hydrological drought risk assessment. The hydrological drought risk assessment was conducted by combining physical hazard and socioeconomic variables across the region. The periods of 1998–1999 and 2017–2018 mark the most critical hydrological droughts. The results also show that the trend of hydrological drought in river basins is towards dry conditions with no change in the foreseeable future. This study proposes a theoretical framework for effective drought risk management that can be used by the government and its stakeholders for sustainable water resource management.
1. Introduction
Climate change has recently led to severe impacts around the world, including exceptional floods, drought, excessive temperatures, and other disasters. El Niño reportedly occurred in 1997–1998 and caused significant destruction [1]. Dry seasons in Malaysia were more severe due to an El Niño event that resulted in lower rainfall and higher temperatures [2,3,4]. Due to its proximity to the ocean, temperatures in Malaysia fluctuate between 26 and 28 °C throughout the year [5]. There are two different types of monsoon seasons in Malaysia: the southwest, which occurs from May to September; and the northeast, which usually brings a rainy season from November to March [6,7,8]. Water scarcity caused by droughts has led to a significant decline in crop yields in Malaysia [2]. Due to the severity of recent droughts in Malaysia, effective hydrological drought analysis and management is critical, especially for water resources.
Drought is a multidimensional disaster and can be classified into four groups: hydrological, meteorological, agricultural and socio-economic [9,10]. Hydrological drought assessment is the most important of these classes for water resource management. A drought index is the simplest tool for monitoring drought conditions [11]. Drought indices help decision makers by identifying characteristics of drought, such as severity, duration, and occurrence. Hydrological indices are mainly based on runoff, streamflow, discharge, and groundwater variables [12,13,14]. Because the selection of a suitable drought index is a key element, fundamental to the assessment of drought risk, the process of selecting a hydrological drought index requires further thought [15,16]. Examples include the Standardised Runoff Index (SRI), the Standardised Streamflow Index (SSFI), the Streamflow Drought Index (SDI) and the Base Flow Index (BFI) [17,18,19,20]. In recent years, some researchers have studied hydrological drought using the Streamflow Drought Index (SDI) approach [21,22,23,24].
In general, indices are calculated at specific locations or utilizing areal averages of hydrological data [25]. Remote sensing-based indices that provide a description of the spatial aspects of droughts and their evolution over time can be used to improve drought characterization at the regional scale [26,27,28,29]. Basically, indices measure drought conditions by utilizing threshold values to differentiate between distinct drought categories; whether these thresholds are set empirically or probabilistically, they attempt to depict the projected damages associated with each level of severity. The drought severity thresholds are used to decide when drought responses should be triggered and when they should be terminated [30,31].
Droughts are a significant threat to regional and global food security, with losses having the potential to cause political upheaval, trade disputes, and conflict [32]. Identifying ways for reducing drought risk is one of the main problems of the twenty-first century [33,34]. Hydrological drought indices are critical for describing the type and severity of drought hazards, and substantial research has been conducted to find the best drought indices for drought monitoring and risk assessment [35,36]. However, little effort has been made to date to determine which indicator best captures drought consequences in Malaysia’s various sectors. Impacts give vital ground truth information for indices used in monitoring operations; hence this is a critical knowledge gap.
The establishment of interaction between drought indices and drought impacts can be used for drought risk assessment and vulnerability assessment [37]. Drought impacts range from minor to severe, affecting many elements of society and the environment, but they are rarely properly documented. Understanding the link between drought indices, drought impacts, and drought vulnerability is essential for better drought risk management [38,39]. However, while many studies have been conducted to create, implement, and evaluate drought indices, only a few have examined the relationship between indices and actual impacts.
Nashwan et al. (2018) noted that the literature tends to be dominated by studies focused on the geographical distribution of susceptibility to hydrological hazards using climate data [40]. They generally link indices like the Precipitation Concentration Index (PCI) and Aridity index (AI) to the spatial distribution of rainfall (SDR). They found that the relationships between indices and impacts varied significantly by region and spatial distribution of indicators using the fuzzy catastrophe method. This study did not include adequate information on Malaysia’s hydrological drought, nor did it address drought indicators that may be used to determine the duration, intensity, and frequency of droughts in Peninsular Malaysia.
What they reported is merely basic information, with no mention of the causes, impacts, or severity of hydrological drought in Peninsular Malaysia. Thus, the current study attempts to bridge this gap by highlighting the hydrological drought conditions as a first step in raising understanding of risks left behind by this serious phenomenon on the environment, economy, and society.
This study presents an integrated drought characteristics-based risk assessment framework to improve hydrological drought risk assessment. The basic starting theory for this hydrological drought risk and vulnerability assessment is that drought risk is a consequence of both the occurrence and severity of drought events and the associated vulnerability [41,42]. The frequency of drought events and the frequency of their occurrence is referred to as drought frequency. The geographic and temporal extent of drought and the degree of exceptional dryness are referred to as severity. In contrast, drought vulnerability is considered to be the result of numerous human-induced situations and is influenced by land use patterns, population demographics and legislation [43].
The main objective of this study is to assess the temporal and spatial distribution of hydrological drought risk assessment at different time scales for Peninsular Malaysia, with the following objectives: (i) to identify the characteristics of hydrological drought using SDI and the theory of runs; (ii) to determine the long-term hydrological drought trends; and (iii) to provide a framework for drought risk assessment and identification of the most vulnerable regions in Peninsular Malaysia.
Through two significant contributions, this study addresses the constraints of hydrological drought risk assessment in Peninsular Malaysia. To begin, it closes a gap in the assessment of hydrological drought risk in Peninsular Malaysia by combining physical hazard and socioeconomic variables across the region. It does so by quantifying a composite of hazard, vulnerability, and risk in order to compare the amount of drought risk among provinces and regions in Peninsular Malaysia. Second, it enhances the accuracy of hydrological drought risk assessment in Peninsular Malaysia by using geographical distribution to complement and improve the hydrological drought risk assessment methodology. The objective of this work is to provide guidance for drought prevention and emergency management through drought risk assessment and quantification of the overall drought risk assessment. The results of the study can be used for analysis of the regional water supply and the development of drought management plans.
2. Materials and Methods
Drought risk assessment is difficult due to the fact that drought is a complicated and poorly understood phenomenon with no common definition or onset criteria. Drought is influenced by a variety of elements, including meteorology and hydrology, as well as agricultural planting arrangements and drought resistance capacities. Drought hazard, vulnerability, exposure, and drought resistibility are commonly used methods to estimate it. As a result, studying the frequency, severity, and spatial extent of drought, as well as the region’s infrastructural and socioeconomic capabilities to foresee and cope with drought, is critical to understanding the danger of drought. To determine the drought risk assessment, the following framework (Figure 1) is used.
The availability of risk estimations is particularly beneficial when using advanced risk management techniques. In a data-scarce setting, an iterative risk management or adaptive management method that employs monitoring, research, evaluation, learning, and innovation to improve risk management strategies over time appears to be especially applicable [44,45].
The assessment of drought risk is fundamental to risk management. Drought risk assessment refers to the process of characterising and measuring the potential losses produced by a drought occurrence of a particular intensity in a specific area [46]. Using the above as a foundation, this study examined the spatial-temporal distribution of drought episodes in Peninsular Malaysia.
As a result, a comprehensive assessment and modelling framework is required to evaluate and quantify the various implications of hydrological drought. The objectives, methodology, and results of this drought investigation are summarised in Figure 1. In brief, the following analyses were conducted in order to gain a better understanding of both catchment droughts and droughts caused by humans.
For the first time, a comprehensive hydrological drought risk analysis as a proof of concept for Peninsular Malaysia is presented in this work, which incorporates the hazard and socio-economic circumstances of the regions, as well as the application of spatial-based SDI for drought hazard assessment. The findings show that, in addition to physical hazard, socioeconomic factors play an important role in determining hydrological drought risk for Peninsular Malaysia.
2.1. Study Area
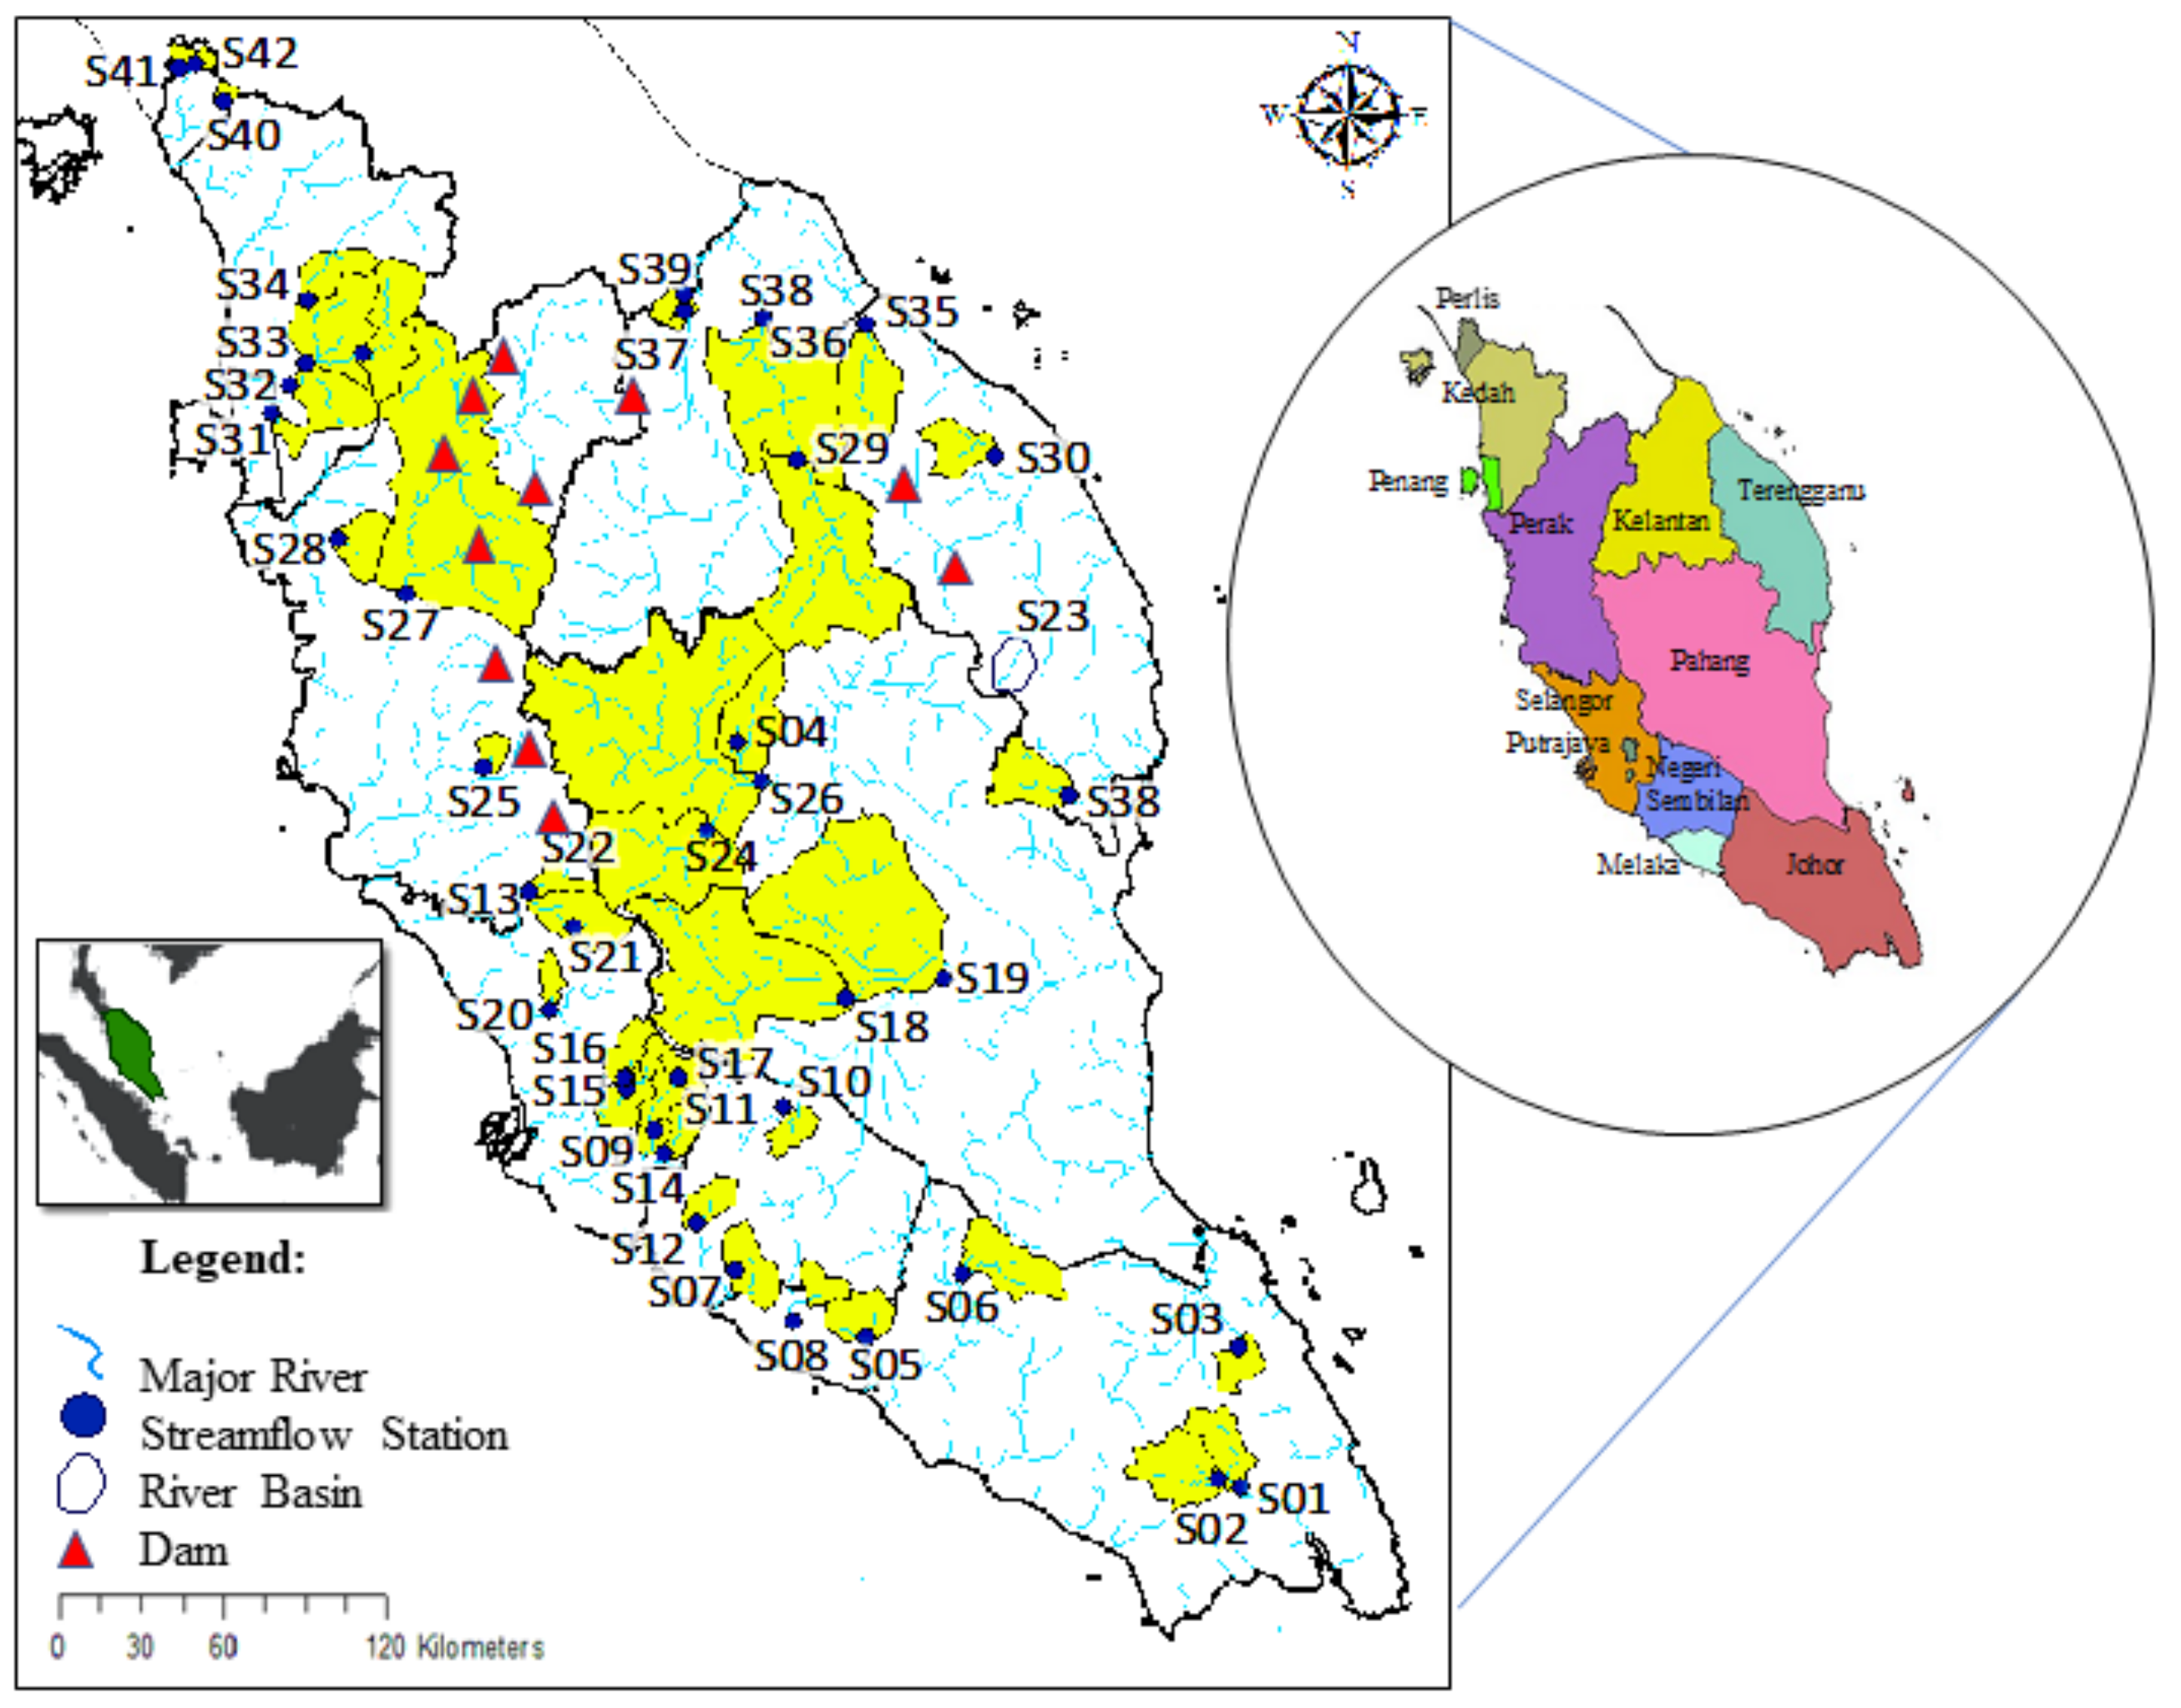
Peninsular Malaysia is located in the Northern Hemisphere, i.e., north of the equator, and has a tropical monsoon climate. As a result, Malaysia has two main monsoons: the southwest and northeast monsoons, and two shorter transitional monsoons. The southwest monsoon often starts in May and lasts until September. The northeast monsoon, on the other hand, often starts in November and lasts until March [47,48]. Malaysia has wet and dry seasons due to the annual monsoon [49]. Figure 2 shows the streamflow stations in Peninsular Malaysia, which consists of 12 states.
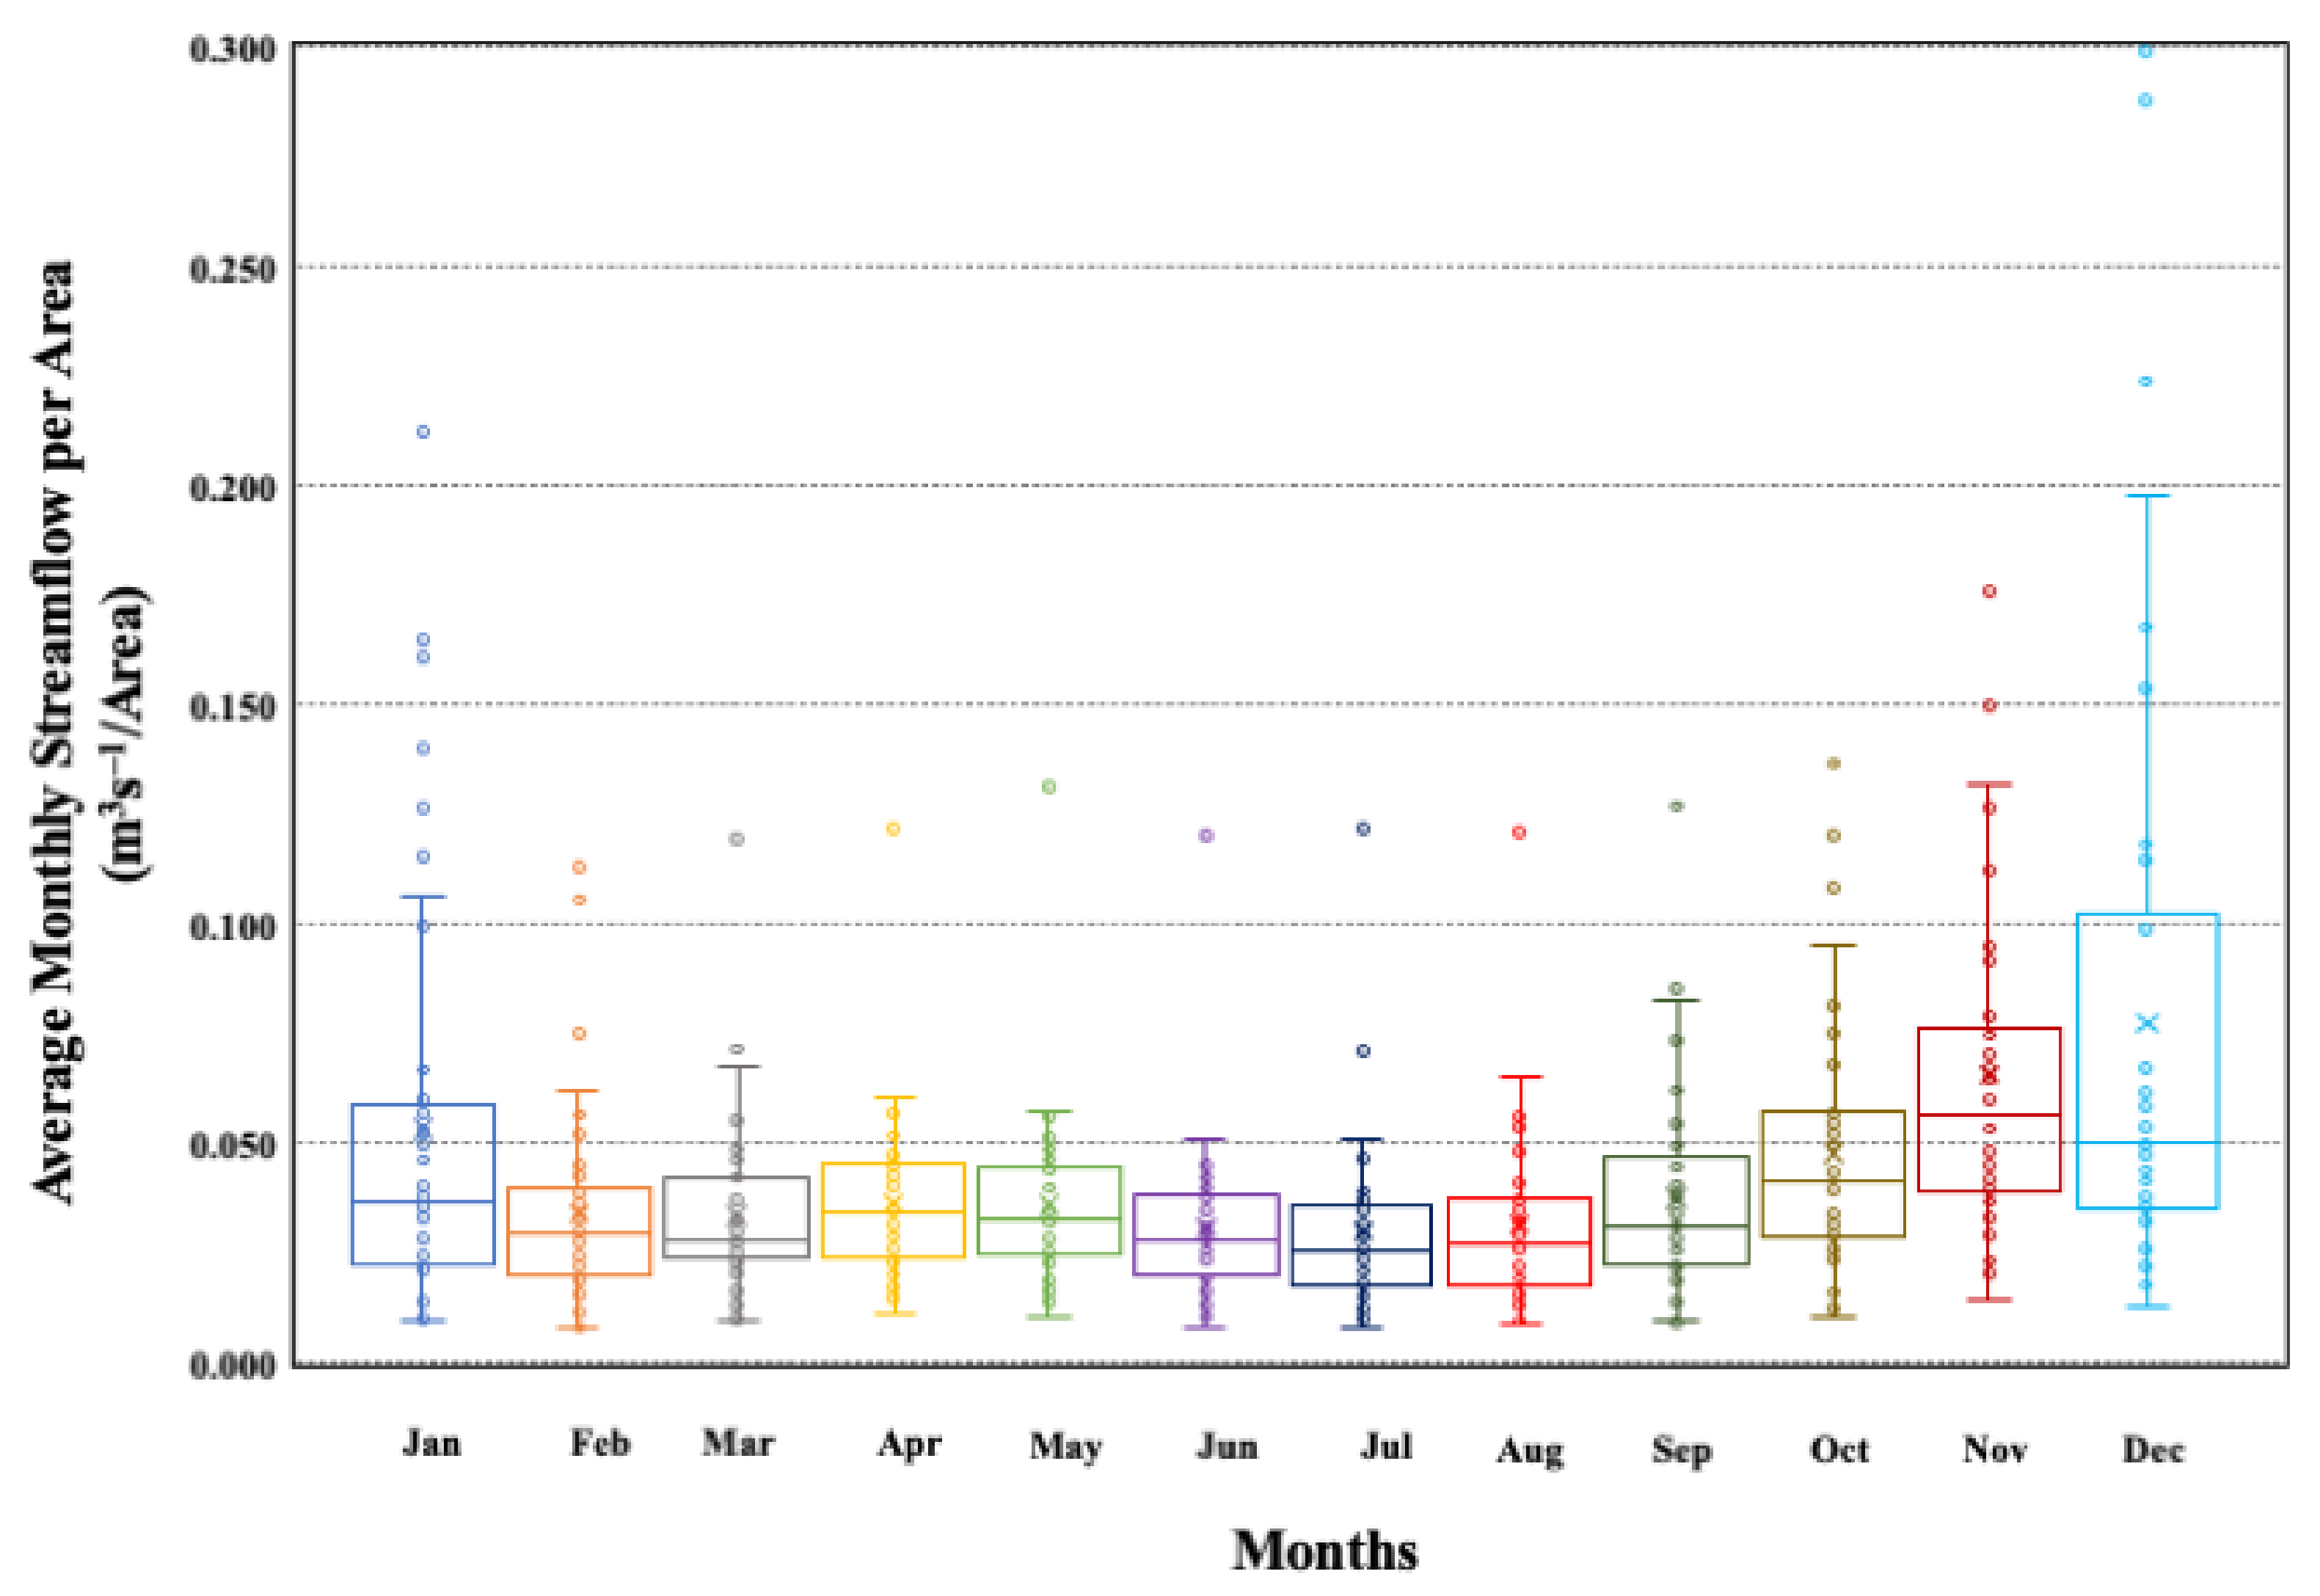
In addition, Table 1 summarises the main statistical parameters of the annual discharge datasets, including state, station ID, river name, area, length of dataset, average streamflow, standard deviation (SD), coefficient of variation (CV) and skewness (Sk). For this study, monthly streamflow data were collected from the Department of Irrigation and Drainage Malaysia (DID) from 1978 to 2018 (Figure 3). The Department strictly controlled the quality of the data before sharing it. For this purpose, streamflow datasets were checked for homogeneity using the double mass curve method. MAMPU Putrajaya (data.gov.my, accessed on 15 January 2022) provided the socio-economic statistics, which include information on population density and agricultural land.
The streamflow stations are evenly distributed across the catchment and cover most of the study area. They are considered a suitable reference for estimating the average streamflow in the whole region. As a result, it was found that the average annual streamflow ranges from 0.78 m3/s to 703.38 m3/s. It was also found that the coefficient of variation of annual streamflow ranges from 4.7% to 21%, with skewness ranging from 0.77 to 16.29.
2.2. Streamflow Drought Index (SDI)
The Streamflow Drought Index (SDI) is a method developed by Nalbantis and Tsakiris [50] to identify hydrological drought events at different spatial and temporal scales. The SDI monitors short-, medium- and long-term hydrological drought by indicating droughts of different lengths within an area at different time intervals [23,51,52,53].
Since there are so many negatively bounded continuous variables in the SDI, it is crucial to provide a distribution that can be fitted to them and one that has a lower bound of zero. The SDI was calculated by fitting a gamma distribution to streamflow data over arbitrary time scales. In this study, 42 stations were subjected to hydrological drought over a specified period of time (3, 6, 9 and 12 months).
A cumulative probability distribution function (PDF) (gamma distribution) is fitted to the monthly (k) streamflow data (in this case k = 1 for January to March, k = 2 for January to June, k = 3 for January to September and k = 4 for January to December). The gamma PDF (g(x)) is written as follows, in Equation (1):
where is a scale; is a shape parameter that can be estimated by the maximum likelihood method; x is the monthly streamflow; and is the gamma function at . The cumulative distribution function (CDF) is obtained by integrating Equation (1). Then, the CDF is transformed to the standard normal distribution with zero mean and unit variance, according to Equation (2):
The Streamflow Drought Index (SDI) values were classified and described in Table 2.
2.3. Theory of Run for Hydrological Drought
After calculating the drought index based on streamflow data series, specific criteria need to be applied to identify drought events [54]. In this study, the theory of runs originally proposed by Yevjevich [55] was used to determine the characteristics of hydrological drought. Drought characteristics were identified using the theory of run. A run is made up of a part of a time series of drought variables, with each value representing the truncation level [56]. The value of 1.0 was chosen in this study to evaluate the severity, duration, mean drought severity, and maximum drought intensity for Peninsular Malaysia.
Drought severity refers to the severity of a severe drought climate, and the number of drought months is used to determine how long the drought will last [57,58]. The average drought severity is divided by the severity of the drought and the number of drought months [59]. The maximum drought intensity refers to the highest degree in the drought severity scale, which is used to assess the most severe cases of extreme drought [56]. The duration of hydrological drought is the period during which the SDI value was less than −1.0 (moderate, severe and extreme) as shown in Table 2, and drought severity is the cumulative deficit during that drought event.
2.4. Trend Analysis for Hydrological Drought
To determine hydrological drought trends in Peninsular Malaysia using SDI as a drought indicator, we used the widely used non-parametric Mann-Kendall test (MK) in conjunction with Sen’s slope estimator. Equation (3) can be used to represent the Mann-Kendall test statistic S.
where n is the number of data and x is the data point at the time points i and j (j > i). Furthermore, at a confidence level of 0.05, the Mann-Kendall test would determine whether there was a positive or negative trend. The Sen method was then used to calculate the exact slope of a linear trend. To determine the slope, the trend of all pairs of data is calculated as follows in Equation (4):
where xj and xk are the data values at time j and k, respectively. The median of the N values of Qi is the Sen estimator of the slope. A positive value of Qi indicates an increasing (upward) trend while a negative value of Qi represents a downward or decreasing trend in the SDI-12 data.
2.5. Modified Drought Risk Assessment
This study highlights the development and modification of the general drought risk for a specific drought, in this case a hydrological drought. The modified risk assessment method is an integrated hydrological drought from SDI and socio-economic variables. Unlike traditional drought indices such as the SDI, which are based on fixed, regulated accumulation periods and a fixed region, we provide a novel drought detection technique by integrating spatial and temporal variables with socio-economic variables in drought regions. Due to the availability of relevant socio-economic data, two variables were selected for this study, namely, agricultural land and population density.
2.5.1. Hydrological Drought Hazard Index (HDHI)
The Hydrological Drought Hazard Score (HDHS) is calculated by multiplying the values for weighting and rating. The weighting (W) and rating (R) values are assigned based on the normal cumulative probability function for drought hazard rating, taking into account severity and probability of occurrence using a weighting technique based on the cumulative distribution function. The weighting values are calculated using the SDI intervals, where W = 1 represents normal drought, W = 2 represents moderate drought, W = 3 represents severe drought and W = 4 represents extreme drought. For SDI > −1.0, the weights are set to zero.
Then, for each SDI value between 1978 and 2018, the HDHS value is calculated for 42 monitoring stations. The percentage area (A%) and the corresponding HDHS value are aggregated within the provincial boundaries using Equation (5) to determine the HDHI for the regions. When compared to the Thiessen polygon method for calculating the HDHI for regions, this method is more practical. As a result, this method can provide more realistic hazard values at the regional level.
2.5.2. Hydrological Drought Vulnerability Index (HDVI)
Vulnerability is a matter of perspective that illustrates how susceptible a system is to losses from the occurrence of an event. Vulnerability is a possible indicator of the maximum loss from an event, which is closely linked to the socio-economic conditions of the region. Vulnerability indicators are chosen differently in different sectors and should be directly linked to the local study context and the specific hazard. Agricultural land (AL) and population density (PD) are two socio-economic indicators used in this study to calculate the Hydrological Drought Vulnerability Index (HDVI) using Equation (6):
2.5.3. Hydrological Drought Risk Index (HDRI)
The hazard and vulnerability analyses are combined to assess drought risk. The Hydrological Drought Risk Index (HDRI) is usually calculated by multiplying the HDHI and the HDVI. If either the HDVI or the HDHI equals 0, there is no risk. However, when either the HDVI or the HDHI is greater than 0, the probability of a drought event increases. Therefore, both hazard and vulnerability data are needed to quantify drought risk. The HDRI is constructed using the conceptual model shown in Equation (7), as quantitative assessments of drought risk are critical to managing the impacts of drought events. Each index is then rescaled into four different classes, which are listed in Table 3.
Calibration of the maps is performed by adjusting the weighting factors or coefficients of the model parameters. Additionally, the updated framework is used to predict the change in hydrological drought risk associated with irrigation system changes. The framework requires input data that are widely available, assumed values for semi-empirical parameters, and verification of model findings using actual field conditions. Following validation, the framework can be used to forecast changes in drought risks under various scenarios in order to aid decision-making about drought mitigation strategies. The model can be used to analyse and manage drought risk in various irrigation project regions.
3. Results and Discussions
3.1. Long-Term Hydrological Drought (SDI-12) Analysis
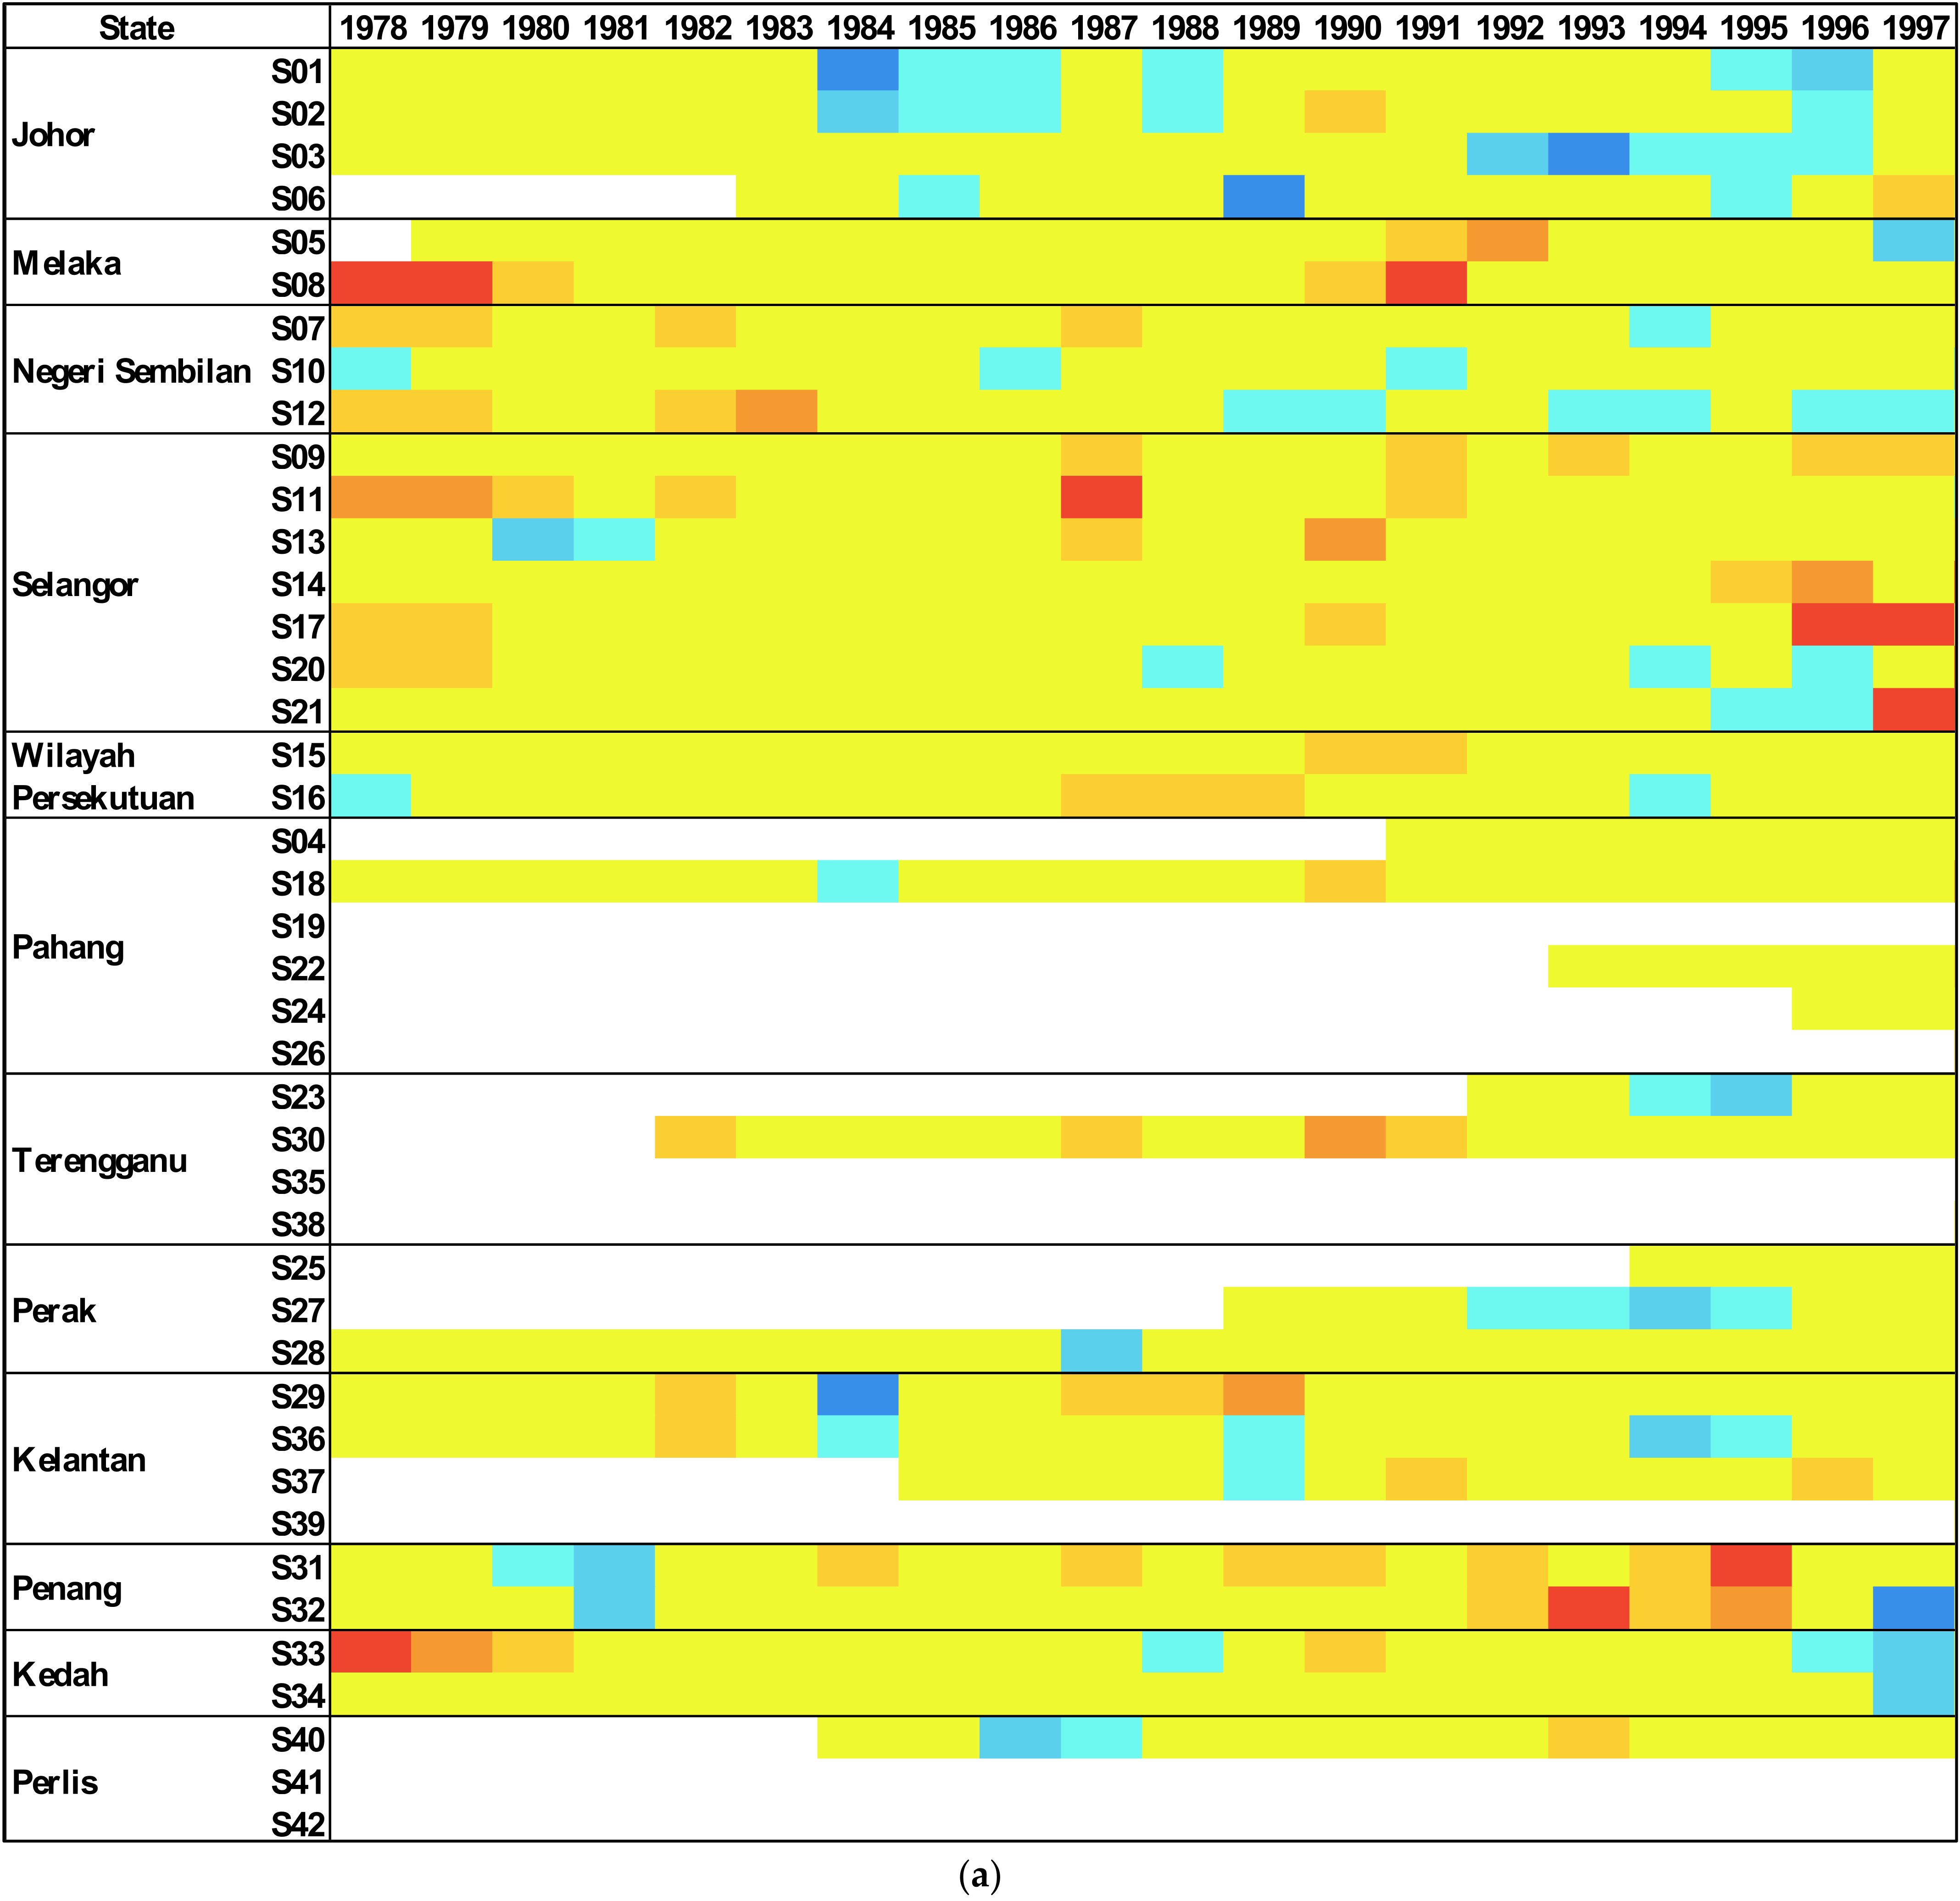
To determine hydrological drought, the analytical results are compared with the standard drought criterion in Table 2. Figure 4 shows the SDI-12 over 40 years. Positive values indicate wet conditions, while negative values indicate dry conditions.
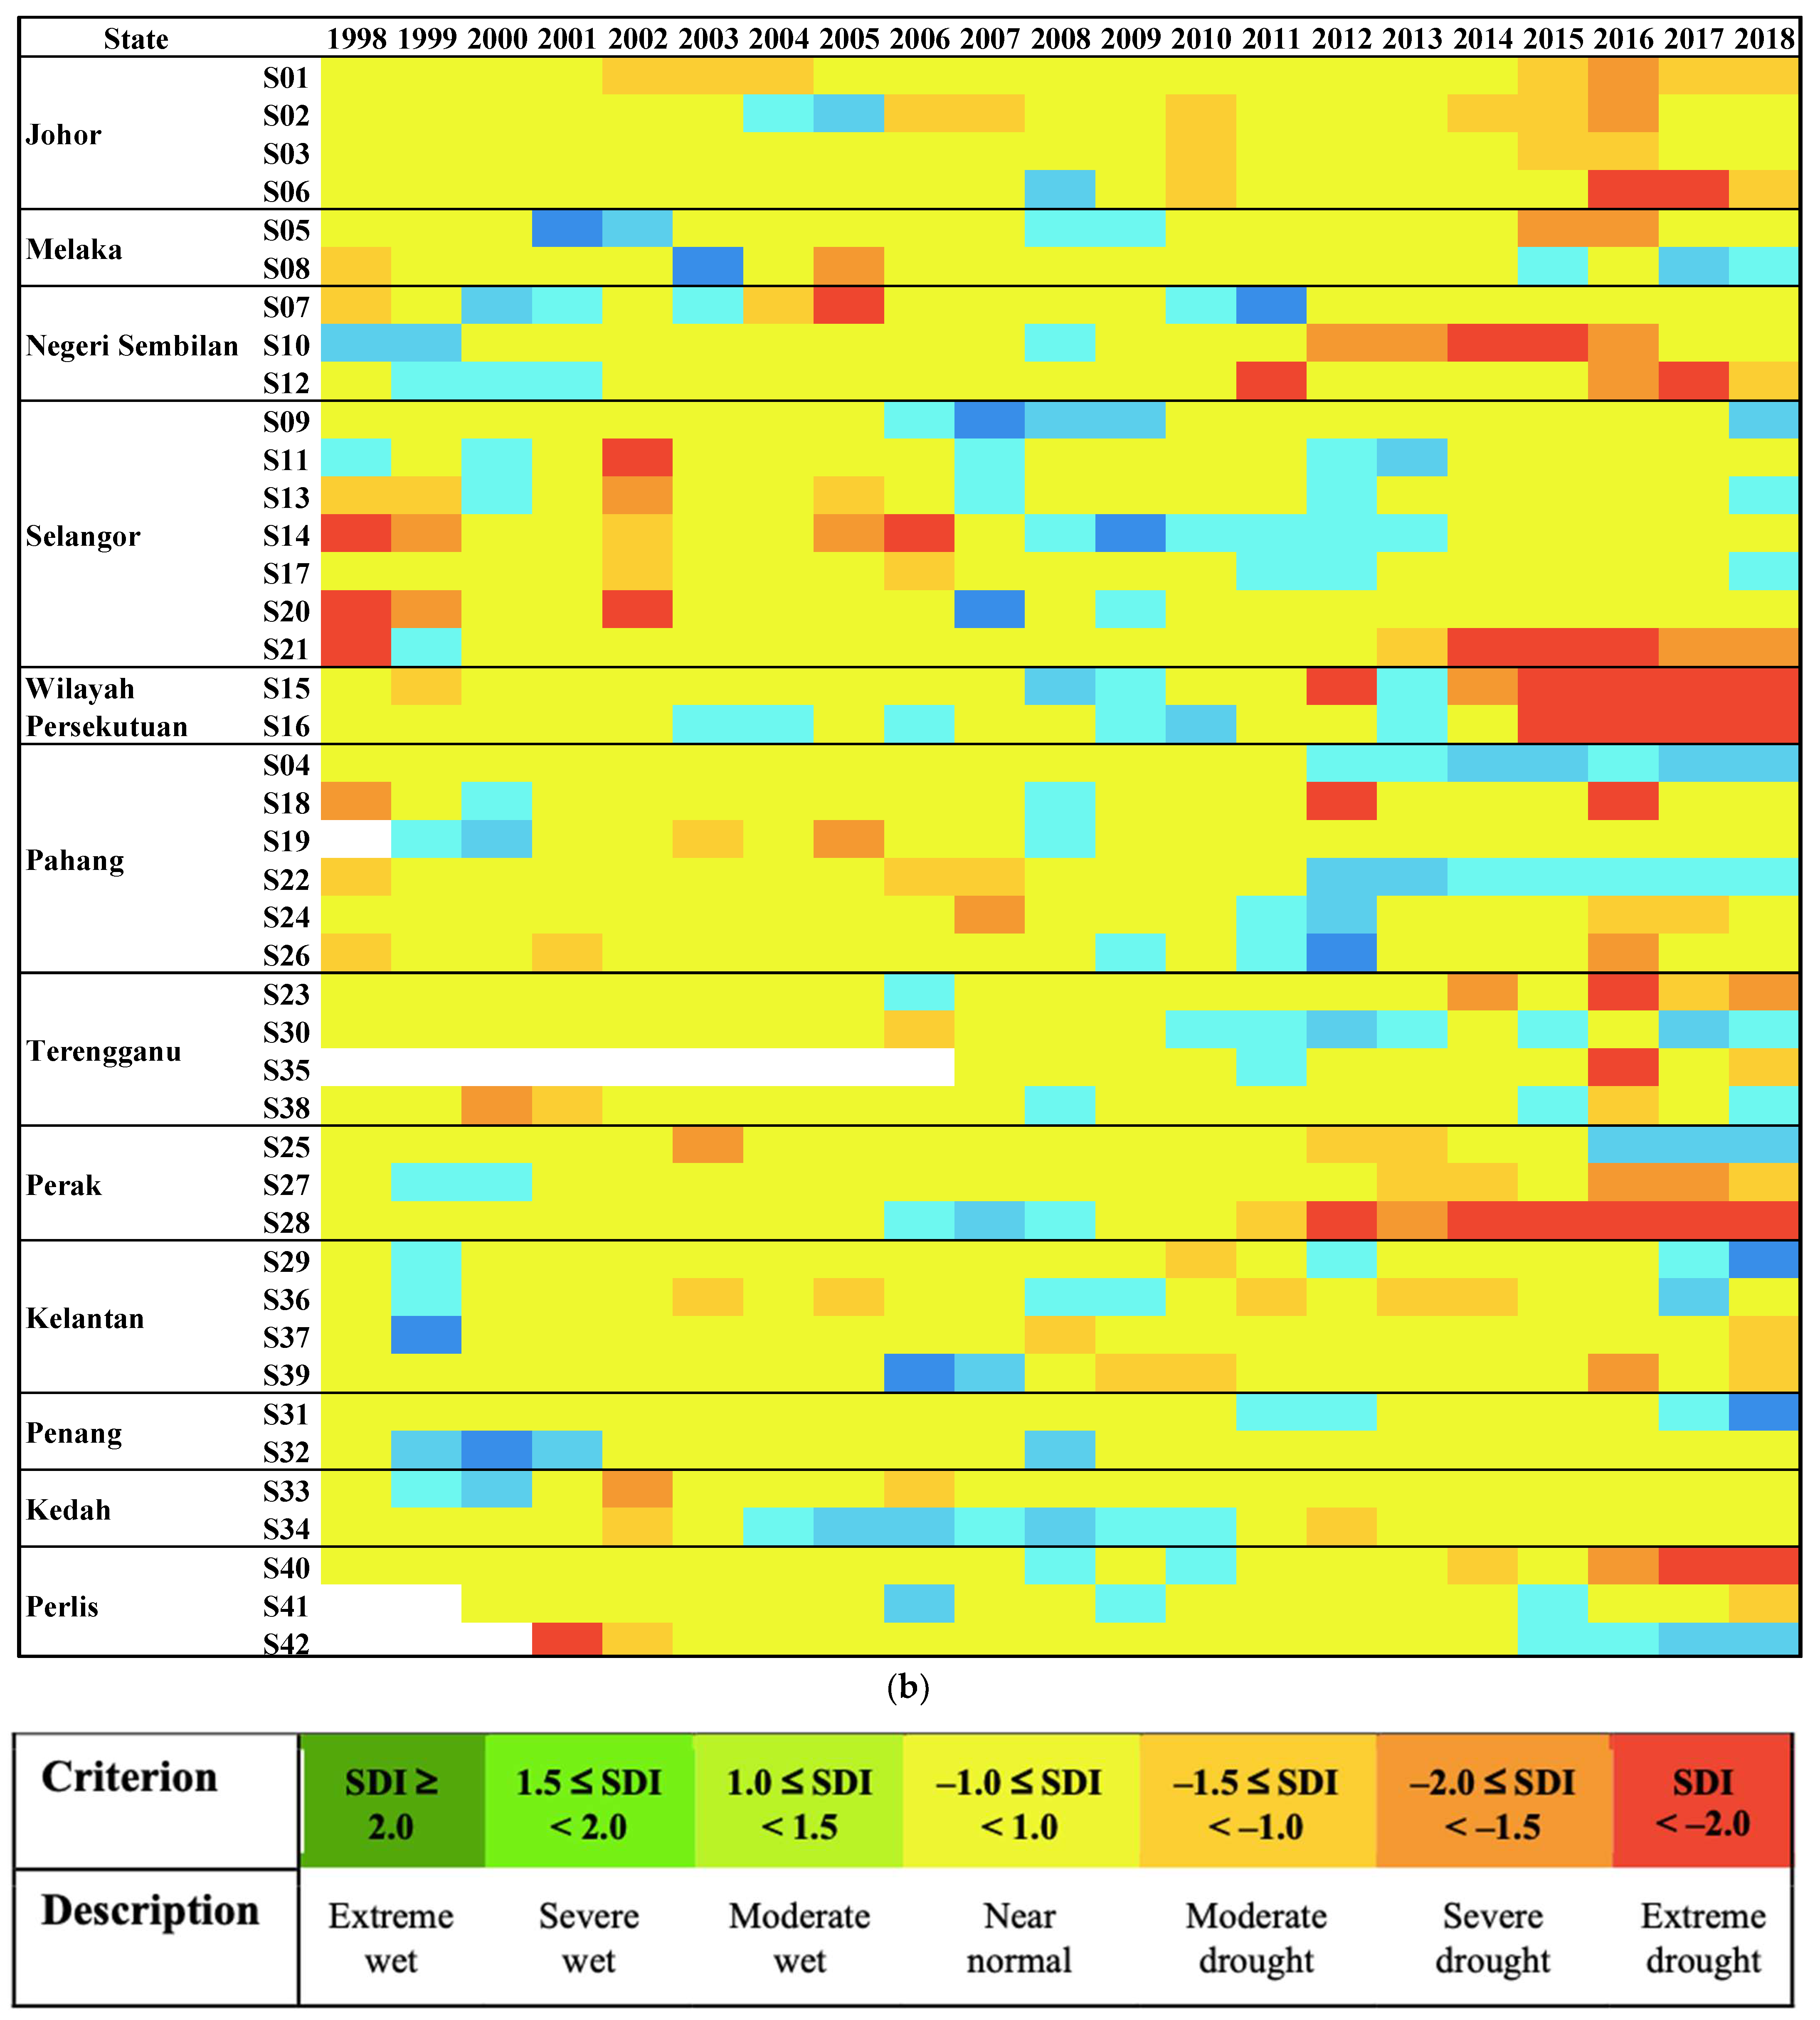
Figure 4 shows that over the last 40 years, all streamflow stations have experienced at least one severe drought. For the SDI-12, about 22 stations have experienced severe and exceptional droughts after 2010 (January–December). From 2012 to 2018, the most severe drought was observed at station S28 on the Perak River. Moreover, all extreme drought episodes have occurred in the last nine years, starting in 2012. The most severe hydrological droughts occurred between 1996 and 1998, 2002 and 2003, and 2012 and 2018. The most severe hydrological droughts occurred in 1997–1998 and 2014–2016 at station S21 along the Bernam River in Selangor. This result is consistent with the observations of Shaaban and Low [60], who found that the El Niño drought of 1997/1998 significantly affected Peninsular Malaysia, particularly Selangor and the central area, and that the damage continued until September 1998.
3.2. Hydrological Drought Trends for the Annual (SDI-12) Timescale
We applied the Mann-Kendall test with Sen’s Slope Estimator to determine the trend of hydrological drought in the annual SDI-12 periods in Peninsular Malaysia from 1978 to 2018. The significance level is the important parameter in Figure 5 as it defines the extent to which there is a monotonically increasing or decreasing trend. The test statistic S, the Mann-Kendall coefficient of the tau-sequence correlation and the p-value reflecting the significance of the trend are the most important test results. Figure 6 illustrates the results of the Mann-Kendall test for the significant trend for the annual time scale.
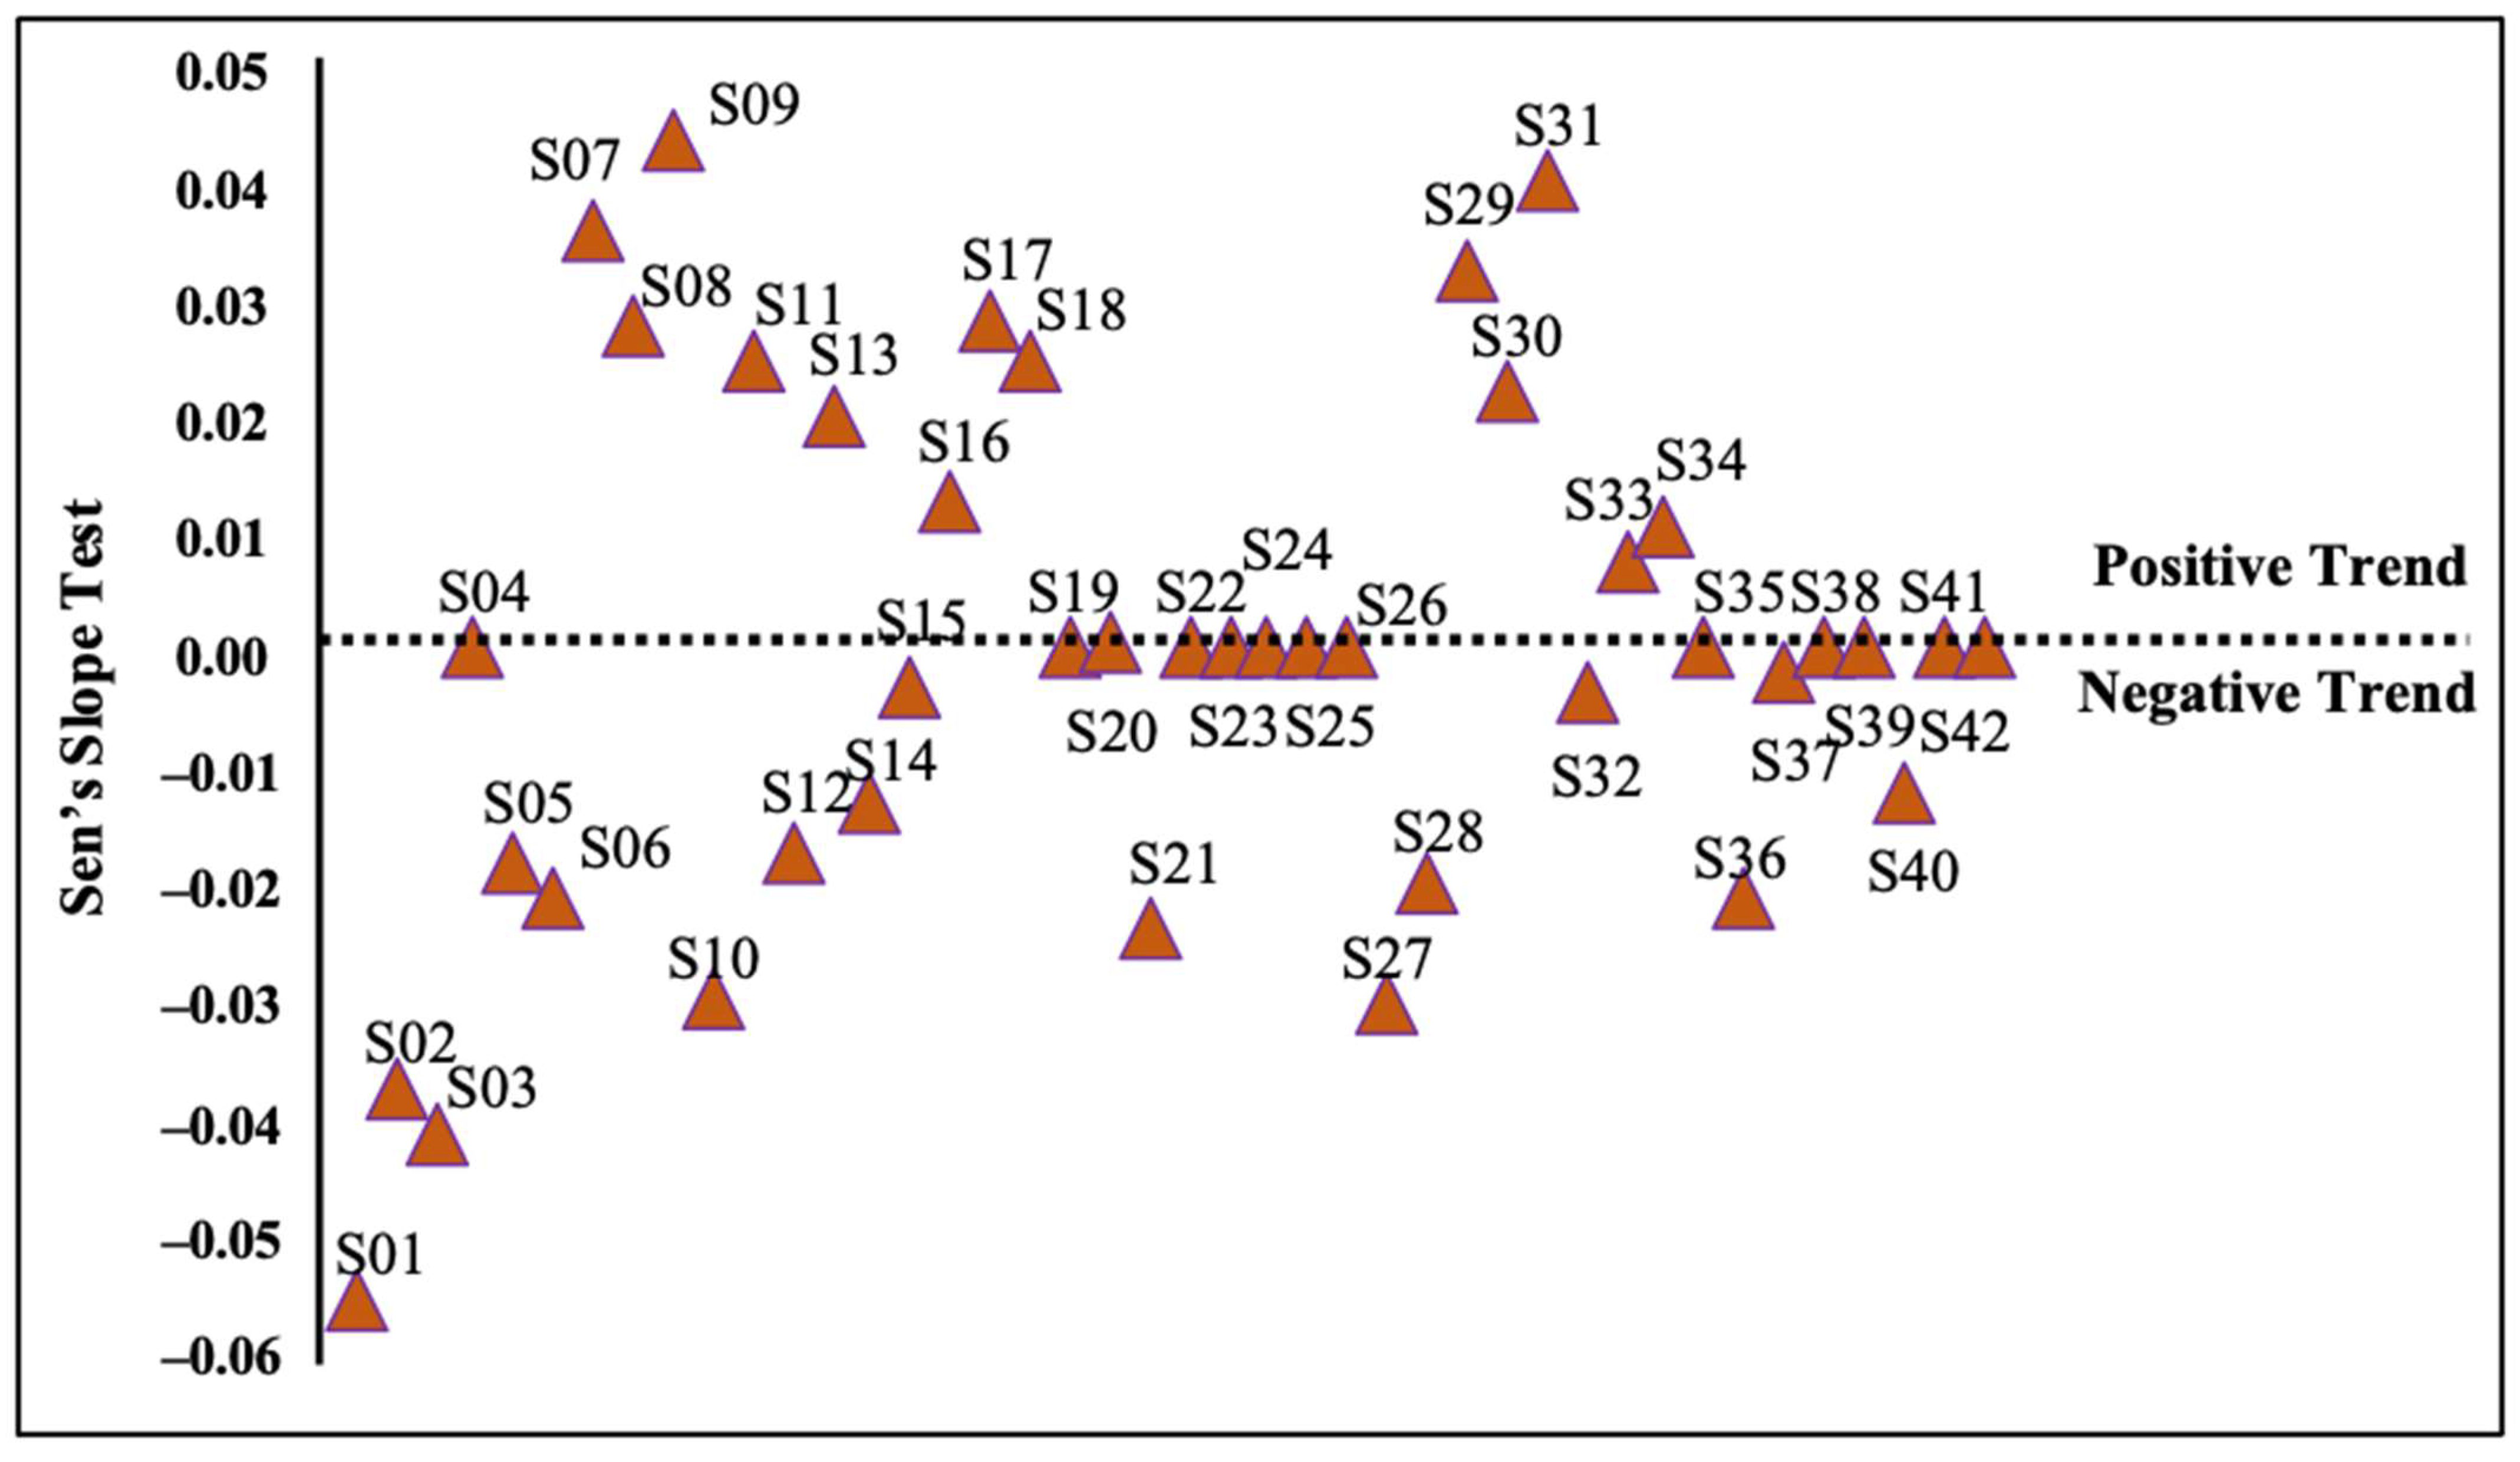
The variation in hydrological drought trend analysis on an annual basis is significant, showing increasing (upward) trends, and some showing decreasing (downward) trends. A trend is assumed when the absolute value of the Z-value of the Mann-Kendall test is greater than 1.96 at a 5% significance level. The SDI-12 trend analysis showed a decreasing trend of SDI-12 at 17 stations that showed a significant decreasing trend. However, 25 stations showed a wetting trend with a significant growth trend in annual SDI-12. In terms of SDI-12, the region shows a wetting trend (a decrease in drought events) when the overall trend is considered. In addition, the trend slopes were assessed using Sen’s Slope Estimator method. This method resulted in a positive and negative slope for the SDI-12 series for all stations, indicating upward and downward trends (Figure 6).
This study showed that hydrological drought has increased at 13 stations in recent years. Sen’s slope values for 16 stations in the SDI-12 series showed a slight downward trend (negative). In contrast, no trend was observed for 13 stations in the SDI-12 series. The SDI data in the study region indicate that moderate and severe drought events follow each other on average for more than one year. For example, in 2012 and 2013, there was a moderate drought. In the following years, 2014 and 2015, there were severe droughts. In the following years, from 2015 to 2018, extreme drought conditions were documented. Drought categories, event occurrence and severity were assigned to the results from each station in Peninsular Malaysia. The attributes were then plotted on a geographic grid map to analyse spatial variance, and visual interpretations were developed for each location.
3.3. Temporal in Different Timescales of Hydrological Drought
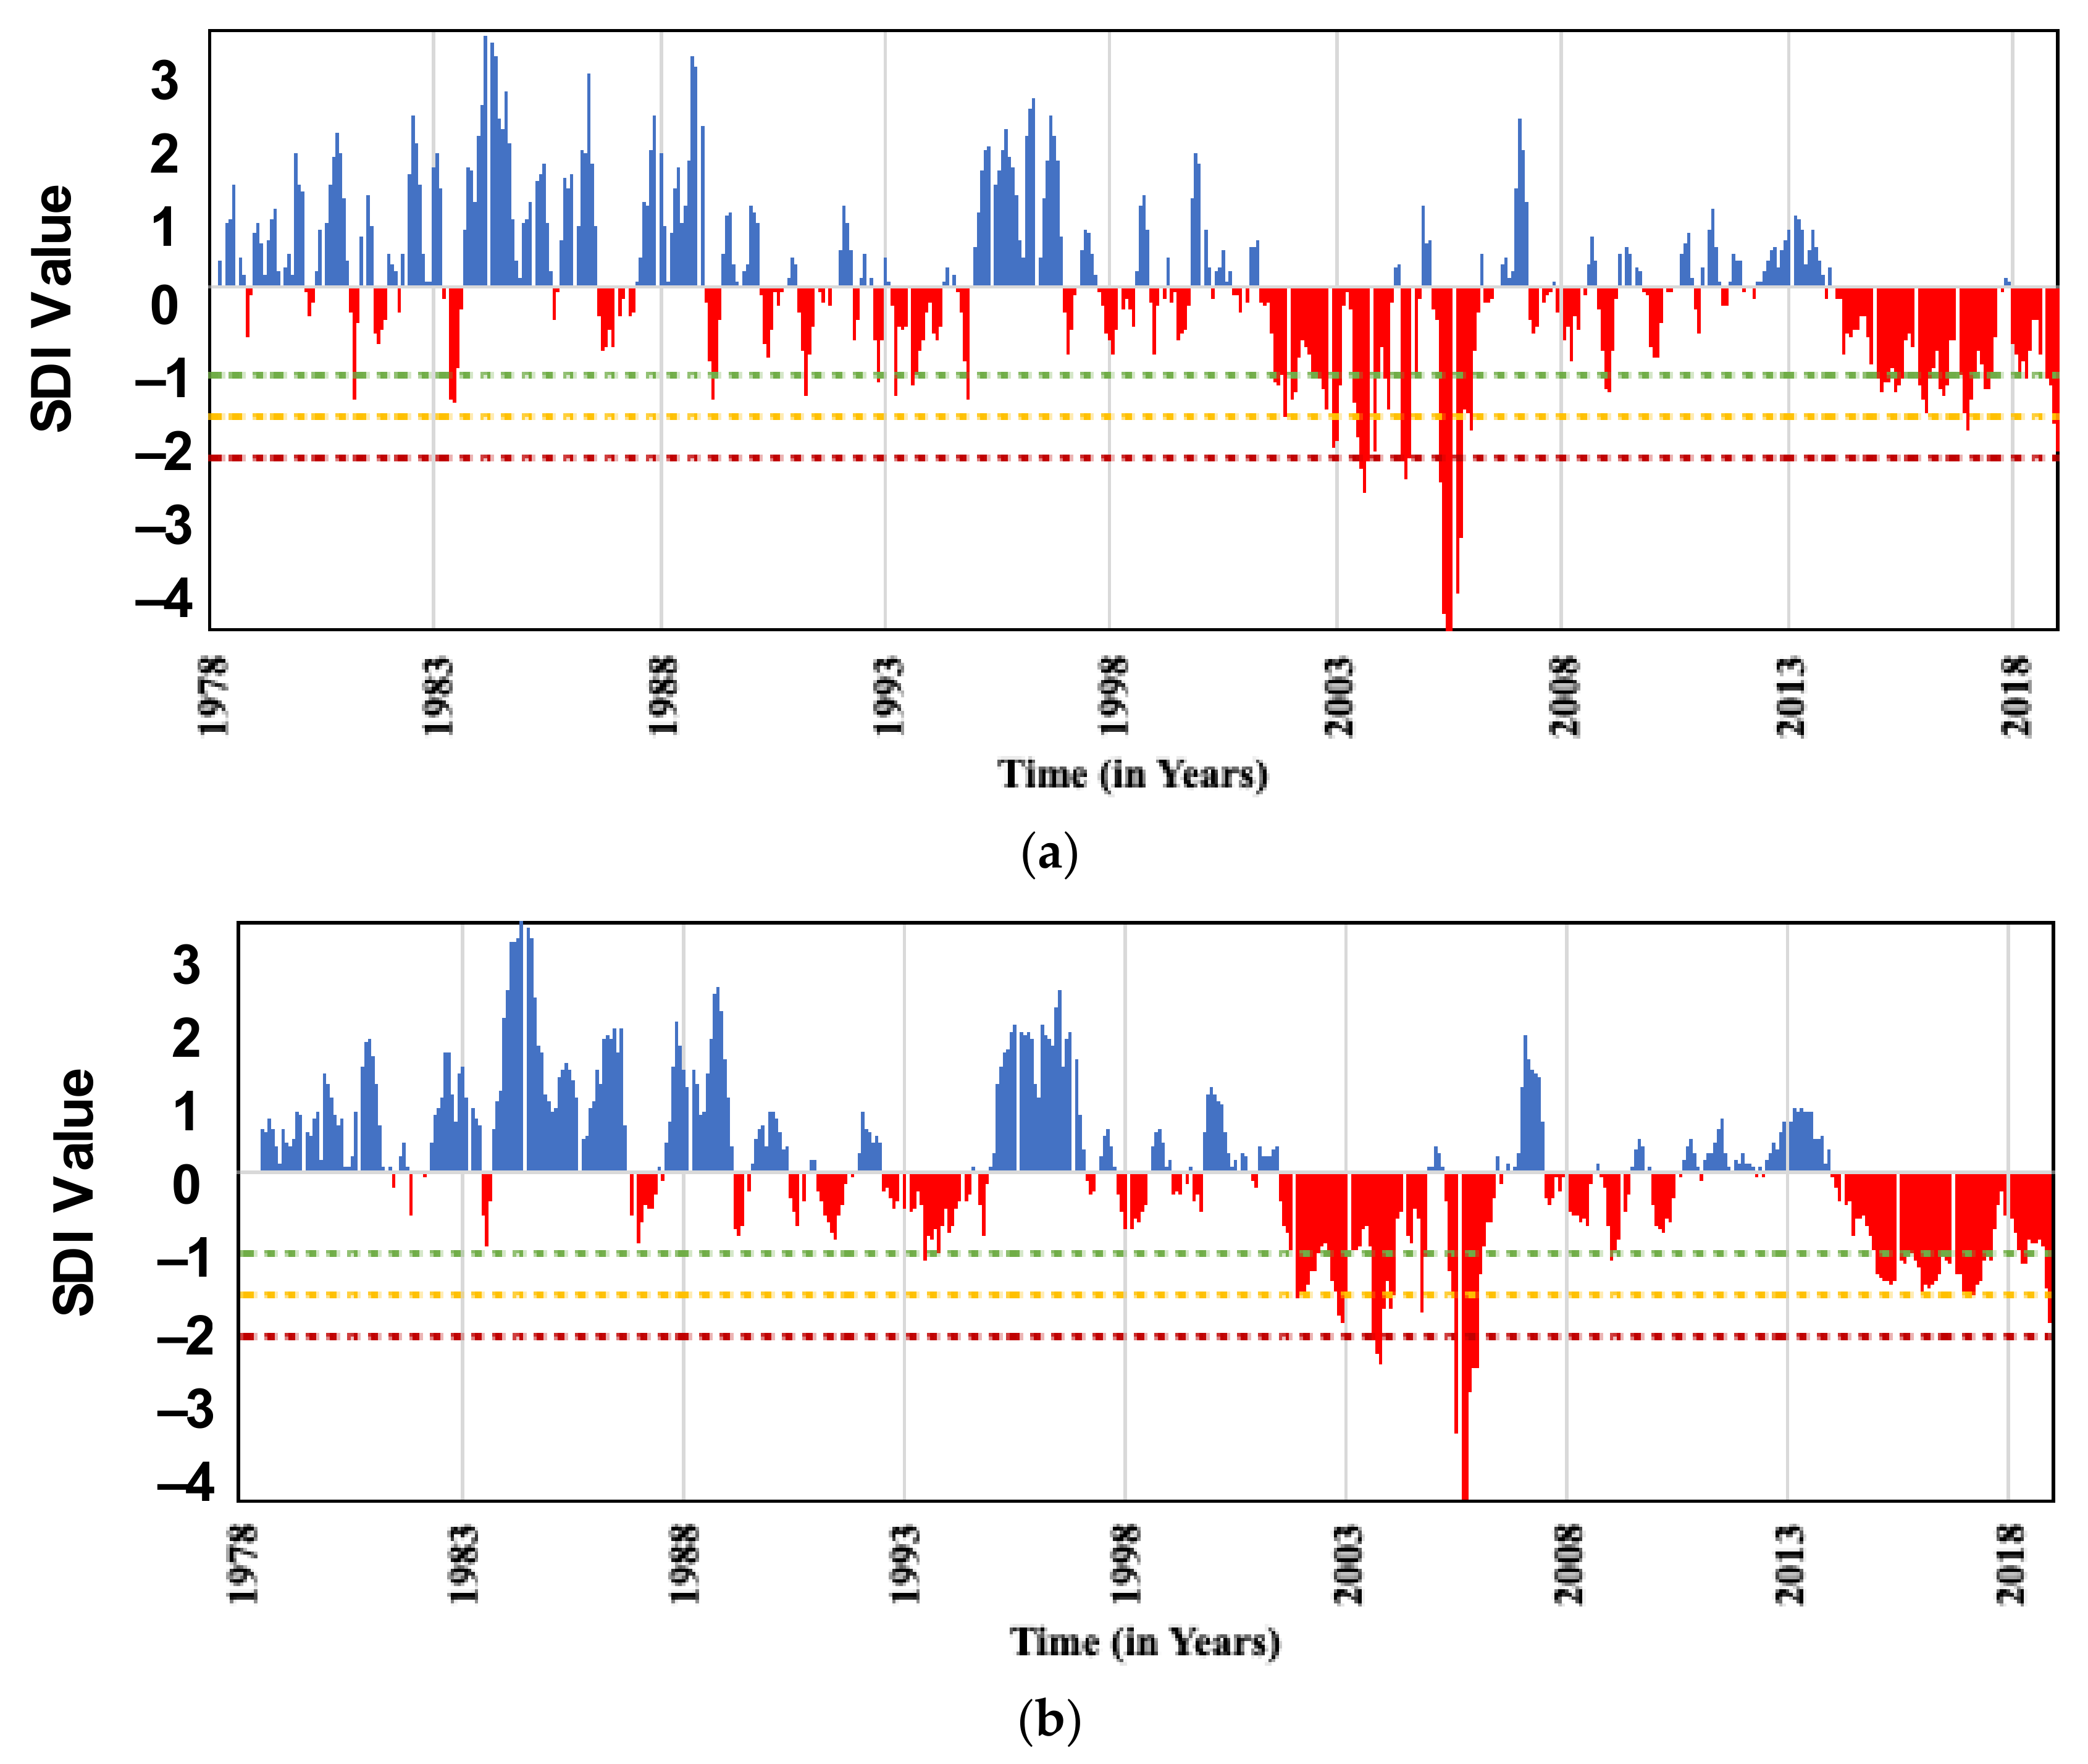
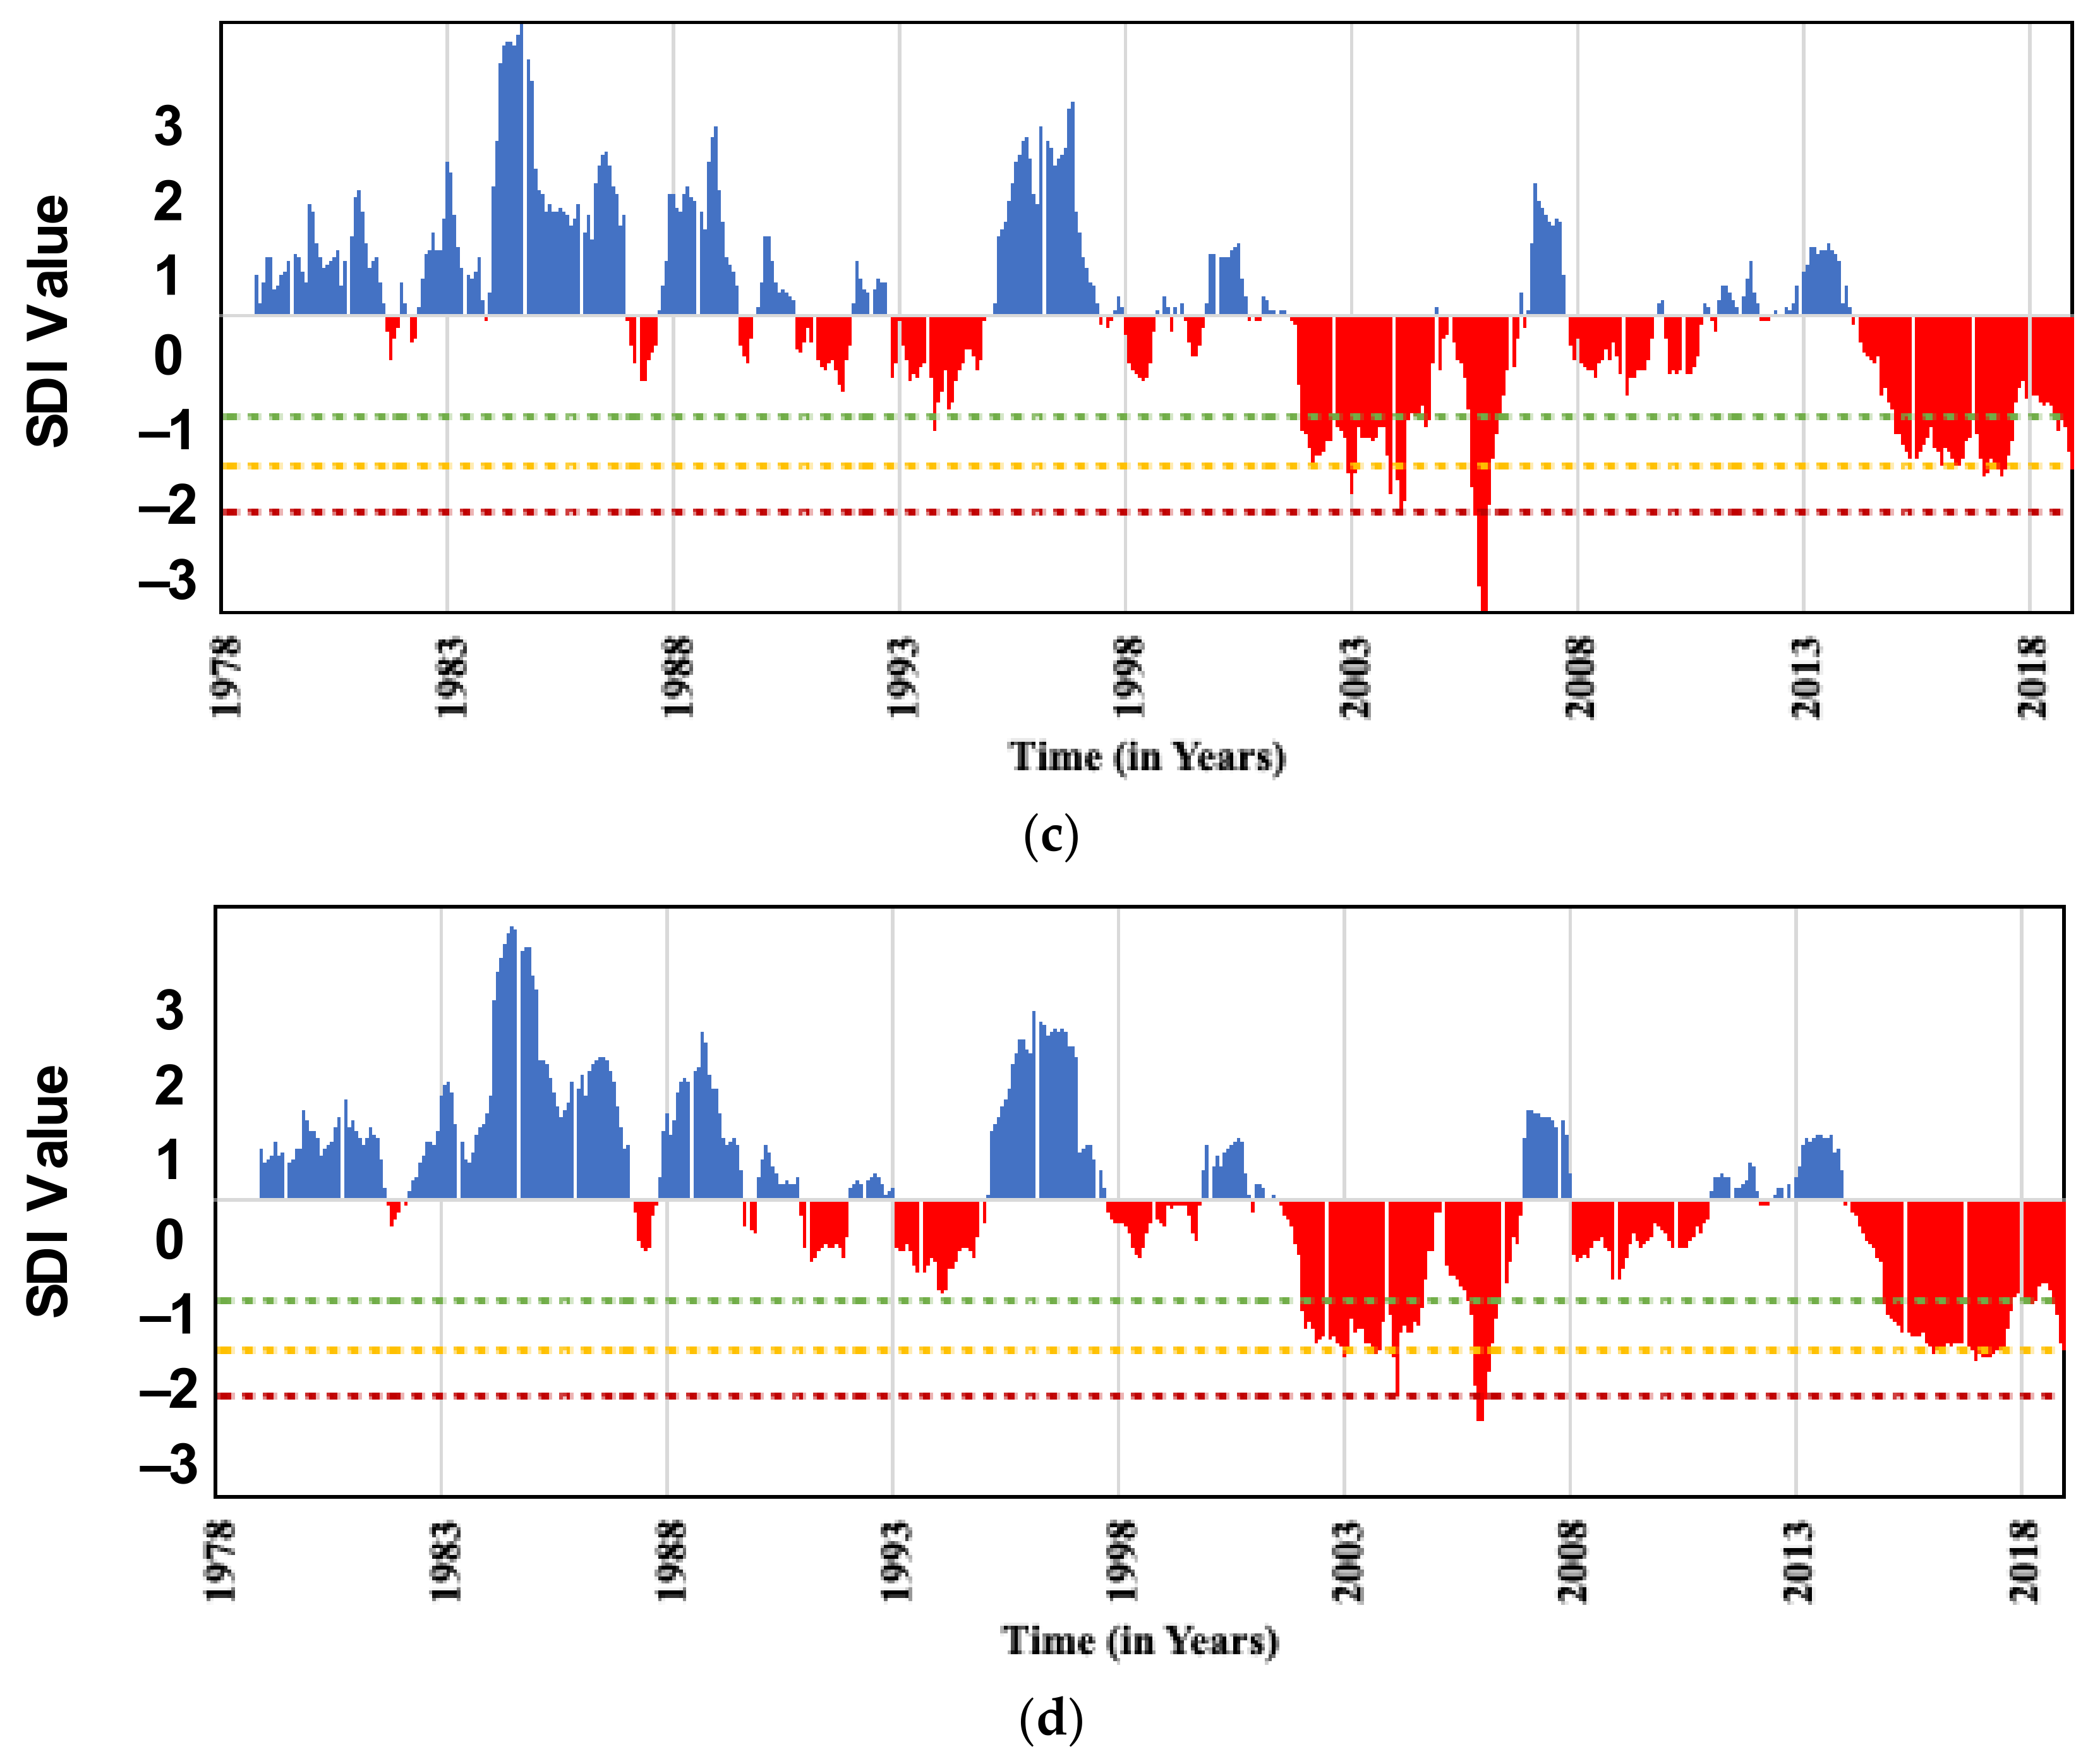
SDI values were calculated for 42 stations on a time scale of 3, 6, 9 and 12 months. Hydrological drought was characterised using SDI calculations based on negative values below thresholds. For example, the temporal variation of drought for the time scale of SDI-3, SDI-6, SDI-9 and SDI-12 at station S01 from 1978 to 2018 is shown in Figure 7. Streamflow deficits are represented by the red area, which consists of negative values grouped by range (Figure 7) to define each drought category. In this analysis, a threshold of −1.0 was used to identify the occurrence of drought.
When the time scale is shorter, the frequency of dry periods is short and comparatively low. In most cases, the SDI-3 is calculated for a shorter period as a seasonal water level and provides important irrigation data for agriculture. The six-month drought index (SDI-6) is a measure of drought over a six-month period. The 12-month drought index (SDI-12) is suitable for assessing the impact of climate change on regional water supply [23,51]. The total number of drought events decreased as the time scale of the SDI increased, and as the frequency of drought episodes decreased. A longer time scale such as 12 months (SDI-12) showed frequent and prolonged droughts, with few dry spells recorded (Figure 6). The statistics on events, severity and frequency were calculated based on the data from the calculation process. The temporal behaviour of the SDI is shown in Figure 8.
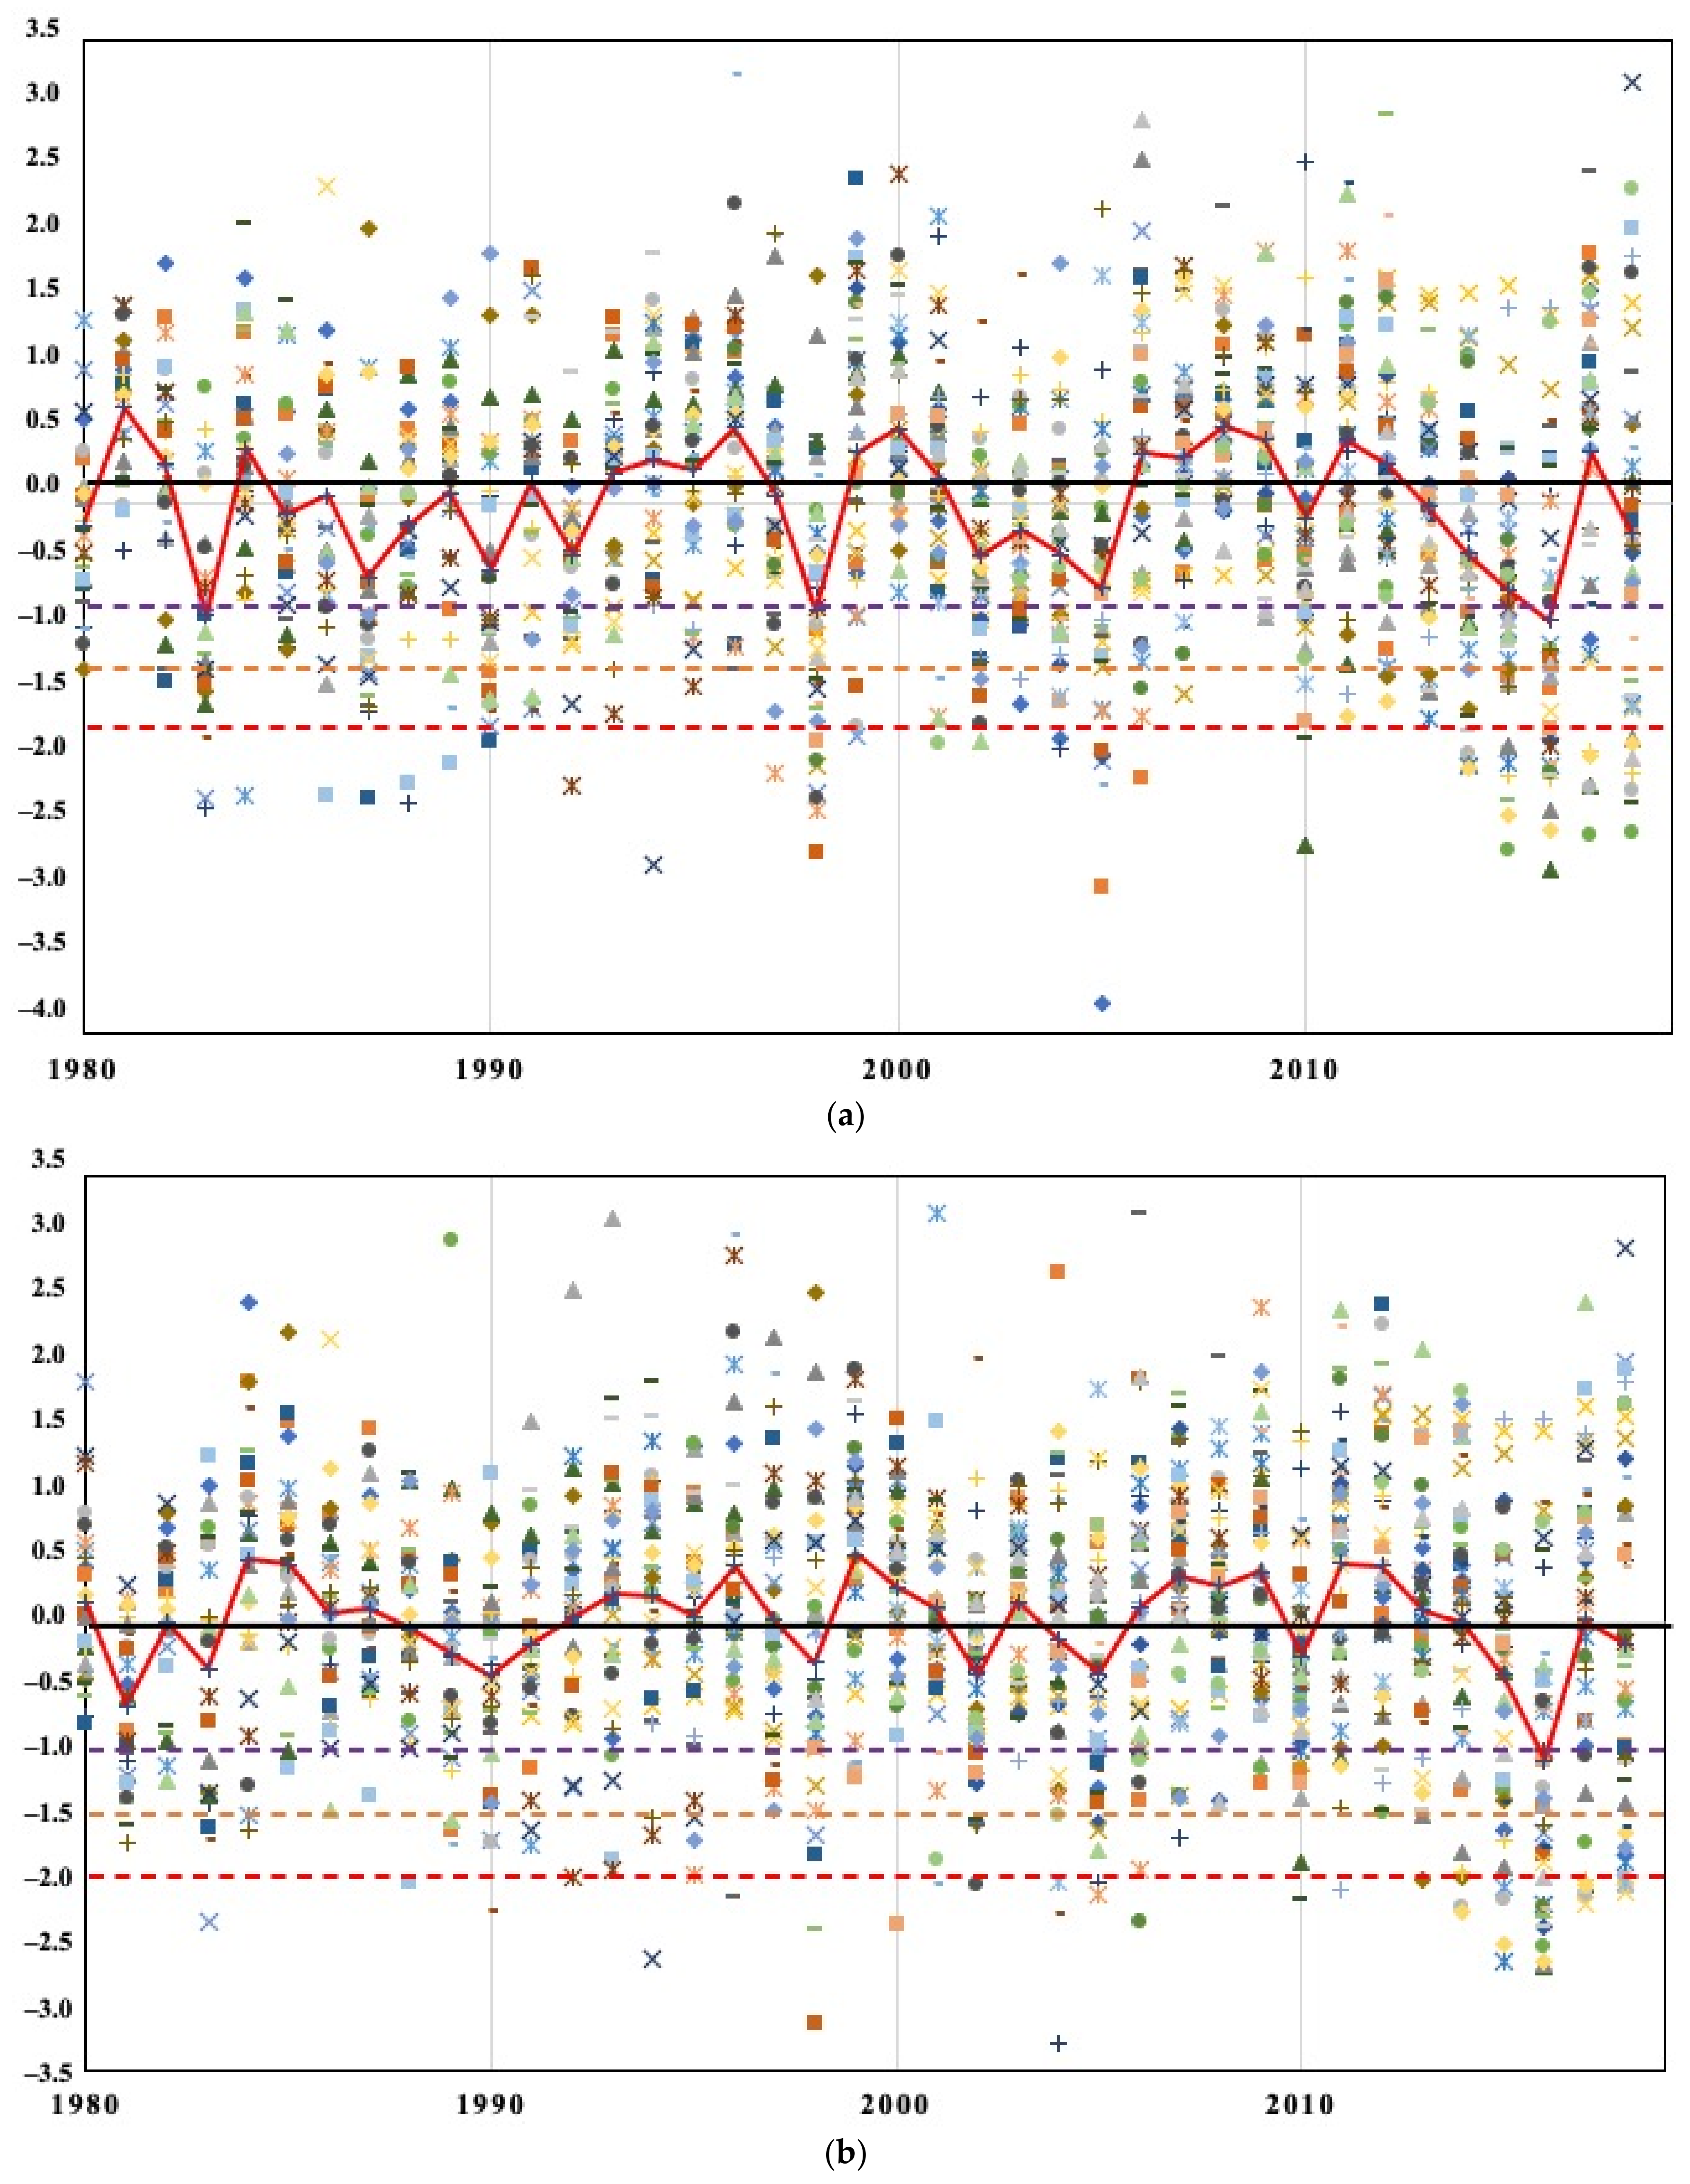
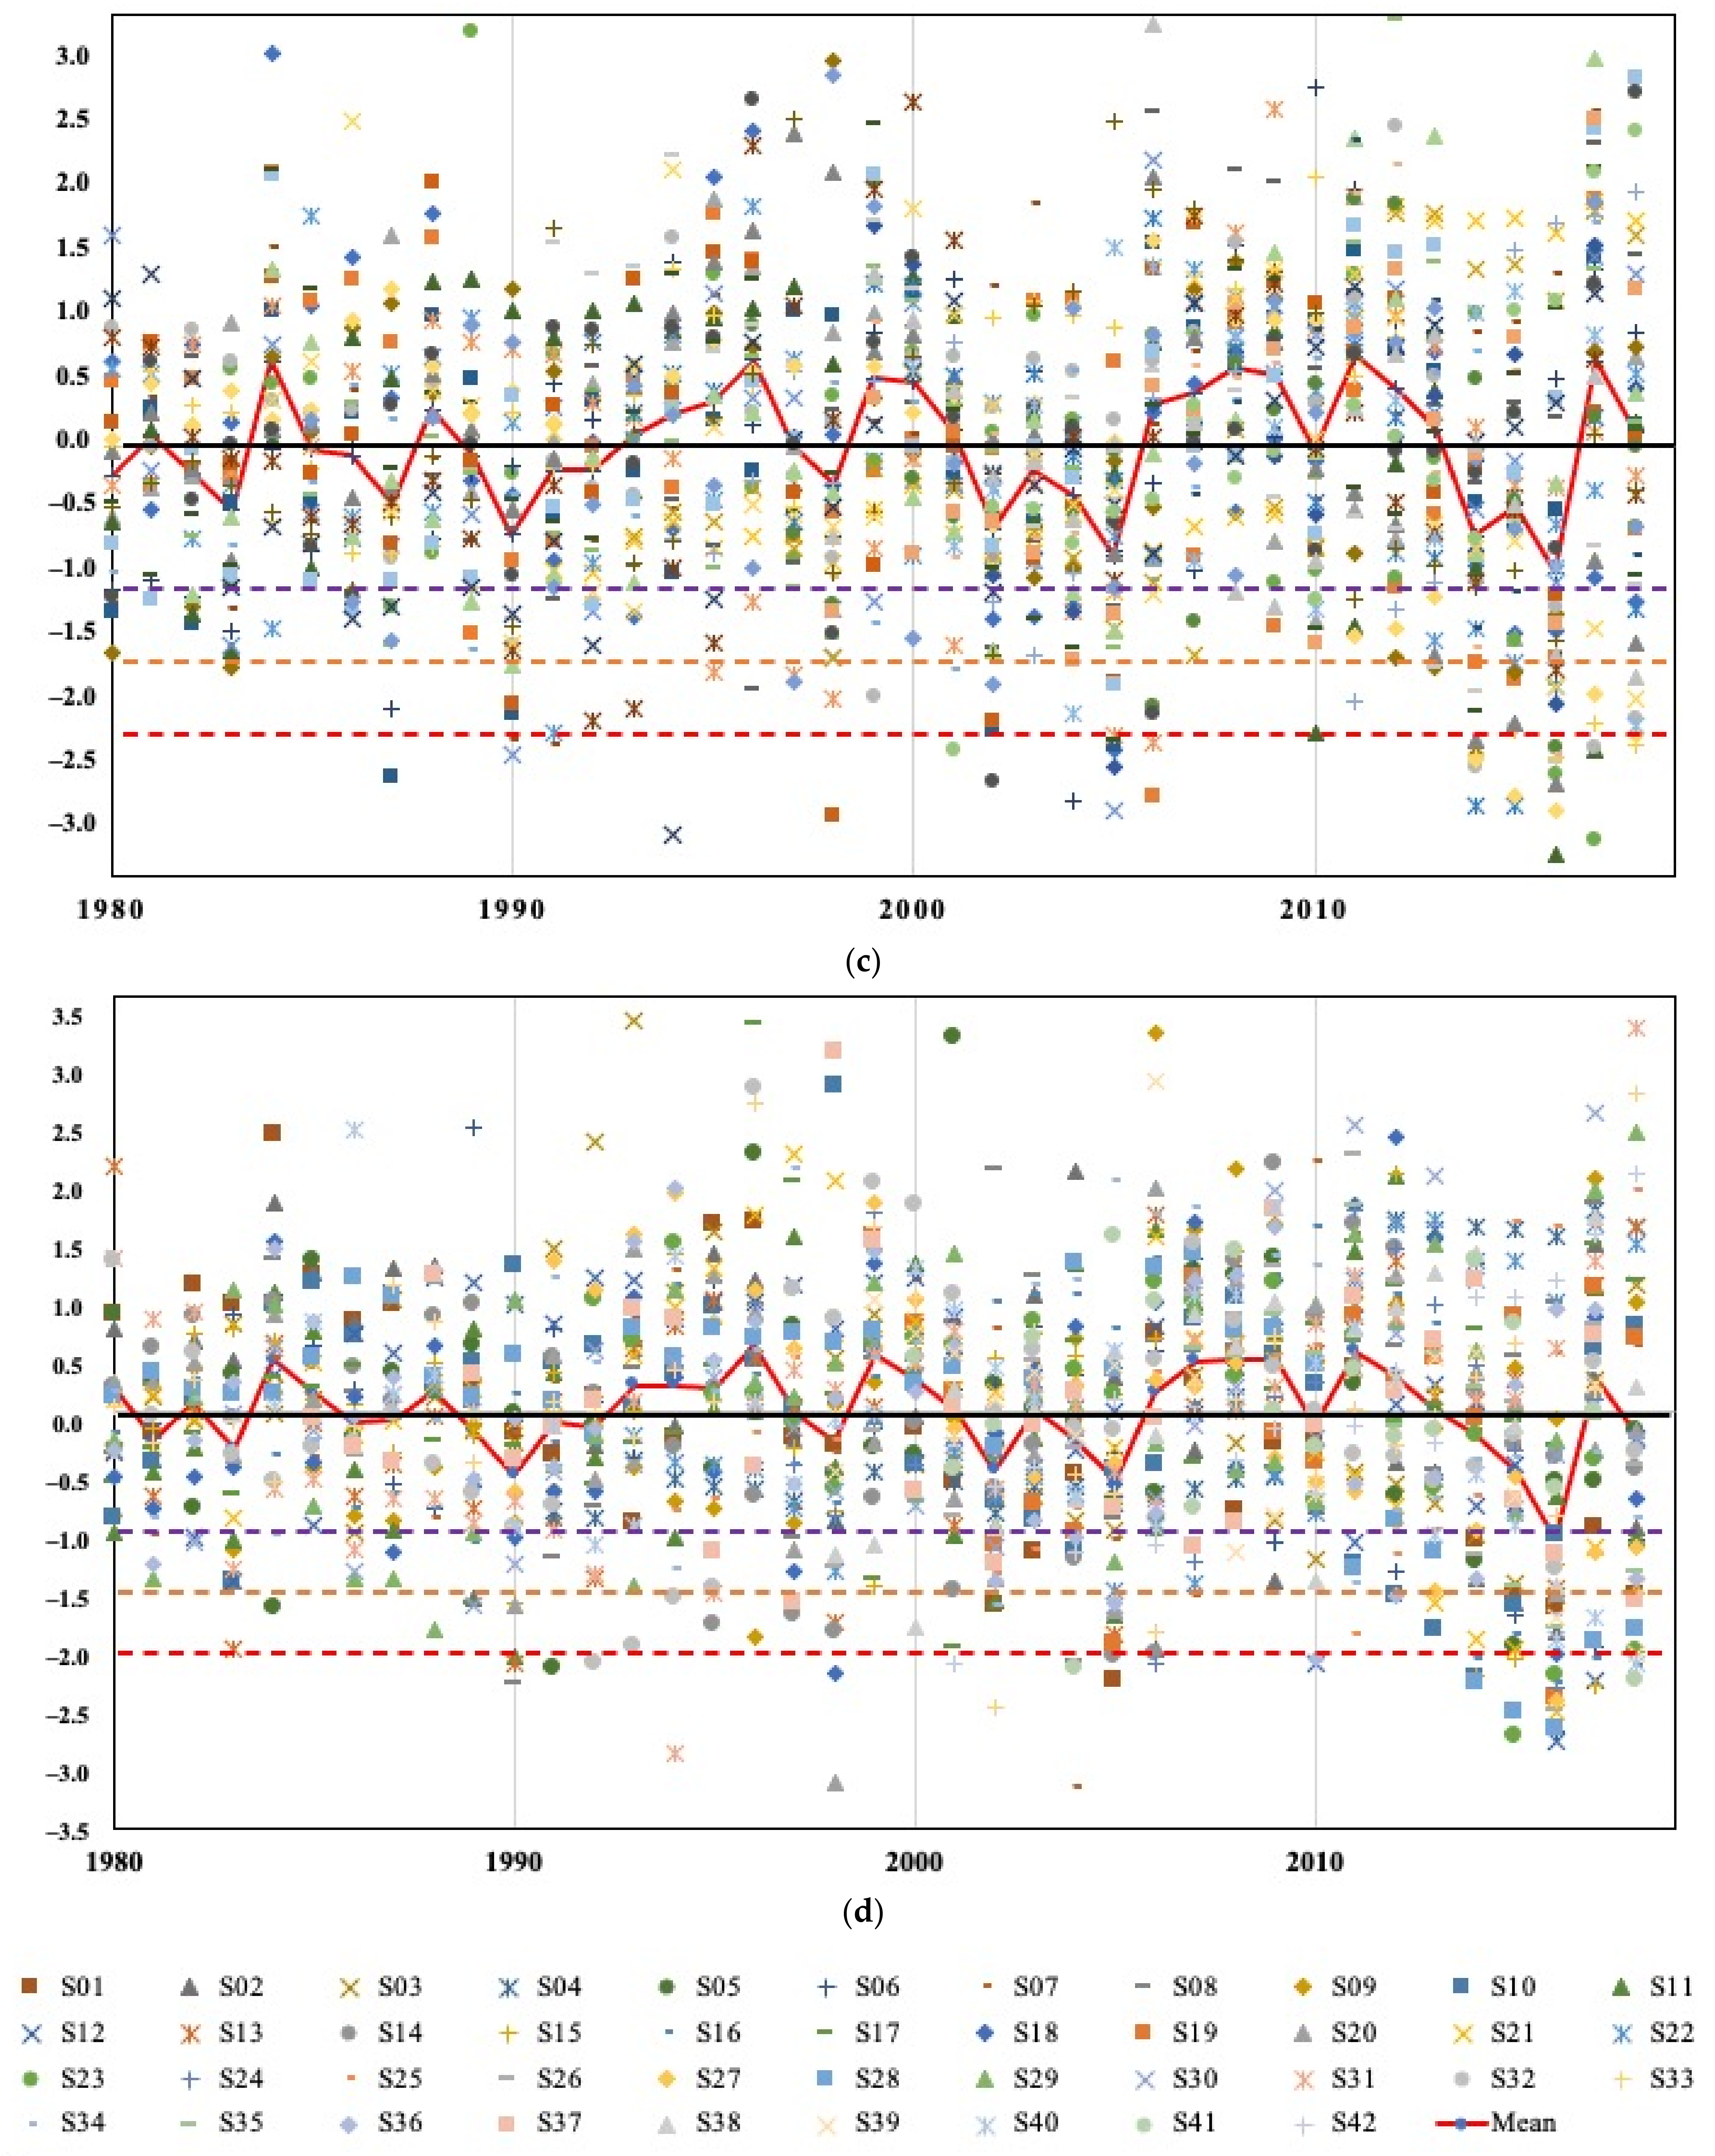
The temporal drought index (SDI) for each station for 40 years in Peninsular Malaysia is shown in Figure 8. From the apparent temporal distributions, it can be seen that several stations have exceeded the threshold for extreme drought (SDI-2).
The SDI for several periods shows a significant variation in the frequency and duration of drought episodes when the period is extended further. When compared to a 12-month SDI (SDI-12), the 3-month SDI (SDI-3) shows more frequent drought episodes with shorter durations, while the 12-month SDI (SDI-3) shows a more consistent and longer absence of streamflow periods. Intensities on smaller time scales are more variable, especially in the 3-month SDI where a greater variation in events below −1.0 is observed, which is most likely a response to climate.
The temporal distribution of hydrological drought from 1997 to 1998 and 2015 to 2016 showed similar temporal behaviour at all stations (Figure 8). According to the results of this analysis, 2015 was one of the most severe hydrological droughts ever recorded in Peninsular Malaysia. This pattern can also be seen in Figure 8 and Figure 9, which were divided into watershed groups (spatial distribution) and hydrological drought categories (moderate, severe and extreme). It is important to note that global climate phenomena such as El Niño, La Niña and ocean variability have a direct impact on the streamflow regime. According to Zaroug [61], El Niño favours lower precipitation, while La Niña favours lower temperatures, which has a significant impact on the hydrological pattern of Peninsular Malaysia.
In 1997/1998, there was a major El Niño event that affected the entire country. Despite its moderate intensity, the 1994/1995 El Niño event had a significant impact on several districts in Peninsular Malaysia. During the study period, 2014/2015 was undoubtedly the worst drought year. As mentioned earlier, drought is an event that cannot be avoided, so preparations need to be made all the time. Therefore, continuous drought monitoring, and the use of the annual drought classification system can be an effective tool for planning and managing the water resources of the basin.
3.4. Spatial Distribution for Hydrological Drought Occurrence Events
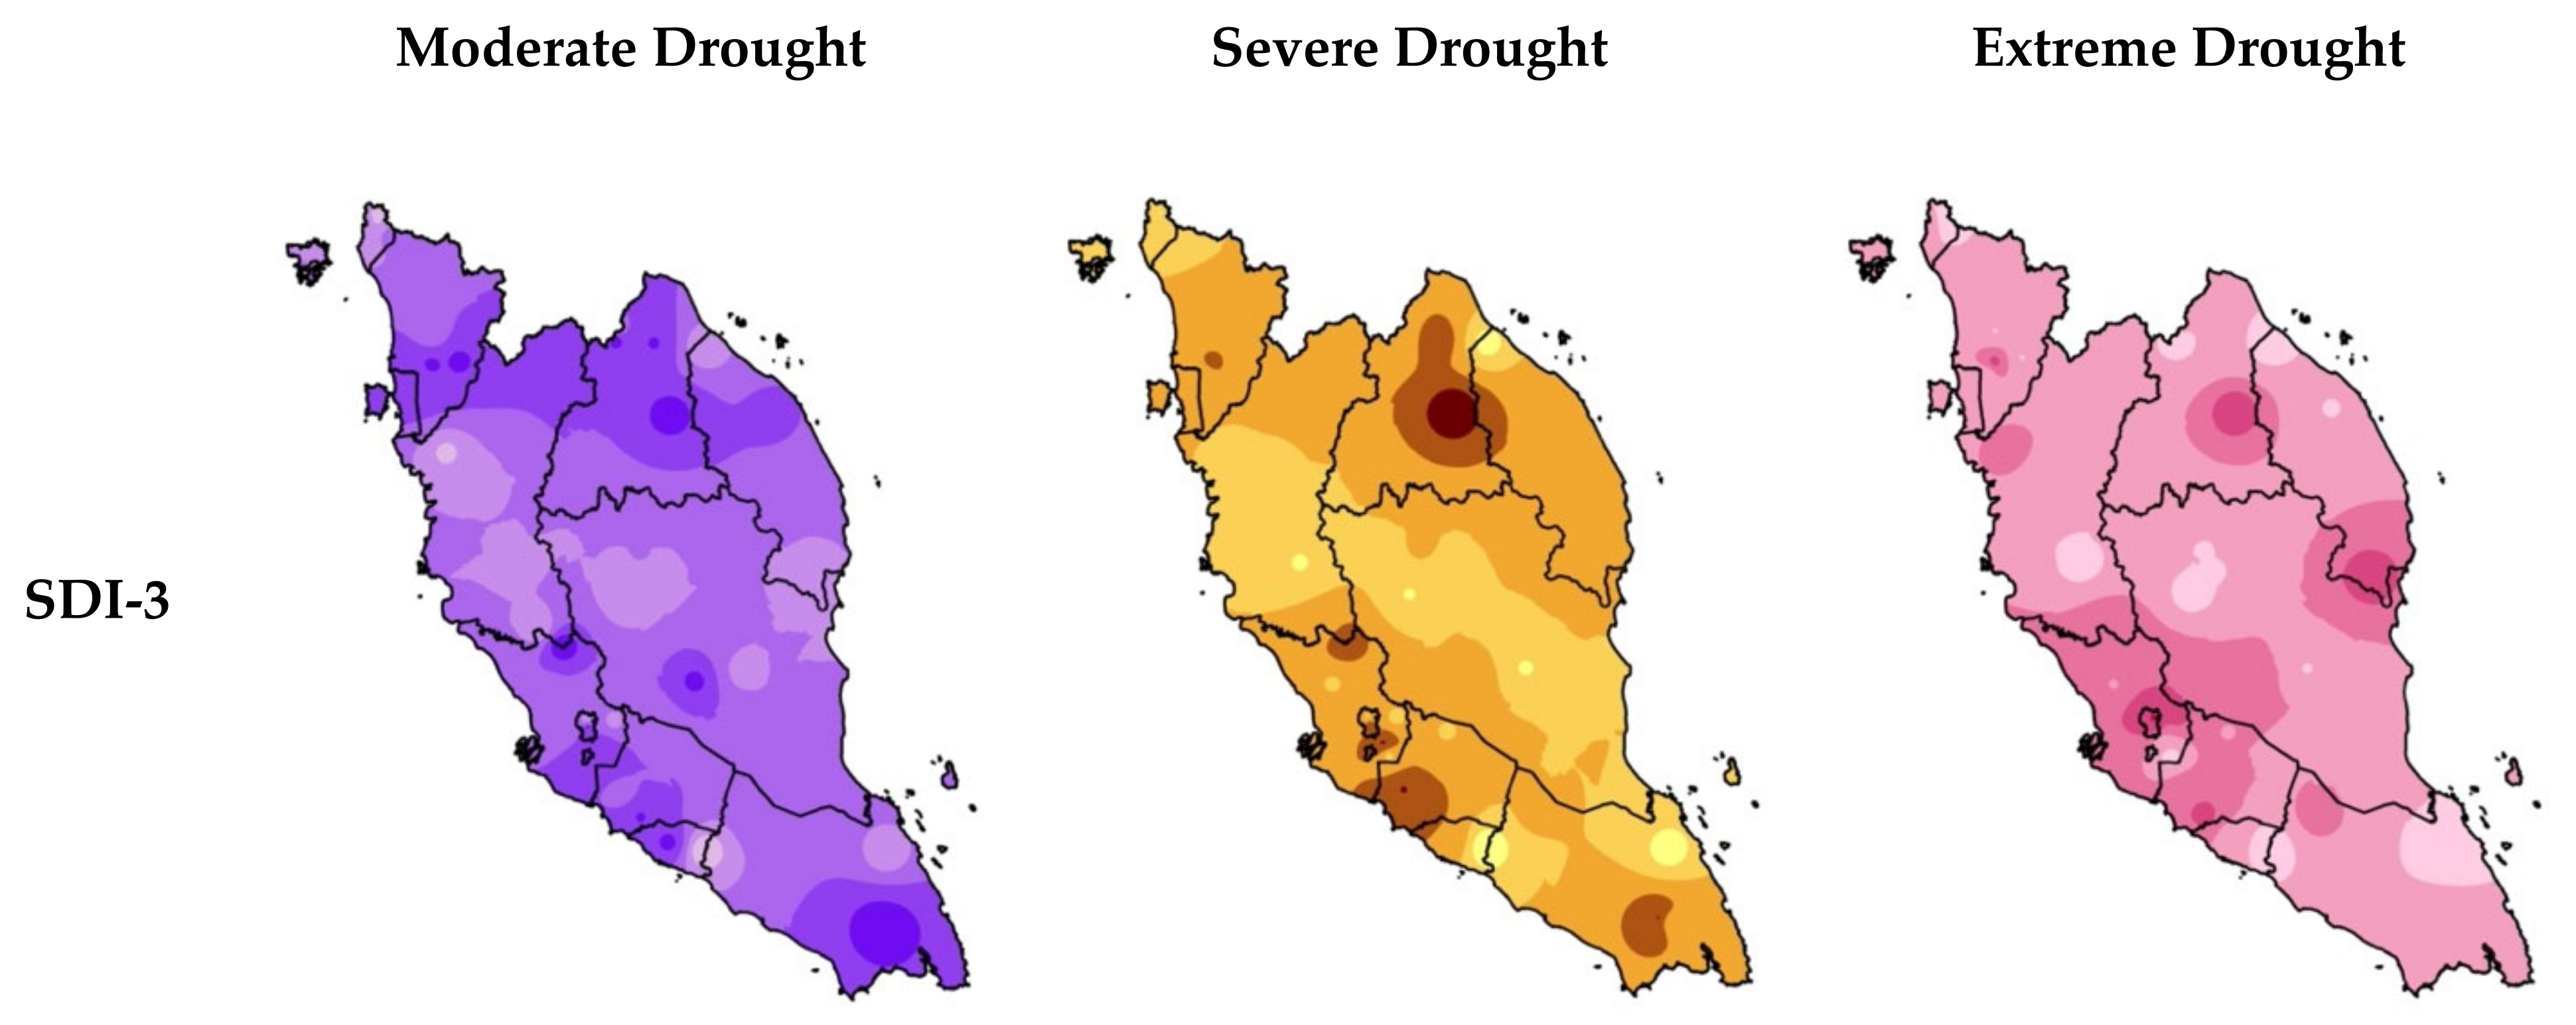
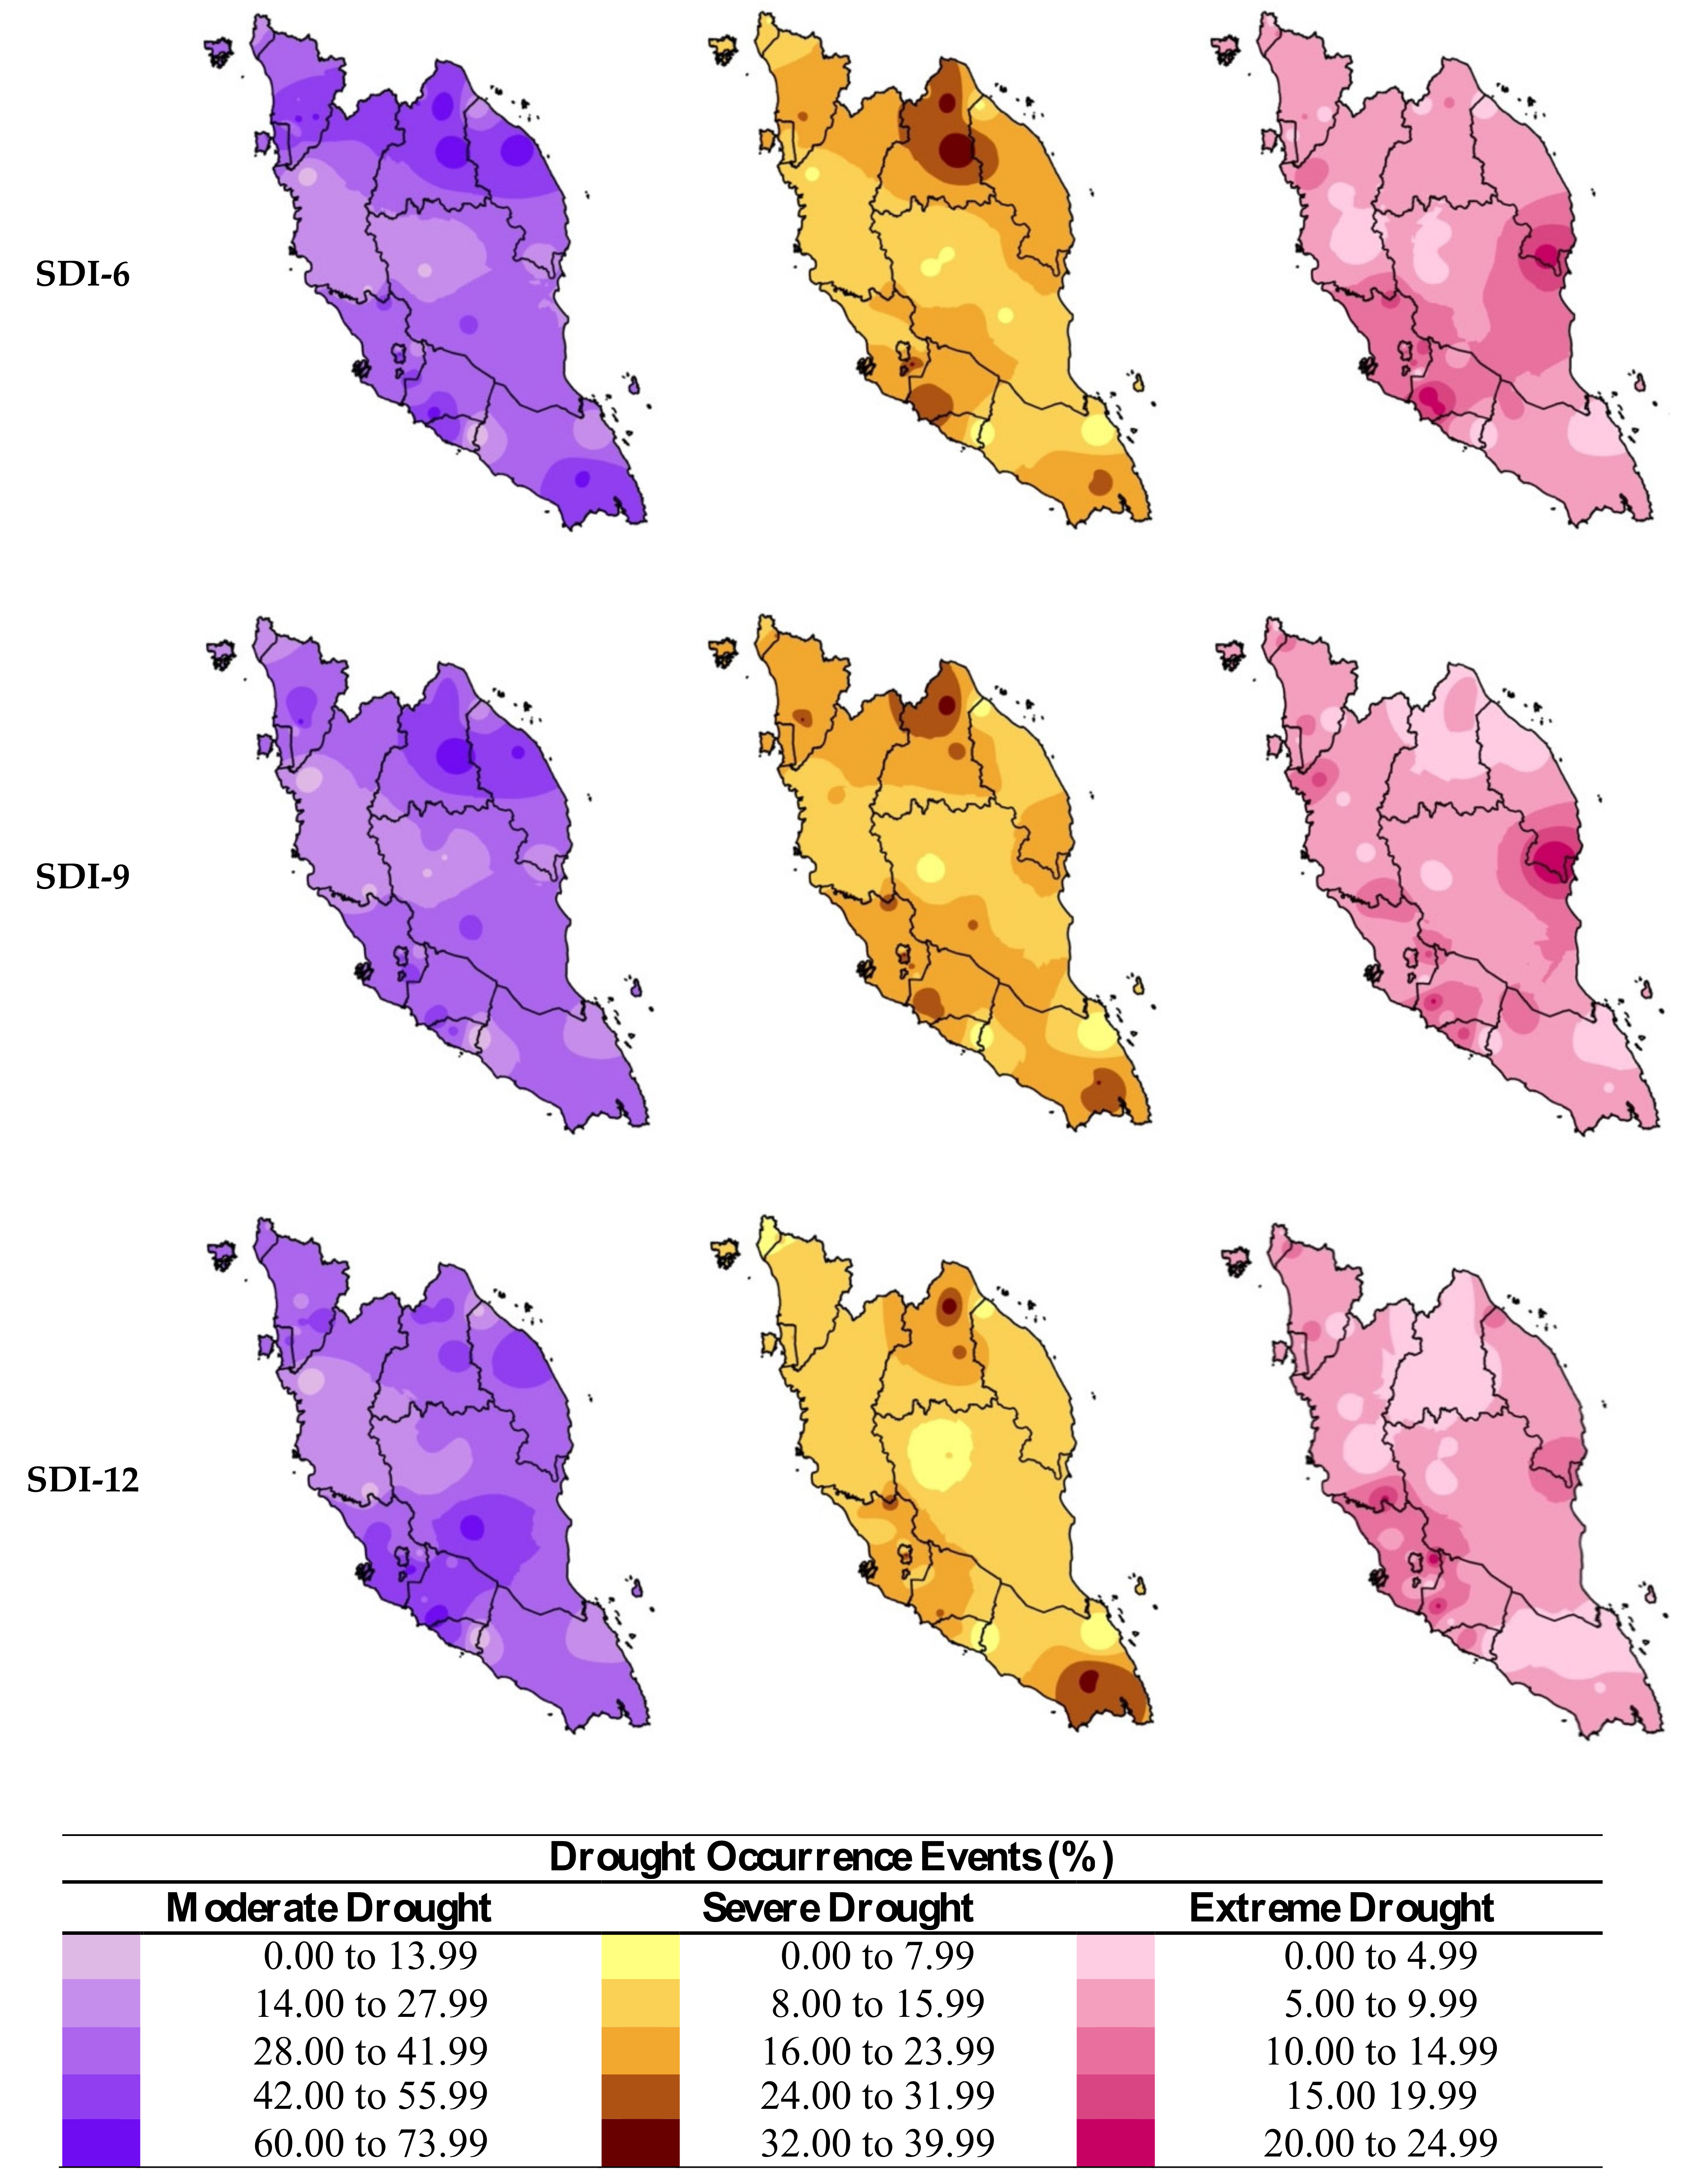
For three-, six-, nine- and twelve-month time scales, an inverse distance weighting (IDW) approach was used to generate hydrological drought maps and visualise the spatial distribution of drought occurrence over Peninsular Malaysia. Figure 9 and Figure 10 show the spatial distribution of hydrological drought events (%) and mean severity for Peninsular Malaysia.
The number of drought months from moderate to extreme drought (SDI < −1) in the total months of the 40 years was used to calculate the occurrence of drought events of the different hydrological drought categories. The spatial map shows the SDI values at different time scales indicating the presence of hydrological drought. From this map, it can be seen how the area evolves towards moderate drought as the time scale increases.
As it can be seen in Figure 9, moderate and severe droughts occur more frequently in Peninsular Malaysia, while extreme droughts occur less frequently. The shift in drought frequency on the time scale is the most striking feature of drought. On a longer timescale, droughts occur more frequently and last for shorter periods. The frequency of droughts decreases while drought duration increases on a time scale of three and six months.
The SDI-3 had the highest percentage of drought months with a value of 67.4% of the total months. Figure 8 shows that moderate drought events were observed in the southern regions of the west coast of Peninsular Malaysia for SDI-3 and SDI-6, respectively. While moderate drought events are more concentrated in the north-eastern region for SDI-9 and in the south-western region for SDI-12. The spatial map shows that severe drought events occurred in the northeast and south of Peninsular Malaysia at all time scales, with the highest percentage of drought events at about 40%.
The trend of extreme drought increased towards the southeast to southwest. Hydrological drought events tended to extend from the east coast regions to the southern west coast regions of Peninsular Malaysia. As most of the land in these regions is used for agriculture, the southern west coast regions may be more prone to drought events than the other regions. The percentage of drought events with moderate drought is higher than the other drought categories. Moderate drought events of more than 67% were recorded for SDI-3, followed by SDI-6 (45.9%). For severe drought category, the highest percentage of 40% was recorded for SDI-3, SDI-6 (30%), SDI-9 and SDI-12, with more than 24%. However, the percentage of occurrence of extreme drought is the highest (25.8%) for SDI-3 and is 17.4% for SDI-6. The percentage of drought events is 15% for both SDI-9 and SDI-12.
3.5. Spatial Distribution for Hydrological Drought Severity
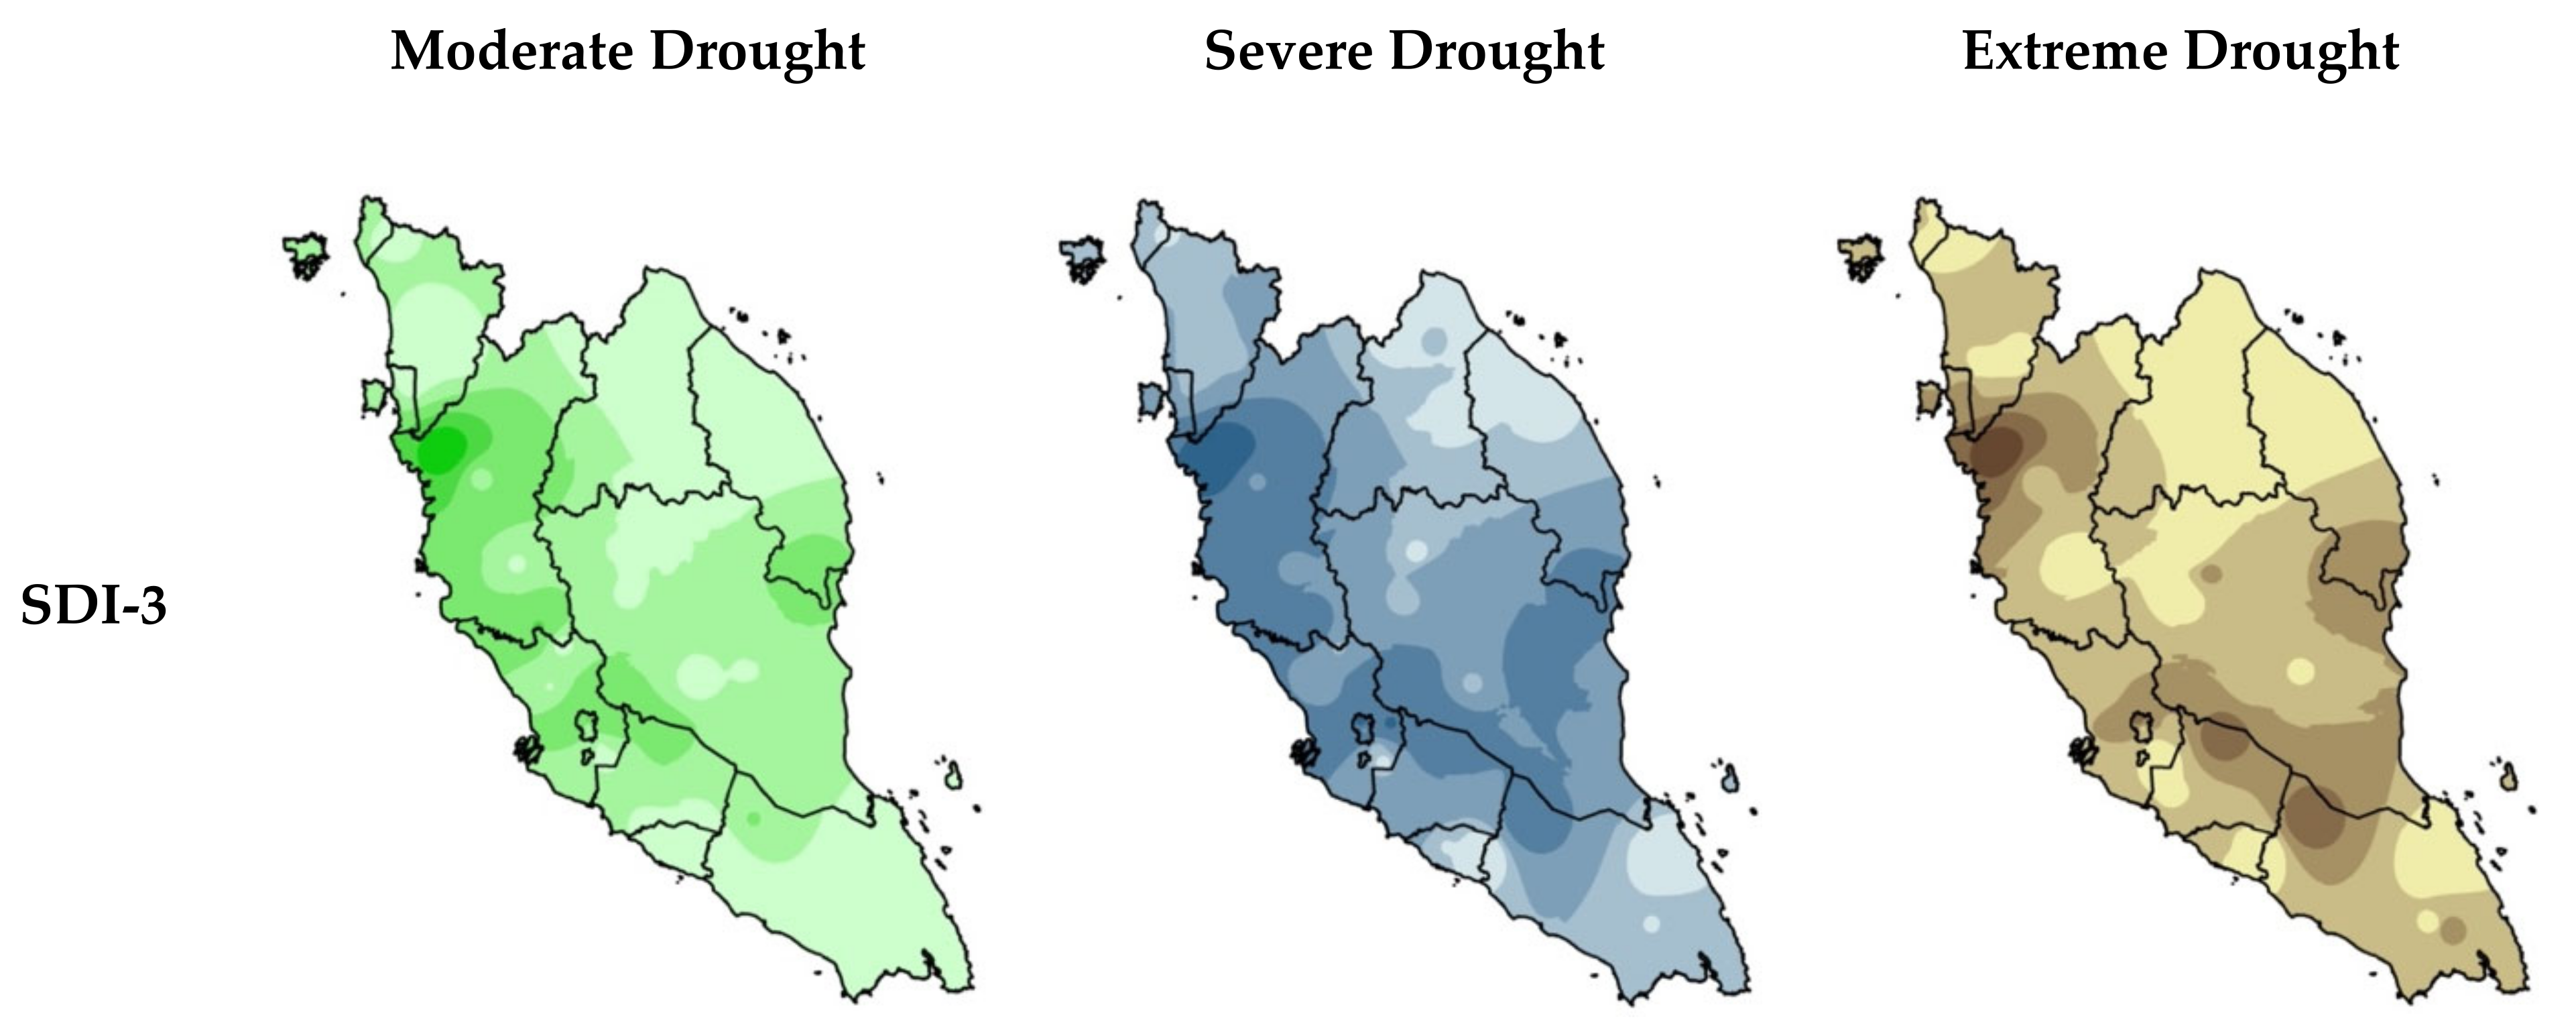
The severity of hydrological drought can vary considerably depending on the topographical, lithological, and administrative characteristics of the catchments. Figure 10 illustrates the spatial distribution of average severity for different drought categories (moderate, severe and extreme) on a 3-, 6-, 9- and 12-month time scale.
The spatial distribution of drought categories based on SDI-3, SDI-6, SDI-9 and SDI-12 shows that moderate droughts tend to occur in the northwest and northeast of the study area. Interestingly, this pattern also holds for severe drought. Strikingly, extreme drought is more frequent and severe in the southeast and south of Peninsular Malaysia, but with a random distribution pattern. In all periods, moderate droughts are about two to three times more frequent than severe and extreme droughts. The north-western region has the highest average drought severity scores on the SDI-12 (moderate drought, 264.62).
Spatially, the SDI results for 3- and 6-month periods show that severe and extreme droughts are more common in the north-western and south-eastern regions of Peninsular Malaysia. Longer-term (9- to 12-month) SDI data, on the other hand, show that such droughts are more frequent in the north-western and south-western regions and in the south of Peninsular Malaysia.
We found that drought was mainly concentrated in the northwest and southwest of Peninsular Malaysia at the beginning of the study period. In addition, the short-term (3 to 6 months) drought episodes were distributed throughout Peninsular Malaysia. The spatial analysis of the drought revealed that the area is likely to experience unpredictable drought events at different time scales. Therefore, the use of multiple time scales in hydrological assessment of droughts is crucial to help policy makers develop realistic local drought strategies.
3.6. Hydrological Drought Risk Assessment
The drought risk assessment approach can identify and compare drought risk across regions to minimize and mitigate the negative effects of drought hazards. The hydrological drought risk index (HDRI) is calculated using hydrological and socioeconomic data by multiplying the hydrological drought hazard index (HDHI) and the hydrological drought vulnerability index (HDVI). Table 4 summarises the HDHI, HDVI and HDRI scores and drought class to assess hydrological drought risk for Peninsular Malaysia’s regions.
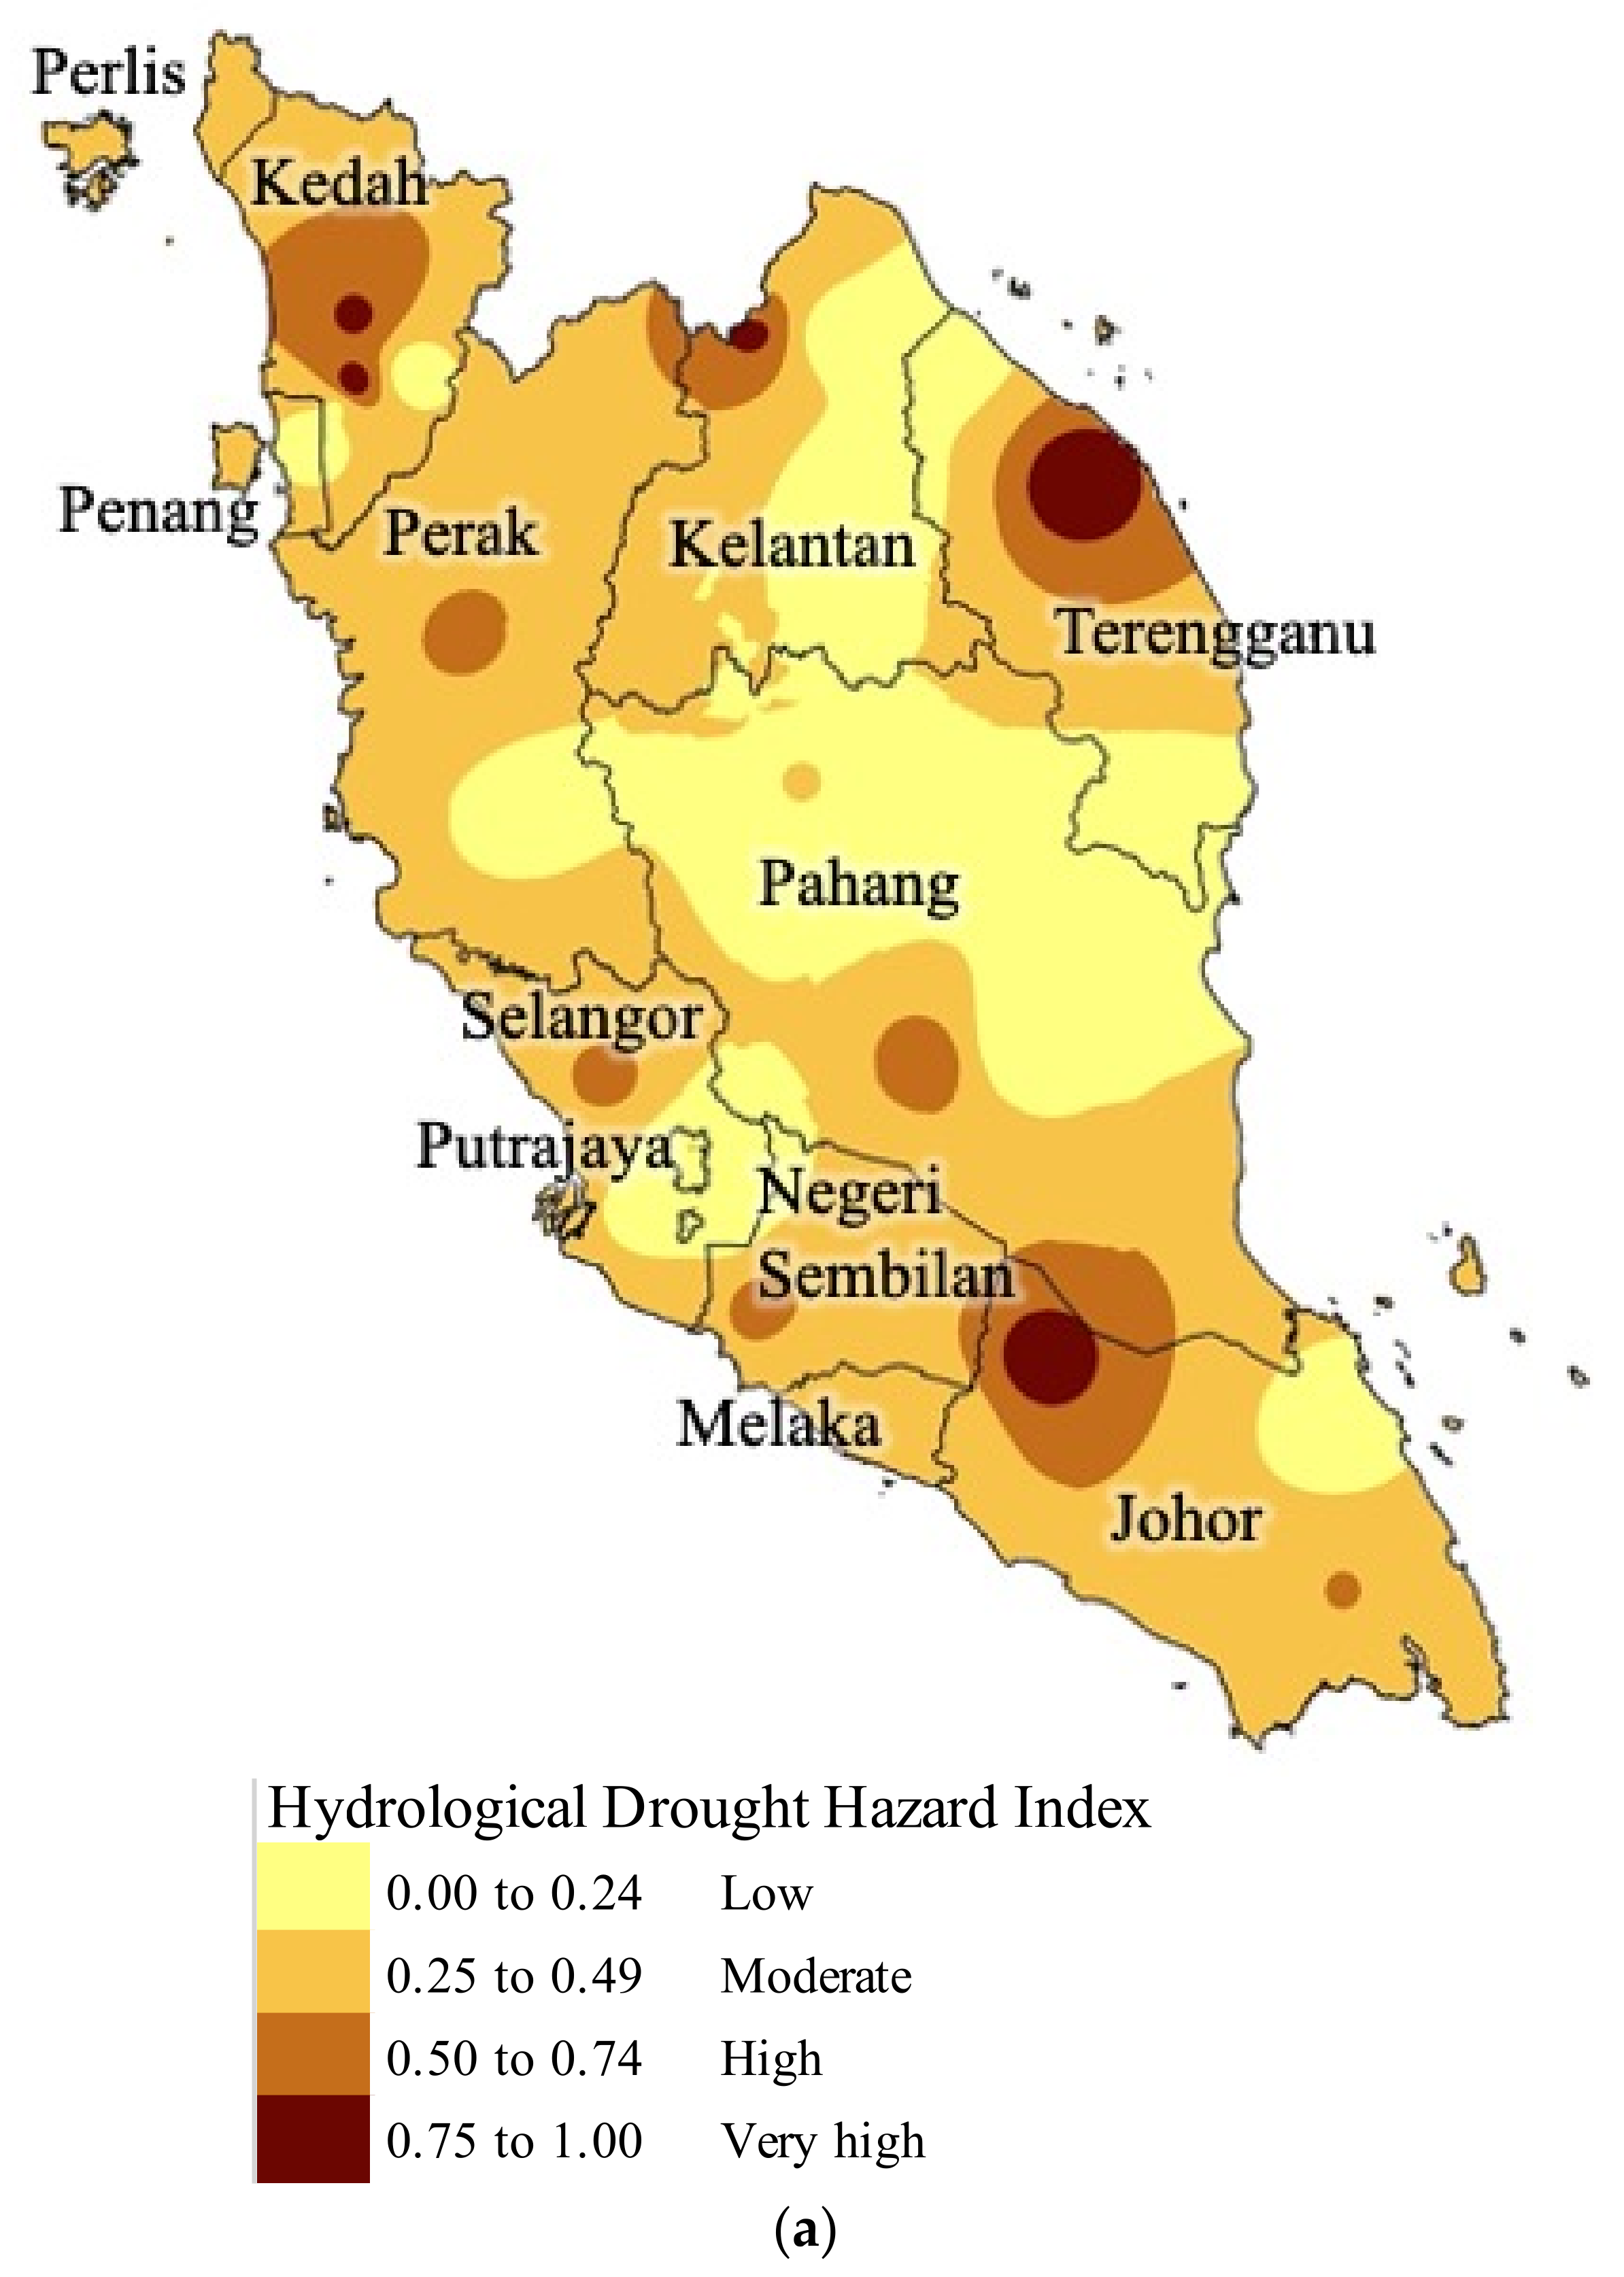
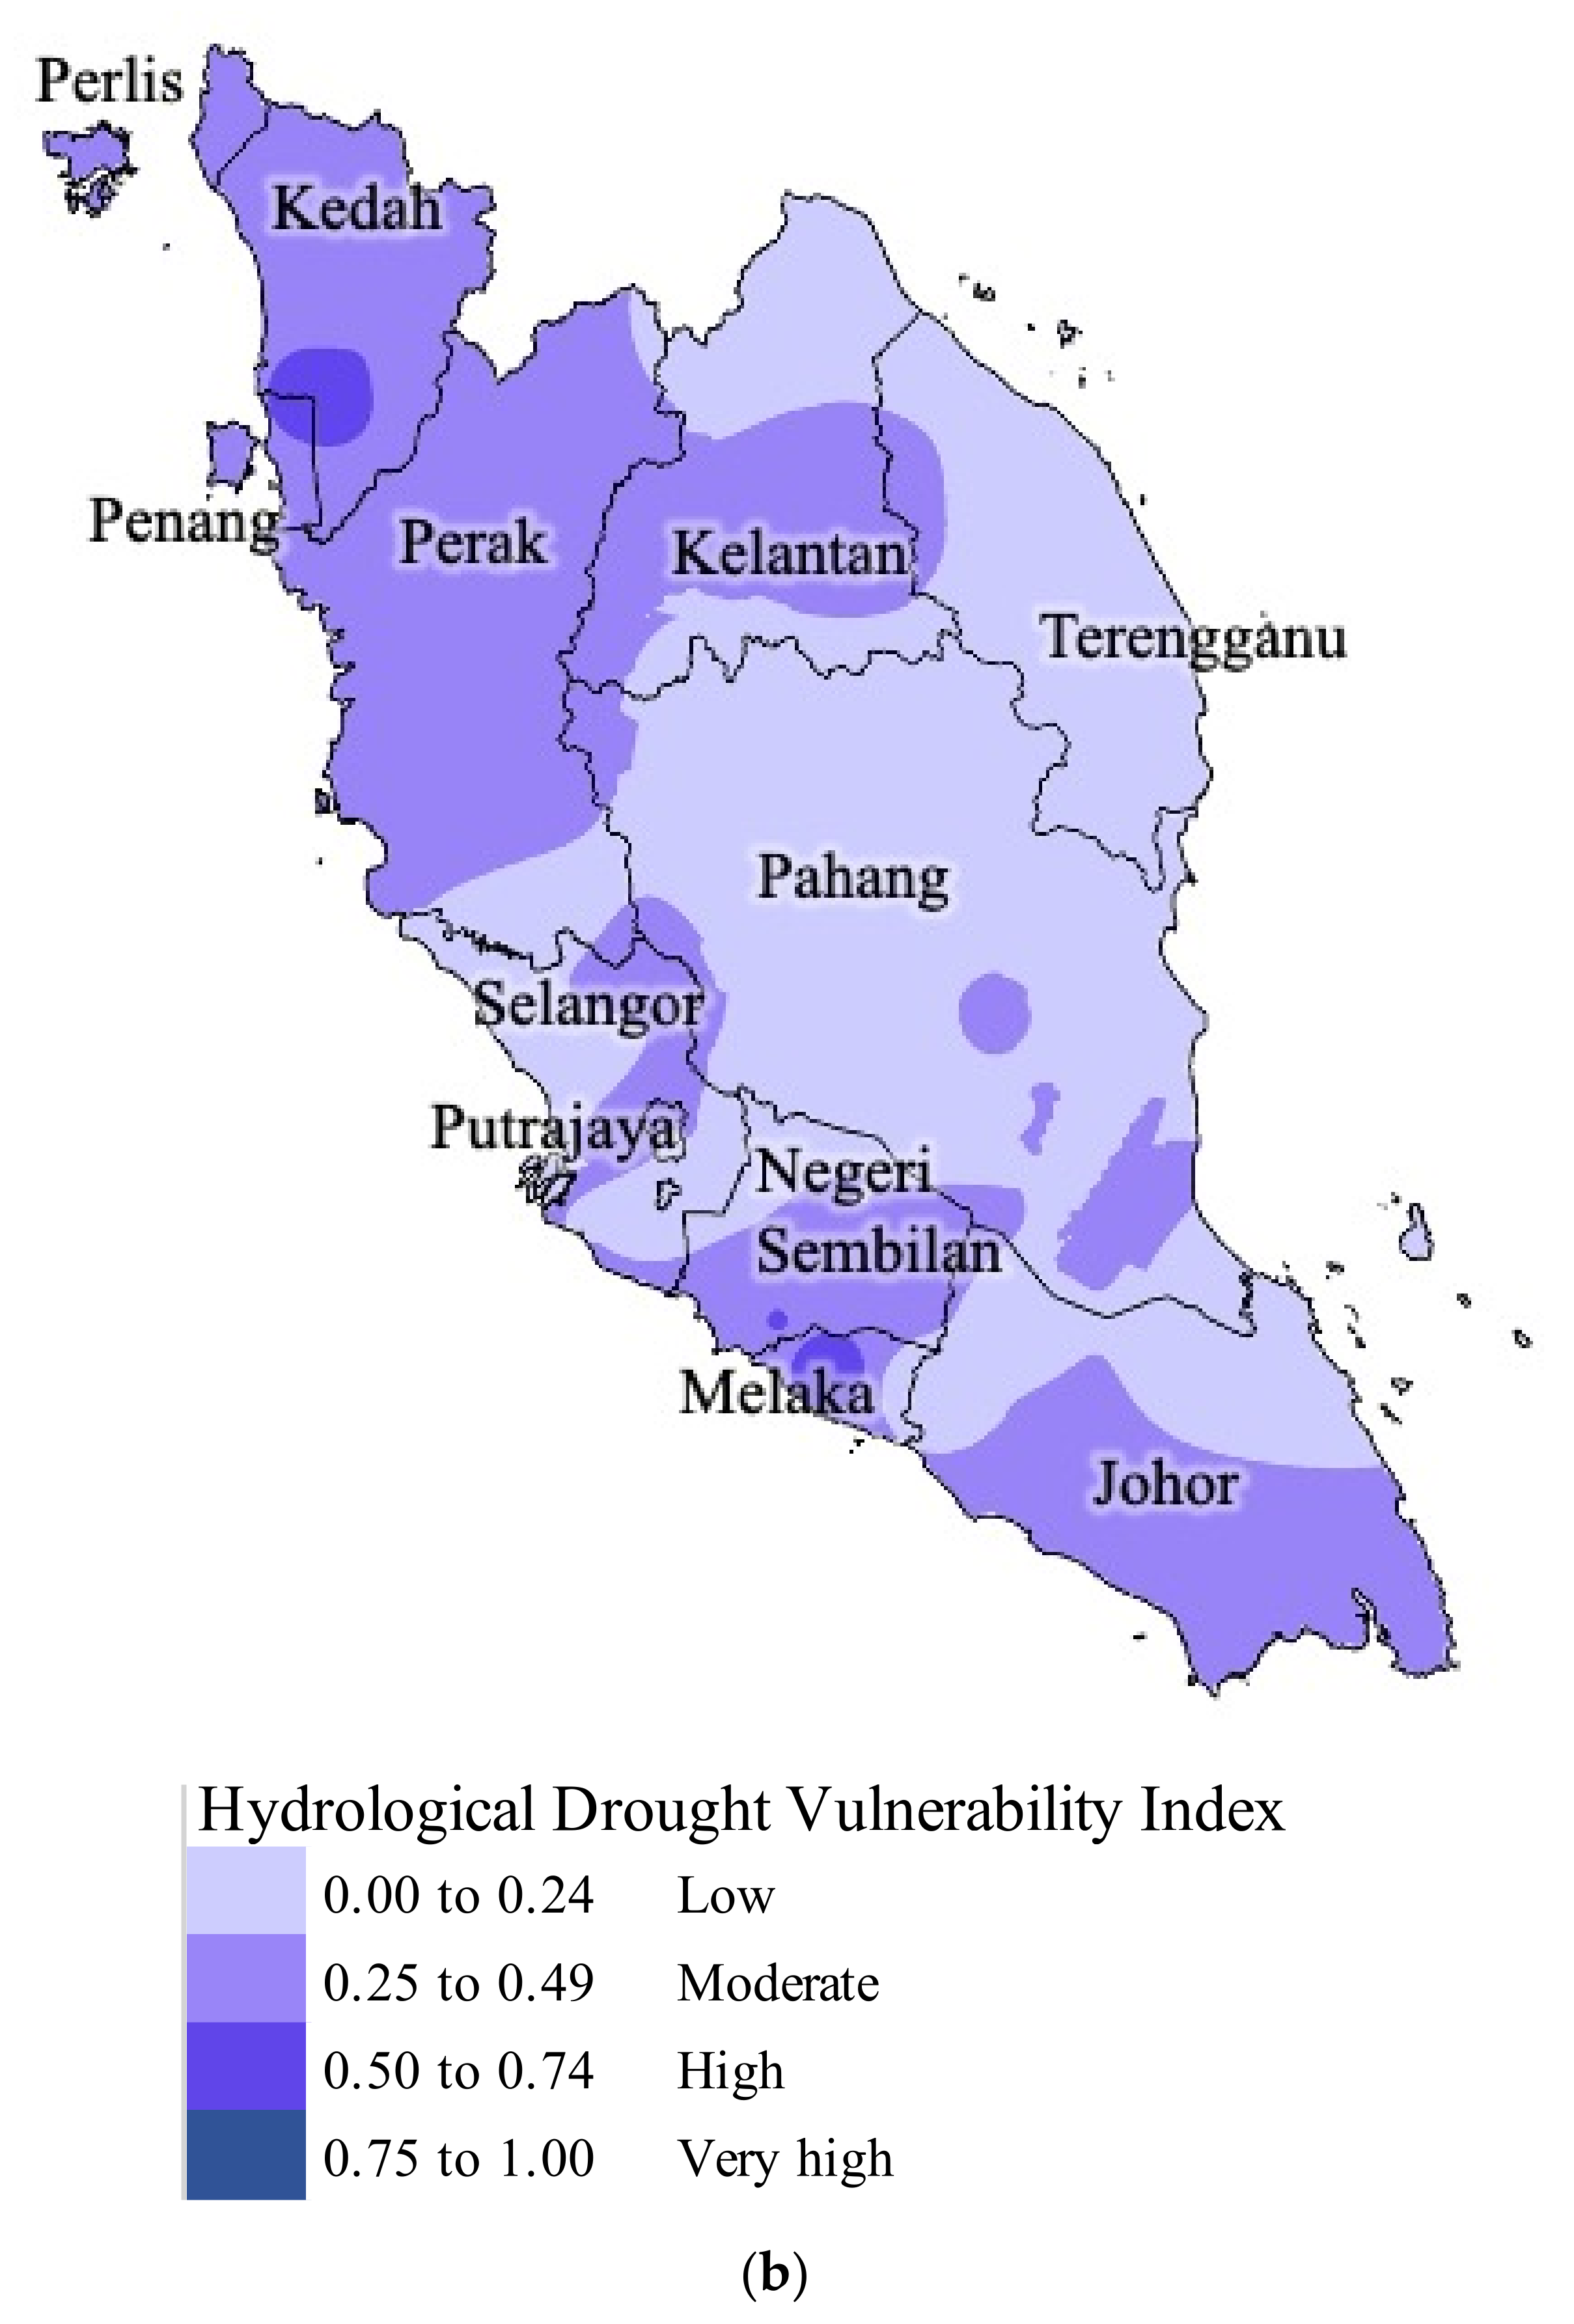
When describing vulnerability, a measure of sensitivity or resilience to the impacts of natural disasters is often used [62,63]. The link between climate change impacts on water resources and vulnerability to drought has been widely studied, but scientific assessments of vulnerability often neglect socio-economic factors [32,64,65]. Therefore, we introduced key socio-economic factors to quantify drought risk to fill the gaps in regional spatial assessments. The hydrological drought vulnerability, susceptibility and risk maps developed for Peninsular Malaysia help to determine the spatial distribution of key drought risks. Figure 11 shows a hydrological drought vulnerability, susceptibility and risk map developed after acquiring four drought classes.
Anthropogenic activities influence land surface processes, climate and, ultimately, water supply [66,67,68]. For example, land surface changes can cause drought by affecting hydrological processes such as evaporation, infiltration, water storage and surface runoff. To determine the anthropogenic influence on drought, both hydrologically induced and human-induced components need to be analysed. Due to the attractive geographical and climatic conditions, agricultural industries and urban populations have settled in these regions [69]. As a result, there is a close link between droughts and socio-economic impacts in densely populated areas.
The HDVI and HDHI have a significant impact on the assessment of HDRI. This drought risk assessment approach can help identify drought risk in different regions to reduce and mitigate the negative impacts of drought risks. The drought vulnerability, susceptibility and risk maps produced for the regions of Peninsular Malaysia help to determine the spatial pattern of drought risk indicators.
Based on the SDI analysis, the HDHI map in Figure 11a shows that Jeli, Sungai Petani, Setiu, Segamat and Kemaman have the highest hydrological drought risk. In contrast, three important districts (Sungai Petani, Jasin and Port Dickson) are at extreme risk, as shown in the HDVI maps in Figure 11b. The HDRI map in Figure 11c shows that Sungai Petani has the highest hydrological drought risk when both the HDHI and HDVI are considered. In addition, Kemaman and Jasin are at moderate risk of hydrological drought based on HDRI values. Two districts have moderate drought risk (0.25 < HDRI ≤ 0.50), 35 districts have low hydrological drought risk (0.00 < DRI ≤ 0.25) and four districts have no drought risk (HDRI = 0.00).
Jasin, Kuala Selangor and Sik were classified as extremely vulnerable due to their large agricultural areas, while Sungai Petani, Johor Bahru, Port Dickson and Alor Gajah were classified as extremely vulnerable due to the high population density in these areas. Sungai Petani, Jasin and Port Dickson, on the other hand, were classified as highly vulnerable due to their dense population and large agricultural areas. This vulnerability map can be interpreted in several ways to gain a better understanding of the current vulnerability situation in each region of Peninsular Malaysia.
4. Conclusions
Using the Streamflow Drought Index (SDI), this study has provided a theoretical framework that can increase the country’s resilience to future drought events. From 1978 to 2018, the SDI was used to study the regional and temporal variability of hydrological droughts in Peninsular Malaysia. The SDI analysis of hydrological drought showed that virtually all stations were affected by hydrological drought during the study period. Consequently, the SDI calculations in this study can describe the regional and temporal distribution characteristics of hydrological drought in Peninsular Malaysia at different time scales. Extreme drought events occurred mainly in the last two decades, from 1997 to 1998 and 2001 to 2002, with the driest years being from 2011 to 2018.
The years 1997–1999, 2002 and 2016–2018 were the most important drought years in the catchment, with hydrological drought affecting the entire area. Over the periods of 3 to 12 months, hydrological drought episodes occur most frequently in the northeast and southeast of Peninsular Malaysia, with some exceptions in the northwest and southwest. Most drought episodes occur rather infrequently, with fewer hydrological drought episodes in Peninsular Malaysia. Most places in the northeast and southeast of Peninsular Malaysia have a relatively high frequency, especially in the central and southern regions.
This study found that assessing drought characteristics at the catchment level can provide more information than assessing them at the regional or district level. Drought problems were thoroughly assessed using a variety of indicators as part of a drought mitigation strategy. Drought risk can be mitigated in high-risk regions through effective water resource management. It is then recommended that policy makers develop appropriate strategies to protect existing water resources in high-risk regions. The spatial pattern of drought risk is assessed in this paper by integrating hazard and vulnerability for regions in Peninsular Malaysia.
Apart from improving understanding of the hazard and the factors that influence vulnerability, there are calls for increased attention to prediction/early warning activities, such as risk assessment, that could improve drought preparedness and response, as well as future impacts, in order to mitigate the serious consequences of drought.
As a result, the historical frequency, danger and forms of drought in Peninsular Malaysia remain poorly studied. However, such geographical and temporal drought characterisation is critical because drought risk management methods must be founded on a firm scientific understanding of the role of climate, hydrology and human water demand in drought evolution and spread.
Indeed, insufficient information about drought hazards would result in ineffective and ineffective mitigation strategies. For instance, our data indicate that Sungai Petani, Kedah has the greatest area with a high HDRI, owing to the region’s heavy agricultural reliance and impoverished socioeconomic conditions. As a result, this region’s drought response strategy should be a priority.
Composite drought risk indices are becoming widely acknowledged as a strong tool for drought risk management, since it frequently appears to be easier for the public to comprehend composite indicators than it is to discern common trends across numerous individual indicators. However, a composite indicator may send false policy messages, as it may induce policymakers to draw oversimplified policy conclusions. To mitigate this risk, it is critical to acknowledge an underlying assumption established throughout the HDRI process when implementing the results. In this study, the indicators were chosen rather subjectively with the goal of focusing on drought risk assessment in the agriculture sector. Additionally, when a region-averaged figure is used, it is assumed that drought affects all sections of the same province equally. In actuality, each province may contain additional administrative divisions, such as districts and communes, that may experience varying degrees of drought impact.
Drought vulnerability is assessed using two socio-economic factors related to water demand and supply. To examine the spatial variability of drought, drought vulnerability, susceptibility and risk maps are produced using HDHI, HDVI and HDRI. As far as we know, previous research has not estimated hydrological drought risk based on HDVI and HDHI for Peninsular Malaysia. Therefore, this technique has the potential to provide useful information to improve drought management in Malaysia. In addition, the conceptual drought risk model based on actual socio-economic characteristics can help reduce the impact of drought in Peninsular Malaysia. Overall, this database can be used to identify regions that are most affected by drought and to provide a relative assessment of the regions. The composite HDRI proposed here tackles the inadequacies of current drought assessment approaches in Peninsular Malaysia, which are primarily concerned with drought hazard monitoring.
The application’s primary findings were hydrological drought risk maps for Peninsular Malaysia, which aided in the understanding of the distribution characteristics of prior hydrological drought episodes and risk of loss in various regions. This work created and evaluated a quantitative method for estimating the probability of regional hydrological drought. However, the findings were based on historical data and did not take into account the future effects of climate change. As a result, forecasting future dynamic drought risk and conducting evaluations are critical components of this study’s ongoing effort.
Author Contributions
Conceptualization, H.H.H., S.F.M.R., N.S.M. and A.A.; methodology, H.H.H., S.F.M.R. and N.S.M.; validation, H.H.H., S.F.M.R., N.S.M. and A.A.; formal analysis, H.H.H. and S.F.M.R.; investigation, H.H.H., S.F.M.R. and N.S.M.; resources, H.H.H.; data curation, H.H.H.; writing—original draft preparation, H.H.H.; writing—review and editing, H.H.H., S.F.M.R., N.S.M. and A.A.; visualization, H.H.H. and S.F.M.R.; supervision, S.F.M.R., N.S.M. and A.A.; funding acquisition, S.F.M.R. All authors have read and agreed to the published version of the manuscript.
Funding
This research was funded by Ministry of Education Malaysia grant number [FRGS/1/2018/TK01/UKM/02/2] and University Kebangsaan Malaysia.
Acknowledgments
The authors are thankful to the Ministry of Education Malaysia for the financial support of this research through research grant number FRGS/1/2018/TK01/UKM/02/2. The authors would also like to acknowledge their gratitude to the Department of Irrigation and Drainage Malaysia for providing data. We would like to thank the Ministry of Education (MOE) Malaysia and Universiti Kebangsaan Malaysia (UKM) for their support which contributed to the success of this study.
Conflicts of Interest
The authors declare no conflict of interest.
Nomenclature
| Symbol | Definition |
| A% | Percentage area |
| AI | Aridity Index |
| AL | Agricultural Land |
| BFI | Base Flow Index |
| CDF | Cumulative Distribution Function |
| CV | Coefficient of variation |
| g(x) | Gamma PDF |
| HDHS | Hydrological Drought Hazard Score |
| HDRI | Hydrological Drought Risk Index |
| HDVI | Hydrological Drought Vulnerability Index |
| k | Monthly streamflow data (in this case k = 1 for January to March, k = 2 for January to June, k = 3 for January to September and k = 4 for January to December) |
| MAMPU | Malaysian Administrative Modernisation and Management Planning Unit |
| MK | Mann-Kendall test |
| PCI | Precipitation Concentration Index |
| PD | Population density |
| Probability distribution function | |
| Qi | Sen estimator of the slope |
| R | Rating index |
| S | Mann-Kendall test statistic |
| SD | Standard deviation |
| SDI | Streamflow Drought Index |
| SDR | Spatial Distribution Of Rainfall |
| Sk | Skewness |
| SRI | Standardised Runoff Index |
| SSFI | Standardised Streamflow Index |
| W | Weighting index |
| x | Monthly streamflow |
| α | Shape parameter that can be estimated by the maximum likelihood method |
| β | Scale parameter |
| Γ(α) | The gamma function at α |
References
- Frappart, F.; Biancamaria, S.; Normandin, C.; Blarel, F.; Bourrel, L.; Aumont, M.; Azemar, P.; Vu, P.L.; Le Toan, T.; Lubac, B.; et al. Influence of recent climatic events on the surface water storage of the Tonle Sap Lake. Sci. Total Environ. 2018, 636, 1520–1533. [Google Scholar] [CrossRef] [PubMed] [Green Version]
- Tan, M.L.; Chua, V.P.; Li, C.; Brindha, K. Spatiotemporal analysis of hydro-meteorological drought in the Johor River Basin, Malaysia. Theor. Appl. Climatol. 2019, 135, 825–837. [Google Scholar] [CrossRef]
- Bong, C.H.J.; Richard, J. Drought and climate change assessment using Standardized Precipitation Index (SPI) for Sarawak River Basin. J. Water Clim. Chang. 2019, 11, 956–965. [Google Scholar] [CrossRef]
- Luhaim, Z.; Tan, M.L.; Tangang, F.; Zulkafli, Z.; Chun, K.P.; Yusop, Z.; Yaseen, Z.M. Drought variability and characteristics in the muda river basin of malaysia from 1985 to 2019. Atmosphere 2021, 12, 1210. [Google Scholar] [CrossRef]
- Siwar, C.; Ahmed, F.; Begum, R.A. Climate change, agriculture and food security issues: Malaysian perspective. J. Food Agric. Environ. 2013, 11, 1118–1123. [Google Scholar]
- Nashwan, M.S.; Ismail, T.; Ahmed, K. Non-stationary analysis of extreme rainfall in Peninsular Malaysia. J. Sustain. Sci. Manag. 2019, 14, 17–34. [Google Scholar]
- Mahmud, M.R.; Numata, S.; Matsuyama, H.; Hosaka, T.; Hashim, M. Assessment of effective seasonal downscaling of TRMM precipitation data in Peninsular Malaysia. Remote Sens. 2015, 7, 4092–4111. [Google Scholar] [CrossRef] [Green Version]
- Buslima, F.S.; Omar, R.C.; Jamaluddin, T.A.; Taha, H. Flood and flash flood geo-hazards in Malaysia. Int. J. Eng. Technol. 2018, 7, 760–764. [Google Scholar] [CrossRef] [Green Version]
- Hasan, H.H.; Razali, S.F.M.; Muhammad, N.S.; Hamzah, F.M. Assessment of probability distributions and analysis of the minimum storage draft rate in the equatorial region. Nat. Hazards Earth Syst. Sci. 2021, 21, 1–19. [Google Scholar] [CrossRef]
- Syarafina, K.; Mat, S.; Razalia, H.; Ezlin, N.; Basri, A.; Aini, Z. Review on Awareness and Practices in Malaysia Land-Use Planning on Municipal Solid Waste Management. J. Kejuruter. 2021, 33, 503–515. [Google Scholar]
- Ward, G.H. Hydrological indices and triggers, and their application to hydrometeorological monitoring and water management in Texas. Texas Water Dev. Board 2013, 225, 254. [Google Scholar]
- Pathak, A.A.; Channaveerappa; Dodamani, B.M. Comparison of two hydrological drought indices. Perspect. Sci. 2016, 8, 626–628. [Google Scholar] [CrossRef] [Green Version]
- Sun, C.; Zhou, X. Characterizing hydrological drought and water scarcity changes in the future: A case study in the Jinghe River Basin of China. Water 2020, 12, 1605. [Google Scholar] [CrossRef]
- Zhu, N.; Xu, J.; Zeng, G.; Cao, X. Spatiotemporal response of hydrological drought to meteorological drought on multi-time scales concerning endorheic basin. Int. J. Environ. Res. Public Health 2021, 18, 9074. [Google Scholar] [CrossRef]
- Feng, K.; Su, X.; Zhang, G.; Javed, T.; Zhang, Z. Development of a new integrated hydrological drought index (SRGI) and its application in the Heihe River Basin, China. Theor. Appl. Climatol. 2020, 141, 43–59. [Google Scholar] [CrossRef]
- Dehghani, M.; Saghafian, B.; Zargar, M. Probabilistic hydrological drought index forecasting based on meteorological drought index using Archimedean copulas. Hydrol. Res. 2019, 50, 1230–1250. [Google Scholar] [CrossRef]
- Niemeyer, S. New drought indices. Options Méditerr. 2008, 80, 267–274. [Google Scholar] [CrossRef]
- He, Z.; Liang, H.; Yang, Z.; Huang, F.; Zeng, X. Water system characteristics of Karst river basins in South China and their driving mechanisms of hydrological drought. Nat. Hazards 2018, 92, 1155–1178. [Google Scholar] [CrossRef]
- Raje, D.; Mujumdar, P.P. Hydrologic drought prediction under climate change: Uncertainty modeling with Dempster-Shafer and Bayesian approaches. Adv. Water Resour. 2010, 33, 1176–1186. [Google Scholar] [CrossRef]
- Tijdeman, E.; Hannaford, J.; Stahl, K. Human influences on streamflow drought characteristics in England and Wales. Hydrol. Earth Syst. Sci. 2018, 22, 1051–1064. [Google Scholar] [CrossRef] [Green Version]
- Saifee, M.F.; Nischitha, A.S.Y. Hydrological drought analysis using Streamflow Drought Index (SDI)—A case study for Watrak Basin. Int. J. Adv. Sci. Eng. Technol. 2018, 6, 113–116. [Google Scholar]
- Cornel, S.N.; Ioan, I.C. Aspects of the hydrological drought evaluation in the Galbena Valley with streamflow drought index (SDI). Ann. Univ. Oradea Fascicle Environ. Prot. An. 2017, 29, 239–250. [Google Scholar]
- Wambua, R.M. Hydrological Drought Forecasting Using Modified Surface Water Supply Index (SWSI) and Streamflow Drought Index (SDI) in Conjunction with Artificial Neural Networks (ANNs). Int. J. Serv. Sci. Manag. Eng. Technol. 2019, 10, 39–57. [Google Scholar] [CrossRef]
- Erogluer, T.A.; Apaydin, H. Estimation of Drought by Streamflow Drought Index (SDI) and Artificial Neural Networks (ANNs) in Ankara-Nallihan Region. Turk. J. Agric. Food Sci. Technol. 2020, 8, 348–357. [Google Scholar]
- Zhang, T.; Su, X.; Feng, K. The development of a novel nonstationary meteorological and hydrological drought index using the climatic and anthropogenic indices as covariates. Sci. Total Environ. 2021, 786, 147385. [Google Scholar] [CrossRef]
- He, Q.; Fok, H.S.; Chen, Q.; Chun, K.P. Water level reconstruction and prediction based on space-borne sensors: A case study in the Mekong and Yangtze river basins. Sensors 2018, 18, 3076. [Google Scholar] [CrossRef] [Green Version]
- Sur, C.; Kim, D.; Lee, J.H.; Iqbal, M.M.; Choi, M. Hydrological drought assessment of energy-based water deficit index (EWDI) at different geographical regions. Adv. Meteorol. 2019, 2019, 8512727. [Google Scholar] [CrossRef] [Green Version]
- Boudad, B.; Sahbi, H.; Mansouri, I. Analysis of meteorological and hydrological drought based in SPI and SDI index in the Inaouen Basin (Northern Morocco). J. Mater. Environ. Sci. 2018, 9, 219–227. [Google Scholar] [CrossRef]
- Choubin, B.; Solaimani, K.; Rezanezhad, F.; Roshan, M.R.; Malekian, A.; Shamshirband, S. Streamflow regionalization using a similarity approach in ungauged basins: Application of the geo-environmental signatures in the Karkheh River Basin, Iran. Catena 2019, 182, 104128. [Google Scholar] [CrossRef]
- Veettil, A.V.; Mishra, A.K. Multiscale hydrological drought analysis: Role of climate, catchment and morphological variables and associated thresholds. J. Hydrol. 2020, 582, 124533. [Google Scholar] [CrossRef]
- Domínguez-Castro, F.; Vicente-Serrano, S.M.; Tomás-Burguera, M.; Peña-Gallardo, M.; Beguería, S.; El Kenawy, A.; Luna, Y.; Morata, A. High-spatial resolution probability maps of drought duration and magnitude across Spain. Nat. Hazards Earth Syst. Sci. Discuss. 2019, 19, 611–628. [Google Scholar] [CrossRef] [Green Version]
- Carrão, H.; Naumann, G.; Barbosa, P. Mapping global patterns of drought risk: An empirical framework based on sub-national estimates of hazard, exposure and vulnerability. Glob. Environ. Chang. 2016, 39, 108–124. [Google Scholar] [CrossRef]
- Asadieh, B.; Krakauer, N.Y. Global change in streamflow extremes under climate change over the 21st century. Hydrol. Earth Syst. Sci. Discuss. 2017, 21, 5863–5874. [Google Scholar] [CrossRef] [Green Version]
- Zhong, S.; Wang, C.; Yang, Y.; Huang, Q. Risk assessment of drought in Yun-Gui-Guang of China jointly using the Standardized Precipitation Index and vulnerability curves. Geomat. Nat. Hazards Risk 2018, 9, 892–918. [Google Scholar] [CrossRef]
- Harisuseno, D. Comparative study of meteorological and hydrological drought characteristics in the Pekalen River basin, East Java, Indonesia. J. Water Land Dev. 2020, 45, 19–41. [Google Scholar] [CrossRef]
- Mukherjee, S.; Mishra, A.; Trenberth, K.E. Climate Change and Drought: A Perspective on Drought Indices. Curr. Clim. Chang. Rep. 2018, 4, 145–163. [Google Scholar] [CrossRef]
- Frank, A.; Armenski, T.; Gocic, M.; Popov, S.; Popovic, L.; Trajkovic, S. Influence of mathematical and physical background of drought indices on their complementarity and drought recognition ability. Atmos. Res. 2017, 194, 268–280. [Google Scholar] [CrossRef]
- Azadi, H.; Keramati, P.; Taheri, F.; Rafiaani, P.; Teklemariam, D.; Gebrehiwot, K.; Hosseininia, G.; Van Passel, S.; Lebailly, P.; Witlox, F. Agricultural land conversion: Reviewing drought impacts and coping strategies. Int. J. Disaster Risk Reduct. 2018, 31, 184–195. [Google Scholar] [CrossRef]
- Yang, Y.; Gan, T.Y.; Tan, X. Spatiotemporal changes of drought characteristics and their dynamic drivers in Canada. Atmos. Res. 2020, 232, 104695. [Google Scholar] [CrossRef]
- Nashwan, M.S.; Shahid, S.; Chung, E.S.; Ahmed, K.; Song, Y.H. Development of climate-based index for hydrologic hazard susceptibility. Sustainability 2018, 10, 2182. [Google Scholar] [CrossRef] [Green Version]
- Xiang, Y.; Wang, Y.; Chen, Y.; Bai, Y.; Zhang, L.; Zhang, Q. Hydrological drought risk assessment using a multidimensional copula function approach in Arid Inland Basins, China. Water 2020, 12, 1888. [Google Scholar] [CrossRef]
- Wambua, R.M.; Mutua, B.M.; Raude, J.M. Characterization of Temporal and Spatial Drought Risk Events Using Surface Water Supply Index (SWSI) in a Tropical River Basin. MOJ Civ. Eng. 2017, 2, 43–50. [Google Scholar] [CrossRef] [Green Version]
- Kalura, P.; Pandey, A.; Chowdary, V.M.; Raju, P.V. Assessment of Hydrological Drought Vulnerability using Geospatial Techniques in the Tons River Basin, India. J. Indian Soc. Remote Sens. 2021, 49, 2623–2637. [Google Scholar] [CrossRef]
- Nauditt, A.; Firoz, A.B.M.; Trinh, V.Q.; Fink, M.; Stolpe, H.; Ribbe, L. Hydrological Drought Risk Assessment in an Anthropogenically Impacted Tropical Catchment, Central Vietnam. In Land Use and Climate Change Interactions in Central Vietnam; Water Resources Development and Management; Springer: Singapore, 2017; pp. 223–239. [Google Scholar] [CrossRef]
- Omer, A.; Zhuguo, M.; Yuan, X.; Zheng, Z.; Saleem, F. A hydrological perspective on drought risk-assessment in the Yellow River Basin under future anthropogenic activities. J. Environ. Manag. 2021, 289, 112429. [Google Scholar] [CrossRef]
- Yang, P.; Xia, J.; Zhang, Y.; Zhan, C.; Sun, S. How is the risk of hydrological drought in the Tarim River Basin, Northwest China? Sci. Total Environ. 2019, 693, 133555. [Google Scholar] [CrossRef]
- Mamun, A.A.; Hashim, A.; Daoud, J.I. Regionalisation of low flow frequency curves for the Peninsular Malaysia. J. Hydrol. 2010, 381, 174–180. [Google Scholar] [CrossRef]
- Yusof, F.; Hui-Mean, F.; Suhaila, J.; Yusop, Z.; Ching-Yee, K. Rainfall characterisation by application of standardised precipitation index (SPI) in Peninsular Malaysia. Theor. Appl. Climatol. 2014, 115, 503–516. [Google Scholar] [CrossRef]
- Muhammad, N.S.; Julien, P.Y.; Salas, J.D. Probability Structure and Return Period of Multiday Monsoon Rainfall. J. Hydrol. Eng. 2016, 21, 04015048. [Google Scholar] [CrossRef] [Green Version]
- Nalbantis, I.; Tsakiris, G. Assessment of hydrological drought revisited. Water Resour. Manag. 2009, 23, 881–897. [Google Scholar] [CrossRef]
- Akbari, H.; Rakhshandehroo, G.R.; Sharifloo, A.H.; Ostadzadeh, E. Drought Analysis Based on Standardized Precipitation Index (SPI) and Streamflow Drought Index (SDI) in Chenar Rahdar River Basin, Southern Iran. Proc. Watershed Manag. Symp. 2015, 2015, 11–22. [Google Scholar] [CrossRef]
- Tabari, H.; Nikbakht, J.; Talaee, P.H. Hydrological Drought Assessment in Northwestern Iran Based on Streamflow Drought Index (SDI). Water Resour. Manag. 2013, 27, 137–151. [Google Scholar] [CrossRef]
- Sardou, F.S.; Bahremand, A. Hydrological Drought Analysis Using SDI Index in Halilrud Basin of Iran. Environ. Resour. Res. 2014, 2, 47–56. [Google Scholar]
- Tahroudi, M.N.; Ramezani, Y.; De Michele, C.; Mirabbasi, R. A New Method for Joint Frequency Analysis of Modified Precipitation Anomaly Percentage and Streamflow Drought Index Based on the Conditional Density of Copula Functions. Water Resour. Manag. 2020, 34, 4217–4231. [Google Scholar] [CrossRef]
- Manikandan, M.; Tamilmani, D. Assessing hydrological drought charactertics: A case study in a sub basin of Tamil Nadu, India. Agric. Eng. 2015, 1, 71–83. [Google Scholar]
- Lin, Q.; Wu, Z.; Singh, V.P.; Sadeghi, S.H.R.; He, H.; Lu, G. Correlation between hydrological drought, climatic factors, reservoir operation, and vegetation cover in the Xijiang Basin, South China. J. Hydrol. 2017, 549, 512–524. [Google Scholar] [CrossRef]
- Panu, U.S.; Sharma, T.C. Challenges in drought research: Some perspectives and future directions. Hydrol. Sci. J. 2010, 47, S19–S30. [Google Scholar] [CrossRef] [Green Version]
- Razmkhah, H. Comparing Threshold Level Methods in Development of Stream Flow Drought Severity-Duration-Frequency Curves. Water Resour. Manag. 2017, 31, 4045–4061. [Google Scholar] [CrossRef]
- Yevjevich, V. An objective approach to definitions and investigations of continental hydrologic drought. In Hydrology Papers; Colorado State University: Fort Collins, CO, USA, 1967; Volume 23. [Google Scholar]
- Shaaban, A.J.; Low, K.S. Droughts in Malaysia: A look at its characteristics, impacts, related policies and management strategies. In Proceedings of the Water and Drainage 2003 Conference, Philadelphia, PA, USA, 23–26 June 2003; pp. 43–54. [Google Scholar]
- Zaroug, M.A.H.; Eltahir, E.A.B.; Giorgi, F. Droughts and floods over the upper catchment of the Blue Nile and their connections to the timing of El Niño and la Niña events. Hydrol. Earth Syst. Sci. 2014, 18, 1239–1249. [Google Scholar] [CrossRef] [Green Version]
- Thomas, T.; Jaiswal, R.K.; Galkate, R.; Nayak, P.C.; Ghosh, N.C. Drought indicators-based integrated assessment of drought vulnerability: A case study of Bundelkhand droughts in central India. Nat. Hazards 2016, 81, 1627–1652. [Google Scholar] [CrossRef]
- Oikonomou, P.D.; Tsesmelis, D.E.; Waskom, R.M.; Grigg, N.S.; Karavitis, C.A. Enhancing the Standardized Drought Vulnerability Index by Integrating Spatiotemporal Information from Satellite and In Situ Data; Elsevier: Amsterdam, The Netherlands, 2019; Volume 569, ISBN 0000000221. [Google Scholar]
- Hohmann, C.; Kirchengast, G.; Birk, S. Alpine foreland running drier? Sensitivity of a drought vulnerable catchment to changes in climate, land use, and water management. Clim. Chang. 2018, 147, 179–193. [Google Scholar] [CrossRef] [Green Version]
- Kumar, S.M.; Preeti, R.; Kumar, V.M. Validation of Standardized Precipitation Index (SPI) for meteorological drought risk in central India. Disaster Adv. 2018, 11, 1–12. [Google Scholar]
- Reza, M.I.H.; Abdullah, S.A.; Nor, S.B.M.; Ismail, M.H. Landscape pattern and connectivity importance of protected areas in Kuala Lumpur conurbation for sustainable urban planning. Int. J. Conserv. Sci. 2018, 9, 361–372. [Google Scholar]
- Jiao, D.; Wang, D.; Lv, H. Effects of human activities on hydrological drought patterns in the Yangtze River Basin, China. Nat. Hazards 2020, 104, 1111–1124. [Google Scholar] [CrossRef]
- Wada, Y.; Zaherpour, J.; Mount, N.; Hanasaki, N.; Dankers, R.; Leng, G.; Gerten, D.; Schmied, H.M.; Gudmundsson, L.; Haddeland, I.; et al. Worldwide evaluation of mean and extreme runoff from six global-scale hydrological models that account for human impacts. Environ. Res. Lett. 2018, 13, 065015. [Google Scholar] [CrossRef]
- Kundzewicz, Z.W.; Kanae, S.; Seneviratne, S.I.; Handmer, J.; Nicholls, N.; Peduzzi, P.; Mechler, R.; Bouwer, L.M.; Arnell, N.; Mach, K.; et al. Flood risk and climate change: Global and regional perspectives. Hydrol. Sci. J. 2014, 59, 1–28. [Google Scholar] [CrossRef] [Green Version]
Figure 1.
The methodology framework for modification of hydrological drought risk assessment.

Figure 2.
The geographical map and location of the selected streamflow gauging stations.

Figure 3.
Boxplot of average monthly streamflow as a function of area size.

Figure 4.
Colour-coded table of the SDI-12 for 40-year time series. (a) SDI-12 for the years from 1978 to 1997 and (b) SDI-12 for the years from 1998 to 2018.
Figure 4.
Colour-coded table of the SDI-12 for 40-year time series. (a) SDI-12 for the years from 1978 to 1997 and (b) SDI-12 for the years from 1998 to 2018.


Figure 5.
The trend results of the Mann-Kendall test for SDI-12 (Annual).

Figure 6.
The slope trend results of the Sen’s slope estimator test for SDI-12 (Annual).

Figure 7.
The assessment of hydrological drought with SDI on the different time scales: (a) SDI-3 (January to March), (b) SDI-6 (January to June), (c) SDI-9 (January to September), (d) SDI-12 (January to December).
Figure 7.
The assessment of hydrological drought with SDI on the different time scales: (a) SDI-3 (January to March), (b) SDI-6 (January to June), (c) SDI-9 (January to September), (d) SDI-12 (January to December).


Figure 8.
Temporal distribution of SDI values for 1980 to 2018: (a) SDI-3 (January to March), (b) SDI-6 (January to June), (c) SDI-9 (January to September), (d) SDI-12 (January to December).
Figure 8.
Temporal distribution of SDI values for 1980 to 2018: (a) SDI-3 (January to March), (b) SDI-6 (January to June), (c) SDI-9 (January to September), (d) SDI-12 (January to December).


Figure 9.
The spatial distribution for occurrence of hydrological drought events with different timescales (SDI-3, SDI-6, SDI-9 and SDI-12) and drought categories (moderate: SDI < −1; severe: SDI < −1.5; extreme: SDI < −2).
Figure 9.
The spatial distribution for occurrence of hydrological drought events with different timescales (SDI-3, SDI-6, SDI-9 and SDI-12) and drought categories (moderate: SDI < −1; severe: SDI < −1.5; extreme: SDI < −2).


Figure 10.
The spatial distribution of hydrological drought severity for different timescales (SDI-3, SDI-6, SDI-9 and SDI-12) and drought categories (moderate: SDI < −1; severe: SDI < −1.5; extreme: SDI < −2).
Figure 10.
The spatial distribution of hydrological drought severity for different timescales (SDI-3, SDI-6, SDI-9 and SDI-12) and drought categories (moderate: SDI < −1; severe: SDI < −1.5; extreme: SDI < −2).


Figure 11.
Spatial assessments for: (a) Hydrological Drought Risk Index (HDRI); (b) Hydrological Drought Vulnerability Index (HDVI); and (c) Hydrological Drought Risk Map.
Figure 11.
Spatial assessments for: (a) Hydrological Drought Risk Index (HDRI); (b) Hydrological Drought Vulnerability Index (HDVI); and (c) Hydrological Drought Risk Map.


Table 1.
Details of river discharge stations and availability of streamflow data in Peninsular Malaysia.
Table 1.
Details of river discharge stations and availability of streamflow data in Peninsular Malaysia.
| State | Station ID | River | Area (km2) | Start and End Year | Average Streamflow (m3/s) | SD | CV | Sk |
|---|---|---|---|---|---|---|---|---|
| Johor | S01 | Johor River | 1130 | 1978 to 2018 | 31.82 | 35.66 | 1.12 | 5.86 |
| S02 | Sayong River | 624 | 1978 to 2018 | 16.31 | 15.12 | 0.93 | 3.02 | |
| S03 | Lenggor River | 207 | 1978 to 2018 | 12.38 | 26.19 | 2.12 | 11.08 | |
| S06 | Segamat River | 658 | 1993 to 2018 | 15.04 | 29.64 | 1.97 | 16.29 | |
| Melaka | S05 | Kesang River | 161 | 1978 to 2018 | 2.02 | 2.19 | 1.08 | 2.95 |
| S08 | Melaka River | 350 | 1978 to 2018 | 6.07 | 5.82 | 0.96 | 3.11 | |
| Negeri Sembilan | S07 | Linggi River | 523 | 1978 to 2018 | 15.62 | 12.68 | 0.81 | 2.94 |
| S10 | Triang River | 904 | 1978 to 2018 | 9.23 | 6.67 | 0.72 | 2.94 | |
| S12 | Triang River | 228 | 1978 to 2018 | 3.71 | 2.43 | 0.66 | 1.80 | |
| Selangor | S09 | Langat River | 380 | 1978 to 2018 | 10.32 | 9.54 | 0.92 | 4.16 |
| S11 | Langat River | 1240 | 1978 to 2018 | 34.08 | 31.15 | 0.91 | 4.03 | |
| S13 | Bernam River | 1090 | 1978 to 2018 | 48.02 | 28.97 | 0.60 | 1.39 | |
| S14 | Semenyih River | 225 | 1978 to 2018 | 5.13 | 3.70 | 0.72 | 2.32 | |
| S17 | Lui River | 68 | 1978 to 2018 | 2.10 | 1.43 | 0.68 | 1.90 | |
| S20 | Selangor River | 1450 | 1978 to 2018 | 55.06 | 34.82 | 0.63 | 1.57 | |
| S21 | Bernam River | 186 | 1978 to 2018 | 8.74 | 5.84 | 0.67 | 1.50 | |
| Wilayah Persekutuan | S15 | Gombak River | 122 | 1978 to 2018 | 5.22 | 4.74 | 0.91 | 5.51 |
| S16 | Batu River | 145 | 1978 to 2018 | 6.27 | 5.61 | 0.89 | 4.48 | |
| Pahang | S04 | Kecau River | 497 | 1990 to 2018 | 64.03 | 81.29 | 1.27 | 1.11 |
| S18 | Pahang River | 19,000 | 1978 to 2018 | 502.12 | 457.04 | 0.91 | 4.57 | |
| S19 | Pahang River | 25,600 | 1998 to 2018 | 703.38 | 501.69 | 0.71 | 2.79 | |
| S22 | Lipis River | 1670 | 1992 to 2018 | 70.34 | 55.32 | 0.79 | 0.92 | |
| S24 | Jelai River | 7320 | 1995 to 2018 | 213.27 | 100.80 | 0.47 | 1.12 | |
| S26 | Tembeling River | 5050 | 1997 to 2018 | 176.16 | 108.48 | 0.62 | 1.84 | |
| Terengganu | S23 | Berang River | 140 | 1991 to 2018 | 12.97 | 21.88 | 1.69 | 5.00 |
| S30 | Nerus River | 393 | 1981 to 2018 | 37.42 | 55.07 | 1.47 | 5.49 | |
| S35 | Besut River | 787 | 2006 to 2018 | 53.08 | 116.42 | 2.19 | 5.28 | |
| S38 | Cherul River | 505 | 1997 to 2018 | 30.50 | 35.06 | 1.15 | 5.46 | |
| Perak | S25 | Chendering River | 119 | 1993 to 2018 | 6.31 | 4.00 | 0.63 | 0.77 |
| S27 | Perak River | 7770 | 1988 to 2018 | 226.66 | 72.01 | 0.32 | 1.50 | |
| S28 | Kurau River | 337 | 1978 to 2018 | 17.02 | 16.48 | 0.97 | 1.82 | |
| Kelantan | S29 | Lebir River | 2430 | 1978 to 2018 | 110.88 | 137.17 | 1.24 | 6.07 |
| S36 | Kelantan River | 11,900 | 1978 to 2018 | 467.50 | 480.13 | 1.03 | 4.73 | |
| S37 | Golok River | 80 | 1984 to 2018 | 6.07 | 8.27 | 1.36 | 4.56 | |
| S39 | Lanas River | 216 | 1997 to 2018 | 16.12 | 22.36 | 1.39 | 3.47 | |
| Penang | S31 | Kulim River | 129 | 1978 to 2018 | 5.93 | 5.12 | 0.86 | 2.22 |
| S32 | Muda River | 4010 | 1978 to 2018 | 87.02 | 88.08 | 1.01 | 2.76 | |
| Kedah | S33 | Muda River | 3330 | 1978 to 2018 | 80.81 | 66.77 | 0.83 | 2.28 |
| S34 | Muda River | 1710 | 1978 to 2018 | 30.64 | 28.93 | 0.94 | 1.98 | |
| Perlis | S40 | Arau River | 21 | 1983 to 2018 | 0.78 | 1.07 | 1.37 | 4.06 |
| S41 | Pelarit River | 21 | 1999 to 2018 | 1.17 | 1.75 | 1.49 | 3.84 | |
| S42 | Jarum River | 22 | 2000 to 2018 | 1.54 | 2.31 | 1.50 | 3.90 |
Table 2.
SDI classifies hydrological droughts according to their severity.
| SDI Values | Categories |
|---|---|
| −1.5 ≤ SDI < −1.0 | Moderate drought |
| −2.0 ≤ SDI < −1.5 | Severe drought |
| SDI < −2.0 | Extreme drought |
Table 3.
Hydrological drought category by HDHI, HDVI and HDRI.
| Index Values | Drought Category |
|---|---|
| 0.00 to 0.24 | Low |
| 0.25 to 0.49 | Moderate |
| 0.50 to 0.74 | High |
| 0.75 to 1.00 | Very high |
Table 4.
HDHI, HDVI and HDRI values and class for Peninsular Malaysia.
| State | Station ID | District | HDHI | HDVI | HDRI |
|---|---|---|---|---|---|
| Johor | S01 | Kota Tinggi | 0.57 | 0.28 | 0.16 |
| S02 | Johor Bahru | 0.29 | 0.41 | 0.12 | |
| S03 | Mersing | 0.08 | 0.08 | 0.01 | |
| S06 | Segamat | 0.94 | 0.23 | 0.21 | |
| Melaka | S05 | Jasin | 0.37 | 0.67 | 0.25 |
| S08 | Alor Gajah | 0.71 | 0.33 | 0.23 | |
| Negeri Sembilan | S07 | Port Dickson | 0.40 | 0.51 | 0.20 |
| S10 | Jelebu | 0.09 | 0.24 | 0.02 | |
| S12 | Jelebu | 0.29 | 0.24 | 0.07 | |
| Selangor | S09 | Hulu Langat | 0.18 | 0.10 | 0.02 |
| S11 | Hulu Langat | 0.35 | 0.10 | 0.03 | |
| S13 | Hulu Selangor | 0.07 | 0.09 | 0.01 | |
| S14 | Hulu Langat | 0.02 | 0.10 | 0.00 | |
| S17 | Hulu Langat | 0.66 | 0.10 | 0.06 | |
| S20 | Kuala Selangor | 0.38 | 0.45 | 0.17 | |
| S21 | Hulu Selangor | 0.48 | 0.09 | 0.04 | |
| Wilayah Persekutuan | S15 | Kuala Lumpur | 0.39 | 0.50 | 0.19 |
| S16 | Kuala Lumpur | 0.05 | 0.50 | 0.03 | |
| Pahang | S04 | Lipis | 0.30 | 0.10 | 0.03 |
| S18 | Temerloh | 0.74 | 0.15 | 0.11 | |
| S19 | Maran | 0.01 | 0.27 | 0.00 | |
| S22 | Bentong | 0.03 | 0.22 | 0.01 | |
| S24 | Lipis | 0.10 | 0.10 | 0.01 | |
| S26 | Temerloh | 0.27 | 0.15 | 0.04 | |
| Terengganu | S23 | Hulu Terengganu | 0.15 | 0.24 | 0.04 |
| S30 | Setiu | 0.94 | 0.16 | 0.15 | |
| S35 | Besut | 0.02 | 0.19 | 0.00 | |
| S38 | Kemaman | 0.82 | 0.41 | 0.34 | |
| Perak | S25 | Batang Padang | 0.09 | 0.32 | 0.03 |
| S27 | Kuala Kangsar | 0.57 | 0.31 | 0.18 | |
| S28 | Larut Matang | 0.34 | 0.37 | 0.13 | |
| Kelantan | S29 | Kuala Krai | 0.02 | 0.45 | 0.01 |
| S36 | Tanah Merah | 0.04 | 0.18 | 0.01 | |
| S37 | Jeli | 0.99 | 0.19 | 0.19 | |
| S39 | Tanah Merah | 0.36 | 0.18 | 0.06 | |
| Penang | S31 | Seberang Perai Utara | 0.06 | 0.50 | 0.03 |
| S32 | Seberang Perai Utara | 0.19 | 0.50 | 0.10 | |
| Kedah | S33 | Sungai Petani | 0.97 | 0.68 | 0.66 |
| S34 | Sik | 0.01 | 0.32 | 0.00 | |
| Perlis | S40 | Perlis | 0.42 | 0.33 | 0.14 |
| S41 | Perlis | 0.36 | 0.33 | 0.12 | |
| S42 | Perlis | 0.42 | 0.33 | 0.14 | |
| Legend: | Index values | HDHI | HDVI | HDRI | |
| 0.00 to 0.24 | |||||
| 0.25 to 0.49 | |||||
| 0.50 to 0.74 | |||||
| 0.75 to 1.00 | |||||
Publisher’s Note: MDPI stays neutral with regard to jurisdictional claims in published maps and institutional affiliations. |
© 2022 by the authors. Licensee MDPI, Basel, Switzerland. This article is an open access article distributed under the terms and conditions of the Creative Commons Attribution (CC BY) license (https://creativecommons.org/licenses/by/4.0/).
Share and Cite
MDPI and ACS Style
Hasan, H.H.; Razali, S.F.M.; Muhammad, N.S.; Ahmad, A. Modified Hydrological Drought Risk Assessment Based on Spatial and Temporal Approaches. Sustainability 2022, 14, 6337. https://0-doi-org.brum.beds.ac.uk/10.3390/su14106337
AMA Style
Hasan HH, Razali SFM, Muhammad NS, Ahmad A. Modified Hydrological Drought Risk Assessment Based on Spatial and Temporal Approaches. Sustainability. 2022; 14(10):6337. https://0-doi-org.brum.beds.ac.uk/10.3390/su14106337
Chicago/Turabian StyleHasan, Hasrul Hazman, Siti Fatin Mohd Razali, Nur Shazwani Muhammad, and Asmadi Ahmad. 2022. "Modified Hydrological Drought Risk Assessment Based on Spatial and Temporal Approaches" Sustainability 14, no. 10: 6337. https://0-doi-org.brum.beds.ac.uk/10.3390/su14106337
Note that from the first issue of 2016, this journal uses article numbers instead of page numbers. See further details here.