
“Sustainability” as a Motive for Choosing Shared-Mobility Services: The Case of Polish Consumers of Uber Services


1
Department of Econometrics and Computer Science, Wroclaw University of Economics and Business, ul. Komandorska 118-120, 53-345 Wrocław, Poland
2
Department of Marketing and Tourism Management, Wroclaw University of Economics and Business, ul. Komandorska 118-120, 53-345 Wrocław, Poland
*
Author to whom correspondence should be addressed.
Sustainability 2022, 14(10), 6352; https://0-doi-org.brum.beds.ac.uk/10.3390/su14106352
Submission received: 26 April 2022
/
Revised: 18 May 2022
/
Accepted: 19 May 2022
/
Published: 23 May 2022
Abstract
:(1) Background: Uber Technologies are currently changing the pattern of urban transport. Statista reports that in the period 2017–2019 alone, the average monthly number of active Uber users worldwide increased by 126.5%, and the average monthly number of Uber trips grew by 115%. The purpose of this article is to identify the most important motives encouraging both current and potential customers to use Uber “taxi” services. Particular attention was paid to the factor of perceiving these services as a more sustainable way of meeting transport needs. Uber creates its image specifically on the idea of sustainability. (2) Methods: The operationalization of the sustainability concept was based on three dimensions: ecological, social and economic. The CAWI (Computer-Assisted Web Interview) technique was used to collect the research data. The representative research sample covered 1003 Poles. A logistic regression model was used to analyze empirical data collected based on the survey. The data analysis used R program and the selected packages for this program. (3) Results: Among the most important motives, sustainability is the most frequently indicated. (4) Conclusions: The choices of Uber services are significantly influenced by the reasons related to two sustainability pillars—one social and one economic. The factors significantly influencing consumer decision-making processes related to the use of shared mobility services belong to the following groups of motives: sustainable development, knowledge of information and communication technologies (ICT), innovation, user convenience and savings. The findings from the study can become the basis for organizations and local authorities to undertake appropriate marketing activities to promote shared-mobility services (SMS) and support sustainable and environmentally friendly development.
1. Introduction
Shared-mobility services (SMS) remain a part of a wider sharing economy (SE) phenomenon developing in various spheres of the economy, i.e., finance, accommodation or transport. Today transport systems have become multimodal and the evolution of shared mobility has resulted in its many forms. It is about the shared use of a vehicle, motorcycle, scooter, bicycle, or other travel mode that provides users with short-term access to a transportation mode on an as-needed basis [1,2]. Accessing them is provided by the digital platforms related to Mobility-as-a-Service (MaaS) [3]. The presented SMS is defined as a type of the real-time car sharing based on location. The provision of these services is based on using geographic information systems (GIS) and technologies of global positioning systems (GPS) [4], combined with mobile technologies to organize shared rides arranged between drivers and passengers. Digital SMS platforms allow individuals using their car to transport others in return for a fee. In order to book a ride, customers use a smartphone application where they can additionally track the location of the required vehicle. Payment is usually made via the app at the end of the trip. According to Transit Cooperative Research Program (TCRP) Report [5], the shared-mobility service has become one of the most ubiquitous forms of car sharing. The term “shared mobility” was introduced to describe a car-sharing service (i.e., a ride-sharing service which combines more than one trip) [6]. The Shared-use Mobility Center [7] states that Uber, established in 2009 by G. Camp and T. Kalanicka, has been the largest company providing such services to date. The Uber app was officially launched in 2010 in San Francisco. The Polish branch of Uber was registered in December 2013 as Uber Poland spółka z o.o., and on 19 August 2014, Uber started offering its services in Warsaw. Outside Warsaw, it can be used in Poland by the residents of Krakow (since April 2015), Tri-City (since June 2015), Poznań (since November 2015), Wrocław (since November 2015), Łódź, the Silesian Agglomeration and Szczecin (since September 2020). Uber offers various service packages, the available services in Poland are as follows: UberX, UberXL or UberSELECT (economic rides), UberSUV, UberBLACK and UberLUX (premium trips), rides for people with disabilities, UberPool (shared rides). Since 2017, the UberEats service (the possibility of food delivery) was introduced in Poland. Currently in Poland, Uber has a 50% market share of the rides ordered via applications [8].
The technological factor [9] and the issues of positive influence on sustainable development were initially recognized as the primary driver of SE growth, whereas a car as a resource not used by its owner became, in 95% cases, next to a power drill, a flagship example confirming the contribution of the sharing economy to sustainable development [10]. However, Gerwe and Silva [10] suggest taking into account the individual preferences and characteristics of those using the discussed services when estimating the total net impact of the car sharing services on sustainable development. It is only when the individuals decide to act as responsible consumers and take sustainability seriously that they become engaged in appropriate actions [11]. Responsible consumers take into account the social, environmental and economic impacts of their consumption [12]. Responsibility is becoming an important dimension of attitudes and behaviors as well as the determinant of their market choices [13]. It has been highlighted that only the right choices of all SE participants (service providers, platforms, consumers, policy makers) result in the achievement of sustainable development goals. The awareness of both positive and negative consequences of using transport within the sharing formula service provides the basis for making good decisions. It influences the motives and, in the science of choice, the motives behind actions remain the most important research problems. As the research review conducted for the purposes of this article has shown (see Section 2.3), there is a research gap regarding users and primarily the factors affecting their SMS choice.
The presented article attempts to answer the question of whether the perception of the services provided based on sharing as a more sustainable way of meeting transport needs is an important motive underlying their choice by consumers. The research space was limited to the customers of transport services offered through Uber—the platform currently ranked the highest in SE when it comes to passenger transport.
The purpose of this article is to identify the most important motives encouraging customers to use Uber “taxi” services. Special attention was paid to the sustainability factor.
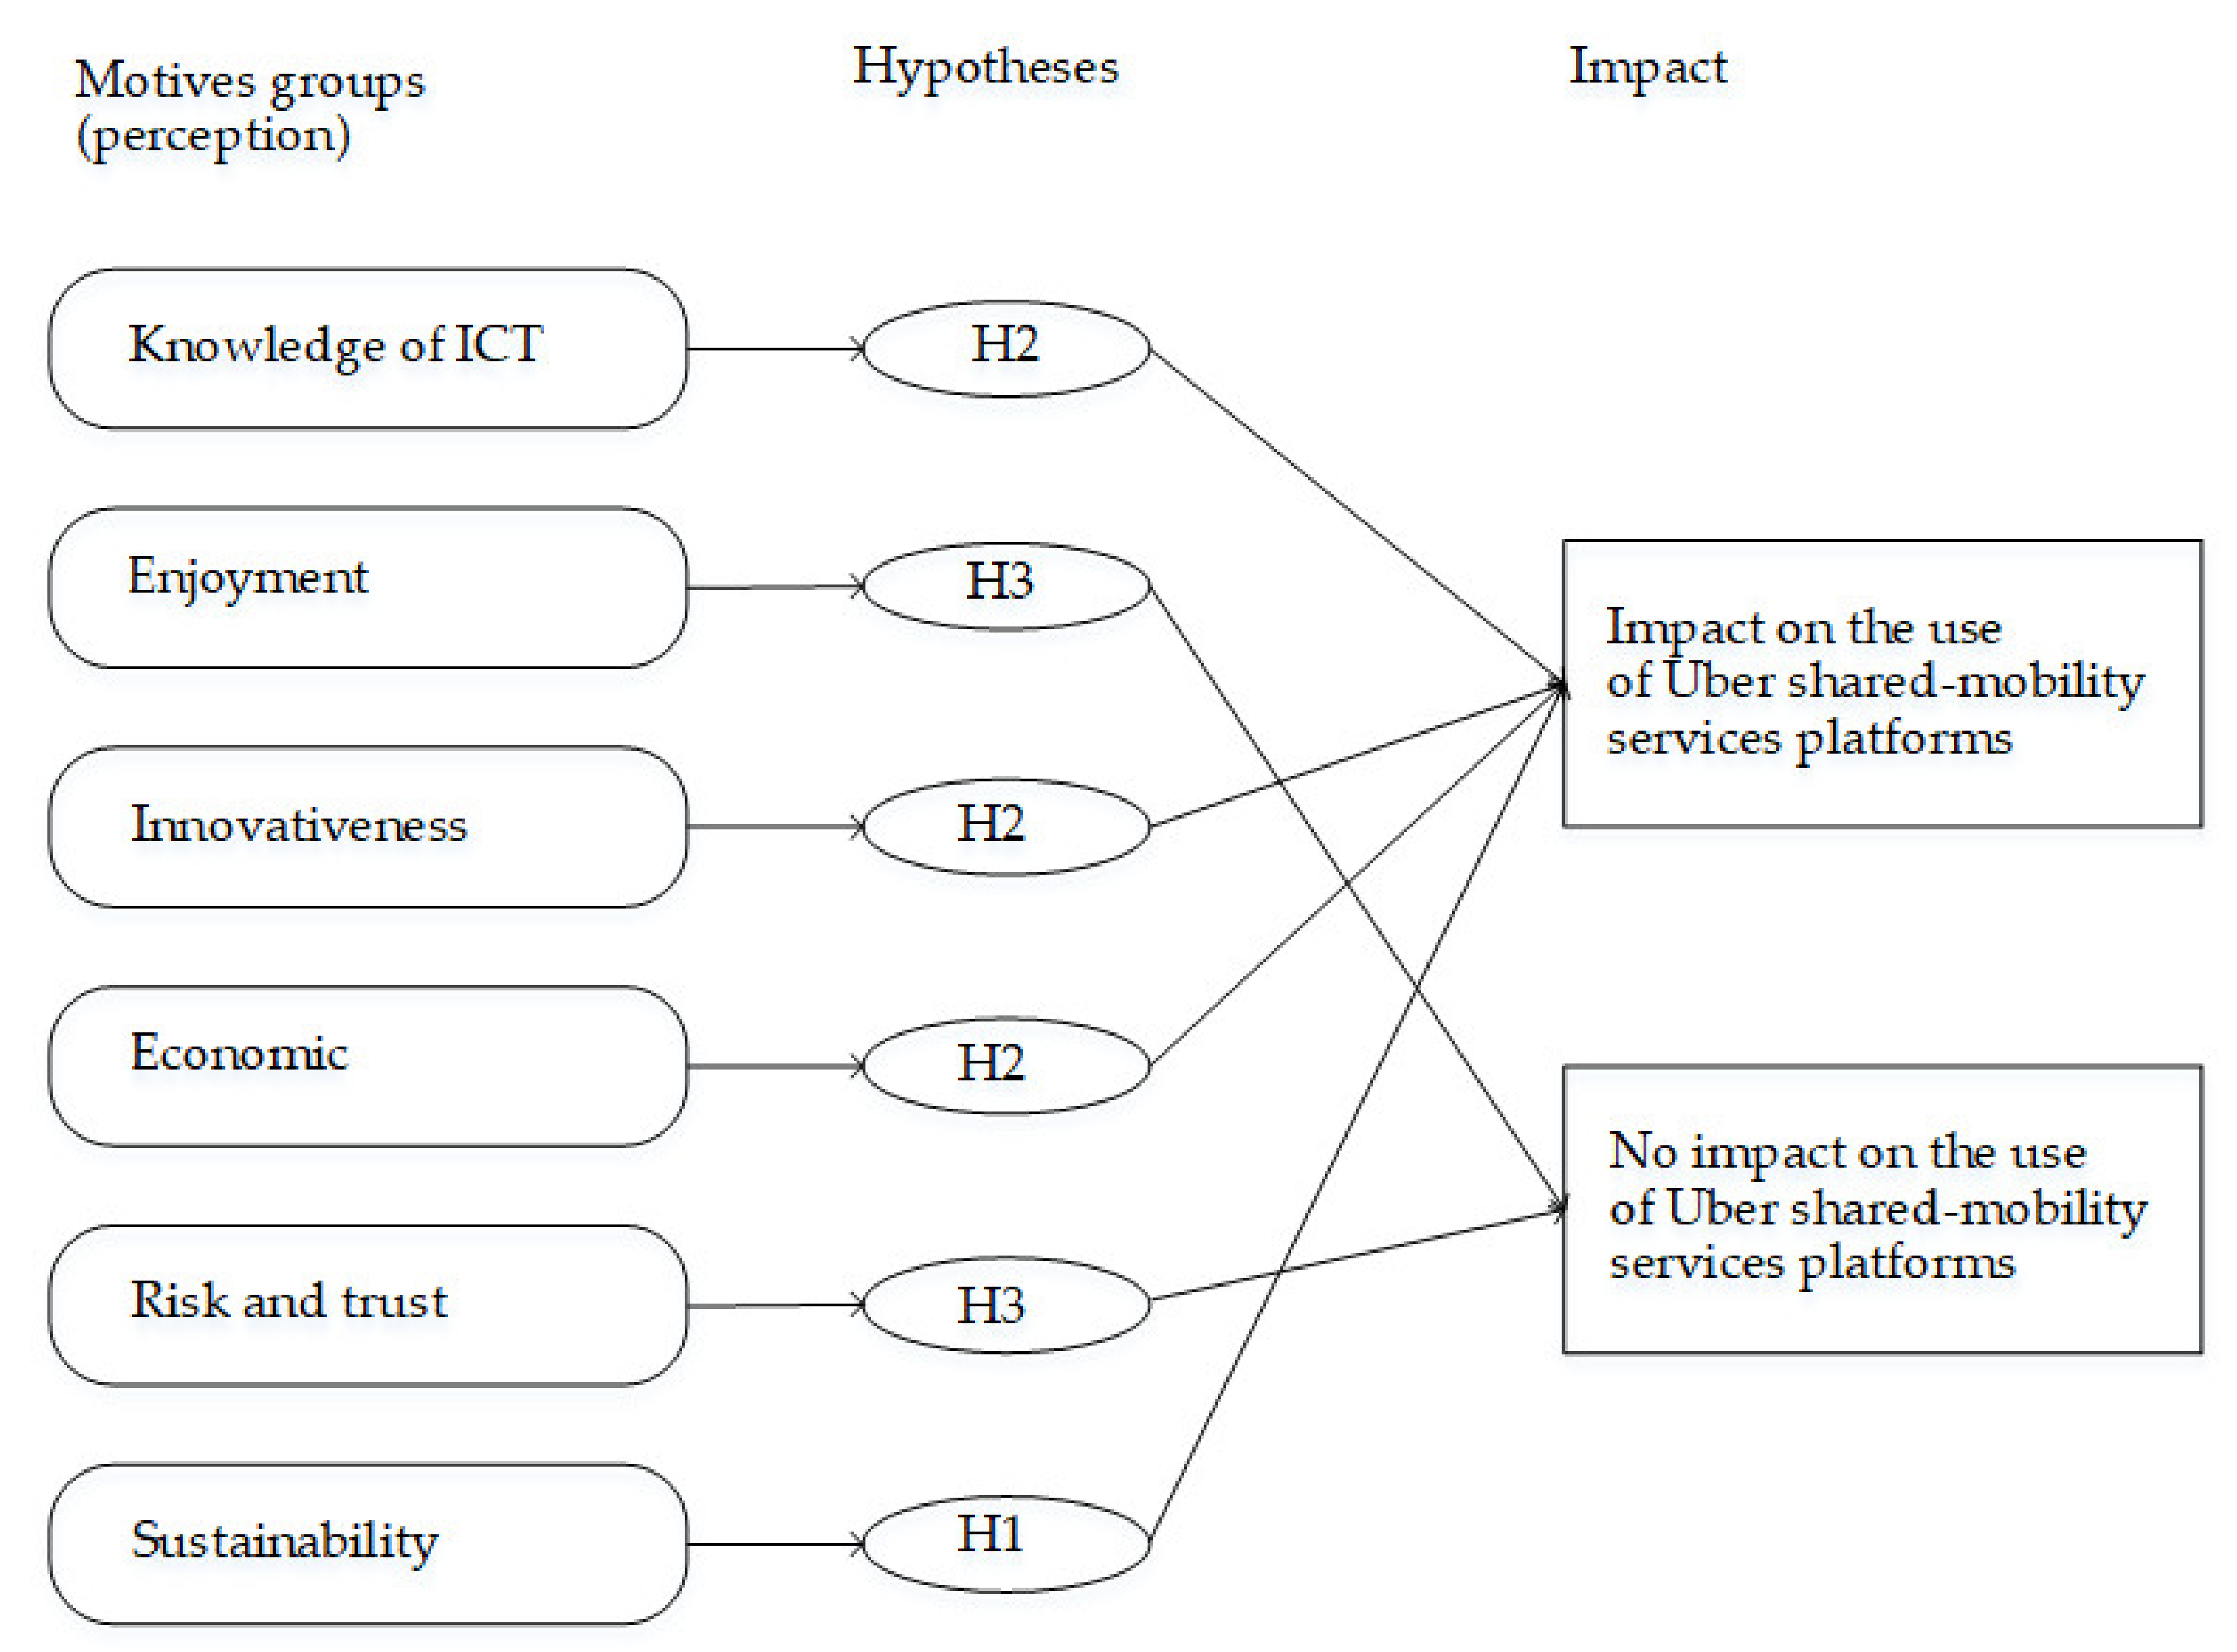
The following research hypotheses were formulated and verified in the conducted empirical study:
Hypothesis 1 (H1).
The factors included in the Sustainability motive have a significant impact on the choice of Uber shared-mobility services.
Hypothesis 2 (H2).
Using the Uber shared-mobility services is determined by factors included in the following motives: Knowledge of ICT, Innovativeness and Economic.
Hypothesis 3 (H3).
Using the Uber shared-mobility services is not determined by the factors included in the following motives: Enjoyment and Risk and trust.
The presented study addresses one of a few factors influencing consumer decisions about purchasing shared-mobility services based on the example of their largest provider—Uber. The originality and novelty of the research is the emphasis placed on sustainability as a factor in making consumer choices. This is the first study of Polish consumers and their motivations to use Uber, thus complementing the research conducted in the segment of Brazilians, Americans, Canadians and Australians.
Figure 1 presents a conceptual model containing research hypotheses verified based on the empirical data analysis.
The article is organized as follows: Section 1 provides a review of the research addressing the incentives for using shared mobility. Section 2 addresses sustainability in relation to car sharing services as a research problem covered in previous studies. Section 3 describes the sources and methods of collecting data used in this study and presents the methodology applied to analyze the motives for using Uber services, whereas Section 4 presents the research findings. The last two sections discuss the results of previous studies and formulate both conclusions and implications of this study, including the identified limitations.
2. Theoretical Background
2.1. Shared-Mobility Motives
Shared-mobility service companies, including Uber, offer innovative and cheaper transport alternatives by reducing the marginal cost of service provision. These platforms are developing dynamically, offering a variety of services to meet diverse needs. Uber offers prearranged and on-demand transportation services in which drivers and passengers connect via digital applications, which are typically used for booking, electronic payment and ratings. Uber is included among the digital platforms related to MaaS. They enhance changes in social behavior in the market, which can be defined as transformations in the consumption model, i.e., moving from owning towards sharing [14,15], although as emphasized by Barbu et al. [16], neither of these consumption patterns are going to fade away. In their opinion, they will continue to coexist, expanding the range of the available consumer options. From the perspective of a user, SMS are developing very dynamically primarily due to: the application availability and its many functions (e.g., new user data verification process through the application), user safety (monitoring drivers’ driving and the control of trips made), user data security, payment data security and mobile application use security [17]. The research addressing SE is dominated by the studies covering accommodation and transportation services, where the authors’ attention is mainly focused on Airbnb and Uber platforms.
The source literature on Uber provides analyses of the business model and factors behind its market success [18]. A frequently addressed research problem is the effect of introducing Uber to urban transport systems in different cities [19,20,21,22,23], taking into account the environmental impacts [24,25,26,27] and also the employment factor [28]. Much attention is paid to the issues of policy towards Uber and the regulations underlying its activities [29,30,31].
The motives are described in literature through the prism of many theories, the earlier ones such as, e.g., Maslow’s Hierarchy of Needs or Herzberg’s Motivation theory as well as the contemporary theories of motivation (e.g., Expectancy theory) [32], Acquier et al. [33] and Möhlmann [34], who proposed a division into external and internal motives, and Dann [35], who conducted a decomposition of push and pull motives. The theory of push and pull motivations is often used in the studies on motivation in tourism. People travel because they are propelled by the psyche (push) and drawn by external forces (pull) [36,37]. As Hossain [38] states, motivation stands for an essential issue when it comes to the success of SE initiatives, hence the motives represent an important problem in research where the authors’ attention is focused both on the service providers and customers. Additionally, consumers’ motives are identified in terms of users—non-users and, as shown by Hawlitschek et al. [39], non-users’ motives are analyzed much less frequently. Most of the studies cover the accommodation sector. According to the analyses by Böcker and Meelen [40] and Hossain [38], there are gaps in the research on the motives followed by those using car sharing services and, as emphasized by Sung et al. [41], few of them discuss the motivations related to using platforms from the consumer’s perspective. At this point, it is important to highlight the significance of focusing on the motives in various SE sectors, because as the research findings by Böcker and Meelen [40] show, they remain diversified depending on the analyzed field. According to these authors, SE should not be approached as one coherent phenomenon.
2.2. Sustainability
Sustainable development has been identified as one of the greatest contemporary challenges. Based on the review of the previously published papers on sharing economy, Ranjbari et al. [42] stated that sustainability is an important concept applied in research. According to the authors, shared mobility offers great opportunities for supporting sustainable development [23]. In the opinion of many researchers, sharing the unused resources contributes to the efficiency improvement of their use. In other words, SMS should result in both economic (additional revenues and savings), social (access to services, convenience, additional functionalities) and environmental benefits (reduction in energy consumption, greenhouse gas emissions, PM2.5 pollution and traffic congestion and noise) [1,3,43,44,45,46,47]. However, there is evidence that this positive impact of sharing on sustainability is not an unequivocal one [47]. Barnes et al. [45] indicate that the effect of reducing PM2.5 emissions may be temporary. The researchers analyzing one selected first-order effect usually resulting in findings confirming the positive impact of car sharing on the environment, society or economy [43,48,49,50]. In turn, those who perceive the problem in a broader perspective (second-order effects) are highly skeptical about this positive influence, e.g., Jung and Koo [47]. According to Codagnone et al. [51], in practice it has neither been sufficiently transparent nor reliably documented. Demonstrating the net impact in terms of environmental sustainability at an aggregated level is extremely difficult and complex [52]. As some researchers claim, the problem of economic effects of SE development as well as social and environmental issues should still remain the subject of scientific studies [53,54].
The source literature provides interesting analyses addressing the problem of sustainable development in the behavioral context of the sharing economy participants. However, they have certain limitations, because they refer to one selected market segment (quite frequently to generation Y) and/or one specific location (e.g., a selected city in the USA), as well as one sustainability pillar alone (e.g., related to the natural environment). The literature discussing Polish users of digital platforms offering transportation services provides the research covering young people using BlaBlaCar [55]. The recent analyzes, in turn, refer to the residents of Łódź using bikes offered under the municipal rental system [56]. While carefully comparing the results of these studies, and being aware of the limited possibilities for making such comparisons, the discrepancy in the conclusions formulated by the researchers becomes noticeable. Based on the results of empirical studies, some researchers confirm, e.g., the importance of environmental aspects related to using shared mobility, whereas others deny it [57]. Overall, it should be stated that the impact of environmental awareness of consumer behavior in the case of SMS [40,58] and the motivations for using Uber services have not been sufficiently analyzed as yet.
This article approaches sustainability using a broad perspective, through the prism of three pillars—social, economic and the natural environment. The idea of sustainable development understood in this way assumes improving the “quality of life” through further socio-economic development rather than at the expense of others, including future generations, and taking into account the requirements of human and nature rights. It adopts the reconciliation of ecological, economic and social reasons reflected in striving to achieve three basic goals: (1) halting environmental degradation and eliminating its threats, (2) meeting the basic material needs of humanity using techniques and technologies which do not damage the environment and (3) eliminating starvation, deprivation and poverty, ensuring health protection, development of human spiritual sphere, security and education [59].
2.3. The Motives for Using Transport Services via Uber—Previous Research
The source literature review, as mentioned in the previous section, revealed scarce scientific studies on the motivations for using Uber services. The analysis presented here applies a systematic approach towards analyzing earlier publications in the area under study. ScienceDirect database, often used in the sharing economy studies [60,61,62], was applied. The search was conducted in July 2021 and was divided into four stages: searching articles, searching documents, selecting documents and choosing documents for analysis (Table 1). The search and selection were carried out following the established categorization key.
Nine literature items addressing the research problem discussed in this article were qualified for further in-depth content analysis (Table 2). They represent empirical articles covering studies on the factors determining the use of transport services purchased through SMS platforms. Most were published in the journals discussing the problems of transportation economics, management and geography, the majority of which (4) regarded transportation research (different parts: A, C, F). The earliest study was from 2018, and the results of the first research findings came from 2016. The spatial and numerical scope of the sample analyzed in the reviewed articles was highly diverse. The geographic coverage of four studies referred to the selected American regions and cities (California—two articles, Michigan and the Great Boston—one article each), two studies covered the Brazilians, one study was located in Canada (the Greater Toronto and Hamilton Area) and Australia (Adelaide). Depending on the research, the sample size ranged from 277 to 1975 people, most often selected through applying the non-random methods, e.g., using the quota sampling approach ensuring the appropriate number of respondents from each stratum adopted for the study present in the general population (identified based on various criterion, e.g., age, gender, race, geographical region, type of neighborhood) or the convenience sampling approach based on an easy access to the respondents (the sample structure is created automatically as a result of the research being joined by other willing individuals). The survey was conducted predominantly among the users. In three cases only both the users and non-users of Uber or the users of Uber and other transport options, different from Uber, were surveyed [63,64,65].
The previously performed studies collected information on many categories, including: socio-demographic characteristics of SMS users, their attitudes, preferences, motivations, behavior, lifestyle, using new information and communication technologies (the Internet, social media), owning vehicles, the adoption, intention and frequency of using on-demand ride services, situations in which the respondents use this type of service, using other travel modes (public transport, taxi, own car) and the perception of environmental concerns or shopping habits.
The analysis of the research findings considered in this article indicates that the reasons/motives influencing the decision of SMS may depend on the local conditions (e.g., the safety situation in a given country/region, the quality of public transport services, the condition of social welfare). For example, the research covering the users of ridesharing services in 16 Brazilian cities showed that the most important selection criteria were lower tariffs, the number of people sharing a ride as well as security and safety. Whereas in Adelaide, Australia: population density, housing value, higher levels of education and income, casual work status, younger age and access to smartphones were among the key factors associated with higher ridesharing use, or higher interest in ridesharing.
The researchers emphasize the existing paucity of data on SMS customers, their ways of using on-demand transport services as well as changes in their travel behavior resulting from the development of shared mobility systems [63].
3. Materials and Methods
3.1. Survey and Sampling Method
The empirical data were collected based on a survey carried out using a questionnaire. The sampling and data collection was commissioned to a research agency—IMAS International Branch in Wrocław, Poland. The research covered 1003 respondents. The studied sample was representative for the general population of Poles aged 18–64 in accordance with the following five characteristics: gender, age, region, size of the town and education. IMAS selected a representative sample of the respondents based on a statistical sampling model. The CAWI technique was used to collect the data. The research was conducted in September 2020.
3.2. Measurement Items
The measurement scale applied in the survey was developed based on the scales used in previous studies presented in Table 2. These studies provided groups of motives (perception areas, measurement positions), which function as aggregates of factors influencing the examined phenomenon. The authors developed detailed statements and questions, as well as the response measurement scales, adjusting them to the specificity of the analyzed population. They are listed in Table 3. Motive groups, taking the model approach represent dependent variables shaped by the explanatory variables (items).
3.3. Data Analysis
The purpose of the study is to identify the most important factors influencing the motives which impact on the decisions made by those who use or do not use Uber services (items in Table 3). The respondents were asked to answer the following question: “Have you ever personally purchased a (Uber) service through online sharing platforms?” The collected data show that 216 respondents answered “Yes”, 628 respondents—“No” and 159 respondents—“I do not know this platform”. The study was aimed at understanding the significance of the factors influencing the use or non-use of Uber services, as well as the power and direction of their impact. The responses “Yes” and “No” (844 respondents in total) were considered, excluding the option “I do not know this platform”. The logistic (binary) regression model was used in the analysis of empirical data, which describes the relationship between the choice or non-choice of Uber (dependent variable) and the factors determining the decision making (explanatory variables included in the specified motives).
Probabilistic logistic regression models are very often used in the research on economic choices [67,70,71,72,73,74,75,76]. If the explanatory variable is a dichotomous one (binomial, zero-one), it takes one of the two values in accordance with the following rule:
The occurrence of a specific event can be approached very broadly and in various economic contexts. This may be, e.g., the fact that an object has a certain feature, making a specific decision, choosing one of the offered options, purchasing a certain good or service, a company becoming successful in the market or its bankruptcy, etc.
The values of dependent variable in formula (1) stand for the probabilities influenced by the implementation of explanatory variable, which is described by a linear regression model with one explanatory variable in the below form:
where —model parameters; —random component presenting the following distribution .
However, it can be shown that the systematic component of the model (2), i.e., , may take values different from 0 and 1. Therefore, the theoretical values of probabilities estimated based on the model (2) may be higher than 1, lower than 0 or included in the range [0, 1], whereas , as indicated by the dependence (1), should be equal to either 1 or 0. In order to ensure the accuracy of the results obtained using model (2), the logit transformation of probability is performed.
The logistic regression model takes the following form:
where stands for a conditional probability meaning that dependent variable takes the value equal to 1 for the value of explanatory variable.
The logistic regression model (3) can be written down using the odds ratio in the form of a logit model:
In the analysis of empirical data collected based on the survey, a logistic regression model was used in which the dependent variable represents choosing or declining Uber services and the explanatory variables stand for the factors which determine taking this decision, included in a specific motive:
where —model parameters (regression coefficients); —explanatory variables (items); —number of explanatory variables for a specific motive.
To estimate the parameters of the logistic regression model, the concept of Generalized Linear Models (GLM) proposed in the article [77] and developed in the monograph [78] is used.
The parameters of the logistic regression model (5) can be interpreted in terms of probability taking into account the sign of the parameter + or − ( or ). The sign of the parameter informs about the direction of the explanatory variable influence on the values of the dependent variable (Y = 1 or Y = 0):
- an increase in the value of the explanatory variable with a positive parameter () increases the probability of answering “Yes” (taking the value 1 by Y dependent variable);
- an increase in the value of the explanatory variable with a negative parameter () increases the probability of answering “No” (taking the value 0 by Y dependent variable).
The parameters of the logistic regression model can also be interpreted in terms of the odds ratio. In such a case the Equation (5) takes the below form:
The left side of the Equation (6) means the chance of taking the value of 1 by Y dependent variable (choosing Uber). The numerical values of the odds ratios are calculated based on exponential expression in which the power exponent is the estimated value of the () parameter. If the value of the explanatory variable increases by a unit, then the chance of taking the value of 1 by Y dependent variable will change (increase, decrease) by times. The interpretation of the numerical values of the odds ratios is provided below:
- if , then the influence of the variable value on the choice of option 1 is positive (higher odds ratio);
- if , then the influence of the variable value on the choice of option 1 is negative (lower odds ratio);
- if then the influence of the variable value on the choice of option 1 is neutral (the odds ratio remains unchanged).
A logistic regression model was estimated for the factors determining either choosing or not choosing Uber broken down into 6 groups of motives. The dependent variable takes the values of 1 or 0 (844 observations in total). Defining the value of Y dependent variable—using or not using Uber services:
- Y = 1—respondents using Uber (transport)—216,
- Y = 0—respondents not using Uber (transport)—628.
The explanatory variables were assigned to the six motives using the specificity of the questions answered by the respondents (see Table 3). In the questionnaire, the respondents’ answers to the questions representing the explanatory variables (items) were measured using the Likert scale in the range from 7—“I definitely agree” to 1—“I definitely disagree”.
The significance of the entire model was assessed based on the likelihood ratio (LR) test. The test statistics takes the following form:
where model1—less restrictive model; model2—more restrictive model; loglik—the natural logarithm of the likelihood function for the estimated model.
The LR statistics has distribution with the number of degrees of freedom equal to the number of explanatory variables.
4. Results
4.1. Sample Analysis
The representation of both genders were among 1003 surveyed Poles (Table 4), with the largest age group representing between 26 and 35 years of age (over 24.3% indications). The majority of the respondents were secondary education graduates (the total of over 36.7% respondents). Residents of villages constituted the largest group of the respondents (39.9%). Among the remaining respondents, the dominant group included people living in medium-sized cities (taking into account Polish conditions) from 21 to 100,000 residents. Three-person households were dominant (28.5%). Approximately 50% of the respondents did not have minor children. The majority (approximately 75%) of the respondents had a monthly net income per person in a household lower than the average net salary in Poland (PLN 3938 October 2020). Two thirds of the respondents owned a car, and every fourth respondent was not using a car.
The representation of the surveyed sample allowed determining the actual indicator of meeting transport needs of Poles via the Uber platform. It amounted to 21.5%, which indicates that every fifth Pole uses Uber services. The demographic and socio-economic characteristics of Uber users and non-users are presented below (Table 4).
Regarding Uber users, it should be stated that they include: women and men, young people (between 18 and 35 years of age), secondary education graduates living in Mazowieckie, Wielkopolskie and Śląskie regions and in a large city with more than 100,000 residents (in Poland out of the total of 954 cities, 36 cities are inhabited by over 100,000 residents). Comparing the data on the place of residence by the city size and the region indicates that the average Uber user lives in Warsaw (1,794,166 residents) or Poznań (532,048 residents). Along with the city size, the number of Uber users increases against the non-users, whereas the number of non-users increase with age. The majority of Uber users live in a household consisting of three or four members, with one child up to the age of 18, with a monthly net income amounting to PLN 2001–3000 per household member. A total of 69% of the respondents own a car, and every fifth car is not used. Referring the latest data to non-users, the findings show an interesting correlation that the majority of people not using Uber do not use their own car either.
4.2. Findings
Taking into account the sign of the estimated parameter in model (5) describing the impact direction regarding the probability of choosing Uber services (estimate) and the odds ratio value describing the chance of choosing Uber services (odds ratio), the most important factors stimulating the choice of Uber services in the groups of motives (Knowledge, Innovativeness, Sustainability, User Convenience and Savings) are as follows:
- K1. I have knowledge of the services offered by sharing platforms;
- I3. Direct contact with Uber drivers facilitates acquiring new skills, e.g., linguistic, culinary, etc.;
- I1. Currently, using the services purchased through sharing platforms is trendy/fashionable;
- S5. I use the services purchased through sharing platforms which replace the inaccessible traditional services;
- S4. The services purchased through sharing platforms allow immersing in everyday life of the residents and the authentic culture of the places I visit.;
- S3. Using the services purchased through sharing platforms results in direct benefits for the residents of the locations;
- C1. Uber means no parking problems and fees.
The factors that also positively, but less clearly, influence the choice of Uber services in the groups of motives (Enjoyment, Innovativeness, User Convenience and Savings, Knowledge of ICT) include:
- 8.
- E1. I enjoy using Uber platform;
- 9.
- I2. Using the services purchased through sharing platforms is an expression of modern lifestyle;
- 10.
- C4. Travel time with Uber is shorter than using public transport;
- 11.
- K3. I can use mobile applications for sharing platforms;
- 12.
- C5. Traveling with Uber is cheaper than using a traditional taxi.
In the case of other factors, both the sign of the estimated parameter describing the impact direction regarding the probability of choosing Uber services (estimate) and the odds ratio value describing the chance of choosing Uber services (odds ratio) indicate that the increasing values of these items reduce the likelihood of using Uber services or their impact remains neutral. The most important factors are as follows: E4, C2, E3, R4, R3 and C3, and they characterize non-Uber choices. The detailed results are presented in Table 5 (the factors stimulating the choice are presented at the grey background).
Among the factors having the strongest impact on the choice of Uber services, three represent the Sustainability motive, which allows adopting the H1 hypothesis.
Other factors significantly affecting the probability of using Uber services belong to the following groups of motives: Knowledge of ICT, Innovativeness, User Convenience and Savings, which means positive verification of H2 hypothesis.
Factors that reduce the probability of using Uber services included the groups of Enjoyment and Risk and trust motives, which allow us to adopt the H3 hypothesis.
5. Discussion and Conclusions
The conducted research provides interesting conclusions. Among the most important motives, the Sustainability group remains the most numerous. The choices of Uber services are significantly influenced by the reasons related to two sustainability pillars—social and economic. For Polish Uber users, it is important to be able to use Uber services when a traditional taxi is unavailable. Shared-mobility services can, therefore, make an important contribution to solving the problem of transport and exclusion, broadly described by Church et al. [88], and optimization of the structure of urban transportation systems [89,90]. Campisi et al. [91] noticed that demand responsive or shared services can complete the public transport system. The shared mobility operators fulfill public transport gap, rather than offer a competing service (2).Uber is also attractive due to the possibility of personal contact with drivers who are perceived as residents of a given city, providing authentic experiences, knowledge about the local customs, values, and entertainment not available otherwise (social aspect). The respondents, aware that the choice of Uber services contributes to the increased income of the local population (the economic aspect of sustainability), use this type of transport services. In turn, the environmental pillar (motives related to the protection of natural environment), in the case of Polish users, slightly reduces the chance of choosing Uber services. This is not an isolated case. In the research conducted by Chu, Hamza and Laberteaux [57]; Vaclavik et al. [66], the pro-ecological attitude was not discovered to be an important factor in the respondents’ decisions regarding the use of call-a-ride services. Nevertheless, the results of various studies addressing this problem are not unequivocal. Alemi et al. [63] showed that people with a stronger pro-ecological attitude are more likely to use Uber. The non-homogeneity of research conclusions may result from cultural diversity of the analyzed segments. The environmental factors are not important in the decision-making process of choosing Uber services, as in the case of Brazilians surveyed by Vaclavik et al. [66].The Innovativeness group is represented by two motives, which means it has a significant positive impact on increasing the probability of choosing Uber services. On the contrary, Lee and Wong [58], in their study did not observe any significant impact of personal innovation on using these services.
The User Convenience and Savings and Knowledge of the ICT group of motives showed one significant factor each. In the economic sphere, it was a release from problems with parking and parking fees. Similarly, in the studies by Rayle et al. [92], one of the important motives for increasing the likelihood of using Uber services was reducing the inconvenience related to parking. The economic aspects were also highlighted in Qiu’s research, who identified the surplus of Uber consumer in San Francisco [93].
In this study, among all the motivations behind choosing Uber, the Knowledge of ICT motive, i.e., the respondents’ knowledge about the services provided by this platform turned out to be the most important one.
The following groups of motives are not represented in this study: Enjoyment as well as Risk and trust. These motives were analyzed by Vaclavik et al. [66]; however, they resulted in diverse observations. Enjoyment proved to be one of the three most critical reasons for choosing Uber, and the security risks did not prevent respondents from requesting a ride.
This is the first empirical study of the ridesharing set in Poland to employ survey data (according to [65]). It is also one of few that offer a thorough study of the motives responsible for using Uber platform services from the perspective of consumers with a particular emphasis on sustainability. The article provides a thorough review of the scientific literature. The authors identified nine publications in scientific journals addressing this problem. This constituted the basis for determining the research gap and proposing the authors’ own research instrument (scale) allowing the measurement of many aspects in an integrated manner (economic, social and ecological). As emphasized by K. Turoń [89], thus far, the focus has been mainly on economic, technical, transport, environmental and legal aspects, disregarding social elements.
6. Implications, Limitations and Future Research
The researchers indicate the evident paucity of data on SMS customers, their ways of using on-demand transport services as well as changes in their travel behavior resulting from the development of shared mobility systems [61]. Without this knowledge, it is difficult to provide a reliable assessment of the impact of SMS on the broadly approached environment, including its effects on sustainable development.
The findings resulting from this article provide useful information on the consumer decision-making processes related to shared-mobility services. The discussed significance of the motives for choosing Uber services, with particular emphasis on sustainability, can become the basis for the appropriate marketing activities to be undertaken by the organizations and local authorities promoting sustainable mobility alternatives and help transport planners to predict changes in the demand for such services and support planning changes in the city transport networks. This information may be important for the Uber platform itself in the process of improving the solutions used in promotion and also for the created image pillars. Moreover, when analyzing the results of previous studies conducted in Brazil, Canada, the USA and Australia (discussed in Table 2), the cultural differences related to motivations for choosing car-sharing services must be addressed. These discrepancies should be considered by Uber and such operators in their local promotional campaigns. Ridesourcing services may also have negative aspects that were not covered in this study, such as increased congestion or their accessibility for people with disabilities. The analysis of motives did not take into account the diversified services being provided by Uber (Uber Pool, Uber Green), which resulted from the unavailability of this type of offer in Poland at the time of conducting the research.
Because the existing research has focused on users rather than non-users, much less is known about the latter. Who are they, and why do they shun this novel mobility model? Understanding the characteristics, behaviors and motivations of non-users is quite important too, if the planning goal is to shift urban populations from private car ownership and start using ridesharing (according to [63]). In-depth research on the motives of using Uber services, user profiles, as well as barriers limiting the usage should define the direction for further research in order to understand better and use SMS to improve the efficiency of urban transport systems, social inclusion and sustainable transport development. The motives for undertaking this type of professional activity by self-employed drivers using car-sharing platforms should represent the direction to follow in future research addressing shared-mobility services.
Author Contributions
Conceptualization, D.E.J. and E.N.; methodology, A.B.; formal analysis, A.B., D.E.J. and E.N.; writing—original draft preparation, A.B., D.E.J. and E.N.; writing—review and editing, A.B., D.E.J. and E.N.; visualization, A.B., D.E.J. and E.N.; project administration, D.E.J. and E.N. All authors have read and agreed to the published version of the manuscript.
Funding
The project is financed by the Ministry of Science and Higher Education in Poland under the program “Regional Initiative of Excellence” 2019–2022 project number 015/RID/2018/19 total funding amount 10 721 040,00 PLN.
Institutional Review Board Statement
The study was conducted according to the guidelines of the Declaration of Helsinki, and approved by the Rector’s Committee of Research Ethics, Wroclaw University of Economics and Business (protocol code: 08/2021, date of approval: 20 April 2021).
Informed Consent Statement
The survey was carried out by an external survey company, and the provided database did not allow identifying the physical, physiological, genetic, mental, economic, cultural or social identity of a surveyed natural person.
Data Availability Statement
Data availability on request.
Conflicts of Interest
The authors declare no conflict of interest.
Sample Availability
Sample is available from the authors.
References
- Tesoriere, G.; Campisi, T. The benefit of engage the “crowd” encouraging a bottom-up approach for shared mobility rating. In Proceedings of the International Conference on Computational Science and Its Applications—ICCSA 2020, 20th International Conference, Cagliari, Italy, 1–4 July 2020; Springer: Cham, Switzerland, 2020; pp. 836–850. [Google Scholar] [CrossRef]
- Shaheen, S.; Wong, S. Future of Public Transit and Shared Mobility: Scenario Planning for COVID-19 Recovery. UC Office of the President: University of California Institute of Transportation Studies. 2021. Available online: https://escholarship.org/uc/item/15t657r2 (accessed on 16 May 2022). [CrossRef]
- Campisi, T.; Garau, C.; Acampa, G.; Maltinti, F.; Canale, A.; Coni, M. Developing Flexible Mobility On-Demand in the Era of Mobility as a Service: An Overview of the Italian Context Before and After Pandemic. In Proceedings of the International Conference on Computational Science and Its Applications—ICCSA 2021, 21st International Conference, Cagliari, Italy, 13–16 September 2021; Springer: Cham, Switzerland, 2021; pp. 323–338. [Google Scholar] [CrossRef]
- Chan, N.D.; Shaheen, S.A. Ridesharing in North America: Past, Present, and Future. Transp. Rev. 2012, 32, 93–112. [Google Scholar] [CrossRef]
- Shared-Use Mobility Center. TCRP Report 188: Shared Mobility and the Transformation of Public Transit. Research Analysis; Shared-Use Mobility Center (SUMC): Chicago, IL, USA, 2016. [Google Scholar] [CrossRef]
- Mohamed, M.J.; Rye, T.; Fonzone, A. UberPOOL Services—Approaches from Transport Operators and Policymakers in London. Transp. Res. Proced. 2020, 48, 2597–2607. [Google Scholar] [CrossRef]
- Shared-Use Mobility Centre. Shared-Use Mobility Reference Guide; Shared-Use Mobility Centre: Los Angeles, CA, USA, 2015. [Google Scholar]
- Uber Wykroił Połowę Rynku Przejazdów Zamawianych Przez Aplikację [Uber Cut Out Half of the App-Ordered Rides Market]. Available online: https://businessinsider.com.pl/firmy/sprzedaz/udzial-ubera-w-rynku-przejazdow-w-polsce/eyd8chm (accessed on 19 July 2021).
- Fu, X. Does heavy ICT usage contribute to the adoption of ride-hailing app? Travel Behav. Soc. 2020, 21, 101–108. [Google Scholar] [CrossRef]
- Gerwe, O.; Silva, R. Clarifying the Sharing Economy: Conceptualization, Typology, Antecedents, and Effects. Acad. Manag. Perspect. 2020, 34, 65–96. [Google Scholar] [CrossRef]
- Genç, R. Ekonomia współdzielenia i zarządzanie zrównoważonym rozwojem środowiska w sektorze turystycznym w skali globalnej [The sharing economy and environment sustainability management in tourism sector on a global scale]. Turyzm Tourism 2019, 29, 21–24. [Google Scholar] [CrossRef]
- Phipps, M.; Ozanne, L.K.; Luchs, M.G.; Subrahmanyan, S.; Kapitan, S.; Catlin, J.R.; Gau, R.; Walker Naylor, R.; Rose, R.L.; Simpson, B.; et al. Understanding the inherent complexity of sustainable consumption: A social cognitive framework. J. Bus. Res. 2013, 66, 1–8. [Google Scholar] [CrossRef]
- Reed, A. Social identity as a useful perspective for self-concept-based consumer research. Psychol. Mark. 2002, 19, 235–266. [Google Scholar] [CrossRef]
- Martin, C.J.; Upham, P.; Budd, L. Commercial orientation in grassroots social innovation: Insights from the sharing economy. Ecol. Econ. 2015, 118, 240–251. [Google Scholar] [CrossRef]
- Martin, C.J. The sharing economy: A pathway to sustainability or a nightmarish form of neoliberal capitalism? Ecol. Econ. 2016, 121, 149–159. [Google Scholar] [CrossRef]
- Barbu, C.M.; Florea, D.L.; Ogarcă, R.F.; Barbu, M.C.R. From Ownership to Access: How the Sharing Economy is Changing the Consumer Behavior. Amfiteatru Econ. 2018, 20, 373–387. [Google Scholar] [CrossRef]
- Turoń, K.; Kubik, A.; Chen, F. Electric Shared Mobility Services during the Pandemic: Modeling Aspects of Transportation. Energies 2021, 14, 2622. [Google Scholar] [CrossRef]
- Watanabe, C.; Naveeda, K.; Neittaanmäki, P. Co-evolution of three mega-trends nurtures un-captured GDP—Uber’s ride-sharing revolution. Technol. Soc. 2016, 46, 164–185. [Google Scholar] [CrossRef]
- Mounce, R.; Nelson, J.D. On the potential for one-way electric vehicle car-sharing in future mobility systems. Transp. Res. Part A Policy Pract. 2019, 120, 17–30. [Google Scholar] [CrossRef]
- Gonzalez-Padron, T.L. Ethics in the sharing economy: Creating a legitimate marketing channel. J. Market. Channels 2017, 24, 84–96. [Google Scholar] [CrossRef]
- Leighton, P. Professional self-employment, new power and the sharing economy: Some cautionary tales from Uber. J. Manag. Organ. 2016, 22, 859–874. [Google Scholar] [CrossRef] [Green Version]
- Glotz-Richter, M. Reclaim Street Space!—Exploit the European potential of car sharing. Transportation Res. Procedia 2016, 14, 1296–1304. [Google Scholar] [CrossRef]
- Cohen, B.; Kietzmann, J. Ride On! Mobility Business Models for the Sharing Economy. Organ. Environ. 2014, 27, 279–296. [Google Scholar] [CrossRef]
- Sabouria, S.; Park, K.; Smith, A.; Tian, G.; Ewing, R. Exploring the influence of built environment on Uber demand. Transp. Res. Part D Trans. Environ. 2020, 81, 102296. [Google Scholar] [CrossRef]
- Kim, K.; Baek, C.; Lee, J.D. Creative destruction of the sharing economy in action: The case of Uber. Transp. Res. Part A Policy Pract. 2018, 110, 118–127. [Google Scholar] [CrossRef]
- Young, M.; Allena, J.; Farbera, S. Measuring when Uber behaves as a substitute or supplement to transit: An examination of travel-time differences in Toronto. J. Transp. Geogr. 2020, 82, 102629. [Google Scholar] [CrossRef]
- Willis, G.; Tranos, E. Using ‘Big Data’ to understand the impacts of Uber on taxis in New York City. Travel Behav. Soc. 2021, 22, 94–107. [Google Scholar] [CrossRef]
- Murillo, D.; Buckland, H.; Val, E. When the sharing economy becomes neoliberalism on steroids: Unravelling the controversies. Technol. Forecast. Soc. 2017, 125, 66–76. [Google Scholar] [CrossRef]
- Zhang, C. China’s new regulatory regime tailored for the sharing economy: The case of Uber under Chinese local government regulation in comparison to the EU, US, and the UK. Comput. Law Secur. Rev. 2019, 35, 462–475. [Google Scholar] [CrossRef]
- Pelzer, P.; Frenken, K.; Boon, W. Institutional entrepreneurship in the platform economy: How Uber tried (and failed) to change the Dutch taxi law. Environ. Innov. Soc. Transit. 2019, 33, 1–12. [Google Scholar] [CrossRef]
- Flores, O.; Rayle, L. How cities use regulation for innovation: The case of Uber, Lyft and Sidecar in San Francisco. Transp. Res. Proced. 2017, 25, 3756–3768. [Google Scholar] [CrossRef]
- Haque, M.F.; Haque, M.A.; Islam, S. Motivational Theories—A Critical Analysis; ASA University Review; ASA University: Dhaka, Bangladesh, 2014; Volume 8. [Google Scholar]
- Acquier, A.; Daudigeos, T.; Pinkse, J. Promises and paradoxes of the sharing economy: An organizing framework. Technol. Forecast. Soc. 2017, 125, 1–10. [Google Scholar] [CrossRef]
- Möhlmann, M. Collaborative consumption: Determinants of satisfaction and the likelihood of using a sharing economy option again. J. Consum. Behav. 2015, 14, 193–207. [Google Scholar] [CrossRef]
- Dann, G.M.S. Anomie, Ego-enhancement and Tourism. Ann. Tourism Res. 1977, 4, 184–194. [Google Scholar] [CrossRef]
- Crompton, J.L. Motivations for Pleasure Vacations. Ann. Tourism Res. 1979, 6, 408–424. [Google Scholar] [CrossRef]
- March, R.G.; Woodside, A.G. Tourism Behavior: Travelers’ Decisions and Actions; CABI Publishing: Cambridge, UK, 2005. [Google Scholar]
- Hossain, M. Sharing economy: A comprehensive literature review. Int. J. Hosp. Manage. 2020, 87, 102470. [Google Scholar] [CrossRef]
- Hawlitschek, F.; Teubner, T.; Gimpel, H. Understanding the Sharing Economy—Drivers and Impediments for Participation in Peer-to-Peer Rental. In Proceedings of the 49th Hawaii International Conference on System Sciences (HICSS), Kauai, HI, USA, 5–8 January 2016; pp. 4782–4791. Available online: https://www.fim-rc.de/Paperbibliothek/Veroeffentlicht/524/wi-524.pdf (accessed on 15 July 2021).
- Böcker, L.; Meelen, T. Sharing for people, planet or profit? Analyzing motivations for intended sharing economy participation. Environ. Innovat. Soc. Transit. 2016, 23, 28–39. [Google Scholar] [CrossRef] [Green Version]
- Sung, E.; Kim, H.; Lee, D. Why Do People Consume and Provide Sharing Economy Accommodation?—A Sustainability Perspective. Sustainability 2018, 10, 2072. [Google Scholar] [CrossRef] [Green Version]
- Ranjbari, M.; Morales-Alonso, G.; Carrasco-Gallego, R. Conceptualizing the Sharing Economy through Presenting a Comprehensive Framework. Sustainability 2018, 10, 2336. [Google Scholar] [CrossRef] [Green Version]
- Chen, T.D.; Kockelman, K.M. Carsharing’s life-cycle impacts on energy use and greenhouse gas emissions. Transp. Res. Part D Trans. Environ. 2016, 47, 276–284. [Google Scholar] [CrossRef]
- Toni, M.; Mattia, G.; Renzi, M.F. Understanding the link between collaborative economy and sustainable behavior: An empirical investigation. J. Clean Prod. 2018, 172, 4467–4477. [Google Scholar] [CrossRef]
- Martin, E.; Shaheen, S. Greenhouse gas impacts of car sharing in North America; Report 09-11. In IEEE Transactions on Intelligent Transportation Systems; Mineta Transportation Institute: San Jose, CA, USA, 2010. [Google Scholar]
- Barnes, S.J.; Guo, Y.; Borgo, R. Sharing the air: Transient impacts of ride-hailing introduction on pollution in China. Transp. Res. Part D. Trans. Environ. 2020, 86, 102434. [Google Scholar] [CrossRef]
- Jung, J.; Koo, Y. Analyzing the Effects of Car Sharing Services on the Reduction of Greenhouse Gas (GHG) Emissions. Sustainability 2018, 10, 539. [Google Scholar] [CrossRef] [Green Version]
- Nijland, H.; van Meerkerk, J.; Hoen, A. Impact of Car sharing on Mobility and CO2 Emissions. PBL Netherlands Environmental Assessment Agency. PBL Publication Number 1842. 2015. Available online: http://www.pbl.nl/sites/default/files/cms/publicaties/PBL_2015_Note%20Impact%20of%20car%20sharing_1842.pdf (accessed on 28 July 2021).
- Firnkorn, J.; Müller, M. What will be the environmental effects of new free-floating car-sharing systems? The case of car2go in Ulm. Ecol. Econ. 2011, 70, 1519–1528. [Google Scholar] [CrossRef]
- Baptista, P.; Melo, S.; Rolim, C. Energy, environmental and mobility impacts of car-sharing systems. Empirical results from Lisbon, Portugal. Procedia Soc. Behav. Sci. 2014, 111, 28–37. [Google Scholar] [CrossRef] [Green Version]
- Codagnone, C. Lobbying as rhetorical framing in the ‘sharing economy’: A case study on the limits and crisis of the evidence based policy paradigm. DigiWorld Econ. J. 2017, 108, 15–44. [Google Scholar]
- Schor, J. Debating the Sharing Economy. The Great Transition Initiative (October 2014). Available online: http://www.greattransition.org/publication/debat-ing-the-sharing-economy (accessed on 14 May 2021).
- Gordo-López, Á.; de Rivera, J.; Cassidy, P.R. The measurement of the economic, social and environmental impact of Peer to Peer online platforms: The case of collaborative consumption. EMPIRIA Rev. Metodol. Cienc. Soc. 2021, 49, 87–119. [Google Scholar] [CrossRef]
- Parguel, B.; Lunardo, R.; Benoit-Moreau, F. Sustainability of the sharing economy in question: When second-hand peer-to-peer platforms stimulate indulgent consumption. Technol. Forecast. Soc. 2017, 125, 48–57. [Google Scholar] [CrossRef]
- Zalega, T. The Sharing Economy and the Behavior of Young Polish Singles: The Case of BlaBlaCar. Gospod. Narod. Polish J. Econ. 2020, 4, 105–134. [Google Scholar]
- Podgórniak-Krzykacz, A. Trippner-Hrabi, J. Motives and factors that determine city residents’ use of public bicycles. The case of Lodz, Poland. Case Stud. Transp. Policy 2021, 9, 651–662. [Google Scholar] [CrossRef]
- Chu, K.-C.; Hamza, K.; Laberteaux, K.P. An Analysis of Attitudinal and Socio-geographic Factors on Commute Mode Choice and Ride-Hailing Adoption. In Proceedings of the 97th Annual Meeting of Transportation Research Board, Washington, DC, USA, 7–11 January 2018; Available online: https://trid.trb.org/Results?q=&serial=%22Transportation%20Research%20Board%2097th%20Annual%20Meeting%22#/View/1497402 (accessed on 28 July 2021).
- Lee, C.K.H.; Wong, A.O.M. Antecedents of consumer loyalty in ride-hailing. Transp. Res. Part F Traf. Psychol. Behav. 2021, 80, 14–33. [Google Scholar] [CrossRef]
- Skowroński, A. Sustainable development as a perspective of further civilization progress. Eco Develop. Probl. 2006, 1, 47–57. [Google Scholar]
- Görög, G. The Definitions of Sharing Economy: A Systematic Literature Review. Management 2018, 13, 175–189. [Google Scholar] [CrossRef]
- Cheng, M. Sharing economy: A review and agenda for future research. Int. J. Hosp. Manag. 2016, 57, 60–70. [Google Scholar] [CrossRef]
- Buhalis, D.; Law, R. Progress in tourism management: Twenty years on and 10 years after the Internet: The state of tourism research. Tour. Manag. 2008, 24, 609–623. [Google Scholar] [CrossRef] [Green Version]
- Alemi, F.; Circella, G.; Handy, S.; Mokhtarian, P. What influences travelers to use Uber? Travel Behav. Soc. 2018, 13, 88–104. [Google Scholar] [CrossRef]
- Alemi, F.; Circella, G.; Mokhtarian, P.; Handy, S. What drives the use of ride-hailing in California? Ordered probit models of the usage frequency of Uber and Lyft. Transp. Res. Part C Emer. Technol. 2019, 102, 233–248. [Google Scholar] [CrossRef]
- Soltani, A.; Alla, A.; Khalaj, F.; Pojani, D.; Mehdizadeh, M. Ridesharing in Adelaide: Segmentation of users. J. Transp. Geogr. 2021, 92, 103030. [Google Scholar] [CrossRef]
- Vaclavik, M.C.; Macke, J.; Faturi e Silva, D. Do not talk to strangers: A study on trust in Brazilian ridesharing apps. Technol. Soc. 2020, 63, 101379. [Google Scholar] [CrossRef]
- De Souza Silva, L.A.; de Andrade, M.O.; Alves Maia, M.L. How does the ride-hailing systems demand affect individual transport regulation? Res. Transp. Econ. 2018, 69, 600–606. [Google Scholar] [CrossRef] [Green Version]
- Habib, K.N. Mode choice modelling for hailable rides: An investigation of the competition of Uber with other modes by using an integrated non-compensatory choice model with probabilistic choice set formation. Transp. Res. Part A Policy Pract. 2019, 129, 205–216. [Google Scholar] [CrossRef]
- Yan, X.; Zhao, X.; Han, Y.; van Hentenryck, P.; Dillahunt, T. Mobility-on-demand versus fixed-route transit systems: An evaluation of traveler preferences in low-income communities. Transp. Res. Part A 2021, 148, 481–495. [Google Scholar] [CrossRef]
- Gehrke, S.R.; Huff, M.P.; Reardon, T.G. Social and trip-level predictors of the pooled ride-hailing service adoption in the Greater Boston region. Case Studies Transp. Policy 2021, 9, 1026–1034. [Google Scholar] [CrossRef]
- Maddala, G.S. Limited-Dependent and Qualitative Variables in Econometrics; Cambridge University Press: New York, NY, USA, 2013. [Google Scholar]
- Cameron, A.C.; Trivedi, P.K. Microeconometrics: Methods and Applications; Cambridge University Press: New York, NY, USA, 2022. [Google Scholar]
- Winkelmann, R.; Boes, S. Analysis of Microdata; Springer: Berlin/Heidelberg, Germany, 2006. [Google Scholar]
- Agresti, A. Categorical Data Analysis, 2nd ed.; Wiley: New York, NY, USA, 2014. [Google Scholar]
- Long, J.S. Regression Models for Categorical and Limited Dependent Variables; SAGE Publications: London, UK; New Delhi, India, 1997. [Google Scholar]
- Powers, D.A.; Xie, Y. Statistical Methods for Categorical Data Analysis, 2nd ed.; Emerald Group Publishing Ltd.: Bingley, UK, 2008. [Google Scholar]
- Nelder, J.A.; Wedderburn, W.M. Generalized Linear Models. J. R. Stat. Soc. Ser. A 1972, 135, 370–384. [Google Scholar] [CrossRef]
- McCullagh, P.; Nelder, J.A. Generalized Linear Models. Monographs on Statistics and Applied Probability; Springer-Science+Business Media: New York, NY, USA, 1989. [Google Scholar]
- R Development Core Team. R: A Language and Environment for Statistical Computing. R Foundation for Statistical Computing. Available online: http://cran.r-project.org/ (accessed on 1 July 2021).
- Hothorn, T.; Zeileis, A.; Farebrother, R.W.; Cumins, C.; Millo, G.; Mitchell, D. lmtest: Testing Linear Regression Models. Available online: https://CRAN.R-project.org/package=lmtest (accessed on 1 July 2021).
- Warnes, G.R.; Bolker, B.; Lumley, T.; Johnson, R.C. Gmodels: Various R Programming Tools for Model Fitting. Available online: https://cran.r-project.org/package=gmodels (accessed on 1 July 2021).
- Long, J.A. jtools: Analysis and Presentation of Social Scientific Data. Available online: https://cran.r-project.org/package=jtools (accessed on 1 July 2021).
- Meyer, D.; Dimitriadou, E.; Hornik, K.; Weingessel, A.; Leisch, F.; Chang, C.-C.; Lin, C.-C. e1071: Misc Functions of the Department of Statistics, Probability Theory Group. 2021. Available online: https://cran.r-project.org/package=e1071 (accessed on 1 July 2021).
- Meyer, D.; Zeileis, A.; Hornik, K.; Gerber, F.; Frindly, M. vcd: Visualizing Categorical Data. 2021. Available online: https://cran.r-project.org/package=vcd (accessed on 1 July 2021).
- Kuhn, M.; Wing, J.; Weston, S.; Williams, A.; Keefer, C.; Engelhardt, A.; Coopet, T.; Mayer, Z.; Kenkel, B.; R Core Team. Classification and Regression Training. Available online: https://github.com/topepo/caret/ (accessed on 1 July 2021).
- Fox, J. An R and S-PLUS Companion to Applied Regression; SAGE Publications: Thousand Oaks, CA, USA, 2022. [Google Scholar]
- Faraway, J.J. Extending the Linear Model with R. Generalized Linear, Mixed Effects and Nonparametric Regression Models; Chapman & Hall/CRC: Boca Raton, FL, USA, 2016. [Google Scholar]
- Church, A.; Frost, M.; Sullivan, K. Transport and social exclusion in London. Transp. Policy 2000, 7, 195–205. [Google Scholar] [CrossRef]
- Turoń, K. Social barriers and transportation social exclusion issues in creating sustainable car-sharing systems. Entrep. Sustain. Issues 2021, 9, 1. [Google Scholar] [CrossRef]
- Luo, W.; Wang, Y.; Jiao, P.; Wang, Z.; Zhao, P. What Kind of Travellers Are Using Carsharing in Beijing? A Study Based on Selective Ensemble Learning. Sustainability 2022, 14, 540. [Google Scholar] [CrossRef]
- Campisi, T.; Basbas, S.; Skoufas, A.; Akgün, N.; Ticali, D.; Tesoriere, G. The Impact of COVID-19 Pandemic on the Resilience of Sustainable Mobility in Sicily. Sustainability 2020, 12, 8829. [Google Scholar] [CrossRef]
- Rayle, L.; Dai, D.; Chan, N.; Cervero, R.; Shaheen, S. Just a better taxi? A survey-based comparison of taxis, transit, and ridesourcing services in San Francisco. Transp. Policy 2017, 45, 168–178. [Google Scholar] [CrossRef] [Green Version]
- Qiu, J. What does Uber bring for consumers? Data Sci. Manag. 2021, 2, 20–27. [Google Scholar] [CrossRef]
Figure 1.
Conceptual framework and research hypotheses.


Table 1.
Searching and selecting the articles from ScienceDirect database.
| Criteria for Searching and Selecting Articles | Number of Records | Description |
|---|---|---|
| Stage 1 | ||
| Searching articles | 46.872 | Keyword used: “shared-mobility service(s)” |
| Stage 2 | ||
| Searching documents | 127 | Search limited to: titles, abstracts and keywords, article publication period 2008–2021, the additional keyword was included in this option: “Uber” |
| Stage 3 | ||
| Selecting documents | 96 | Search limited to: full text document, review and research articles written in English |
| Stage 4 | ||
| Choosing articles The most relevant articles, consistent with the research problem, were selected | 9 | At this stage, to provide high quality research resulting from the advantage of the human mind over IT programs, the authors applied the traditional approach which involved reading the content of all articles (96) selected at the previous stage. After introducing the additional key word: motive/s, the search resulted in 22 results, two of which were included in the review as the relevant ones. |
Table 2.
Article review.
| Alemi et al. [63] | |
| Purpose | To explore the factors affecting the adoption of on-demand ride services and to provide insights into the impact that the adoption of these services has on using other means of transportation. |
| Survey, sample (size, geographic focus) | An online survey N = 1975 Californian Millennials born between 1981 and 1997 (n = 1022), and Generation X born between 1965 and 1980 (n = 945)—California. |
| Theory/method | A binary logit models. |
| Findings | 1. Highly educated, older millennials, who take higher numbers of long-distance business trips and have a higher share of long-distance trips, frequent users of smartphone transportation-related apps, who have previously used these services are more likely to use (or re-choose) Uber services. 2. The individuals with stronger pro-environmental, technology-embracing and variety-seeking attitudes are more inclined to use ride-hailing. |
| Alemi et al. [64] | |
| Purpose | To investigate the factors influencing the frequency of using ride-hailing and those affecting the adoption of these services. |
| Survey, sample (size, geographic focus) | An online survey N = 1975 Californian Millennials born between 1981 and 1997, and Generation X (1965- 1980). |
| Theory/method | A probit model with sample selection and a zero-inflated ordered probit model with correlated error terms. |
| Findings | Factors driving the use of Uber include more frequent use of smartphone apps to manage other aspects of their trip, frequent recreational travel by air, lower preference for owning a vehicle, and fewer safety/security concerns. |
| Soltani et al. [65] | |
| Purpose | To examine both ridesharing users and non-users (interested and non-interested) in the context of Adelaide. |
| Survey, sample (size, geographic focus) | A secondary data from a quantitative survey with the support of the Australian CRC Research Node for Low Carbon Living (CRC-LCL). N = 422 The six major activity centers (trip attractors) of the City of Adelaide, Australia. |
| Theory/method | A logit model, PCA and MNL modelling. |
| Findings | The following factors affect ridesharing in Adelaide: transport priorities (including ease, safekeeping, velocity and fitness); socio-economic characteristics (including individual characteristics and household characteristics) and also built environment attributes (including population density; employment density; intersection density; distance to CBD; house prices, and land use mix). |
| Vaclavik et al. [66] | |
| Purpose | To identify the motivations and trust elements of ridesharing apps and analyze the weight of motivation variables in the explanation of trust in the platform service. |
| Survey, sample (size, geographic focus) | N = 485 Brazilian users of a ridesharing app (Uber dominates the sample result with 74%/n = 369). |
| Theory/method | Factor analysis for user’s motivation. |
| Findings | (1) The most significant variable that explains trust in the platform is: “Information providing”, following by platform safety and platform security. (2) Pleasant participation, enjoyment, and cheaper alternative were also significant for trusting the platform. (3) Trust in the platform is higher than trust in drivers. |
| de Souza Silva et al. [67] | |
| Purpose | To evaluate the characteristics of the Brazilian demand for ridesourcing services and to assess the potential market for ride-splitting. |
| Survey, sample (size, geographic focus) | An online questionnaire was applied via Google Forms N = 500 16 Brazilian states from all regions of the country. |
| Theory/method | A logistic regression model. |
| Findings | The results show that the majority of ridesourcing trips are replacing taxi and public transport trips. Safety and cost are the main reasons that influence the decision of sharing trips via ride-splitting. The use of larger vehicles for sharing trips can introduce competition with the public transport systems. The ridesourcing interference on collective public transportation may be more noticeable than on the individual public transport (taxis), given the much greater demand for the former. |
| Habib [68] | |
| Purpose | To investigate the factors influencing the choice of Uber. |
| Survey, sample (size, geographic focus) | A travel diary The Transportation Tomorrow Survey (collected in Fall, 2016) of the Greater Toronto and Hamilton Area (U.S.) is a 5% sample (of the household population) travel survey. N = 162,700 households and 395,885 people. |
| Theory/method | A Semi Compensatory Independent Availability Logit (SCIAL) Model. |
| Findings | 1. The mere consideration of Uber as a viable travel mode has a considerable influence on choosing it while comparing with the alternative modes. 2. Younger people consider Uber more often, and this is true for all genders. 3. Uber users were least sensitive to the travel time among all other mode users and its consideration as a travel model is influenced by its total cost. |
| Yan et al. [69] | |
| Purpose | To investigate public preferences for a mobility-on-demand (MOD) transit system versus a fixed-route transit system, with a particular focus on transportation-disadvantaged populations and to answer three questions: Do residents of low-income communities prefer a MOD transit system over a fixed-route system? What factors (e.g., the socioeconomic and demographic characteristics of a respondent, the transit services they receive currently, and their use and perception of public transit and ridesourcing services) shape their preferences? What are the potential benefits associated with MOD transit services that the individuals perceive, and what concerns do they have? |
| Survey, sample (size, geographic focus) | A stated-preference survey among the residents, neighborhoods of two low-income localities in Michigan—the City of Detroit and the Ypsilanti area (Ypsilanti Township and the City of Ypsilanti), US. n = 457 (Detroit) and n = 443 (Ypsilanti). |
| Theory/method | An ordered logit model. |
| Findings | The males, college graduates, individuals who have used ridesourcing before, and the individuals who currently receive inferior transit service from the fixed-route system are more likely to hold a more favorable perception of the MOD system. The preferences appeared to vary little by age, income, race, or disability status. The lacking access to a bank account, a smartphone, or the Internet at home or having a disability were not associated with the individual preference for MOD transit versus fixed-route. People who lack access to a mobile data plan had significantly weaker preference for MOD transit. |
| Gehrke et al. [70] | |
| Purpose | (1) to identify differences in the spatiotemporal patterns and individual characteristics of ride(1)-hailing passengers who adopt pooled versus standard exclusive services, model the individual-level social and trip-related predictors of ridesharing for different trip purposes. |
| Survey, sample (size, geographic focus) | An in-vehicle intercept survey of ride-hailing passengers. N = 944 The Greater Boston region (101 cities and towns of Metropolitan Boston), US. |
| Theory/method | Binary logistic regression models. |
| Findings | The three most popular reasons passengers stated regarding their adoption of ride-hailing services for the surveyed trips were believing in Uber/Lyft to be quicker than public transportation (60%), they did not have a car available (35%), or they stated parking is difficult or expensive (24%). The determinants of pooled ride-hailing trips were differentiated by the individual income and trip purpose. |
| Lee & Wong [58] | |
| Purpose | To investigate consumers’ traffic attitudes and behavioral responses to on-demand ride-hailing. |
| Survey, sample (size, geographic focus) | The survey link, hosted on Qualtrics, was shared on the authors’ social media platforms, i.e., LinkedIn and Facebook, and messenger groups such as WhatsApp and WeChat. N = 277 |
| Theory/method | Structural equation modelling. |
| Findings | Price consciousness, perceived usefulness, ease of use, safety risk and customer value exert a significant influence on the word-of-mouth (WOM), a manifestation of attitudinal loyalty towards ride-hailing. |
Table 3.
Measurement items.
| Motive Group | Item | Reference |
|---|---|---|
| Knowledge of ICT | K1. I have knowledge of the services offered by sharing platforms K2. I can use sharing platforms K3. I can use mobile applications for sharing platforms | [58,63,64,66] |
| Enjoyment | E1. I enjoy using Uber platform E2. It is a unique experience to use the services purchased through sharing platforms E3. Using the services purchased through sharing platforms offers an opportunity to experience adventure E4. Direct contact with Uber drivers facilitates participation in the local entertainment, rituals and customs | [63,66] |
| Innovati-veness | I1. Currently, using the services purchased through sharing platforms is trendy/fashionable I2. Using the services purchased through sharing platforms is an expression of modern lifestyle I3. Direct contact with Uber drivers facilitates acquiring new skills, e.g., linguistic, culinary, etc. | [58,63,68] |
| User convenience and savings | C1. Uber means no parking problems and fees C2. Uber’s reaction to an order is faster than that of a traditional taxi C3. Travel time with Uber is shorter than by a traditional taxi/private car C4. Travel time with Uber is shorter than using public transport C5. Traveling with Uber is cheaper than using a traditional taxi | [58,63,64,65,66,67,68,69] |
| Risk and trust | R1. Using the services purchased through sharing platforms reduces the stress of tourist travel R2. The services purchased through sharing platforms reduce the risk of contracting a disease (e.g., COVID-19) R3. Sharing personal data with platforms is dangerous R4. I’m never sure about the quality of Uber service R5. Using Uber services is dangerous | [58,64,65,66,67] |
| Sustainability | S1. Using the services purchased through sharing platforms is an alternative to a consumptive, wasteful lifestyle S2. Using the services purchased through sharing platforms is an ethical and environmentally friendly way of meeting needs S3. Using the services purchased through sharing platforms results in direct benefits for the residents of the locations I visit S4. The services purchased through sharing platforms allow immersing in everyday life of the residents and the authentic culture of the places I visit S5. The services purchased through sharing platforms replace the inaccessible traditional services | [58,64,66,67,70] |
Table 4.
The characteristics of the research sample.
| Respondents’ Particulars | Categories | All Respondents | Uber Non-Users | Uber Users | |||
|---|---|---|---|---|---|---|---|
| (N = 1003; 100%) n | % | (N = 787; 78.5%) n | % | (N = 216; 21.5%) n | % | ||
| Gender | Female | 507 | 50.5 | 402 | 51.1 | 105 | 48.6 |
| Male | 496 | 49.5 | 385 | 48.9 | 111 | 51.4 | |
| Age | 18–25 | 141 | 14.1 | 86 | 10.9 | 55 | 25.5 |
| 26–35 | 244 | 24.3 | 189 | 24 | 55 | 25.5 | |
| 36–45 | 238 | 23.7 | 190 | 24.1 | 48 | 22.2 | |
| 46–55 | 183 | 18,2 | 160 | 20.3 | 23 | 10.6 | |
| 55–60 | 120 | 12 | 95 | 12.1 | 25 | 11.6 | |
| Over 60 | 77 | 7.7 | 67 | 8.5 | 10 | 4.6 | |
| Education | Primary | 26 | 2.6 | 23 | 2.9 | 3 | 1.4 |
| Lower secondary | 38 | 3.8 | 28 | 3.6 | 10 | 4.6 | |
| Vocational | 341 | 34 | 279 | 35.3 | 62 | 28.7 | |
| Secondary | 398 | 39.7 | 304 | 38.6 | 94 | 43.5 | |
| Higher—Bachelor’s degree | 51 | 5.1 | 34 | 4.3 | 17 | 7.9 | |
| Higher—Master’s degree | 142 | 14.2 | 113 | 14.4 | 29 | 13.4 | |
| Higher—PhD | 7 | 0.7 | 6 | 0.8 | 1 | 0.5 | |
| Residence | Village | 400 | 39.9 | 333 | 42.3 | 67 | 31 |
| Up to 20,000 residents | 126 | 12.6 | 103 | 13.1 | 23 | 10.6 | |
| From 21 to 100,000 residents | 195 | 19.4 | 158 | 20.1 | 37 | 17.1 | |
| From 101 to 200,000 residents | 81 | 8.1 | 65 | 8.3 | 16 | 7.4 | |
| From 201 to 500,000 residents | 84 | 8.4 | 55 | 7 | 29 | 13.4 | |
| Over 500,000 residents | 117 | 11.7 | 73 | 9.3 | 44 | 20.4 | |
| Region of Poland (voivodship) | Dolnośląskie | 78 | 7.8 | 60 | 7.6 | 18 | 8.3 |
| Kujawsko-Pomorskie | 60 | 6 | 52 | 6.6 | 8 | 3.7 | |
| Lubelskie | 52 | 5.2 | 40 | 5.1 | 12 | 5.6 | |
| Lubuskie | 26 | 2.6 | 22 | 2.8 | 4 | 1.9 | |
| Łódzkie | 77 | 7.7 | 64 | 8.1 | 13 | 6 | |
| Małopolskie | 82 | 8.2 | 61 | 7.8 | 21 | 9.7 | |
| Mazowieckie | 130 | 13 | 96 | 12.2 | 34 | 15.7 | |
| Opolskie | 27 | 2.7 | 24 | 3 | 3 | 1.4 | |
| Podkarpackie | 62 | 6.2 | 53 | 6.7 | 9 | 4.2 | |
| Podlaskie | 29 | 2.9 | 26 | 3.3 | 3 | 1.4 | |
| Pomorskie | 56 | 5.6 | 35 | 4.4 | 21 | 9.7 | |
| Śląskie | 127 | 12.7 | 101 | 12.8 | 26 | 12 | |
| Świętokrzyskie | 21 | 2.1 | 17 | 2.2 | 4 | 1.9 | |
| Warmińsko-Mazurskie | 38 | 3.8 | 36 | 4.6 | 2 | 0.9 | |
| Wielkopolskie | 95 | 9.5 | 65 | 8.3 | 30 | 13.9 | |
| Zachodnio-pomorskie | 43 | 4.3 | 35 | 4.4 | 8 | 3.7 | |
| Number of household members | 1 person | 76 | 7.6 | 64 | 8.1 | 12 | 5.6 |
| 2 persons | 259 | 25.8 | 214 | 27.2 | 45 | 20.8 | |
| 3 persons | 286 | 28.5 | 216 | 27.4 | 70 | 32.4 | |
| 4 persons | 225 | 22.4 | 170 | 21.6 | 55 | 25.5 | |
| 5 persons | 100 | 10 | 79 | 10 | 21 | 9.7 | |
| 6 persons or more | 57 | 5.7 | 44 | 5.6 | 13 | 6 | |
| Number of children up to the age of 18 in a household | Not even one | 494 | 49.3 | 396 | 50.3 | 98 | 45.4 |
| 1 child | 236 | 23.5 | 165 | 21 | 71 | 32.9 | |
| 2 children | 139 | 13.9 | 115 | 14.6 | 24 | 11.1 | |
| 3 children | 49 | 4.9 | 39 | 5 | 10 | 4.6 | |
| 4 children | 9 | 0.9 | 8 | 1 | 1 | 0.5 | |
| 5 children | 0 | 0 | 0 | 0 | 0 | 0 | |
| 6 and more children | 0 | 0 | 0 | 0 | 0 | 0 | |
| No answer | 76 | 7.6 | 64 | 8.1 | 12 | 5.6 | |
| Monthly net income per person in a household (PLN) | Up to 1000 | 143 | 14.3 | 128 | 16.3 | 15 | 6.9 |
| 1001–2000 | 304 | 30.3 | 248 | 31.5 | 56 | 25.9 | |
| 2001–3000 | 304 | 30.3 | 222 | 28.2 | 82 | 38 | |
| 3001–4000 | 123 | 12.3 | 91 | 11.6 | 32 | 14.8 | |
| 4001–5000 | 66 | 6.6 | 49 | 6.2 | 17 | 7.9 | |
| Over 5000 | 63 | 6.3 | 49 | 6.2 | 14 | 6.5 | |
| Owning/ using a car | My property | 670 | 66.8 | 521 | 66.2 | 149 | 69 |
| Leased | 9 | 0.9 | 8 | 1 | 1 | 0.5 | |
| Borrowed from family/friends | 57 | 5.7 | 37 | 4.7 | 20 | 9.3 | |
| I don’t use the car | 267 | 26.6 | 221 | 28.1 | 46 | 21.3 | |
Table 5.
Logistic regression model estimation results for motive groups.
| Variable | Estimate | Std. Error | z Value | Pr(>|z|) | odds.ratio |
|---|---|---|---|---|---|
| Knowledge of ICT | |||||
| K1 | 0.166 | 0.053 | 3.118 | 0.002 | 1.181 |
| K2 | −0.056 | 0.056 | −0.99 | 0.322 | 0.946 |
| K3 | 0.014 | 0.057 | 0.237 | 0.812 | 1.014 |
| Enjoyment | |||||
| E1 | 0.028 | 0.045 | 0.623 | 0.533 | 1.028 |
| E2 | −0.063 | 0.074 | −0.847 | 0.397 | 0.939 |
| E3 | −0.131 | 0.082 | −1.587 | 0.113 | 0.877 |
| E4 | −0.186 | 0.075 | −2.475 | 0.013 | 0.831 |
| Innovativeness | |||||
| I1 | 0.131 | 0.079 | 1.648 | 0.099 | 1.14 |
| I2 | 0.035 | 0.085 | 0.41 | 0.682 | 1.035 |
| I3 | 0.124 | 0.074 | 1.667 | 0.096 | 1.132 |
| User Convenience and Savings | |||||
| C1 | 0.053 | 0.079 | 0.666 | 0.505 | 1.054 |
| C2 | −0.146 | 0.07 | −2.078 | 0.038 | 0.864 |
| C3 | −0.092 | 0.058 | −1.592 | 0.111 | 0.912 |
| C4 | 0.024 | 0.083 | 0.292 | 0.771 | 1.024 |
| C5 | 0.007 | 0.079 | 0.089 | 0.929 | 1.007 |
| Risk and trust | |||||
| R1 | −0.002 | 0.066 | −0.028 | 0.978 | 0.998 |
| R2 | −0.031 | 0.044 | −0.706 | 0.48 | 0.969 |
| R3 | −0.096 | 0.051 | −1.885 | 0.059 | 0.908 |
| R4 | −0.098 | 0.047 | −2.096 | 0.036 | 0.907 |
| R5 | −0.043 | 0.048 | −0.904 | 0.366 | 0.958 |
| Sustainability | |||||
| S1 | −0.02 | 0.064 | −0.319 | 0.75 | 0.98 |
| S2 | −0.048 | 0.072 | −0.659 | 0.51 | 0.953 |
| S3 | 0.08 | 0.073 | 1.101 | 0.271 | 1.084 |
| S4 | 0.115 | 0.077 | 1.503 | 0.133 | 1.122 |
| S5 | 0.121 | 0.08 | 1.512 | 0.13 | 1.128 |
| Likelihood ratio test #Df LogLik Df Chisq Pr(>Chisq) 1 26 −437.77 2 1 −480.03 −25 84.518 2.198 × 10⁻⁸ | |||||
Publisher’s Note: MDPI stays neutral with regard to jurisdictional claims in published maps and institutional affiliations. |
© 2022 by the authors. Licensee MDPI, Basel, Switzerland. This article is an open access article distributed under the terms and conditions of the Creative Commons Attribution (CC BY) license (https://creativecommons.org/licenses/by/4.0/).
Share and Cite
MDPI and ACS Style
Bąk, A.; Nawrocka, E.; Jaremen, D.E. “Sustainability” as a Motive for Choosing Shared-Mobility Services: The Case of Polish Consumers of Uber Services. Sustainability 2022, 14, 6352. https://0-doi-org.brum.beds.ac.uk/10.3390/su14106352
AMA Style
Bąk A, Nawrocka E, Jaremen DE. “Sustainability” as a Motive for Choosing Shared-Mobility Services: The Case of Polish Consumers of Uber Services. Sustainability. 2022; 14(10):6352. https://0-doi-org.brum.beds.ac.uk/10.3390/su14106352
Chicago/Turabian StyleBąk, Andrzej, Elżbieta Nawrocka, and Daria E. Jaremen. 2022. "“Sustainability” as a Motive for Choosing Shared-Mobility Services: The Case of Polish Consumers of Uber Services" Sustainability 14, no. 10: 6352. https://0-doi-org.brum.beds.ac.uk/10.3390/su14106352
Note that from the first issue of 2016, this journal uses article numbers instead of page numbers. See further details here.