Article

The Land Use and Individual Correlates of Pedestrian Commuting: Who Walks to Their Work or Place of Study in the Large Cities of the MENA Region?

by
Houshmand Masoumi
1,2,* and
Grzegorz Sierpiński
3
1
Center for Technology and Society, Technische Universität Berlin, Kaiserin-Augusta-Allee 104, 10553 Berlin, Germany
2
Department of Transport and Supply Chain Management, College of Business and Economics, Kingsway Campus, University of Johannesburg, Cnr Kingsway and University Road Auckland Park, Johannesburg 2006, South Africa
3
Department of Transport Systems, Faculty of Transport and Aviation Engineering, Traffic Engineering and Logistics, Silesian University of Technology, Akademicka Str. 2A, 44-100 Gliwice, Poland
*
Author to whom correspondence should be addressed.
Sustainability 2022, 14(10), 6377; https://0-doi-org.brum.beds.ac.uk/10.3390/su14106377
Submission received: 2 February 2022 / Revised: 18 May 2022 / Accepted: 19 May 2022 / Published: 23 May 2022
(This article belongs to the Special Issue Urban Mobility and Active Transport Transition)

Abstract

:
The body of research on the determinants of pedestrian commuting and the characteristics of on-foot commuters at the international level and especially in the Global South is inconsistent; hence, this study focuses on this topic with the case of megacities in the Middle East and North Africa. The study is based on 8284 face-to-face interviews with respondents in the three cities, 4543 of whom worked, and of those 4543, 658 individuals walked to their work or place of study. By using binary logistic regression, the determinants of walking to work were identified. Age, household car ownership, last relocation time, intersection density, number of accessed facilities from home, average walking accessibility to neighborhood amenities, and commuting distance are the significant determinants of on-foot commuting. The study identifies younger commuters with fewer cars or no driving license living in neighborhoods with connected street networks as the walkers. The results of the Mann–Whitney U Test show that there is a significant difference between the values of these determinants for walking commuters and those who commute by other modes. Based on these findings, this paper encourages urban planners and decision-makers of the MENA region to use urban land use, including street networks and access to local facilities, to motivate commuters to commute on foot, especially those who work within a walkable distance to their work or place of study.

1. Introduction

Having a precise image of the determinants, motives, and barriers of walking behavior is of absolute importance to urban transportation planners for enhancing the modal share of active mobility versus motorized transportation. The socioeconomic and individual/household factors may be the most significant predictors of walking in different geographic and cultural contexts. So far, sociodemographic factors such as age, gender, household income, and car ownership have been found important in defining the propensity to walking [1,2,3,4,5,6]. For example, in Nigeria, the most important determinants of walking are non-possession of personal vehicles, income, trip length, travel costs, and health benefits [7]. The second factor, which may have an influence on the motivation of passengers to walk to their destinations, is related to the built environment characteristics. Density, diversity, and mixed land use have been addressed as important correlates of walking [1,8,9]. The characteristics of the urban environment related to design, safety, destinations, and aesthetics, such as track length, having paths located closer to roads, fewer buildings with driveways, a greater presence and variety of destinations and views of shops, fewer industry buildings, offices, and/or schools, are associated with walking time in local environments in Australia [10]. This finding echoes older findings that density, diversity, design, ambiance, and esthetics [11], as well as climate and topography [12], are significant determinants of walking. In the literature, a holistic approach can be found, in which both subjective and objective measures of the walkability of the urban environments have been important to form the walking behaviors of senior citizens in Toronto, Canada [13]. This highlights the importance of the very crucial partnership of both land use and the psychological aspects of the urban environment, which together inform the concept of walkability.
Nevertheless, most of such studies do not differentiate between the purposes of walking behaviors. These include non-commute or commute walking trips. The studies that focus on one of the above purposes often focus on non-work travels. For instance, Chaix et al. examined the environmental correlates of neighborhood-based recreational walking in Paris [14]. They found green/open spaces of quality, building communities with services accessible to the residents, and addressing environmental nuisances important in the promotion of recreational walking in one’s environment. In Scotland, seasonality affects utilitarian walking behavior (different purposes of walking—to work, for shopping, to see friends, etc.); residents of urban and rural areas are affected by this factor differently [15]. However, as mentioned above, these findings focus on non-commute trips (or are considered together with commute trips), while the determinants of walking towards a workplace comprise a smaller share of the studies. In one of the rare studies on work-based walking trips, Gehrke and Welch studied the built environment determinants of activity participation and walking behavior, such as sub-tour walking near the workplace in Portland, Oregon, and found increased residential density around the workplace a motive for such walking activities [16]. Such walking towards non-work destinations around the workplace may lead to reducing the non-work trips during the rest of the day [17]. This suggests that a combination of commute and non-commute purposes are fulfilled by walking in the vicinity of the workplace. As seen, walking pedestrian sub-tours are still far away from everyday commuting.
Among built environment elements, some factors such as mixed land use and density are the conventional measures in studies examining pedestrian behaviors. In addition, street connectivity has been more or less studied as a correlate of walking behavior, but it has received relatively less attention. In one of the studies addressing land use and street connectivity, a US study concluded that there are increased odds of travel walking in higher-density areas and increased odds of leisure walking in low-connectivity areas [18]. Factors that influenced the perception of the neighborhood and had an impact on travel mode choice were related to sufficient sidewalks, traffic signals that gave enough time to cross the streets, access to public transit (number of bus stops), mixed land use, street network connectivity, and the area being pedestrian-friendly [19]. However, such knowledge is only about non-work walking trips, while commute walking trips are still less researched. In the study by Zhang et al. (2021) [20], a different area was selected—Beijing, China. In this case study, comparatively to US studies, high density and fast-growing population may increase car dependence.
All but one (on Nigeria) of the above existing studies have been conducted on high-income countries. This is true about the topic of the determinants of walking, either to work or for other purposes, such as several other travel behavior subjects. Unsurprisingly, in contexts such as the Middle East and North Africa (MENA) region, there is no consistent knowledge about the topic. The scarce existing literature on the MENA region provides a blurred understanding of the topic, e.g., we have limited knowledge presented by a study on the northern city of Rasht in Iran about the associations of walking to or from work with perceptions of walking distance and about the socioeconomic reasons of walking [21].
In addition, we generally know that a destination being far away, as an indicator of accessibility, is the most powerful element against walking in the large cities of the MENA region [22]. In such cities, the walking distance to the neighborhood amenities and also the number of neighborhood amenities located in the catchment area of homes are significant determinants of several travel behaviors, including making the trip for both commute and non-commute travels [23], and the commuting distances [24]. Walkable distance to neighborhood facilities and also the number of accessed facilities are also highly significantly correlated with whether or not people in Tehran, Istanbul, and Cairo choose their residential location based on mobility needs [25]. In Alexandria, Egypt (another large city of the region), walkability is among the factors based on which urban residents choose their residential location [26,27]. Moreover, we already know that in Cairo, the regular users of ridesourcing such as Uber or the local alternatives are more likely than regular users of public transport to use motorized modes instead of walking in the vicinity of their homes [28]. However, the overall determinants of pedestrian commuting in the large and populated region of MENA remain uninvestigated. This lack of empirical findings within topics is consistent with the general lack of knowledge about urban travel behaviors in the region recognized in several sub-topics such as the relations between travel decisions with socioeconomics, land use, perceptions and attitudes, urban sprawl, neighborhood design, public transportation use, active mobility, and new technologies and concepts [29].
This short introduction to the topic of this study identifies three main gaps. Firstly, the determinants of pedestrian commuting are still not precisely investigated and the previous studies are limited to the predictors of walking in general or non-work or utilitarian walking. Secondly, among the built environment determinants, street connectivity has received less attention compared to other land use factors such as density and mix of uses. Thirdly, as in many other sub-topics of urban travel behavior research, the share of developing countries and emerging markets from the international studies on the topic of walking behavior is very small.
Thus, the objective of this study is twofold. First, the paper aims to explain the determinant of commuting to work and study place in the large cities of the MENA region, exemplified by Cairo, Istanbul, and Tehran. These are the largest cities in the Middle East based on metropolitan population [30]: Cairo (capitol of Egypt)—16,300,000; Istanbul (Turkey)—13,900,000; and Tehran (capitol of Iran)—13,300,000 inhabitants. The area of each of the selected cities exceeds three thousand square kilometers [31].
As a secondary objective, the paper attempts to identify who walks to work and explain the differences of the built environment and socioeconomics of the walkers compared to non-walkers.
The paper is continued by clarifying the research methods, including the three case cities of Tehran, Cairo, and Istanbul, and the modeling and hypothesis testing methods. Then, the findings will be explained, and the results will be compared with the rare counterparts on a global scale.

2. Materials and Methods

2.1. Questions and Hypotheses

The research questions of the study included the following: (1) which land use and socioeconomic factors define walking to work or study place in the large cities of the MENA region? (2) What are the characteristics of pedestrian commuters in these cities? (3) Are the socioeconomic and built environment factors different for walkers and non-walkers for commuting trips? Before answering the above questions, it was hypothesized that land use factors have a significant association with choosing walking as the transportation mode for commuting and also that the socioeconomic issues are important in defining who walks to work or their place of study.

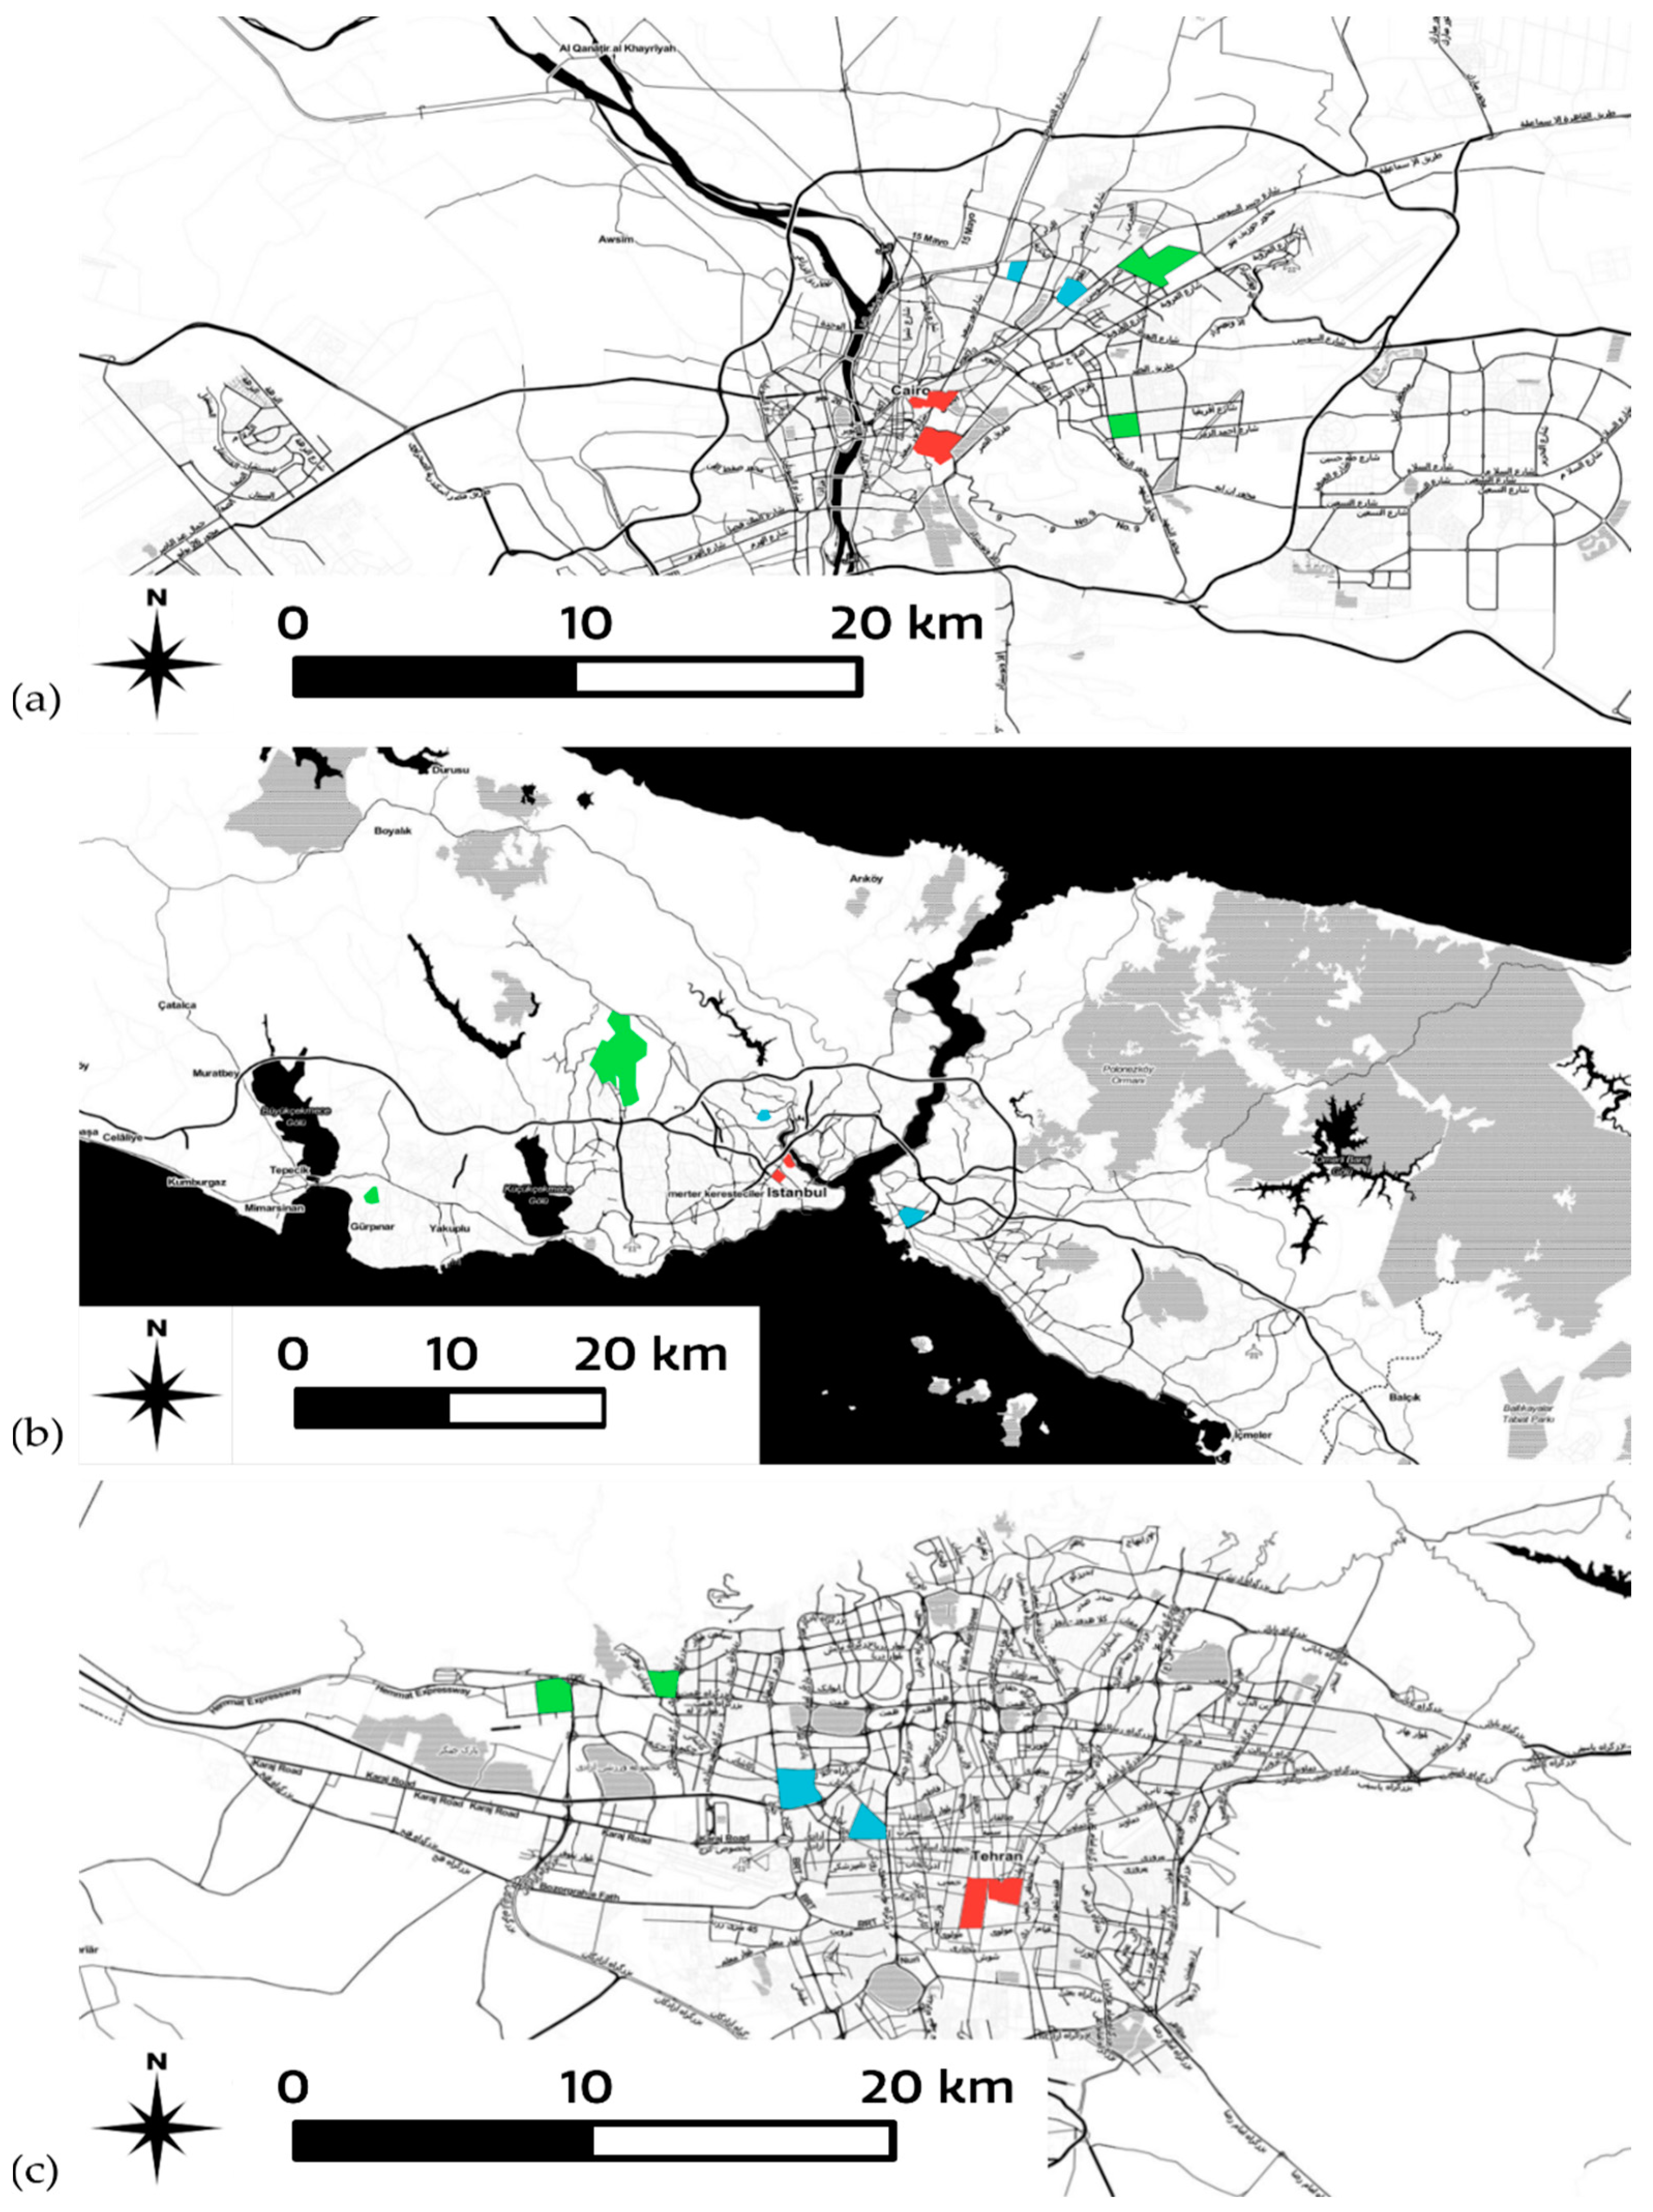
2.2. Data and Variables

The data used in this study originate from a mobility survey undertaken in 2017 in 18 neighborhoods of three megacities of the MENA region, namely, Cairo, Istanbul, and Tehran. The three megacities of the MENA region were selected because of some contextual specifications related to culture, geographies, and mentality of people, as well as land use. These characteristics make it possible to put the three cities in one pot and analyze the pedestrian walking behaviors collectively and compare them with the context of Western or higher-income countries. One important characteristic of the selected cities is their population and area, which may distinguish them from mid-sized or small cities not only in other contexts but also in the MENA region. On the other hand, when going into details of travel behaviors, it is possible to find dissimilarities, some of which have been focused in this paper. All in all, the case selection facilitates finding both similarities and differences across the three cities.
The survey reflects the results of 8284 face-to-face interviews: 2786 in Cairo, 2781 in Istanbul, and 2717 in Tehran. Figure 1 depicts the locations of the 18 neighborhoods in the 3 case cities. Between 436 and 476 adults were interviewed in each case-study neighborhood. The neighborhoods were selected by a special criterion based on the location of the neighborhood and the surrounding land use. Two of the neighborhoods of each city were in the compact areas of the central parts around the historical core, two were in areas in the marginal areas, and two were in transitional areas with combined traits. The compact neighborhoods were near to the central parts of the cities, where the street networks are not completely geometric and most of the time have broken forms and, sometimes, dead ends. The second urban form type included neighborhoods that were shaped between the early years of the twentieth century to around 1980, where there are a variety of compact, old districts with semi-complete gridirons. Finally, the third group of urban forms were newer districts built after 1980 suitable for car use; they have the specifications of new quarters with complete grid street network. The data were collected using a questionnaire consisting of 31 questions in 6 sections of socioeconomics and household profiles, commute and non-commute travel habits, perceptions about the urban environment, walking and biking infrastructures, and causes of mode choices. Land-use variables were generated by Geographic Information Systems (GIS) with a strong focus on the street network configuration. The overall number of the generated variables was 49, including 29 socioeconomic, perception, and mobility variables and 16 land-use variables. The confidence levels were calculated based on whether the questions targeted the responding individual or also his household. As a result, the neighborhood-level confidence levels were 4.5% to 4.7% for individual variables and 1.8% to 2.4% for household variables. The data were undertaken in a way that a neighborhood-level representativeness was resulted by covering between 0.39 and 7.84 percent of the neighborhood population when estimating the percentages based on the individuals and between 1.37 and 33.71 percent for the households [32]. Out of 8284 respondents in the three cities, 4543 of them worked and answered the commute mode choice question at the same time. Thus, the overall sample size for this study is 4543 subjects, out of whom 658 individuals walked to their work or study place as their dominant mode of commuting.
The main question in the questionnaire that was the basis of this study targeted the dominant commute mode choice by asking, “if you have chosen “Work and/or Study” in question 3 [a previous question], how do you often go to your work/study place? (One most important option)”, and the following 11 choices were given to the respondents: on foot, by bicycle, by motorbike, by taxi, by taxi apps, by informal public transport, by personal/household car, by bus/minibus/metrobus/microbus/BRT/van, by metro/light rail train/tram, by organizational service/shuttle, and by other means. For conducting the study, the choices were coded into a dummy form: 0 for other modes and 1 for walking; thus, the sample of commuters to work and study place was divided into two groups of walkers and non-walkers.
For the investigating the variable in question (choosing walking as commuting mode), 13 out of 49 variables were used as independent variables (12 continuous and 1 categorical). The only categorical variable was gender. Because of the nature of the research questions of this study, as independent variables and factors that can constrain walking, spatial factors as well as the commuting distances were of absolute importance.
To quantify the commuting distance, the respondents were asked to sign the nearest location or street intersection to their home place and work/study place on two maps. This was designed in this way to not violate their privacy by revealing their home and work/study place. Then, their living and work/study places were pinpointed on online maps and were transferred to ArcGIS by the research team. All the commuting distances were one-way daily commuting lengths based on the street networks. The commute lengths and the five land-use variables including intersection density, link node ratio, street length density, number of accessed facilities, and accessibility to neighborhood facilities were quantified at the 600 m catchment areas around the respondents’ homes. Threshold distances used in the literature has different range. In addition, different purposes of the distances can be assumed, such as walkability distance to the nearest public transport stop, bike rental station, car park, etc. The maximum distance is within the range between 300 and 960 m. High values were proposed by Gent and Seymonds [33], who set the access to the bus stops at 640 m, and for trams, at 960 m. Usually, the maximum acceptable distance is determined by lower values—often 300 m for the bus stop and 400 m for the tram (such as in [34,35]). A survey conducted by authors in the area of the Upper Silesian conurbation in Poland allowed them to define the value of 600 m as the greatest acceptable walking distance [36]. Table 1 summarizes the variables as well as their quantification methods. To satisfy the consistent application of land use variables in the three cities, only the variables that were available for all three cities were applied: for example, the unavailability of the GIS population density layer resulted in the elimination of this variable from the analysis. Likewise, because buses do not operate based on stations in Egypt, the accessibility to public transit variable was omitted completely. However, the applied disaggregate built environment variables provided enough insight to land use, in particular to the street network.

2.3. Analysis Methods

For answering the first research question of this study about the correlations between land use and socioeconomics with choice of walking as the commuting mode, binary logistic regression was applied by taking mode choice (walking versus not walking) as the dependent variable. The variables shown in Table 1 were applied as independent variables covering individual and household socioeconomics, street network, and accessibility predictors. The correlations of these explanatory variables were measured with the probability of changing mode from other modes (coded 0) to walking to work/study (coded 1). The individual and household socioeconomics variables were taken according to the existing literature and general pre-judgement based on the conditions of the context.
After six iterations, the model reached its best quality, including highly significant explanatory variables with the highest value of Nagelkerke pseudo R2. The five variables of gender, household income, number of driving licenses in household, individual driving license, and street length density were eliminated from the model. Then it was decided that the final model is the best fit. The validity test of the model was performed by Omnibus test of model coefficients, where p-values of less than 0.05 indicated a valid model.
For identifying the characteristics of the walkers from non-walkers (question 2), their descriptive statistics were analyzed, where most of the examined variables were continuous, and few, such as gender, were categorical (dummy in this case). By using these statistics, not only the individual and household attributes of the walkers but also their street network and accessibility were investigated.
Finally, for finding significant differences between the explanatory variables for walkers and non-walkers, the nonparametric method of Mann–Whitney U test was applied because the results of the Kolmogorov–Smirnov and Shapiro–Wilk tests showed that all the variables were non-normal (p < 0.001) [32]. p-values of less than 0.05 rejected the null hypothesis of the similarity of the variables across walkers and non-walkers and led to the acceptance of existence of difference between them based on the significance level of 0.05.

3. Results

3.1. Determinants of Pedestrian Commuting

After eliminating the insignificant explanatory variables, the final binary logistic model shows that seven independent variables related to individual, household, street connectivity, and accessibility determine pedestrian commuting in the overall sample of Tehran, Istanbul, and Cairo. These include age, household car ownership, last relocation time, intersection density, number of accessed facilities from home, average walking accessibility to neighborhood amenities, and commuting distance, which are all highly significant (p < 0.001). Table 2 summarizes the model fit and the significance of the predictors. These predictors provide a response to the first research question of this study.
Younger people are more likely to walk to work or their study place. A one-year increase in the age of the respondents of the survey increases the probability of walking by 1.7%. As expected, household car ownership is also highly negatively related to the commuting mode choice. A one-car increase in the household car ownership is associated with a 39.6% likelihood of changing the commuting mode choice from other modes to walking. Respondents who have lived in their current home for longer times are highly significantly likely to walk to work/study place by 3% for each year of residing in the current home.
The influence of street connectivity has also been depicted in the model by the intersections density represented by the number of junctions in a hectare. By increasing the number of intersections in each hectare of the built-up area, the odds of walking increases by 6.5% (p = 0.0096). The two variables representing accessibility to neighborhood amenities of the first mile are both highly significant in the model. A one-amenity increase in the number of accessed facilities such as bakeries, religious buildings, schools, etc., within the catchment area of 600 m from the home of the respondents in the overall sample increases the probability of walking to work or study by 5.4%. The distance to the neighborhood amenities is highly significantly associated with walking, but it is unexpectedly positively correlated. Finally, as expected, commuting distance is negatively and highly significantly correlated with the odds of walking to work or study. A one-kilometer increase in the commuting distance is likely to change the commute mode choice from walking to other modes by 57.6%.
The binary logistic model has a good Nagelkerke R2 of 41.8%, meaning that 41.8% of the variance in the dependent variable, i.e., using walking or other modes for reaching the work/study places, can be explained by the model (Table 2). The results of the Omnibus test of the model coefficients show that the model is valid (p < 0.0001).

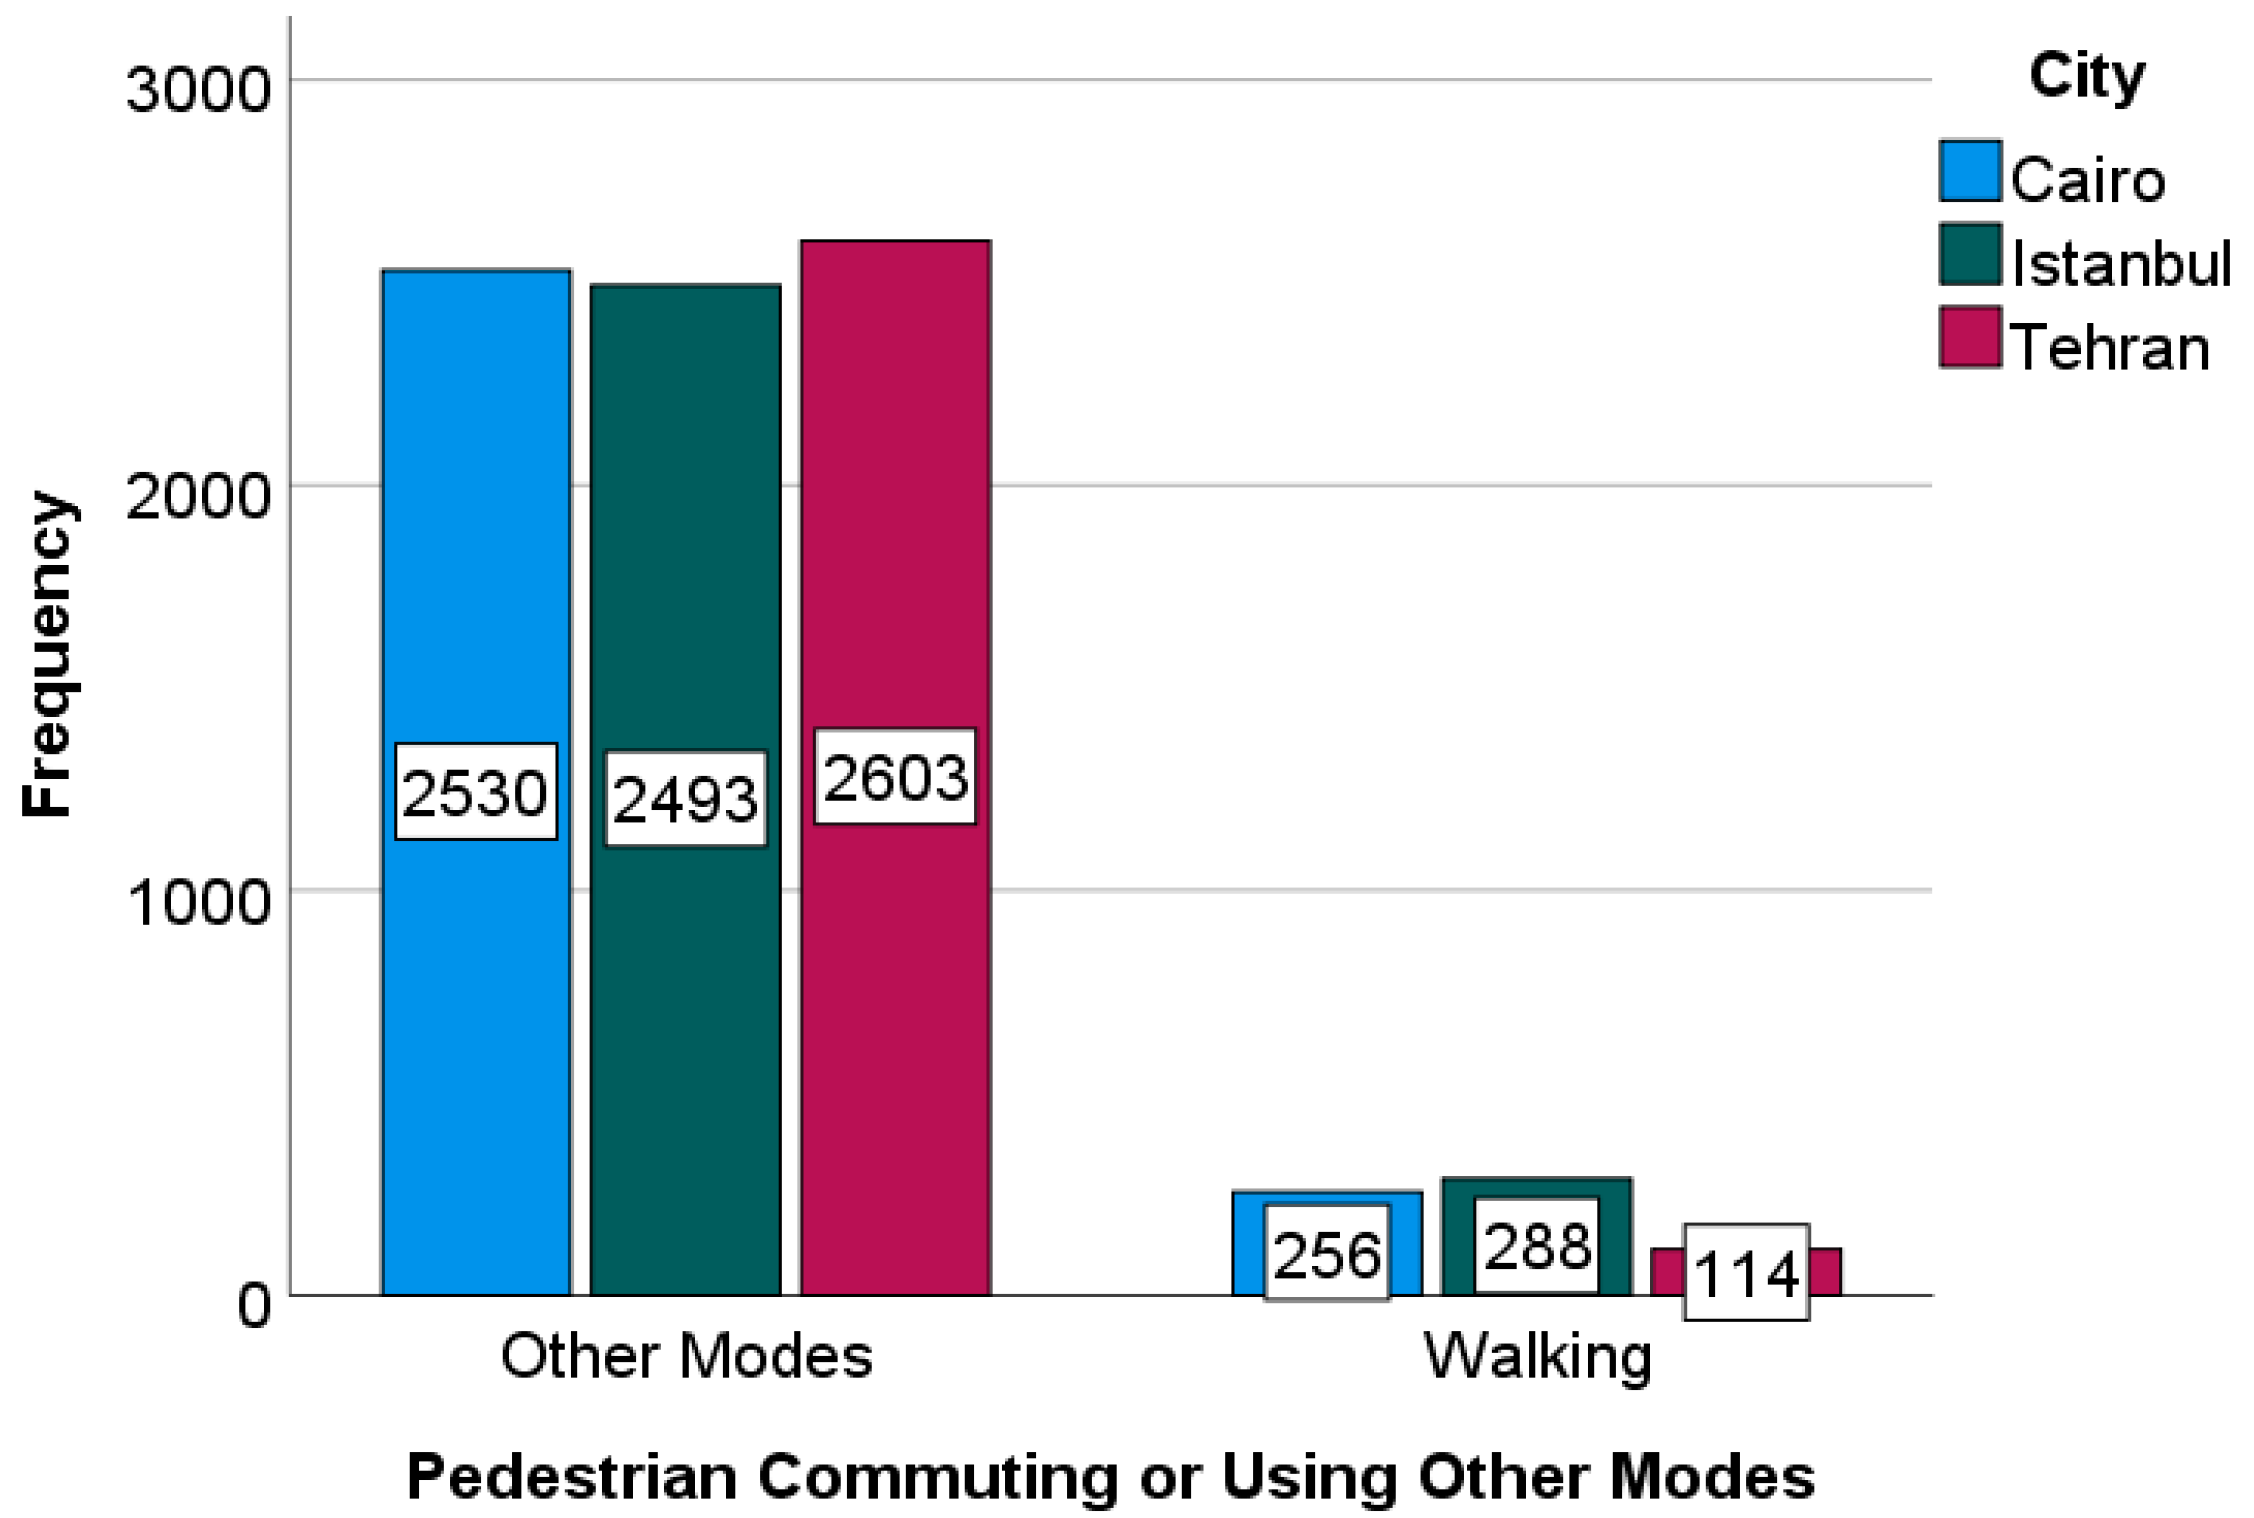
3.2. Who Walks to Work or Study Place?

Out of 7626 adults who are employed and/or have chosen walking as their dominant mode of commuting, 658 individuals often walk to work, resulting in a share of 8.6%. Figure 2 illustrates the share of walkers in the three case cities. The frequency of walkers in Cairo, Istanbul, and Tehran can be translated to 10.1%, 11.6%, and 4.4%, respectively.
Except gender, all the other explanatory variables in the binary logistic model used for answering the research question 1 are continuous, the descriptive statistics of which have been summarized in Table 3. The two categorical variables used for the original model were gender and possession of individual driving license, although both were eliminated because they were insignificant. The share of females who worked or studied in the overall sample were 34.4%, and 62% of the respondents who worked possessed a driving license. As seen in the Table 3, with an average age of nearly 33 years, walking commuters are almost middle-aged, and the standard deviation of nearly 15 years shows that they may have very different ages. Their household car ownership is less than one (0.71 cars per household). However, they have a mean of 1.55 driving licenses per household. Their average household gross income of EUR 3613.44 can be compared to their average household gross living costs of EUR 3217.22 (which has not been shown in the table, as it was not used as an explanatory variable). As expected, the average number of their commuting trips in seven days is much more than non-work trips: 11.83 versus 2.35. The walking workers have been living in their current home for a long time: a mean of 19.12 year with a standard deviation of 14.75 years. Like the model fit of the previous sub-section, this figure shows that people who have been living in a house for a long time are likely to walk to work or their study place. There is a mean of 4.84 intersections per hectare in the vicinity of their home location. This mean is nearer to the minimum of 0.349 than the maximum of 11.41 intersections. The proportion of the number of streets to junctions in the catchment area of their living place is 1.52, meaning that there are more than one and a half streets for each intersection near their home. The lengths of streets located near to their home place is approximately 338 m in each hectare. The walkers have access to 15.88 neighborhood facilities located within 600 m of their living place. These neighborhood amenities are located in an almost short distance to their homes: 1277 m measured on the street network. This seems to be a walkable distance for them. Finally, their mean commuting distance is 2146 m, which is considered to be a walkable distance for commuting in a daily basis. This characteristic is very much expected.

3.3. Differences between Walkers and Non-Walkers

The Mann–Whitney test shows interesting results about the significant differences between the individual, household, and land use characteristics of the walkers and non-walkers. This non-parametric test shows the difference between the mean rank of the variables for walkers versus non-walkers. Table 4 shows the mean rank of the explanatory variables some of the individual, household, and land use variables of this study for walkers to work/study and non-walkers. The sub-samples of the explanatory may slightly be different from the figures written in Table 3 because of the requirements of the Mann–Whitney U test. The results of the Mann–Whitney U test show that the mean rank of household average income is significantly and all other explanatory variables are highly significantly (p < 0.001) different for individuals who walk to work or study place versus those who use other modes (Table 5). Table 4 and Table 5 report only the significant differences found between walkers and non-walkers, while variables with insignificant results have been eliminated.
According to these results, individuals who walk to work/study are generally younger, have lower income, live in neighborhoods with more connected street networks with greater lengths of streets, and who live nearer to their work/study places compared to people who use other modes of commuting. Moreover, their families have less monthly income, fewer number of driving licenses in the household, and have lived in their current home for a longer time compared to non-walkers.

4. Discussion

The modal shares of walking to work in Cairo, Istanbul, and Tehran (10.1%, 11.6%, and 4.4%) are higher that the counterparts in a Dutch sample which equals to 4.3% [38]. In the first glimpse, it may be surprising because the Netherlands is well known for the considerable share of active transportation. The share of walking trips in the country is 17% [38], but these travels include both commute and non-commute activities. This shows that the share of walking trips for reaching work or a study place can be considerably lower than the share of non-work trips also in the MENA sample. It is hard to compare the results of the survey to other studies from the MENA region because of its limitation to adults and working persons. For example, Lesteven and Samadzad estimated the walking mode share for Tehran as 6.7%, but for all trips (work and non-work) [39]. For Istanbul, walking is the primary mode of transportation, higher than 40% [40], but the high share is mainly related to other kinds of trips.
One important reason can be found in the effect of commuting distance and the home location. As expected, this study found out that commuting distance is a significant determinants of pedestrian commuting. This is line with the studies emphasizing on the very high probability of taking other modes over walking for longer-distance commute trips [6,41].
The results of this study show that although many studies have identified the correlation of gender with walking, when it comes to commuting, gender is no longer a significant determinant of walking. This finding is in agreement with the findings of Ding et al. in China [42]. Their results also indicate that age is a significant determinant of commuting on foot, just like the results of the current study on the MENA region. However, car ownership is significant in the MENA region but not in the Chinese sample. Unfortunately, no land-use and street network variables have been applied in the Chinese model, so no comparison is possible.
The findings are also comparable with the findings of Panter et al. (2011), who worked on a sample of 1164 individuals in Cambridge, UK, 30% of whom reported any walking to or from work [43]. The survey included data about perceptions of the route, psychological measures regarding car use, and socio-demographic characteristics. They found out that gender and car ownership are significant determinants of the time of walking to and from work. According to them, women were nearly twice as likely to walk, and people without access to a car and those who lived in less than 3 km from work were three times more likely to walk. The findings of this study on a UK sample are not in line with the findings of the present paper in terms of gender and car ownership. Gender is not a significant determinants of pedestrian commuting in the MENA sample at all. In fact, it was eliminated from the model as it was not significant. If the variable called “access to a car” in the Cambridge study is translated into “owning a car”, although they are slightly different, then another mismatch between the two contexts can be recognized. In the Cambridge model, accessing a car for people who commute more than 3 km is insignificant, while walking to work with a commuting distance of less than 3 km is significant. In the MENA model, car ownership for any distance, whether less or more than 3 km, is highly significant (β = 0.673, p < 0.001). Moreover, age has a strong and negative association with walking to and from work and study place in the MENA region. This is finding rejects the findings of Cambridge, in which age is not significant of the time of walking to work. Such mismatches confirm the context-specificity of the travel behaviors and decisions. In other words, car ownership or access to a car in Cambridge, UK, has another impact on walking to work compared to the large MENA cities. From this point of view, the MENA model has successfully indicated the contextuality of these behaviors.
The finding of this study about longer walk commuting of lower-income people compared with commuters with higher household income is similar to an American study using the 2009 National Household Travel Survey (NHTS) that found the same result and also that lower-income people walk shorter distances for recreation [44].
Concerning accessibility to neighborhood facilities, the findings of this study are in the same direction as the results of Plaut (2005), who concluded that on-foot commuting will be more likely if commercial properties are nearby. This analysis was conducted using 41,000 adults’ commuting data as a part of the American Housing Survey [4]. Likewise, the present study on the MENA region identified that both the number of and walking distances to the facilities near to the home location are highly significantly correlated with the decision to walk to work or study.
The overall finding of this study about the association between on-foot commuting and the physical and special factors rejects the claim of Lemieux and Godin who conclude that only psychological factors such as positive intentions and strong habits for walking and cycling are the significant determinants of active transport [45]. The results agree with the general position of Pikora et al. (2003), who find that environmental factors can encourage people to have active mobility [46], as well as Zahran et al., who conclude, “cycling and walking transport behaviors depend on the built, natural, socioeconomic, and civic environment of a locality” in US cities [44].
This study recognizes younger, lower-income individuals with fewer cars and no driving license as the main socio-demographic group, who walk to work and study places in large cities of the MENA region. Based on the findings, the study can recommend the urban planners and policymakers of the region to use the land use and street network of such cities to promote pedestrian commuting. Planners should take into account among others rules proposed by Speck (2012) [47], especially related to space shaping and use mixes. The ambitious purpose, which is increasing the walking share, can be implemented by increasing the street network connectivity and production of local facilities as destinations. In order to increase street connectivity, adding to the density of intersections is recommended by this paper, which means making lot sizes smaller. This goal can be reached via revisiting urban development plans. Avoiding superblocks and very large lots and parcels can be in the agenda for the planning sectors and local governments. Moreover, adding new passages to the existing street networks can be a good solution for adding to the intersection density. Barcelona can be used as an example. The city has a high density of intersections for pedestrians. The redefinition of the city called “superblocks” gave pedestrians more space and increased network connectivity for walking in a visible way [48]. Activities that encourage walking can also take other forms, such as rewards with special applications integrated with the use of pedometers [49]. In addition, improving personal safety can be a significant incentive to use public transport or walking [50].
The other planning solution is to add to the number of walkable destinations including retail, public services, and public spaces to less-walkable neighborhoods. Commuting and non-work travels are, most of the time, very much connected, so providing non-work destinations within accessible distances from people’s homes can promote walking commute trips. This solution was also mentioned as one of main solutions in planning walkability areas by Forsyth (2015) [51] and El Messeidy (2019) [52]. Shortening the distance by increasing the number of destinations in the selected area increases the accessibility by foot and thus promotes this mode of travel. Neglecting walking accessibility to infrastructures has been apparent in some of the recent development plans in the field of urban planning and transportation; e.g., in Tehran, the new generation of the metro stations have been planned and built in areas with low walkability for metro passengers compared to the previous generation built twenty years before [53]. As another example, the New Cairo district of Cairo has been planned in a very car-oriented manner, which encourages commuters to refrain from pedestrian commuting. However, an important point that should be noticed by the urban planners of the region is that using land use and street networks is a necessary condition, but it is not enough to encourage people to walk: as Dean et al. mention, “the relationship between built form and walking extends beyond the correlates of residential density, mix of land uses and street networks”, and people walk when their desire to avoid discomfort, seek pleasure, and foster social connection is fulfilled [54].
This study has its own limitations. Its main focus is on megacities, but the results can be generalized to several large cities in the region. According to the results of this study, the offered solution will especially be effective if the non-work destinations are within 600 m of residential places. Based on a transferability study, these recommendations for urban planning and design can be useful not only in Cairo, Istanbul, and Tehran, with an overall central-city population of 42 million inhabitants, but also for at least 13 cities with more than one million inhabitants (Algeria: Algiers; Egypt: Alexandria; Iran: Ahvaz, Isfahan, Karaj, Mashhad, Qom, Shiraz, Tabriz; Iraq: Baghdad, Sulaimaniya; Morocco: Casablanca, Fez, Marrakech, Rabat, Tangier; Pakistan: Karachi, Lahore, Peshawar; Tunisia: Tunis; Turkey: Adana, Ankara, Bursa, Gaziantep, Izmir, Konya; Yemen: Sana’a) [55]. This conclusion was drawn by analyzing a range of socioeconomic, political, environmental factors including seven criteria (gross domestic production, Gini coefficient, free choice, perception of corruption, temperature range, car ownership rate, and investment in transport). A continuation of this study can be conducted on medium-sized and small cities in the region, which accommodate a large urban population. As this was out of the scope of this study, it can be the target of future studies.

5. Conclusions

For enhancing the share of active transportation, particularly walking, it is essential to understand the characteristics of necessities of walkers and non-walkers. A lack of knowledge about the mobility behaviors of people in the Global South has led to weaknesses in urban and transportation planning. When it comes to commute trips, this shortcoming is even more weakening, as the purpose of travels have not been part of the few studies conducted in such countries. This study addresses this gap and specifies the characteristics of the built environment, individual, and household that encourage people to walk to work and study place. According to the results, age, household car ownership, last relocation time, intersection density, number of accessed facilities from home, average walking accessibility to neighborhood amenities, and commuting distance are the correlates of on-foot commuting in Cairo, Istanbul, and Tehran. The positive correlation between accessibility to neighborhood amenities and walking to work is another unexpected result. This may originate from a different approach taken by the Middle-Eastern people to short-distance travels, where they take modes other than walking to reach workplaces near their living places. The models of this study do not specifically clarify the causes.
The study identifies younger commuters with less cars or no driving license living in neighborhoods with connected street networks are the walkers. There is significant difference between the values of these factors for walking commuters and those who commute by other modes.
Several of these findings are different from the findings in high-income countries, while some are similar. The contextual difference between the characteristics of pedestrian commuting necessitates local planning based on the preferences and needs of the MENA region, including the local urban form and passengers’ decisions and mobility culture.
This paper highlights the way urban planners and decision makers can use urban land use, including street network and accessibility to local facilities, to motivate commuters, especially those who work within a walkable distance to their work or study place, to walk, which is considered to be a healthy and environmentally friendly way of daily transportation.
Future research should extend the studies by add additional factors, such as symmetry of walking to and from work. This kind of research may verify, among others, results related to travelling by metro developed by Shao et al. (2020) [56], which contains nonlinear interaction effects between land use and network attributes. The authors would like to move the study to the walking problem.

Author Contributions

Conceptualization, methodology, resources and data, formal analysis, writing—original draft preparation, and writing—reviewing and editing: H.M. writing—original draft preparation and writing—reviewing and editing: G.S. All authors have read and agreed to the published version of the manuscript.

Funding

This study was undertaken with the support of German Research Foundation (DGF) as the research project “Urban Travel Behavior in Large Cities of MENA Region” (UTB-MENA) with the project number MA6412/3-1.

Institutional Review Board Statement

Ethical review and approval were not obtained for this study because no intervention was applied to the participants.

Informed Consent Statement

Written informed consent has not been obtained from the respondents of the interviews of this study due to the cultural and socio-political conditions of the countries in which data were collected.

Data Availability Statement

The data have been collected using public funds, but at the time of the publication of this paper, they have not been shared in a repository.

Acknowledgments

I acknowledge support by the German Research Foundation and the Open Access Publication Fund of Technische Universität Berlin.

Conflicts of Interest

The authors declare no conflict of interest. The funders had no role in the design of the study; in the collection, analyses, or interpretation of data; in the writing of the manuscript, or in the decision to publish the results.

References

  1. An, M.; Chen, M. Estimating nonmotorized travel demand. Transp. Res. Rec. 2007, 2002, 18–25. [Google Scholar] [CrossRef]
  2. Nurul Habib, K.; Han, X.; Lin, W.H. Joint modelling of propensity and distance for walking-trip generation. Transp. A Transp. Sci. 2014, 10, 420–436. [Google Scholar] [CrossRef]
  3. Parkin, J.; Wardman, M.; Page, M. Estimation of the determinants of bicycle mode share for the journey to work using census data. Transportation 2008, 35, 93–109. [Google Scholar] [CrossRef] [Green Version]
  4. Plaut, P.O. Non-motorized commuting in the US. Transp. Res. Part D Transp. Environ. 2005, 10, 347–356. [Google Scholar] [CrossRef]
  5. Ryley, T. Estimating cycling demand for the journey to work or study in West Edinburgh, Scotland. Transp. Res. Rec. 2006, 1982, 187–193. [Google Scholar] [CrossRef]
  6. Vandenbulcke, G.; Dujardin, C.; Thomas, I.; de Geus, B.; Degraeuwe, B.; Meeusen, R.; Panis, L.I. Cycle commuting in Belgium: Spatial determinants and ‘re-cycling’ strategies. Transp. Res. Part A Policy Pract. 2011, 45, 118–137. [Google Scholar] [CrossRef] [Green Version]
  7. Olojede, O.; Yoade, A.; Olufemi, B. Determinants of walking as an active travel mode in a Nigerian city. J. Transp. Health 2017, 6, 327–334. [Google Scholar] [CrossRef]
  8. Hunt, J.D.; Abraham, J.E. Influences on bicycle use. Transportation 2007, 34, 453–470. [Google Scholar] [CrossRef]
  9. Khan, M.; Kockelman, K.M.; Xiong, X. Models for anticipating non-motorized travel choices, and the role of the built environment. Transp. Policy 2014, 35, 117–126. [Google Scholar] [CrossRef]
  10. Ho, C.; Mulley, C. Intra-household interactions in transport research: A review. Transp. Rev. 2015, 35, 33–55. [Google Scholar] [CrossRef]
  11. Weinstein Agrawal, A.; Schlossberg, M.; Irvin, K. How Far, by Which Route and Why? A Spatial Analysis of Pedestrian Preference. J. Urban Des. 2008, 13, 81–98. [Google Scholar] [CrossRef]
  12. Burke, M.; Brown, A.L. Distances People Walk for Transport. Road Transp. Res. A J. Aust. N. Z. Res. Pract. 2007, 16, 16–29. [Google Scholar]
  13. Lee, E.; Dean, J. Perceptions of walkability and determinants of walking behaviour among urban seniors in Toronto, Canada. J. Transp. Health 2018, 9, 309–320. [Google Scholar] [CrossRef]
  14. Chaix, B.; Simon, C.; Charreire, H.; Thomas, F.; Kestens, Y.; Karusisi, N.; Vallée, J.; Oppert, J.-M.; Weber, C.; Pannier, B. The environmental correlates of overall and neighborhood based recreational walking (a cross-sectional analysis of the RECORD Study). Int. J. Behav. Nutr. Phys. Act. 2014, 11, 20. [Google Scholar] [CrossRef] [PubMed]
  15. Hong, J. How does the seasonality influence utilitarian walking behaviour in different urbanization settings in Scotland? Soc. Sci. Med. 2016, 162, 143–150. [Google Scholar] [CrossRef] [PubMed] [Green Version]
  16. Gehrke, S.R.; Welch, T.F. The built environment determinants of activity participation and walking near the workplace. Transportation 2017, 44, 941–956. [Google Scholar] [CrossRef]
  17. Chatman, D.G. How Density and Mixed Uses at the Workplace Affect Personal Commercial Travel and Commute Mode Choice. Transp. Res. Rec. 2003, 1831, 193–201. [Google Scholar] [CrossRef] [Green Version]
  18. Oakes, J.M.; Forsyth, A.; Schmitz, K.H. The Effects of Neighborhood Density and Street Connectivity on Walking Behavior: The Twin Cities Walking Study. Available online: https://0-epi--perspectives-biomedcentral-com.brum.beds.ac.uk/articles/10.1186/1742-5573-4-16 (accessed on 7 January 2022).
  19. Clifton, K.J.; Livi, A.D. Gender differences in walking behavior, attitudes about walking, and perceptions of the environment in three Maryland communities. Res. Women Issues Transp. 2005, 2, 79–88. [Google Scholar]
  20. Zhang, W.; Lu, D.; Chen, Y.; Liu, C. Land use densification revisited: Nonlinear mediation relationships with car ownership and use. Transp. Res. Part D Transp. Environ. 2021, 98, 102985. [Google Scholar] [CrossRef]
  21. Hatamzadeh, Y. Do people desire to walk more in commuting to work? Examining a conceptual model based on the role of perceived walking distance and positive attitudes. Transp. Res. Rec. 2019, 2673, 351–361. [Google Scholar] [CrossRef]
  22. Masoumi, H.E. A discrete choice analysis of transport mode choice causality and perceived barriers of sustainable mobility in the MENA region. Transp. Policy 2019, 79, 37–53. [Google Scholar] [CrossRef]
  23. Masoumi, H. Home-Based urban commute and Non-Commute trip generation in Less-Studied Contexts: Evidence from Cairo, Istanbul, and Tehran. Case Stud. Transp. Policy 2021, 10, 130–144. [Google Scholar] [CrossRef]
  24. Masoumi, H. Urban commute travel distances in Tehran, Istanbul, and Cairo: Weighted least square models. Urban Sci. 2020, 4, 39. [Google Scholar] [CrossRef]
  25. Masoumi, H. Residential Location Choice in Istanbul, Tehran, and Cairo: The Importance of Commuting to Work. Sustainability 2021, 13, 5757. [Google Scholar] [CrossRef]
  26. Ibrahim, M.R. How do people select their residential locations in Egypt? The case of Alexandria. Cities 2017, 62, 96–106. [Google Scholar] [CrossRef]
  27. Ibrahim, M.R.; Masoumi, H.E. The nuances of the supplied urban fabric in the MENA Region: Evidence from Alexandria, Egypt. Land Use Policy 2018, 73, 385–399. [Google Scholar] [CrossRef]
  28. Mostofi, H.; Masoumi, H.; Dienel, H.-L. The Association between Regular Use of Ridesourcing and Walking Mode Choice in Cairo and Tehran. Sustainability 2020, 12, 5623. [Google Scholar] [CrossRef]
  29. Andraos, J.; Awad, R.; Geagea, T.; Habib, C.; Koberssi, L.; Lahoud, J.; Rabah, M.; Reaidy, F.; Eddine, N.S.; Masoumi, H. Urban Travel Behavior and Socio-Spatial Issues in the Mena Region: What Do We Know? Transp. Telecommun. J. 2021, 22, 425–443. [Google Scholar] [CrossRef]
  30. World Population Review. The Middle East Population 2022. Available online: https://worldpopulationreview.com/continents/the-middle-east-population (accessed on 3 April 2022).
  31. Weltdatenatlas. World and National Data, Maps & Rankings. Available online: https://knoema.com/atlas (accessed on 4 March 2022).
  32. Masoumi, H.E.; Gouda, A.A.; Layritz, L.; Stendera, P.; Matta, C.; Tabbakh, H.; Razavi, S.; Masoumi, H.; Mannasoğlu, B.; Kılınç, Ö.; et al. Urban Travel Behavior in Large Cities of MENA Region: Survey Results of Cairo, Istanbul, and Tehran; Zentrum Technik und Gesellschaf: Berlin, Germany, 2018. [Google Scholar]
  33. Gent, C.; Symonds, G. Advances in public transport accessibility assessments for development control—A proposed methodology. Sci. Eng. Med. 2005. Available online: https://www.semanticscholar.org/paper/Advances-in-public-transport-accessibility-for-a-Gent-Symonds/2b16f20a1277d2ce342e543b4bf97c27cfeff458 (accessed on 4 March 2022).
  34. Gadziński, J. Ocena Dostępności Komunikacyjnej Przestrzeni Miejskiej na Przykładzie Poznania; Bogucki Wydawnictwo Naukowe: Poznań, Poland, 2010; ISBN 8362662360. [Google Scholar]
  35. Loose, W. Flächennutzungsplan 2010 Freiburg–Stellungnahme zu den Verkehrlichen Auswirkungen; Gemeinsame Stellungnahme von: Öko-Institut e. V.–Arbeitsfeld Verkehr, Verkehrsclub Deutschland (VCD)–Kreisverband Südlicher Oberrhein, Lokale Agenda 21 Freiburg–Arbeitskreis Mobilität. Öko-Institut: Freiburg, Germany, 2001. [Google Scholar]
  36. Sierpiński, G.; Staniek, M.; Celiński, I.; Czech, P.; Barcik, J. Identification of pedestrian travel in modeling of modal split and transport accessibility. Logistyka 2015, 4, 1495–1500. [Google Scholar]
  37. Handy, S.; Paterson, R.G.; Butler, K. Planning for Street Connectivity: Getting from Here to There; Planning Advisory Service Report No. 515; American Planning Association: Chicago, IL, USA, 2003. [Google Scholar]
  38. Ton, D.; Bekhor, S.; Cats, O.; Duives, D.C.; Hoogendoorn-Lanser, S.; Hoogendoorn, S.P. The experienced mode choice set and its determinants: Commuting trips in the Netherlands. Transp. Res. Part A Policy Pract. 2020, 132, 744–758. [Google Scholar] [CrossRef]
  39. Lesteven, G.; Samadzad, M. Ride-hailing, a new mode to commute? Evidence from Tehran, Iran. Travel Behav. Soc. 2021, 22, 175–185. [Google Scholar] [CrossRef]
  40. Netherlands Enterprise Agency. Fact-Finding Study Pre-PPS: Smart and Green Mobility in Istanbul. Available online: https://www.rvo.nl/sites/default/files/2020/11/IAN-Turkey.pdf (accessed on 4 March 2022).
  41. McDonald, N.C. Children’s mode choice for the school trip: The role of distance and school location in walking to school. Transportation 2008, 35, 23–35. [Google Scholar] [CrossRef]
  42. Ding, C.; Chen, Y.; Duan, J.; Lu, Y.; Cui, J. Exploring the influence of attitudes to walking and cycling on commute mode choice using a hybrid choice model. J. Adv. Transp. 2017, 2017, 8749040. [Google Scholar] [CrossRef]
  43. Panter, J.; Griffin, S.; Jones, A.; Mackett, R.; Ogilvie, D. Correlates of time spent walking and cycling to and from work: Baseline results from the commuting and health in Cambridge study. Int. J. Behav. Nutr. Phys. Act. 2011, 8, 124. [Google Scholar] [CrossRef] [Green Version]
  44. Zahran, S.; Brody, S.D.; Maghelal, P.; Prelog, A.; Lacy, M. Cycling and walking: Explaining the spatial distribution of healthy modes of transportation in the United States. Transp. Res. Part D Transp. Environ. 2008, 13, 462–470. [Google Scholar] [CrossRef]
  45. Lemieux, M.; Godin, G. How well do cognitive and environmental variables predict active commuting? Int. J. Behav. Nutr. Phys. Act. 2009, 6, 12. [Google Scholar] [CrossRef] [Green Version]
  46. Pikora, T.; Giles-Corti, B.; Bull, F.; Jamrozik, K.; Donovan, R. Developing a framework for assessment of the environmental determinants of walking and cycling. Soc. Sci. Med. 2003, 56, 1693–1703. [Google Scholar] [CrossRef]
  47. Speck, J. Walkable City: How Downtown Can Save America, One Step at a Time; Documents d’Anàlisi Geogràfica; North Point Press: New York, NY, USA, 2015; Volume 61, p. 437. ISBN 978-0865477728. [Google Scholar]
  48. Cities Forum. Superblock (Superilla) Barcelona—A City Redefined. Available online: https://www.citiesforum.org/news/superblock-superilla-barcelona-a-city-redefined (accessed on 3 April 2022).
  49. Yue, J.S. Nudging Drivers: Sensing, Smartphone Apps and Incentives; Stanford University: Stanford, CA, USA, 2014; ISBN 9798698534631. [Google Scholar]
  50. Moreno, J.O.; Caamal-Olvera, C.G.; Luna, E.M. Mobility and sustainable transportation in higher education: Evidence from Monterrey Metropolitan Area in Mexico. Int. J. Sustain. High. Educ. 2022. [Google Scholar] [CrossRef]
  51. Forsyth, A. What is a walkable place? The walkability debate in urban design. Urban Des. Int. 2015, 20, 274–292. [Google Scholar] [CrossRef]
  52. El Messeidy, R. Towards Better Cities: Improving Walkability in Terms of Seven Principles. J. Urban Res. 2019, 33, 154–171. [Google Scholar] [CrossRef]
  53. Masoumi, H.E.; Shaygan, M. A Longitudinal Analysis of Densities within the Pedestrian Sheds around Metro Stations. The Case of Tehran. TeMA-J. Land Use Mobil. Environ. 2016, 15, 5–20. [Google Scholar]
  54. Dean, J.; Biglieri, S.; Drescher, M.; Garnett, A.; Glover, T.; Casello, J. Thinking relationally about built environments and walkability: A study of adult walking behavior in Waterloo, Ontario. Health Place 2020, 64, 102352. [Google Scholar] [CrossRef] [PubMed]
  55. Masoumi, H.E.; Fruth, E. Transferring Urban Mobility Studies in Tehran, Istanbul, and Cairo to Other Large MENA Cities: Steps toward Sustainable Transport. Probl. Rozw. Miast 2020, 65, 27–44. [Google Scholar] [CrossRef]
  56. Shao, Q.; Zhang, W.; Cao, X.; Yang, J.; Yin, J. Threshold and moderating effects of land use on metro ridership in Shenzhen: Implications for TOD planning. J. Transp. Geogr. 2020, 89, 102878. [Google Scholar] [CrossRef]
Figure 1. The location of the 18 neighborhoods in (a) Cairo, (b) Istanbul, and (c) Tehran, in which data collection was conducted. The red areas are neighborhoods in the historical core, blue neighborhoods are in-between areas, and the green areas are neighborhoods lower-density neighborhoods developed in the recent decades.
Sustainability 14 06377 g001
Figure 2. The share of pedestrian commuting in the overall sample broken down by the city.
Sustainability 14 06377 g002
Table 1. The applied variables of the study and their quantification methods.
VariableUnitQuantification MethodRelated to Research Question No.
Commute Mode Choice (Dependent Variable of the BL model of this study)-Mode choice coded into 0 (other modes) and 1 (walking).1, 2, and 3
Gender-Male or female1
Age-Reported age of the respondent.1, 2, and 3
Individual Driving License Ownership-Possession of a driving license by the respondent: yes or no.1, 2, and 3
Household Car Ownership-The number of personal cars possessed by family members.1, 2, and 3
Number of Driving License in HouseholdNo.The number of family members who possess a driving license.1, 2, and 3
Household IncomeEuroReported gross household monthly income converted from Rial (Toman), Turkish Lira, and Egyptian Pound to Euro in summer and autumn of 2017.1, 2, and 3
Last Relocation TimeYearsThe number of year passed from the last residential relocation of the respondent and possibly his/her family.1, 2, and 3
Commuting DistanceKmThe street-network-based distance between home and workplace of respondents who have work/study activity was calculated by the information of the place of home in the neighborhood and also the reported workplace.1, 2, and 3
Intersection DensityNodes/haThe number of intersections per hectare in a 600 m catchment area (based on the network) of each of the respondents’ homes. Calculations were performed for areas inside the neighborhood boundary or outside. This indicator quantifies the number of intersections per unit area. A higher number indicates more intersections and better connectivity.1, 2, and 3
Link Node Ratio-The number of links (street segments) divided by nodes (street intersections) of the street network within 600 m catchment area (based on the network) of each of the respondents’ homes. Calculations were performed for areas inside the neighborhood boundary or outside. This indicator evaluates the typology of intersections (i.e., four- and five-way intersections receive higher values than three-way intersections). Values of 1.4 and higher indicate good connectivity [37]1, 2, and 3
Street Length Densitym/haThe length of streets divided by the area of the 600 m catchment area (based on the network) of the respondents’ homes. Calculations were performed for areas inside the neighborhood boundary or outside. Higher densities indicate better connectivity.1, 2, and 3
No. of Accessed Facilities-The number of neighborhood public facilities within a 600 m catchment area (based on the network) of the respondents’ homes. The facilities included five types: bakeries, clinics and other medical centers, mosques, parks, and schools.1, 2, and 3
Accessibility to Neighborhood FacilitiesmeterThe average distance (based on the network) from each respondent’s home to neighborhood public facilities within the neighborhood or located within a linear 600 m buffer (like the crow flies) outside the neighborhood boundary. The facilities included five types: bakeries, clinics and other medical centers, mosques, parks, and schools.1, 2, and 3
Table 2. Binary logistic model for using walking vs. other modes for commuting.
VariableBS.E.Walddfpβ
Age−0.0170.00512.3510.00040.983
Household Car Ownership−0.3960.08422.491<0.00010.673
Last Relocation Time0.0300.00531.341<0.00011.031
Intersection Density0.0630.0246.710.00961.065
Number of Accessed Facilities0.0530.00595.771<0.00011.054
Walking Accessibility to Facilities0.001≈029.131<0.00011.001
Commuting distance−0.5510.033272.61<0.00010.576
Constant−1.6380.34422.71<0.00010.194
Omnibus Tests of Model Coefficients
Chi-squaredfp
1026.987<0.0001
Model Summary
−2 Log likelihoodNagelkerke R2
1964.60.418
Table 3. The characteristics of walking commuters in the overall sample.
Explanatory VariableNMinimumMaximumMeanStd. Deviation
Age662127532.9714.937
Household Car Ownership540040.710.712
Number of Driving License in Household567061.551.125
Household Monthly Income644050,0003613.443981.64
Frequency of Commute Trips65904211.835.699
Last Relocation Time66108719.1214.756
Intersection Density6510.34911.4134.83682.743
Link Node Ratio6511.1322.2221.520.1914
Street Length Density651131.3490.3337.9372.93
Number of Accessed Facilities65105315.8812.689
Accessibility to Facilities64864931981277.2388.3
Commuting Distance5830.02775.872.1463.67
Table 4. The mean rank of the explanatory variables for walkers to work/study and non-walkers in the overall sample of Cairo, Istanbul, and Tehran.
Pedestrian Commuters vs. Non-WalkersCategoryNMeanMean Rank
AgeOther Modes756836.674170.8
Walking65733.013447.8
Household Car OwnershipOther Modes71280.993887.1
Walking5390.713130.9
Number of Driving License in HouseholdOther Modes72671.813954.6
Walking5651.553427
Household IncomeOther Modes74064135.364041.9
Walking6393616.053804.3
Last Relocation TimeOther Modes755414.814056.1
Walking65619.084673.9
Intersection DensityOther Modes74513.5133957.9
Walking6464.81515100
Total8097
Link Node RatioOther Modes74511.56914089.6
Walking6461.52123581.1
Street Length DensityOther Modes7452301.0823962.5
Walking646337.2135053
Commuting DistanceOther Modes45439.6772786.7
Walking5802.147801.9
Table 5. The results of Mann–Whitney U test for the explanatory variables for walkers to work/study versus non-walkers.
VariableMann–Whitney UZp
Age2,049,072−7.488<0.001
Household Car Ownership1,542,042−8.448<0.001
No. of Driving License in Household1,776,376−5.561<0.001
Household Income2,226,470−2.4820.013
Last Relocation Time2,104,815−6.410<0.001
Intersection Density1,727,701−11.913<0.001
Link Node Ratio2,104,392−5.304<0.001
Street Length Density (m/ha)1,758,738−11.373<0.001
Commuting Distance296,585−30.435<0.001
Publisher’s Note: MDPI stays neutral with regard to jurisdictional claims in published maps and institutional affiliations.

