
U.S. Almond Exports and Retaliatory Trade Tariffs


Department of Agricultural Economics, University of Kentucky, Barnhart Building, Lexington, KY 40546-0276, USA
*
Author to whom correspondence should be addressed.
Sustainability 2022, 14(11), 6409; https://0-doi-org.brum.beds.ac.uk/10.3390/su14116409
Submission received: 24 April 2022
/
Revised: 21 May 2022
/
Accepted: 23 May 2022
/
Published: 24 May 2022
(This article belongs to the Special Issue Sustainable Agricultural Development Economics and Policy)
Abstract
:The U.S. is the top producer, exporter, and consumer of tree nuts in the world. Tree nuts are a significant part of U.S. agricultural exports to the world. In 2019, the U.S. exported about USD 9.1 billion worth of tree nuts, just behind soybean exports at USD 18.7 billion. Tree nuts, such as almonds and pistachios, are mostly produced in the state of California. California produces 100% of U.S. commercial almonds. Globally, almonds are the leading U.S. tree nut export in both value and volume. Almonds are shipped to over 90 countries annually. This study aimed to investigate factors affecting the export demand function for U.S. almonds in major destination countries and evaluate the impact of the retaliatory trade tariffs policy by some of the importing countries on the U.S. almond exports. The currently available literature does not fully address these issues. We identified the top five almond export destinations, which were in Europe and Asia, namely, China/Hong Kong, Germany, India, Japan, and Spain, which account for more than 50% of U.S. almond imports. We used a double-log export demand equation that is well referenced in the literature and economic theory to identify the significant explanatory variables affecting the U.S. almonds export demand function. We also tried to estimate the impact of retaliatory tariffs on almond exports imposed by the major importing countries. Our results showed that U.S. almond and pistachio prices, real exchange rates, and gross domestic products of importing countries were significant factors that affected U.S. almond exports. The results showed that the imposed retaliatory tariffs had no negative effect on U.S. almond exports. This could have been because the study ended in 2019 and did not involve enough data to fully evaluate the impact of the retaliatory trade tariffs policy. U.S. almond exports have market concentration and strong market power in international markets. The efforts toward more sustainable production of almonds to solidify an already established market share in the world almond markets and against substitutes, such as pistachios, seem to be a sound strategy and focus of the U.S. almond agribusinesses and exporters.
1. Introduction
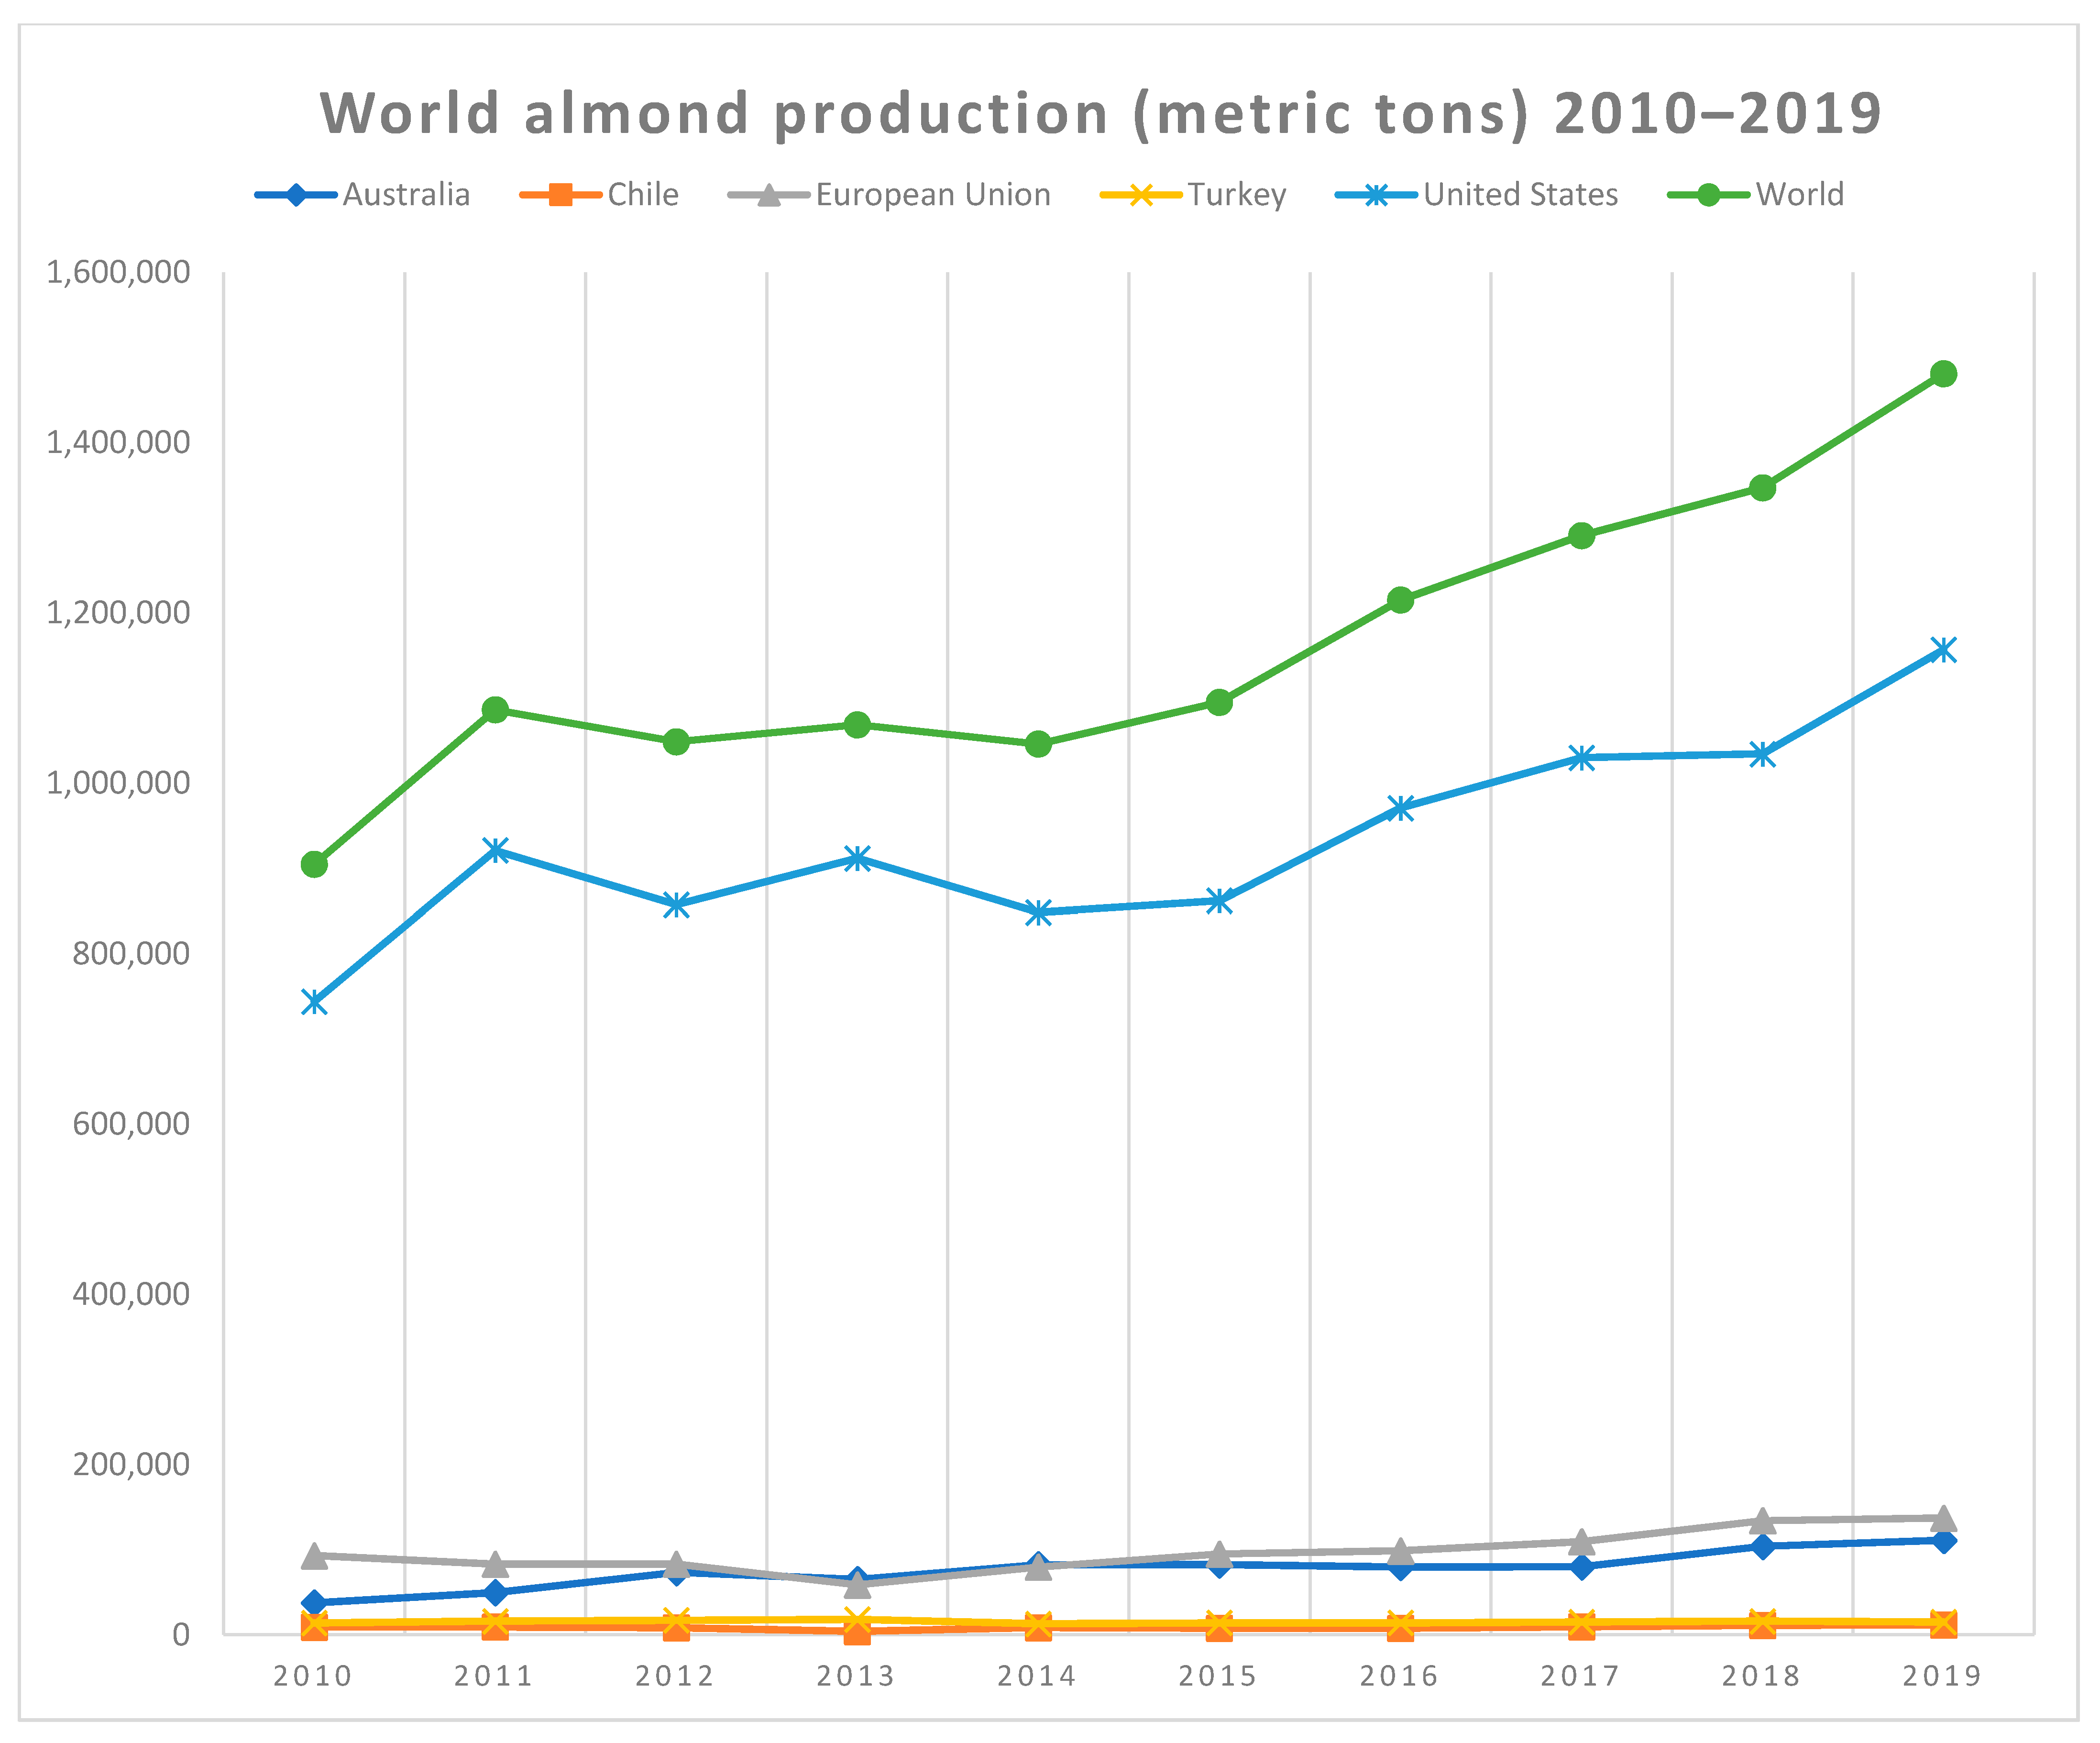
According to the United States Department of Agriculture, the United States (U.S.) dominates the world’s almond market as a top producer, consumer, and exporter [1]. The U.S. has a competitive advantage in tree nut production and exports and is well-positioned to maintain its global dominance over time. Since the 1980s, the U.S. is the number one producer of almonds globally (Figure 1). Other notable producers are Australia, Chile, Spain, and Italy [1]. Almond production has rapidly outpaced other U.S. tree nuts, such as walnuts, pistachios, pecans, and hazelnuts.
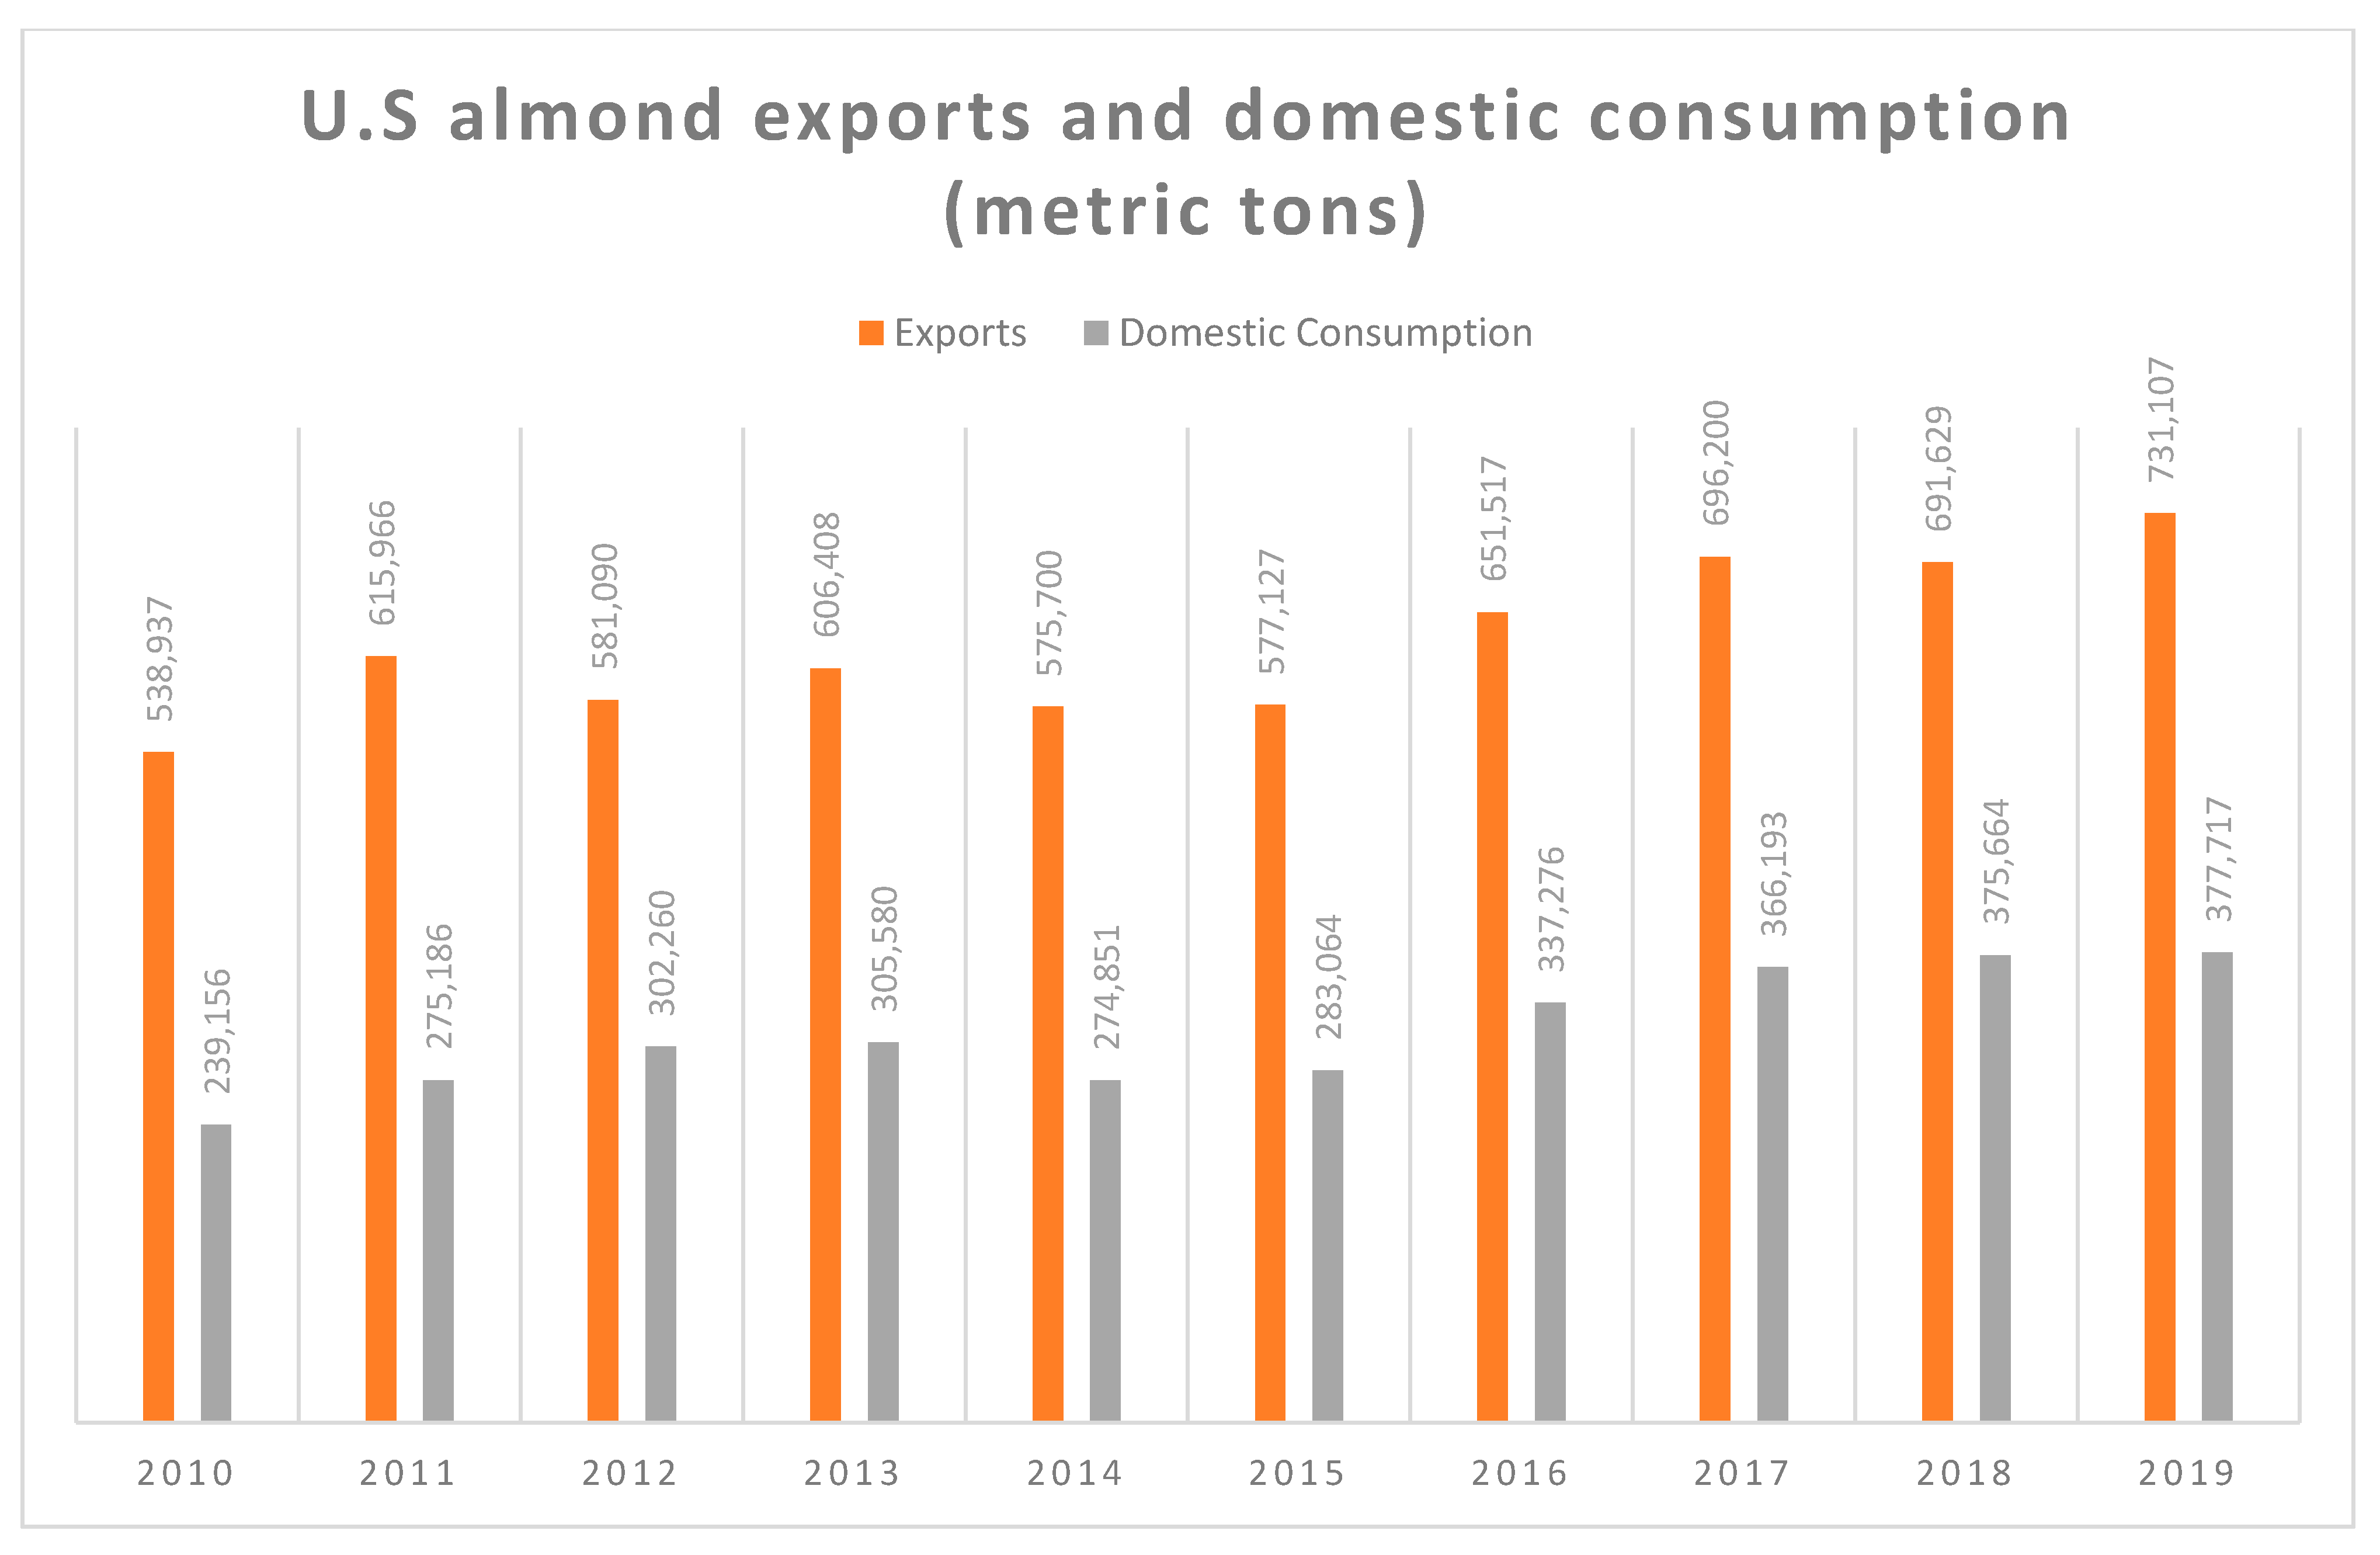
When it comes to consumption and exports, the U.S. has maintained a one-third to two-thirds ratio, where one-third of produced almonds are consumed locally, while two-thirds are exported to other countries (Figure 2). In 2019, the U.S. consumed 377,717 metric tons of almonds, or 33% of its total almonds production locally, and exported 731,177 metric tons, or 67% of the total to other countries. Local consumption grew in the last decade, just as exports did. To put this into context, the growth of almond consumption increased from 0.42 pounds per person in 1980 to 2.36 pounds in 2019 [2].
Almonds, the leading U.S. tree nut export, both in value and volume, are shipped to over 90 countries annually, with about 70% of exports going to the top 10 export destinations: China/Hong Kong, Germany, India, Italy, Japan, the Netherlands, Spain, South Korea, Turkey, and the United Arab Emirates (U.A.E) [2]. In 2019, U.S. tree nut exports were made up of 54% almonds valued at USD 4.9 billion, 22% pistachios valued at USD 2.0 billion, 14% walnuts valued at USD 1.3 billion, 5% pecans valued at USD 475 million, 4% ‘mixed and other nuts’ valued at USD 350 million, and 1% hazelnuts valued at USD 90 million [1].
In March 2018, the Trump administration raised tariffs on imports from key U.S. trading partners. In response, retaliatory tariffs were imposed on U.S. agricultural products. For the tree nuts industry, retaliatory tariffs were imposed on the ‘0802-tariff’ line (both in-shell and shelled nuts), causing higher tariffs on almond exports. Tariffs on almonds were raised from 10% to 55% [3,4]. The U.S. almond industry experts suggested that these tariffs would cause harm to the U.S. almond industry and the tree nuts industry in its entirety, which would, in the long run, have a negative impact on the tree-nuts-dependent economy of California. California’s economy is highly export-dependent, where 70% of almonds produced are exported to other countries [5].
This research aimed to investigate the determinants of export demand for the U.S. almond industry and assess the impact of the retaliatory tariffs policy imposed by key almond-importing nations on U.S. almond exports. Hence, the motivation for this study was twofold: (1) understanding the factors affecting almond exports in major importing countries and (2) evaluating the impact of recent retaliatory trade tariffs that some importing countries imposed on the U.S. exports in reaction to President Trump’s policies of increasing tariffs on some of the imports to the U.S. from those countries. This study is the first of its kind investigating the impact of this specific retaliatory tariffs policy. However, since the study ended in 2019, it did not involve enough data to fully evaluate the impact of this retaliatory trade tariffs policy.
2. Background
2.1. Changing Trends in World Almond Exports
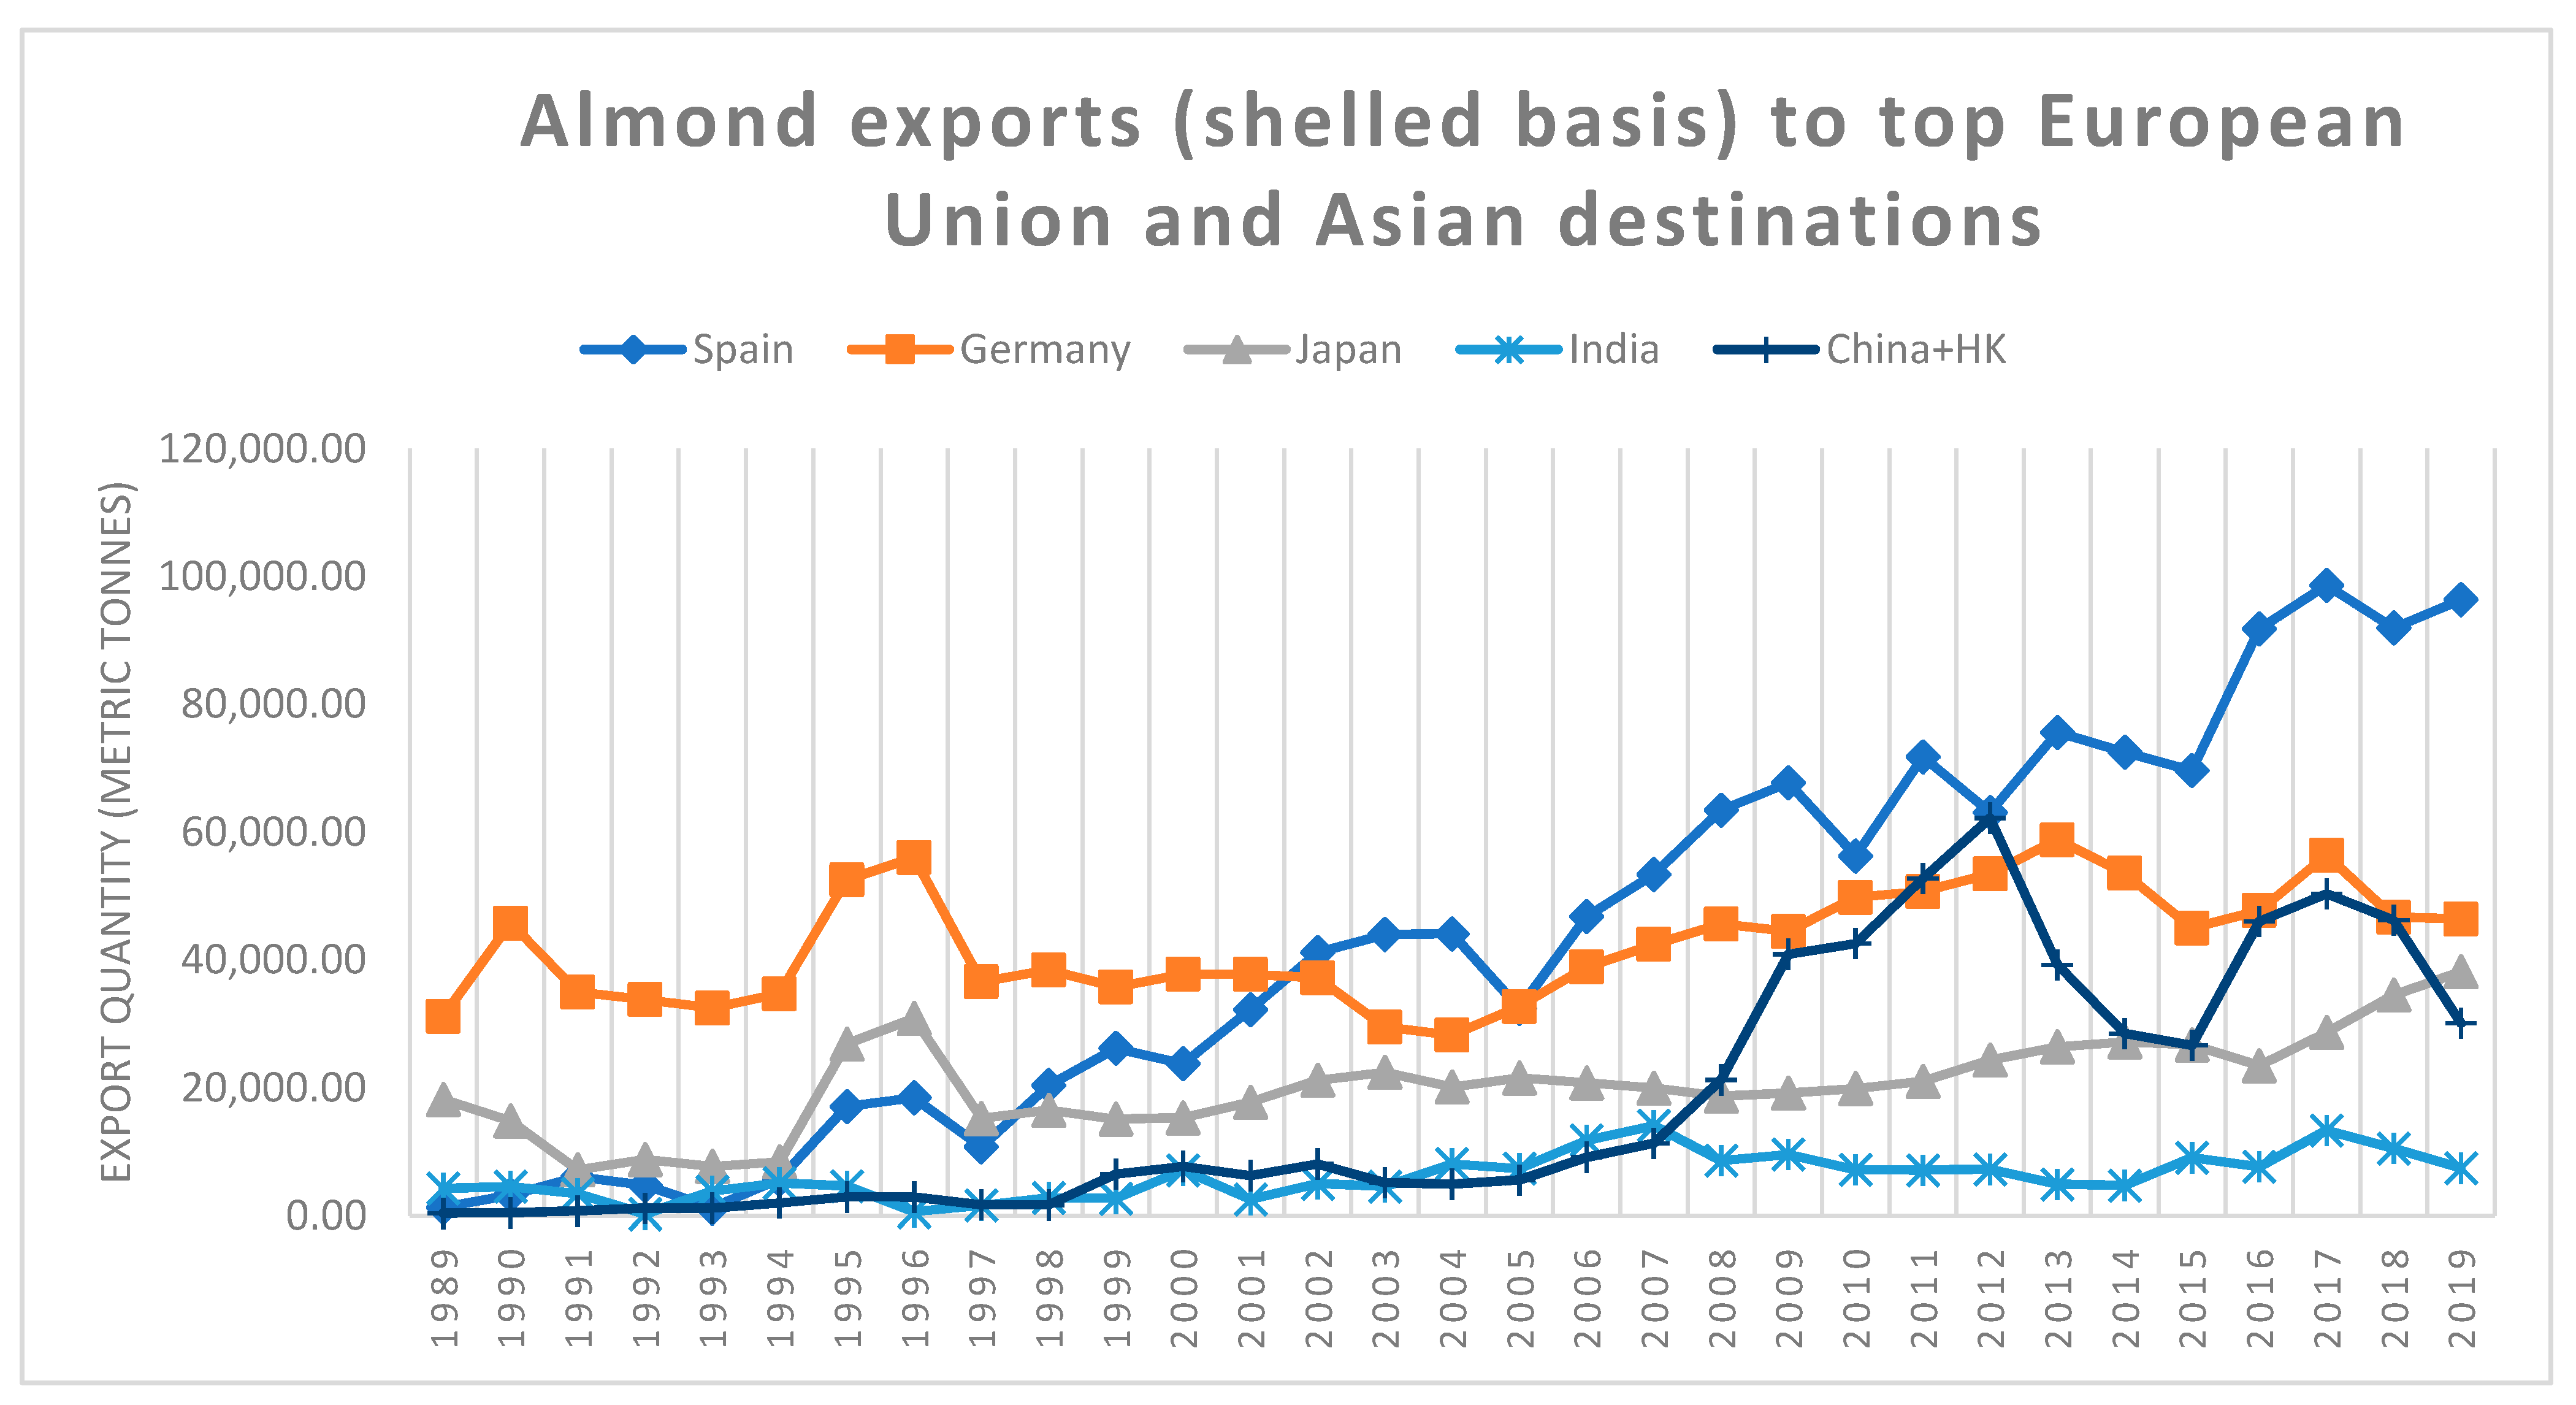
A significant part of U.S. agricultural exports to the world are tree nuts. In 2019, the U.S. exported about USD 9.1 billion worth of tree nuts, just behind soybean exports at USD 18.7 billion. The U.S. tree nut exports include almonds, pistachios, walnuts, pecans, and hazelnuts. The U.S. is the leading exporter of almonds in the world. The trends of U.S. almond exports have changed over the last 20 years (Figure 3). In the late 1990s and early 2000s, most U.S. almond exports went to the European Union (E.U) and Asia, with Germany being the major importer of U.S. almonds in the E.U., while Japan was the major importer in Asia alongside China/Hong Kong, South Korea, and Taiwan. Emerging markets, such as India and the United Arab Emirates (U.A.E), were relatively untapped at that time [6,7].
Today, the E.U. remains the largest market for U.S. almond exports, importing almost 40%, and Spain now accounts for most U.S. almond imports, with Germany close behind as the second-largest E.U. importer. The Asian market, however, has seen a much more drastic change, as new export destinations, such as India, China/Hong Kong, and the U.A.E, are beginning to catch up with Japan for the share of U.S. almond exports to Asia [2]. These changing trends are the results of several years of nutrition research and global market development programs to increase U.S. almond exports. These programs are funded by both the public (the federal government) and private partners in the U.S. almond industry. The Almond Board of California (A.B.C) spent about 61% of its global budget on global market development programs in the fiscal year 2019 to boost exports to those markets [2].
2.2. Recent Trade Wars and Retaliatory Tariffs on U.S. Agricultural Exports
The dominance of U.S. tree nut exports has faced several challenges over the years, with food safety and aflatoxin concerns being among these challenges [8]. In recent years, another concern has been the retaliatory tariffs imposed on U.S. agricultural exports. After spending just over a year in office, the Trump administration announced two major tariffs against products from key trading partners: Sections 232 and 301 tariffs. Section 232 of the Trade Expansion Act of 1962 allows the President to adjust imports if the Department of Commerce finds certain products are imported in certain quantities or under certain circumstances that threaten U.S. national security, while Section 301 of the Trade Act of 1974 allows the U.S. Trade Representative (USTR) to suspend trade agreement concessions or impose new import restrictions if it finds a U.S. trading partner violates trade agreement commitments or engages in discriminatory or unreasonable practices that burden or restrict U.S. commerce.
U.S. Section 232 tariffs were imposed on steel and aluminum imports from the European Union, as well as countries, such as China, Canada, Mexico, and Turkey. U.S. Section 301 tariffs were levied on imports from China [3,4]. These tariffs caused retaliatory tariffs imposed on major U.S. agricultural exports, such as meats, grains, dairy, and horticultural crops. Two of the export destinations considered in this study, namely, China and India, both imposed retaliatory tariffs on U.S. tree nut exports starting in 2018 and 2019, respectively. In April 2018, U.S. tree nuts, including almonds, pistachios, walnuts, and pecans, were slapped with retaliatory tariffs, and China and India imposed retaliatory tariffs on almonds and walnuts a year later in June 2019 [7,9].
Given the importance and contributions of almond production and exports to the California economy, the harm caused to the almond industry was transferred as an adverse effect on the Californian economy [9,10]. According to experts in this area, the tree nuts industry is export-oriented. Thus, it is adversely affected in the long run as shifting markets is expensive and time-consuming, and export promotion rewards are not gained quickly in new markets.
2.3. The Important Role of California in the U.S. Almond Crop Production
California is the only commercial producer of almonds in the U.S. and the leading supplier and exporter of almonds worldwide. California produces 100% of U.S. commercial almonds and U.S. imports remain negligible. The earliest varieties of almonds were native to western Asia and were introduced to California by Spanish explorers in the 1700s. The Spanish are generally referred to as ‘the originators’ because Franciscan padres from Spain originally introduced the almond trees to California [11]. Today, almonds are California’s top agricultural export and largest tree nut crop in total dollar value and acreage. Almonds also rank as the largest U.S. specialty crop export, generating about USD 4.9 billion in 2019 [11]. Almond production in California is carried out within a well-defined community of farmers. There are about 7600 almond farms in California. Most of these farms (91%) are family-owned and run by third- and fourth-generation farmers carrying on the family legacy in almond production. Approximately one-third of California almond farms are 100 acres or more in size.
The almond industry community includes almond handlers who move almonds from farm gates to trade points as local or export shipments. The handlers may also carry out processes such as cleaning, sizing, sorting, and bulk packaging. The handling end of the supply chain is like the production end, as most handlers of almonds are also family-owned entities [2,12].
The single most important factor determining a good almond yield is pollination during the bloom period. California almond varieties are self-incompatible, i.e., they require cross-pollination with other varieties to produce the crop. In cases where the varieties are self-compatible, they still require the transfer of pollen within the flower [13]. During the almond-growing season between February and March, almond tree buds bloom in preparation for pollination by managed (mostly imported) honeybee colonies. As blooming occurs, honeybees in search of pollen and nectar go into the almond orchards and as they move around the orchards, they pollinate the blooming flowers, allowing for the fertilization process to occur, and eventually, fertilized flowers grow into almond nuts [11].
2.4. Almond Industry Sustainability Crisis
The almond crop has high water demands for growth and ranks highest among all tree nuts in terms of its water footprint on the environment. Almonds rank higher in water use compared with both pistachios and walnuts. Thus, there are questions surrounding the sustainability of water resources and the economic cost of water in the long run if almonds are to be produced in an environmentally sound and cost-friendly manner [14].
From an economic standpoint, having over 80% of the world’s almond exports coming from California could be unsustainable in the long run. Finding other locations across the world where almonds could also be grown (such as Spain and Australia) could help to sustain the world supply of almonds [15]. High costs and supply uncertainty of water due to lengthy California droughts could cause long-run economic problems for almond producers, as they would have to pay more money for water due to water scarcity and the high demand for water by the Californian agricultural industry [16,17].
In 2018, the California almond industry used up approximately 70% of honeybee colonies in the U.S. during its pollination season (between February and March). Each almond kernel must be individually pollinated for fruit setting to occur since almond trees are self-incompatible, requiring cross-pollination to produce nuts [18,19,20]. Commercial bee pollinators flock to California due to the high pollination prices offered by the almond producers. Earning income from almond pollination services is very important to commercial bee pollinators [20]. However, the long-term sustainability of the commercial pollination industry has also been put into question, as the mass transshipment of bee colonies has led to declines in managed pollinator populations (colony collapse disorder). Cross-country transport of migratory, managed honeybee colonies can be stressful to honeybees, as the trip to pollinate California almonds for over a month (4 to 6 weeks) demonstrates [21].
3. Literature Review
Specification of export demand functions is a widely studied research area in international trade literature and remains an important source of information for industry experts. Much of the previous literature focused on how the importing countries’ income and exchange rates affect the export demand function. Aggregate export demand forecasts and estimates serve as a tool for long-term international trade planning and policy formulation [22]. Many empirical studies used the export demand function in the past. Research was conducted on U.S. export demand for different commodities in the agricultural sector (e.g., [7,8,23,24,25,26,27,28,29,30,31,32,33,34,35,36,37,38,39,40]).
In this study, we focused on the export demand model to estimate the determinants and factors that affected export demand for U.S. almonds. In addition, this study aimed to assess the impact of the retaliatory tariffs imposed by some importing countries on U.S. almond exports. The retaliatory tariffs were used in the model as percentage increments.
Previous research estimated the major factors affecting U.S. almond export demand in Asia and the European Union (E.U.), with a focus on the impact of federal promotion programs on the export demand [7]. Results showed that own-price elasticities for almond exports were negative, and the cross-price elasticities with respect to walnuts were positive, indicating walnuts to be substitutes for almonds. Interestingly, they found mixed results for the income elasticity, with a negative income elasticity for Asia, suggesting almonds here are an inferior good. That is, with an increase in income, almond consumption decreased. However, income elasticity for the E.U. was positive and highly elastic, suggesting almonds to be a luxury good.
Past research [25] showed the relation between U.S. export demand and exchange rates. This study focused on estimating the export demand function for U.S. wheat. These results suggested exchange rate changes had a significant impact on U.S. wheat exports. Another study [26] demonstrated the determinants of trade flows in international markets. The reasons for the decline in export demand in agriculture markets back in 1986 were old and wrong policy implications, lower-than-normal levels of stocks, and government intervention in agricultural trade, which caused confusion in the markets, leading to an increase in demand and a decrease in supply, which, in return, increased prices in the markets [27].
Previous studies analyzed export demand for specific countries and the factors impacting such export demand. These include studies on export demand for U.S. cotton [28], orange juice [29], corn and soybean [30], and beef [31]. In an analysis of export demand elasticities for 53 developed and developing countries, the trading country’s income and relative commodity prices were found to be statistically significant in impacting export demand [32]. Turkish aggregated export demand was found to be inelastic (not responsive) with respect to the real exchange rate, but elastic (responsive) with respect to foreign income [33].
Past research has also demonstrated the benefits of marketing orders and the impacts of the conditions and costs of global trade, including tariffs. The benefits of the federal marketing order over the past 50 years for California pistachios were found to greatly exceed costs [34]. U.S. peanut exports were found to be influenced by both the price of Chinese peanut exports, as well as the real gross domestic product (GDP) of China [35]. The export demand function was modeled in Indonesia [36] and for U.S. corn seed export to 48 countries [37], which concluded that trade costs matter, mostly as tariffs, and that all such costs of global trade have a negative impact on exports.
The export demands for pistachios in 21 major export destinations were analyzed using a single framework logarithmic model [8]. The results showed that variation in export demand for U.S. pistachios in these markets was significantly affected by export prices of U.S. pistachios, export prices of other U.S. tree nuts (pecans, almonds, and walnuts), and food safety concerns for pistachios produced in the U.S. and its main competitor, namely, Iran. It was argued that the U.S. producers could expand the export demand for U.S. pistachios by taking advantage of the advanced production technologies they employ to improve food safety and quality and differentiate their products in international markets.
The export demand function for U.S. raisins was also investigated [38]. Other studies regarding the raisin situation were more focused on consumer marketing issues [39] and consumer demand [40].
Overall, these studies estimated the determinants of export demand and usually showed factors such as product own-price, cross-prices (product substitute/complement prices), exchange rates, and importing countries’ GDP to be significant factors affecting the export demand function. Our research adds to the literature in this area by investigating the export demand function for U.S. almonds, which is the leading U.S. tree nut export both in value and volume, when retaliatory tariffs were imposed on U.S. agricultural exports in reaction to the U.S. government policy announcing major tariffs against products from other trading countries.
4. Analytical Framework and Data Description
4.1. The Theoretical Model
Economic theory postulates that the quantity of a good demanded is a function of its own price, cross prices (prices of substitutes and complements), income, and other variables, such as tastes and preferences (e.g., advertising) [41]. The export demand function is tailored similarly, including other factors such as bilateral exchange rates, prices charged by foreign competitors, bilateral trade agreements, tariffs, quotas, and income (gross domestic product of the importing country), which affect the quantity of goods exported. Other factors that could influence the export demand of a product are product quality and safety (food safety), reliability of goods, delivery time, and export promotion programs [42,43].
Following the literature in this area, we employed the general export demand function specified in economic theory as the export demand equation for U.S. almonds:
where EXQ is the quantity of almond exports; EXPa is the export price of almonds; EXPcom is the export price of almonds produced by competitors; and EXPnuts is the export prices of substitutes, such as walnuts and pistachios. Previous studies [7,8] showed that almonds, pistachios, and walnuts are substituted for each other. GDP is the gross domestic product of the importing country (used as a proxy for income), and RER is the real bilateral exchange rate, which is the ratio of importing country’s currency to U.S. dollars. While the international trade literature postulates and supports the functional form stated in equation 1 [8,15,16,17], the retaliatory tariffs are also included in the model as percentage increments to investigate their impacts. This is because the countries in this study use both ad valorem and specific tariffs on almond imports.
(EXQ) = f (EXPa, EXPcom, EXPnuts, GDP, RER)
4.2. The Empirical Model
Built on previous studies (e.g., [7,8]), this study used the double-logarithm equation model to estimate the export demand for U.S. almonds exported to the five major destinations. There are three main variables used in the empirical export demand model [22,23]. The first is the product price, which is the main explanatory variable; the second is foreign income (GDP), which represents the economic activity and purchasing power of the trading country; and the third is the exchange rate, which is a relative price that is crucial in affecting imports.
The explanatory variables included in the model include the export price of U.S. almonds (both shelled and in-shell), export price of U.S. pistachios (both shelled and in-shell), and export price of U.S. walnuts (both shelled and in-shell). Pistachios and walnuts are alternative nuts that could be substituted for almonds in foreign markets. The model utilized a logarithmic functional form to allow for more flexibility in the interpretation of estimated coefficients. The log-log form provides an advantage because the coefficients are elasticities [8]. In addition, the variables in a logarithm format have reduced outlier effects.
In addition, free trade agreement (FTA) status, as well as gross domestic product and real exchange rates, were the explanatory variables included in the model. China and Hong Kong were separated in this analysis, given that they have different gross domestic products and real exchange rates, and individual export data exists for both countries. Hence, the data had six cross-sections.
Furthermore, the retaliatory tariff changes were included as percentage increments since the mix of countries in the study (i.e., China/Hong Kong, Germany, India, Japan, and Spain) use both ad valorem and specific tariffs on almond imports. That is, a 20% increase in tariffs would be represented as 1.2 compared with prior to retaliation, which is represented as 1. The free trade agreement (FTA) is also used in the study as a dummy (0 for non-FTA nations and 1 for FTA nations). The dummy is used to discern between the importing nations with a free trade agreement with the U.S., which allows for zero tariffs on the ‘0802 line’ (shelled and in-shell tree nuts), as this would help see the overall effect of the policy on U.S. almond exports. The export price of almonds from other countries was excluded from the model because the U.S. has a tight grip on the world almond export markets and the effect of competitors is negligible [7].
Hence, the empirical export demand function for U.S. almonds was specified as:
where (Qit) is the quantity of shelled/in-shell U.S. almonds exported to country i for quarter t; (Pasit) and (Pansit) are the export prices of shelled and in-shell almonds, respectively, to country i for quarter t; (Ppsit) and (Ppnsit) are the export prices of shelled and in-shell pistachios, respectively, to country i for quarter t; (Pwsit) and (Pwnsit) are the export prices of shelled and in-shell walnuts, respectively, to country i for quarter t; (GDPit) is the gross domestic product of a country i for quarter t; (RERit) is the real exchange rate of local currency per U.S. dollar for country i for quarter t; (FTAit) is the free trade agreement status of the importing nation (1 for an FTA nation and 0 for a non-FTA nation); (TARIFFit) is the tariff increments as a percentage on U.S. almonds (base = 1 for pre-retaliatory tariff months). Table 1 summarizes the model variables and their expected signs.
ln (Qit) = β0 + β1 × ln (Pasit) + β2 × ln (Pansit) + β3 × ln (Ppsit) + β4 × ln (Ppnsit) + β5 × ln (Pwsit) + β6 × ln (Pwnsit) + β7 × ln (GDPit) + β8 × ln (RERit) + β9 × (TARIFFit) + β10 × (FTAit) + ε
4.3. Data Description
We selected the following top five export destinations for U.S. almonds for this study: China/Hong Kong, Germany, India, Japan, and Spain. These five destinations make up about 50% of the total U.S. almond exports annually. China and Hong Kong were treated separately for the reasons stated previously. The data for this study was 240 quarterly observations from 2010 to 2019 (i.e., 6 cross-sections times 40 time-series data). The data for each nut type (shelled and in-shell) for the export unit values and quantities were from the USDA General Agreement on Trade and Services (GATS) database. Data for the real exchange rates and GDPs were from the USDA Economic Research Service (ERS) database. The timeline for the tariff increments was determined using yearly USDA FAS Tree Nuts: World Markets and Trade publications, and congressional service reports (CSR). Google search provided the timeline for the implementation of the retaliatory tariffs on U.S. almond exports. All the variables were in real terms 2015 U.S. dollars to allow for uniformity of the values. Table 2 provides summary statistics for the dataset.
5. Results
We began the analysis with panel-robust checks to adjust the standard errors of the results for general forms of heteroscedasticity and autocorrelation that could exist in the dataset [7,41]. The first difference was also applied to the explanatory variables to make sure they were stationary to obtain meaningful estimations. We tested for stationarity before conducting the analysis, as a non-stationary variable could cause model misspecifications (OLS estimates will no longer be the best linear unbiased estimates (BLUEs) if the data are non-stationary). Due to the panel nature of the data, two possible models were feasible to arrive at the results of the analysis, the fixed-effects model and the random-effects model.
A Hausman test was carried out to determine which model was best suited to analyze the data [44]. The results of the Hausman test suggested that the random-effects model was more appropriate to analyze the shelled export demand, while the fixed-effects model was used to analyze the in-shell export demand.
The results for the U.S. shelled almond prices indicated that the own-price elasticity of almond prices was statistically significant and negative, which is consistent with economic theory. The cross-price elasticity with respect to in-shell U.S. pistachio prices was statistically significant and positive, indicating in-shell pistachios to be substitutes for almonds.
Interestingly, we found the income elasticity (gross domestic product of importing countries) to be significant with a negative sign. That is, with an increase in income, a lower quantity of almonds was demanded, indicating almonds to be an inferior good, with consumers switching to higher-priced luxury nuts, such as pistachios. This was also observed by the substitution effect of in-shell U.S. pistachio prices with both shelled and in-shell U.S. almonds. These results should be a concern to almond exporters as the value and volume of U.S. pistachio exports might be taking away market share from almonds in import destinations. The real exchange rate variable was also statistically significant with a negative sign, which is consistent with economic theory. As the value of the USD appreciated, almonds became more expensive and consumers decreased the quantity demanded. The retaliatory tariffs and free trade agreements were both statistically significant variables, explaining the shelled almond export demand function.
Overall, the estimated results of the export demand function for shelled almonds showed factors such as product own-price, cross-prices (product substitute), exchange rates, and importing countries’ GDP, as well as tariffs and FTA variables, to be significant factors that affected the export demand function. Our results showed that the variation in export demand for in-shell U.S. almonds was significantly affected by own-prices, in-shell U.S. pistachio prices (substitutes), and tariffs. The statistically significant results support previous studies and economic theory in general, except for the retaliatory tariff variable. Table 3 summarizes our export demand model estimation results.
Our results showed that the retaliatory tariff coefficient was statistically significant with a positive sign. That is, more tariffs mean more exports, which is normally contrary to economic theory. This result could be due to several factors. First, the tariff coefficient represents the aggregate effect of the explanatory variable for all the countries in the sample, while in that sample, China was the only country that imposed retaliatory tariffs on the U.S. tree nut industry effectively. Second, the tariffs were imposed in 2018, while the weekly dataset covered up to 2019, which is, relatively speaking, a very short time for the retaliatory tariffs to take effect. In the short run, the tariffs translated into Chinese consumers paying higher prices. In the long run, the tree nuts industry, being export-oriented, is expected to be affected adversely by the tariffs. Third, another important factor is the dominant position of U.S. almonds in international markets. U.S. almonds have a huge concentration and strong market power in international markets. U.S. almonds have very little competition in international markets according to industry experts who analyzed the impact of the U.S.–China Trade war on California agriculture. With retaliatory tariffs in place, Chinese consumers paid higher prices for almonds and pistachios, allowing the imports of almonds and pistachios from the U.S. to remain constant due to the dominant position of the U.S. in these tree nuts. However, walnuts suffered because of the trade war since China is overall a net exporter of walnuts. Here, the losses were offset by diverting exports to other countries [10].
6. Discussion
6.1. Linkages to Previous Studies
The own-price elasticity results for both almond types were in line with economic theory (quantity demanded dropped with increased own-prices) and previous studies [7,8] also found that almonds and pistachios had negative own-price elasticity, respectively.
The cross-price elasticity results showed that walnut prices did not significantly affect shelled and in-shell almond demand functions, but in-shell U.S. pistachio prices affected the demand for both shelled and in-shell almonds and were a substitute with both almond types. In a previous study [7], the authors found walnuts to be substitutes for almonds. It is worthy to note that in the late 1990s, U.S pistachios rallied in the world market due to food safety issues (due to the Iranian aflatoxin incident) over other tree nut markets and gained market share over other nuts, such as walnuts and pecans, where pecans are second only to almonds [8].
The gross domestic product results showed that almonds had a negative income elasticity. This is supported by a study [7] that found tree nuts to have both positive and negative income elasticities. A previous study [7] estimated the major factors affecting U.S. almond export demand in Asia and the European Union (E.U.) using the export demand function. Interestingly, the income elasticity results were mixed, with a negative income elasticity for Asia, indicating almonds to be an inferior good. That is, with an increase in income, almond consumption decreased, just like the results in this study. However, income elasticity for the European Union (E.U.) was positive and highly elastic, indicating almonds to be a luxury good.
In addition, coupled with the substitution relationship with shelled U.S. pistachios prices, negative income elasticity is not far-fetched, as increased income/prosperity could make consumers move to the more expensive and more environmentally friendly pistachio nuts.
The real exchange rate results show that almonds have a negative exchange rate. This is consistent with prior literature [8], which found U.S. pistachios to have a negative real exchange rate elasticity. Unlike our results, pistachios in this study were found to be elastic with respect to real exchange rates. We found almonds to be inelastic with respect to real exchange rates. Another study on U.S wheat also found that exchange rates have a significant effect on crop export demand [25].
The free trade agreement results show that almonds have higher export demand in situations where free trade agreements exist, i.e., where tariffs are eliminated or are substantially lower. Previous studies (e.g., [45]) found that free trade agreements do increase the volume of trade between trading nations.
The results for the effect of the retaliatory trade tariff policy are novel and indicate that U.S almond exports have not been negatively affected by the retaliatory tariffs imposed by some importing nations (two of which are included in this study). Trade deflections were shown to keep export levels unaffected [45], while export promotion by the Almond Board of California caused increased demand from other markets, such as the U.A.E [2].
It is worthy to note that the timeline of the retaliatory tariffs was best cut off at the end of 2019. U.S. government officials met with both India and China in early 2019 to renegotiate trade terms, which kicked in at the start of 2020. Furthermore, purchase promises were made, tariffs were suspended for crops based on the ‘Phase One Agreement,’ and this rendered post-2019 figures somewhat biased and were consequently ignored in this study [46].
6.2. Implications and Major Concerns
From an economic standpoint, the dominance of the U.S. in the world’s almond exports is of concern to competitors in the global markets. An extreme weather event, such as the extended drought in California, is also a major concern that could render U.S. almond producers helpless in the face of almond production challenges. Diversifying almond supply sources would be a good way to ensure that the world almond market supply keeps up with demand, but traditional almond producers and exporters, such as Spain, Iran, Morocco, Syria, Turkey, and Italy, have aging, low-yielding trees that show little potential for expanded production. Currently, those countries mainly serve their domestic market demand [47,48,49].
Another major producer is Australia, where the almond acreage and production are steadily expanding. However, Australian almond producers face a similar problem to the California almond producers, that is, water shortages. Australia has most of its agricultural production in the Murray–Darling Basin and just like the Central Valley in California, that area also faces many challenges due to a lack of water resources. Even though Australia could represent a major threat to California’s dominance in supplying almonds to the world, this threat is muted by water issues in the Murray–Darling Basin [50].
From an agro-ecological perspective, consumers could become more concerned about the environmental impact of consuming tree nuts. Almonds and other tree nuts, such as walnuts and pistachios, have similar water footprints, but the massive use of commercial pollination by the almond industry is another concern. Non-native bee colonies are shipped to California during the pollination season to help the almond fruit-setting process and this could have detrimental environmental impacts. The loss of managed honeybee colonies from colony collapse disorder is a major concern due to the long distances of migratory honeybee routes and a lack of dietary diversity during the pollination season. Pistachios do not require any invertebrate (e.g., insect)-mediated pollination since pistachios are wind-pollinated. Pistachios require less water than almonds. Therefore, shifting from almonds to pistachios could reduce not only the water use but also dependence on increasingly scant migratory honeybee colonies.
Contemporary consumers are much more environmentally conscious and could factor in the environmental effects of growing almonds and other tree nuts in their consumption decisions. Our results indicated that shelled U.S. pistachios are quietly taking away market shares from U.S. almonds. Therefore, an argument could be made that such a substitution of almonds with pistachios by consumers has potential environmental benefits, albeit at the expense of the U.S. almond industry.
7. Conclusions
This study estimated the factors that affect export demand for U.S. almonds and analyzed the effects of recent retaliatory tariffs on almond export demand by some importing countries. A double-log equation of the export demand function was employed to estimate the affecting factors for the top five export markets, namely, China/Hong Kong, Germany, India, Japan, and Spain. The results for shelled U.S. almonds indicated that shelled U.S. almond prices, in-shell U.S. pistachio prices, gross domestic product, real exchange rates, tariffs, and free trade agreements were the major determinants of the export demand. The results for in-shell U.S. almonds indicated that in-shell U.S. almond prices, in-shell U.S. pistachio prices, and tariffs determined the export demand for almonds.
These results provided some key insights for the U.S. almond exporters about the changing export trends. First, the retaliatory tariff increases have had no serious impact on the U.S. almond exports in the short run and there was no immediate cause for alarm for the almond export industry. Only a few major importing countries imposed those tariffs, but that did not have a serious negative impact on almond exports, even though those importing countries that imposed the tariffs were major importers of U.S. almonds. On the contrary, almond exports even increased in face of the retaliatory tariffs. That is, the downward trend in demand for U.S. almonds by the countries imposing the retaliatory tariffs was made up by trade deflections and redirections to other countries. Almond exports even increased due to export-promotion programs.
Second, U.S. pistachios are fast gaining ground on almonds in export destinations, and in due time, market shares would have to be sacrificed if almond exporters do not proactively seek ways to promote almonds to protect their high market shares. U.S. exporters could increase the budget for almond promotion and marketing expenditures and employ more innovative export promotion programs. The immediate strategic response could be increasing the frequency of food science/educational workshops and symposiums, focusing on providing information to consumers about the benefits and advantages of almond consumption to promote almond consumption and keep the world consumers from turning to alternative tree nuts.
Another strategic response would be the provision of food safety assurances as an indication of higher quality and product differentiation, coupled with the existing programs that were rolled out by the Almond Board of California over recent years. Resolving trade restrictions, avoiding trade wars, and facilitating free trade agreements with key importing countries is always an appropriate strategic response to increasing the quantity of almonds exported to the global community. The absence of tariffs and other barriers to trade would help stimulate greater exports worldwide. Among the top five export countries in our sample, only Japan currently has a free trade agreement in place with the U.S.
The limitations of this study are several: We were unable to fully observe the expected effect of retaliatory tariffs using this study because the study ended in 2019 and did not involve enough data to fully evaluate the impact of the retaliatory trade tariffs policy. In addition, the results of this study are unique to almonds exported to the top five U.S. almond export destinations. More research is required to include other almond-importing countries to investigate the impact of retaliatory trade tariffs and trade barriers on the U.S. tree nut industry and their products. Future studies in this area could focus on how to diminish the overall effects of tariffs on U.S. farmers and exporters.
Furthermore, the countries included in the sample for each group had different economic structures regarding their agricultural sectors and food production. The countries also had different policies on food prices, such as production and consumption subsidies and price controls. In a more general picture, the sample countries had different institutional and political systems that affected how they responded to changing market conditions. Fixed effect estimation may control for some of these time-invariant specific destination-country factors to some extent, but more research is required to address these issues.
Author Contributions
Conceptualization, A.A. and S.S.; methodology, A.A. and S.S.; software, A.A.; validation, A.A. and S.S.; formal analysis, A.A. and S.S.; investigation, A.A. and S.S.; resources, A.A. and S.S.; data curation, A.A.; writing—original draft preparation, A.A. and S.S.; writing—review and editing, A.A. and S.S.; visualization, A.A. and S.S.; supervision, S.S.; project administration, A.A. and S.S. All authors have read and agreed to the published version of the manuscript..
Funding
This research received no external funding.
Institutional Review Board Statement
Not applicable.
Informed Consent Statement
Not applicable.
Data Availability Statement
The data are available upon request.
Acknowledgments
The authors would like to thank the editors and the reviewers of Sustainability for all their efforts, especially Academic Editor: Aaron K. Hoshide. Sayed Saghaian acknowledges the support from the United States Department of Agriculture, National Institute of Food and Agriculture, Hatch project No. KY004052, under accession number 1012994.
Conflicts of Interest
The authors declare no conflict of interest.
References
- United States Department of Agriculture; Foreign Agricultural Service. United States Agricultural Export Yearbook; U.S. Department of Agriculture, Foreign Agricultural Service: Washington, DC, USA, 2019.
- Almond Board of California. Almond Almanac; Almond Board of California: Modesto, CA, USA, 2020. [Google Scholar]
- Regmi, A. China’s Retaliatory Tariffs on U.S. Agriculture: In Brief; Congressional Research Service: Washington, DC, USA, 2019. [Google Scholar]
- Williams, B.R. Trump Administration Tariff Actions: Frequently Asked Questions; Congressional Research Service: Washington, DC, USA, 2020. [Google Scholar]
- Konduru, S.; Asci, S. A Study of the Chinese Retaliatory Tariffs on Tree Nuts Industry of California. Theor. Econ. Lett. 2019, 9, 2747–2755. [Google Scholar] [CrossRef] [Green Version]
- Johnson, D.C. United States is World Leader in Tree Nut Production and Trade. In USDA-ERS Fruit and Tree Nuts Situation and Outlook. FTS-280; U.S. Department of Agriculture—Economic Research Service: Washington, DC, USA, 1997. [Google Scholar]
- Onunkwo, I.M.; Epperson, J.E. Export Demand for U.S. Almonds: Impacts of U.S. Export Promotion Programs. J. Food Distrib. Res. 2001, 32, 140–151. [Google Scholar]
- Zheng, Z.; Saghaian, S.H.; Reed, M.R. Factors Affecting the Export Demand for U.S. Pistachios. Int. Food Agribus. Manag. Rev. 2012, 15, 139–154. [Google Scholar]
- Sumner, D.A.; Matthews, W.A.; Medellín-Azuara, J.; Bradley, A. The Economic Impacts of the California Almond Industry; University of California Agricultural Issues Center: Berkeley, CA, USA, 2014. [Google Scholar]
- Carter, C.A.; Steinbach, S. Impact of the U.S-China Trade War on California Agriculture. ARE Update 2019, 23, 9–11. [Google Scholar]
- Almond Board of California. Almond Almanac; Almond Board of California: Modesto, CA, USA, 2019. [Google Scholar]
- Sumner, D.A.; Hanon, T.; Matthews, W.A. Implication of Trade Policy Turmoil for Perennial Crops. Choices 2019, 34, 1–9. [Google Scholar]
- Almond Board of California. California Almond Industry Facts; Almond Board of California: Modesto, CA, USA, 2016. [Google Scholar]
- Fulton, J.; Norton, M.; Shilling, F. Water-indexed Benefits and Impacts of California almonds. Ecol. Indic. 2019, 96, 711–717. [Google Scholar] [CrossRef]
- Marston, L.; Konar, M. Drought Impacts to Water Footprints and Virtual Water Transfers of the Central Valley of California. Water Resour. Res. 2017, 53, 5756–5773. [Google Scholar] [CrossRef]
- Howitt, R.; Medellín-Azuara, J.; MacEwan, D.; Lund, J.R.; Sumner, D. Economic Analysis of the 2014 Drought for California Agriculture; Center for Watershed Sciences, University of California: Davis, CA, USA, 2014. [Google Scholar]
- Sumner, D.A.; Hanak, E.; Mount, J.; Medellín-Azuara, J.; Lund, J.R.; Howitt, R.E.; MacEwan, D. The Economics of the Drought for California Food and Agriculture. Agric. Resour. Econ. Update 2015, 18, 1–6. [Google Scholar]
- Sumner, D.A.; Boriss, H. Bee-conomics and the Leap in Pollination Fees. Agric. Resour. Econ. Update 2006, 9, 9–11. [Google Scholar]
- United States Department of Agriculture. Honeybee Colonies; USDA National Agricultural Statistics Service: Washington, DC, USA, 2018.
- Lee, H.; Sumner, D.A.; Champetier, A. Pollination Markets and the Coupled Futures of Almonds and Honeybees: Simulating Impacts of Shifts in Demands and Costs. Am. J. Agric. Econ. 2019, 101, 230–249. [Google Scholar] [CrossRef] [Green Version]
- Aebi, A.; Neumann, P. Endosymbionts and Honeybee Colony Losses? Trends Ecol. Evol. 2011, 26, 494. [Google Scholar] [CrossRef] [PubMed] [Green Version]
- Arize, A.C. Traditional Export Demand Relation and Parameter Instability: An Empirical Investigation. J. Econ. Stud. 2001, 28, 378–396. [Google Scholar] [CrossRef]
- Guci, L. Exchange Rates and The Export Demand for US Grapefruit Juice; Research Papers 36816; Florida Department of Citrus: Bartow, CA, USA, 2008. [Google Scholar]
- Hooy, C.W.; Choong, C.K. Export Demand within SAARC Members: Does Exchange Rate Volatility Matter. Int. J. Econ. Manag. 2010, 4, 373–390. [Google Scholar]
- Konandreas, P.; Bushnell, P.; Green, R. Estimation of Export Demand Functions for U.S. Wheat. J. West. Econ. 1978, 3, 39–49. [Google Scholar]
- Bahmani-Oskooee, M. Determination of International Trade Flows. J. Dev. Econ. 1986, 20, 107–123. [Google Scholar] [CrossRef]
- Haniotis, T.; Baffes, J.; Ames, G.W. The Demand and Supply of U.S. Agricultural Exports: The Case of Wheat, Corn and Soybean. South. J. Agric. Econ. 1988, 20, 45–56. [Google Scholar] [CrossRef] [Green Version]
- Duffy, P.A.; Wohlgenant, M.K.; Richardson, J.W. The Elasticity of Export Demand for U.S. Cotton. Am. J. Agric. Econ. 1990, 72, 468–474. [Google Scholar] [CrossRef]
- Armah, B.K., Jr.; Epperson, J.E. Export Demand for U.S. Orange Juice: Impacts of U.S. Export Promotion Programs. Agribusiness 1997, 13, 1–10. [Google Scholar] [CrossRef]
- Saghaian, Y.; Reed, M.; Saghaian, S. Export Demand Estimation for U.S. Corn and Soybeans to Major Destinations. In Proceedings of the 2014 Southern Agricultural Economics Association (SAEA) Annual Meeting in Dallas, Dallas, TX, USA, 1–4 February 2014. [Google Scholar]
- Eenoo, E.V.; Peterson, E.; Purcell, W. Impact of Exports on the U.S. Beef Industry; Staff Papers 232380; Department of Agricultural and Applied Economics, Virginia Polytechnic Institute and State University: Blacksburg, VI, USA, 2000. [Google Scholar]
- Senhadji, A.S.; Montenegro, C.E. Time Series Analysis of Export Demand Equations: A Cross-Country Analysis. IMF Staff. Pap. 1999, 46, 259–273. [Google Scholar] [CrossRef]
- Cosar, E.E. Price and Income Elasticities of Turkish Export Demand: A Panel Data Application. Cent. Bank Rev. 2002, 2, 19–53. [Google Scholar]
- Gray, R.S.; Sumner, D.A.; Alston, J.M.; Brunke, H.; Acquaye, A.K. Economic Consequences of Mandated Grading and Food Safety Assurance: Ex ante Analysis of the Federal Marketing Order for California Pistachios; University of California: Davis, CA, USA, 2005. [Google Scholar]
- Boonsaeng, T.; Fletcher, S.M. The Impact of U.S. Non-price Export Promotion Program on Export Demand for U.S. Peanuts in North America. J. Peanut Sci. 2010, 37, 70–77. [Google Scholar] [CrossRef]
- Hussein, A. Structural Change in the Export Demand Function for Indonesia: Estimation, Analysis and Policy Implications. J. Policy Mark. 2009, 31, 260–271. [Google Scholar] [CrossRef]
- Jayasinghe, S.; Beghin, J.C.; Moschini, G. Determinants of World Demand for U.S. Corn Seeds: The Role of Trade Costs. Am. J. Agric. Econ. 2010, 92, 999–1010. [Google Scholar] [CrossRef] [Green Version]
- Soltani, M.; Saghaian, S. Export Demand Function Estimation for U.S. Raisins. Presented at the 2012 Southern Agricultural Economics Association (SAEA) Annual Meeting in Birmingham, Birmingham, AL, USA, 4–7 February 2012. [Google Scholar]
- Keeling, J.J.; Andersen, M.A. Welfare Analysis and Policy Recommendations for the California Raisin Marketing Order. Presented at the American Agricultural Economics Association Annual Meeting in Denver, Denver, CO, USA, 1–4 August 2004. [Google Scholar]
- Brant, M.; Marsh, T.L.; Featherstone, A.M.; Crespi, J.M. Multivariate AIM Consumer Demand Model Applied to Dried Fruit, Raisins, and Dried Plums (No. 378-2016-21219). In Proceedings of the American Agricultural Economics Association Annual Meeting, Providence, RI, USA, 24–27 July 2005. [Google Scholar]
- Boriss, H.; Brunke, H. Commodity Profile: Almonds; Agricultural Issues Center, University of California: Davis, CA, USA, 2005. [Google Scholar]
- Thirlwall, A.P. Balance of Payments Theory and the United Kingdom Experience; Springer: London, UK, 1986. [Google Scholar]
- Verbeek, M. A Guide to Modern Econometrics, 5th ed.; John Wiley & Sons, Inc.: Hoboken, NJ, USA, 2017. [Google Scholar]
- Hausman, J.A. Specification Tests in Econometrics. Econometrics 1978, 46, 1251–1271. [Google Scholar] [CrossRef] [Green Version]
- Baier, S.L.; Bergstrand, J.H. Do Free Trade Agreements Actually Increase Members’ International Trade? J. Int. Econ. 2007, 71, 72–95. [Google Scholar] [CrossRef] [Green Version]
- Williams, B.; Hammond, K.; Morrison, W.M. Escalating US Tariffs: Timeline; Congressional Research Service: Washington, DC, USA, 2020. [Google Scholar]
- U.S. Department of Agriculture, National Agricultural Statistics Services. 2012 Census of Agriculture. 2014. Available online: http://www.agcensus.usda.gov/Publications/2012/ (accessed on 12 May 2022).
- Bruno, E.M.; Goodrich, B.; Sexton, R.J. The Outlook for California’s Almond Market. Calif. Almond Acreage Rep. 2021, 24, 9–11. [Google Scholar]
- U.S. Department of Agriculture, National Agricultural Statistics Service 2020. California Almond Acreage Report. 2021. Available online: https://bit.ly/3wUXK0x (accessed on 12 May 2022).
- Davies, A. Tough Nut to Crack: The Almond Boom and Its Drain on the Murray-Darling. The Guardian. 2019. Available online: https://bit.ly/3hWPdpm (accessed on 12 May 2022).
Figure 1.
World almond production (in metric tons) 2010–2019. Source: USDA, Foreign Agricultural Service.
Figure 1.
World almond production (in metric tons) 2010–2019. Source: USDA, Foreign Agricultural Service.

Figure 2.
U.S. almond domestic consumption and exports. Source: USDA Foreign Agricultural Service.

Figure 3.
U.S. almond export trends to the top European Union and Asian countries. Source: USDA Foreign Agricultural Service.
Figure 3.
U.S. almond export trends to the top European Union and Asian countries. Source: USDA Foreign Agricultural Service.


Table 1.
Variable description and expected signs.
| Variable Description | Crop | Crop Type | Variable Name | Unit (t—Metric Ton) | Expected Sign |
|---|---|---|---|---|---|
| Export price to country i for quarter t | Almonds | Shelled | Pasit | USD/t | − |
| In-shell | Pansit | USD/t | − | ||
| Pistachios | Shelled | Ppsit | USD/t | +/− | |
| In-Shell | Ppnsit | USD/t | +/− | ||
| Walnuts | Shelled | Pwsit | USD/t | +/− | |
| In-shell | Pwnsit | USD/t | +/− | ||
| Gross domestic product (GDP) of country i for quarter t | n/a | n/a | GDPit | USD | + |
| Real exchange rate to USD for local currency of country i for quarter t | n/a | n/a | RERit | Local currency/USD | − |
| Free trade agreement status | n/a | n/a | FTAit | Dummy variable | + |
| Tariff increase | n/a | n/a | TARIFFit | Percentage increment | TBD |
Table 2.
Summary statistics for dependent and independent variable(s).
| Variable | Mean | Standard Deviation | Minimum | Maximum |
|---|---|---|---|---|
| Qit (shelled) | 8629.313 | 6990.599 | 621.2 | 28,927.4 |
| Qit (in-shell) | 5984.027 | 9593.538 | 14.6 | 49,544.6 |
| Pasit | 6228.745 | 1518.465 | 3650.5 | 10,579.5 |
| Pansit | 4930.853 | 1330.011 | 2347.4 | 10,671.1 |
| Ppsit | 7915.2 | 3425.189 | 3268.8 | 19,781.3 |
| Ppnsit | 7793.552 | 1470.735 | 4502.8 | 11,577.2 |
| Pwsit | 7647.324 | 1994.769 | 2655.3 | 12,117.9 |
| Pwnsit | 3974.492 | 1421.821 | 1318.2 | 11,055.5 |
| GDPit | 3685.353 | 3571.144 | 267.5503 | 14,317.78 |
| RERit | 30.57722 | 39.83349 | 0.6815718 | 124.3476 |
| FTAit | 0.1666667 | 0.3734568 | 0 | 1 |
| TARIFFit | 1.100417 | 0.6014277 | 1 | 5.5 |
Table 3.
The export demand model estimation results.
| Variables | Shelled U.S. Almonds Demand | In-Shell U.S. Almonds Demand |
|---|---|---|
| Export price of shelled U.S. almonds | −0.8121583 ** | −0.2062182 |
| Export price of in-shell U.S. almonds | −0.2002172 | −1.262263 ** |
| Export price of shelled U.S. pistachios | 0.0980747 | 0.317252 |
| Export price of in-shell U.S. pistachios | 1.531595 ** | 1.173499 ** |
| Export price of shelled U.S. walnuts | −0.1754965 | 0.5463877 |
| Export price of in-shell U.S. walnuts | −0.0132256 | 0.1278927 |
| Gross domestic product | −0.3146826 ** | −0.0972651 |
| Real exchange rates | −0.5453288 ** | −1.872415 |
| Free trade agreement status | 2.185382 ** | - |
| Tariff increase | 0.3742759 ** | 0.6287851 ** |
| R-Squared | 0.7328 | 0.3420 |
** Significant at 5%.
Publisher’s Note: MDPI stays neutral with regard to jurisdictional claims in published maps and institutional affiliations. |
© 2022 by the authors. Licensee MDPI, Basel, Switzerland. This article is an open access article distributed under the terms and conditions of the Creative Commons Attribution (CC BY) license (https://creativecommons.org/licenses/by/4.0/).
Share and Cite
MDPI and ACS Style
Ajibade, A.; Saghaian, S. U.S. Almond Exports and Retaliatory Trade Tariffs. Sustainability 2022, 14, 6409. https://0-doi-org.brum.beds.ac.uk/10.3390/su14116409
AMA Style
Ajibade A, Saghaian S. U.S. Almond Exports and Retaliatory Trade Tariffs. Sustainability. 2022; 14(11):6409. https://0-doi-org.brum.beds.ac.uk/10.3390/su14116409
Chicago/Turabian StyleAjibade, Abraham, and Sayed Saghaian. 2022. "U.S. Almond Exports and Retaliatory Trade Tariffs" Sustainability 14, no. 11: 6409. https://0-doi-org.brum.beds.ac.uk/10.3390/su14116409
Note that from the first issue of 2016, this journal uses article numbers instead of page numbers. See further details here.