Article

Assessing Africa’s Agricultural TFP for Food Security and Effects on Human Development: Evidence from 35 Countries

1
College of Economics and Management, Anhui Agricultural University, Hefei 230036, China
2
Research Center of Agricultural-Rural-Peasants, Anhui University, Hefei 230039, China
3
School of Economics, Lanzhou University, Lanzhou 730000, China
*
Author to whom correspondence should be addressed.
Sustainability 2022, 14(11), 6411; https://0-doi-org.brum.beds.ac.uk/10.3390/su14116411
Submission received: 12 April 2022 / Revised: 18 May 2022 / Accepted: 22 May 2022 / Published: 24 May 2022

Abstract

:
Population growth, food shortages, and low levels of human development have been longstanding issues confronting many African countries. Agricultural productivity remains a critical goal for mitigating these challenges and ensuring overall economic development. Total factor productivity (TFP) is a crucial metric for determining a sector’s overall growth. However, due to a lack of comprehensive assessments of the trends and determinants of TFP growth in African agriculture, there are disagreements. Within the context of inclusive human development, the impact of agricultural productivity is frequently misrepresented in the current literature. This paper estimated TFP growth and assessed its impact on human development in Africa. Due to technological improvement, TFP increased moderately at a 5.4% growth rate across African countries over the period (2001–2019). Empirical evidence indicates that TFP growth enhances human development in the long run, but the effect varies according to levels of human development (HDI) and the nature of growth over time. For instance, higher levels of human development tend to mitigate the impact of TFP. Further analysis revealed that technical efficiency improvement is critical for enhancing food safety and human development. Policy recommendations for improving TFP for food security and human development in Africa are provided. Further investigation into agricultural TFP’s impact beyond the poverty measure in Africa is encouraged.

1. Introduction

As Africa grapples with population growth, food shortages, and low levels of human development, agriculture remains a critical goal for addressing these issues and achieving overall economic development [1]. Improving agricultural total factor productivity (TFP) is critical to reducing food insecurity and poverty in Africa [2]. Many studies have found that agricultural growth has a greater positive impact in poor economies with low levels of human development than in developed economies [3]. For Africa’s food security, higher TFP growth is critical. Africa has a vast scope of agro-climatic conditions that allow it to grow a wide range of crops, including food and cash crops, as well as a diverse variety of livestock species. However, Africa’s agricultural sector is still dominated by smallholder farmers, with many relying on rain-fed agriculture, making the sector vulnerable to climatic changes and low productivity growth [4].
Food security is important because it is linked to health and wellbeing [5,6,7], and its impact on human capital is critical because hunger has a negative impact on people’s learning ability. Food security, according to the FAO, is defined as the availability, access, utilization, and stability of consumable food items at the individual and household levels. In economic terms, availability refers to the amount of food available in supply (food supply size), which is directly related to agricultural productivity. Given decades of low agricultural productivity growth around the world, food insecurity has a broader impact in most developing countries, particularly in Africa [8].
Despite the fact that Africa’s economic performance is heavily reliant on agricultural advances, little attention has been paid to conducting a comprehensive survey on the state of productivity growth and its determinants in the continent [9]. Consequently, opinions differ on TFP’s growth trends and its impact on Africa’s overall growth. Thus, the current literature on the state of African agriculture and its economic impact has more questions than answers, which makes many believe that agriculture’s role in Africa’s growth path should be rethought [10,11]. Apata, T.G. (2019) warned that if public policy mechanisms are not well-designed to meet the needs of the economy, they can have significant negative effects on the economy, with society bearing their consequences [12,13].
Hence, the need for careful consideration of the consequences of food insecurity on the continent has been raised in many scholarly works [1,2,11,14,15,16,17]. The Global Food Security Index (GFSI) measures food security in 113 countries, based on indicators of food affordability, availability, quality, safety, and natural resources and resilience. About 32 African countries were chosen based on the size of their population, and 16 of them were proven to be food insecure [18]. Although the definition of food insecurity is broad and extends beyond agricultural indicators, the solution to food insecurity in Africa is largely dependent on agricultural productivity growth [17,19,20].
On the other hand, the impact of agricultural productivity on economic growth and poverty reduction is frequently misrepresented in the context of inclusive human development. As a result of the lack of sufficient evidence to link agricultural TFP to human development, little is known about the sector’s overall contribution to inclusive growth in Africa [21]. In this context, this article emphasizes the relevance of agricultural TFP growth as a measure of food security in Africa and tested the impact of productivity growth in agriculture on a contemporary measure of inclusive growth and development (HDI). The main goal was to demonstrate how increased productivity growth in agriculture is critical for food security and how this affects human development. The rationale was that, rather than focusing the impact of agriculture on poverty and GDP (as has been the case in the current literature) [22,23,24], the assessment of agricultural productivity growth should be aimed at enhancing food sustainability and human development. This study is justified because poverty and GDP growth are normally assessed by financial indicators. In contemporary growth theories, these indicators have become inadequate quantifiers of national growth and development.
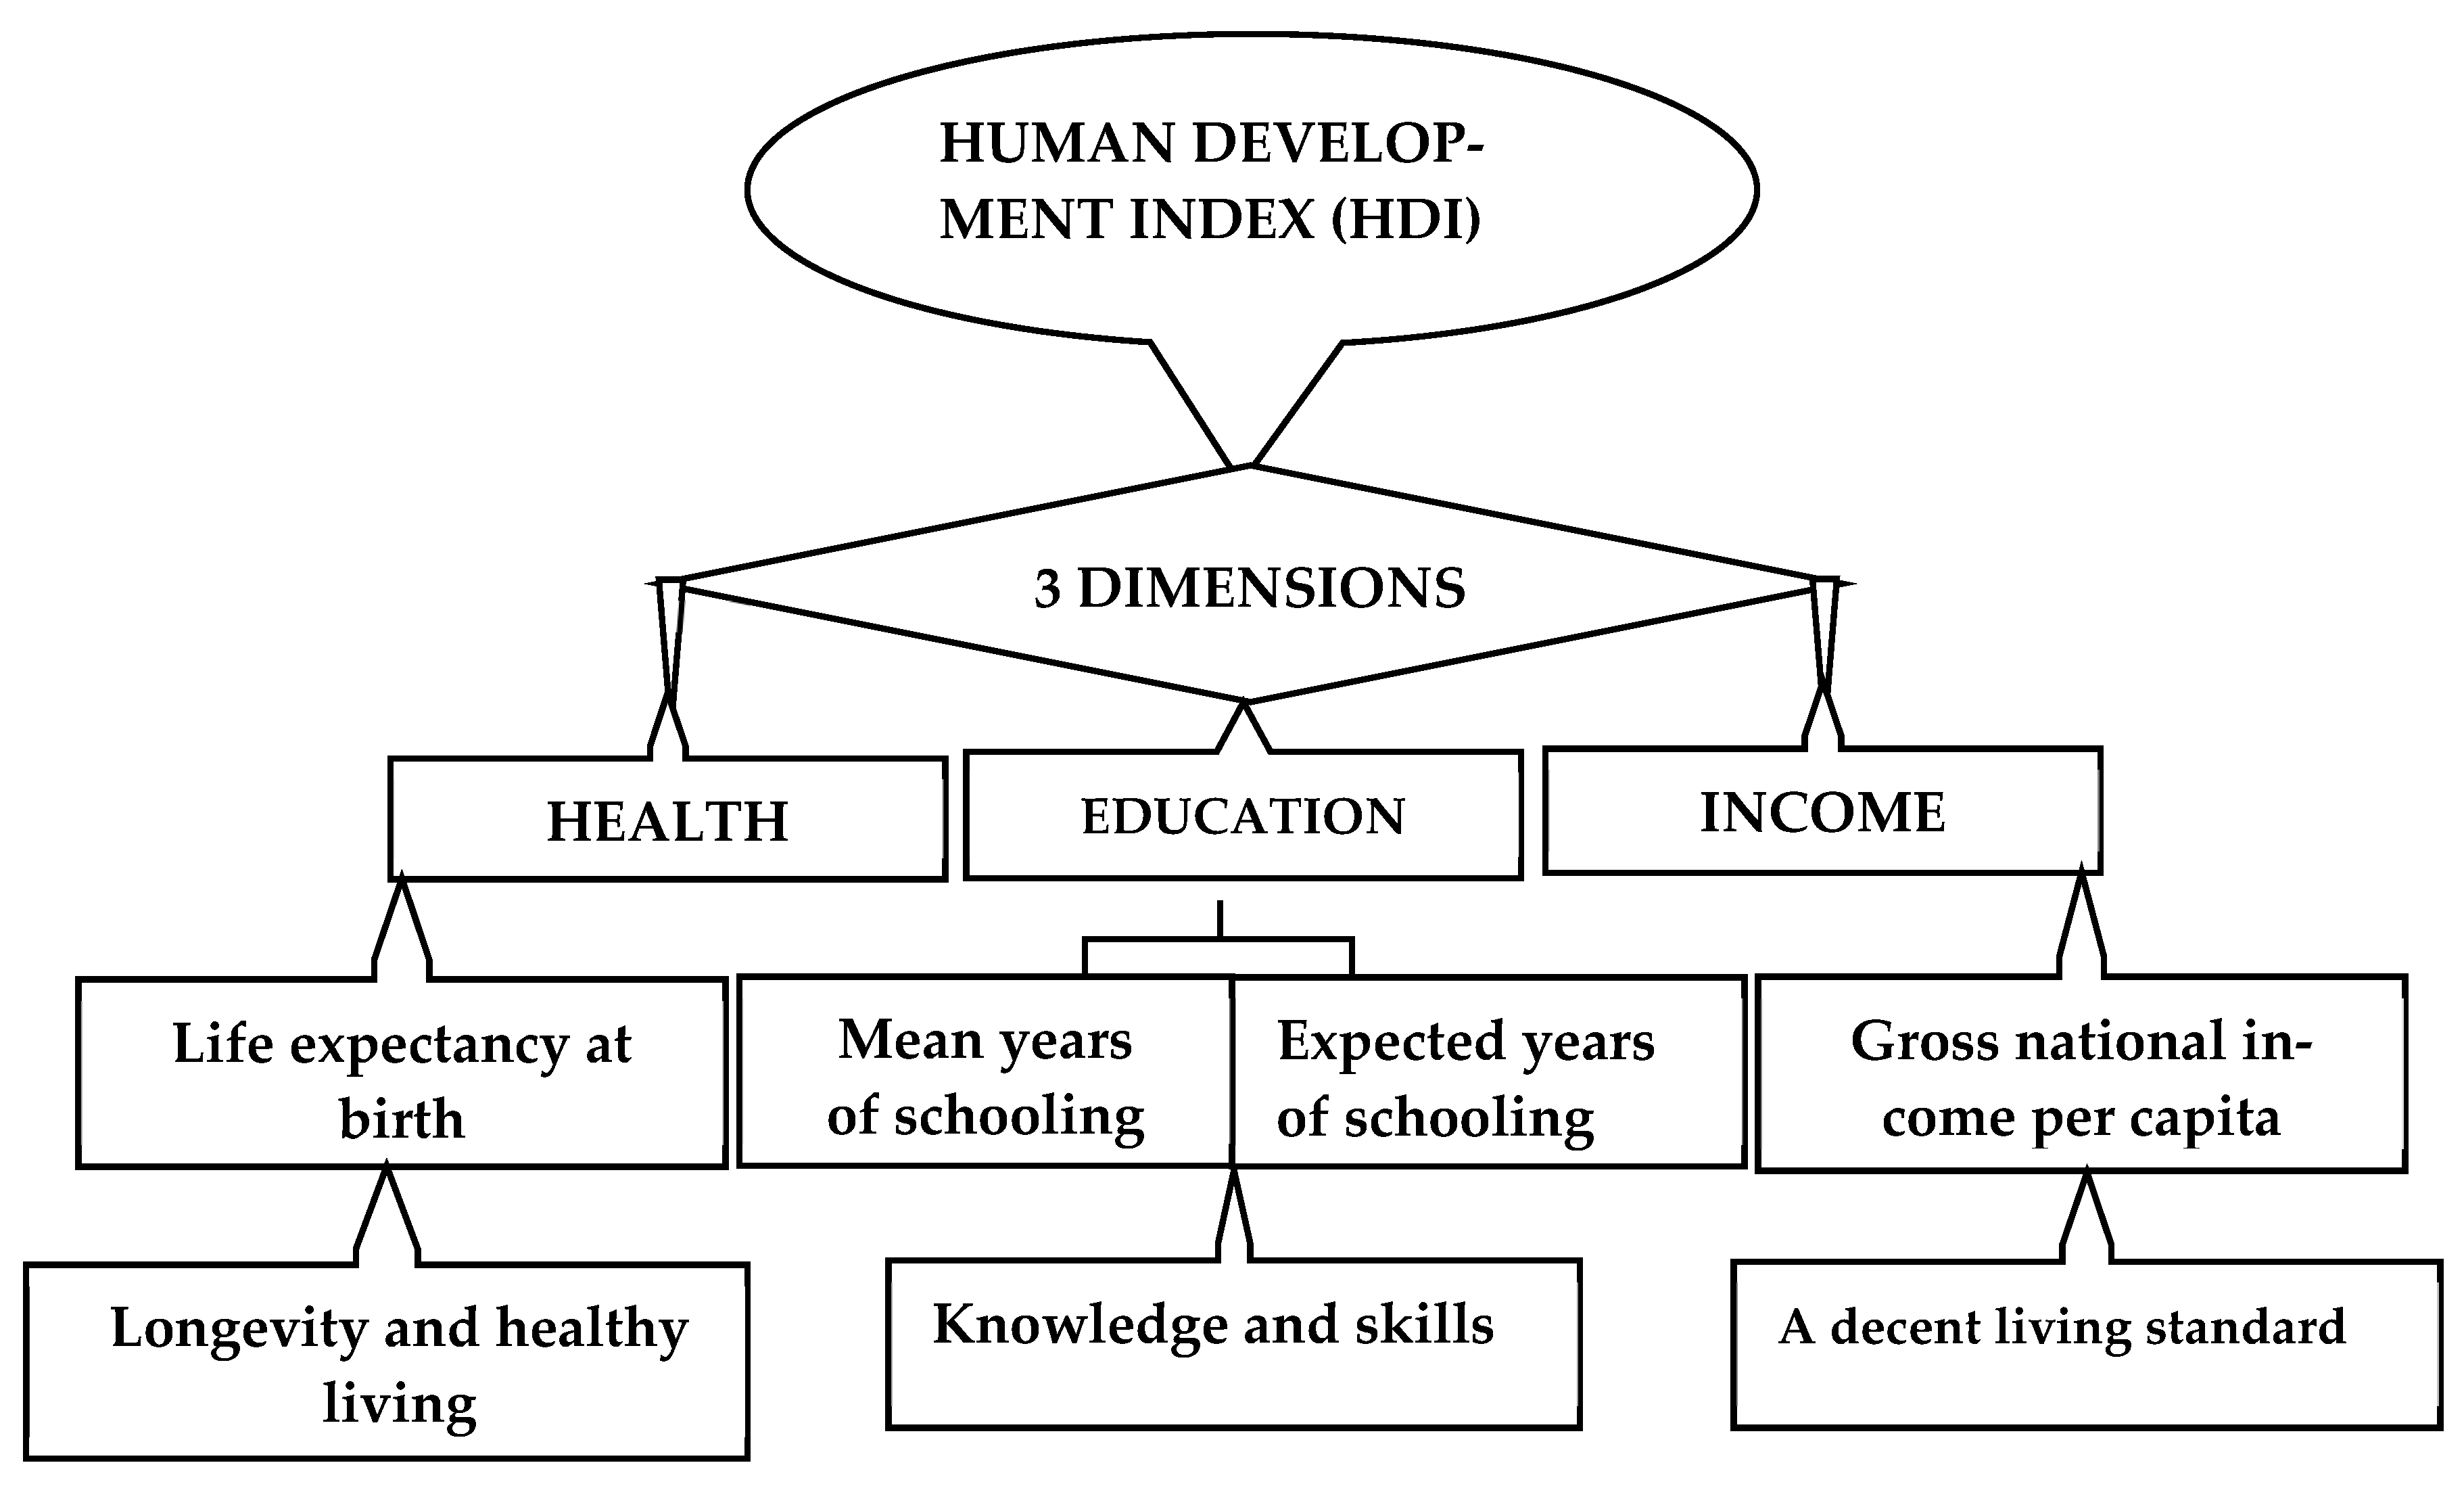
Therefore, the human development index (HDI) has recently become the most widely used indicator of inclusive development because it includes socioeconomic indicators such as education and health, as well as financial indicators such as GNP [25]. The HDI is seen as a step toward a more precise and comprehensive measure of socioeconomic wellbeing. Human development, according to the HDI, leads to economic growth because more education, better health, and higher living standards make a country more productive, which leads to more inclusive economic growth [26]. Given that there is a wealth of evidence that agriculture is important for food security and income, it makes sense to update the analysis of how agriculture affects current economic development indicators such as the human development index (HDI).
Hence, the first objective of this study was to conduct an in-depth analysis of Africa’s agricultural total factor productivity (TFP) in order to provide new estimates and provide policymakers with options for making informed decisions. TFP is an index measure of the overall productivity growth of a sector; it is the ratio of output produced to the amount of all inputs used. Its measure and application is crucial in the analysis of Africa’s growth dynamics [10,15,20]. TFP was calculated using the DEA-Malmquist technique proposed by Färe et al. (1994). Unlike previous studies, the data used in this study cover the years 2001 to 2019 for 35 African countries. The study determined what drives productivity growth and whether TFP increased, remained stable, or decreased during the referenced period.
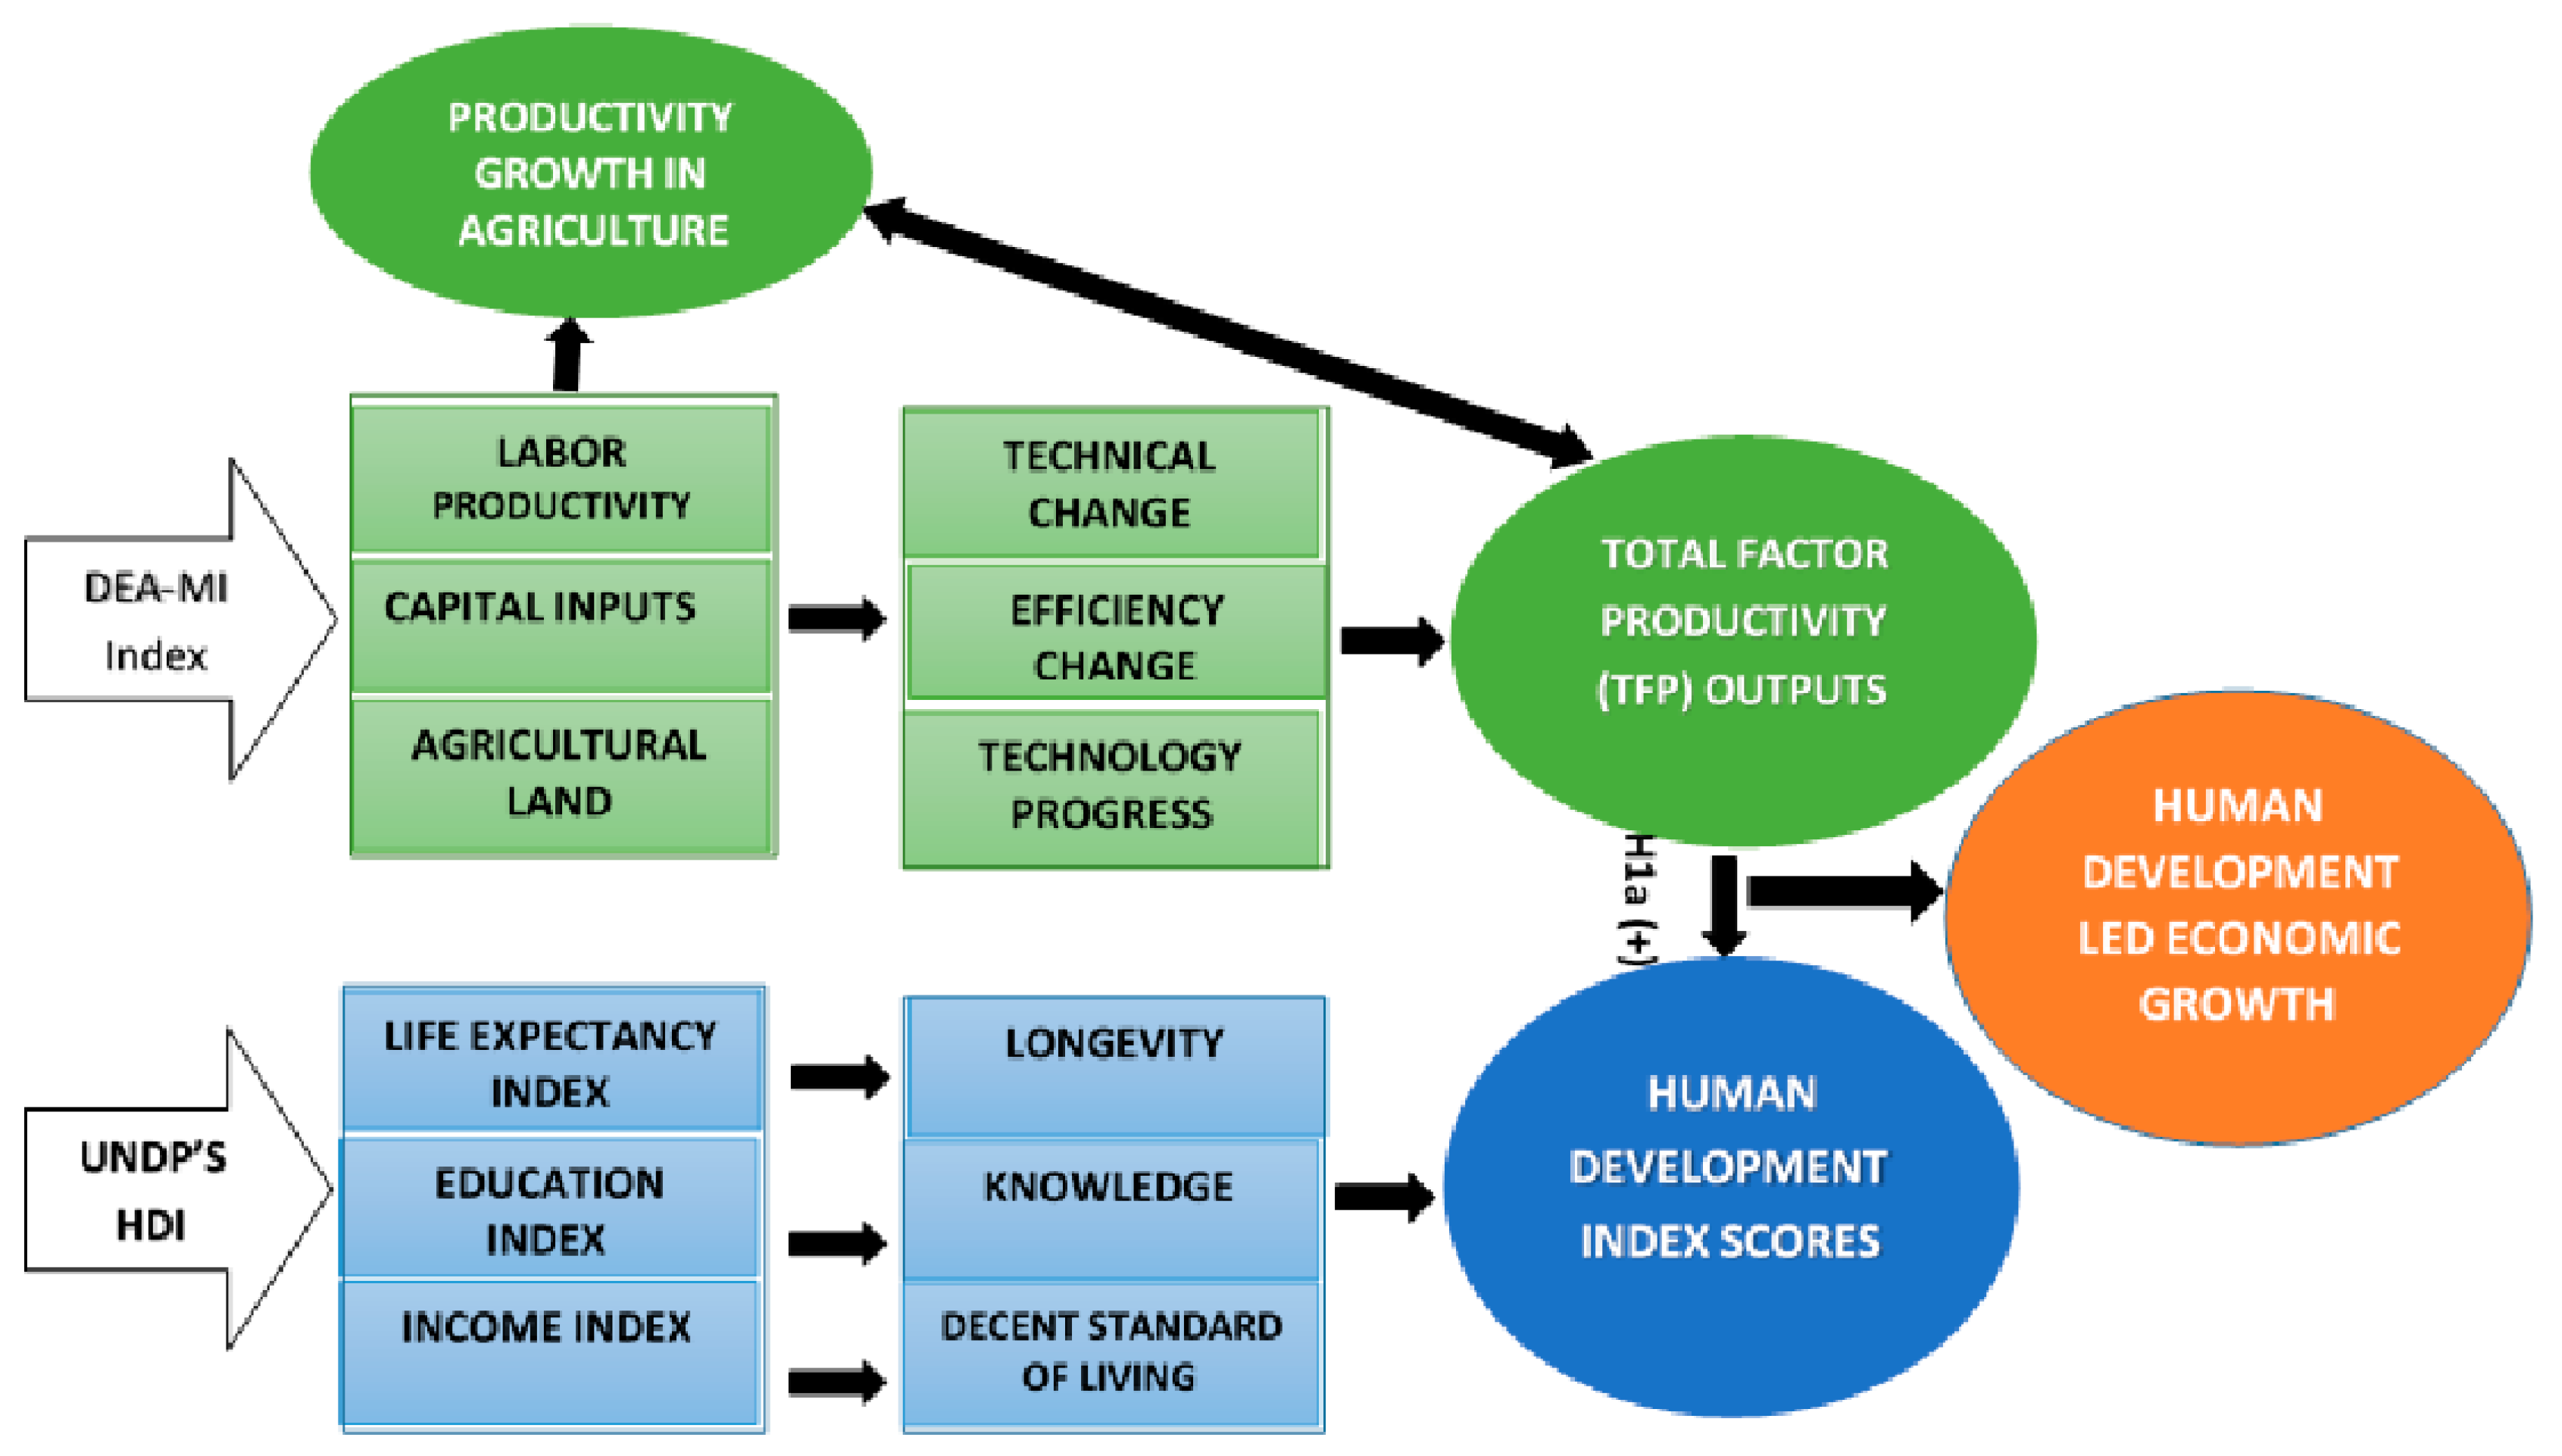
The second objective was to empirically investigate the link between human development and agricultural TFP, and make some concluding remarks about this link, as well as recommend programs and policies to promote inclusive economic development in Africa based on empirical evidence (Figure 1). The effects of TFP growth on human development were estimated using Anderson and Hsiao’s dynamic panel IV model (1981). To the best of our knowledge, this is the first time this approach was used in the analysis of African agriculture.
Consequently, we believe the research contributes to the existing body of knowledge in the following ways: first, given Africa’s low level of human development, many African countries are looking for evidence-based policy tools to help them make decisions about how to improve their human development status and meet international development goals such as the Sustainable Development Goals (SDGs, 2030). The concept of human development (HDI) informs this vision (SDGs, 2030). For example, SDG 1 (to end poverty in all its forms by 2030) and SDG 2 (to end hunger) cannot be met in Africa unless significant progress is made in improving food security, improving nutrition, and promoting sustainable agricultural development. Additionally, these two goals may help reach the sustainable development vision (SDGs 2030) as a whole because they are linked to other goals (see SDGs 8 and 10).
Second, given the agricultural sector’s significance in Africa’s growth dynamics, understanding productivity growth trends is critical when considering how the sector can help policymakers achieve national growth and development. In this context, considering the disagreement and lack of current information on the productivity growth trend in Africa, the findings of this study can be useful in this regard.
Lastly, the method used in this study included indicators of inclusive growth such as the human development index (HDI) and total factor productivity (TFP), which are important tools for analyzing contemporary growth dynamics. Hence, the contribution of this study may be beneficial to both policymakers and academics.
The remainder of our work is divided into five sections, including the introduction; Section 2 presents the study’s theoretical background, and Section 3 describes the methodology and materials used for analysis. Section 4 summarizes our findings, and Section 5 discusses the study’s implications.

2. Theoretical Background

2.1. Linking Agricultural Productivity to Human Development

Agriculture has advanced in lockstep with human progress. Hunting was one of the first attempts made by humans to ensure their survival and improve their standard of living. People’s desire to cultivate crops also resulted in settlements and trade links among various groups of people, allowing human societies and cultural orientations to evolve over time. As the human population grew, so did the size and complexity of these settlements and trade systems [27]. According to archeologists, farming became the primary means of subsistence for humans around 10,000 years ago and remained so until the seventeenth-century industrial revolution. The development of agriculture has been studied by both historians and agricultural economists (New World Encyclopedia contributors, 2020).
Empirical studies about this link, however, have mostly focused on how income from agricultural development contributes to economic growth and reduces poverty [28,29,30,31]. Moreover, the majority of these studies have employed partial measures of productivity growth such as labor, capital investment, and land use analyses. Additionally, these analyses have focused on partial indicators of human growth, such as education and health. Hence, little is known about the empirical link between the aggregate measure of productivity growth in agriculture (TFP) and inclusive human development (HDI).
Recently, Self and Grabowski [32] attempted to close this gap by testing the impact of agricultural technology on human development using per capita GDP and the 20-year average HDI scores; they discovered that agricultural technology had a causal relationship with wellbeing and economic growth. Similarly, Ahao, A.O. et al. [33], investigated the impact of agricultural productivity on the HDI, as a measure of poverty, using the OLS method. According to the researchers’ findings, a unit increase in agricultural productivity growth reduced poverty by 0.69 percentage points. In addition, they employed the Malmquist productivity index on a panel of 42 developing countries for 39 years. They came to the conclusion that a 1 percent increase in technological advancement would have a 1.3 percent impact on human development. Lindner and Wagner [34] used the least squares dummy variable method on 29 years of data in 27 sub-Saharan African countries (SSA). They reported a significant but minimum impact of agricultural productivity on human development.
It is clear from the foregoing discussion that empirical evidence demonstrating a direct link between agricultural productivity growth and human development is lacking in the current literature. Therefore, the article attempted to fill this gap by assessing the impact of TFP growth on human advancement in Africa as a food security metric. The study is based on the UN’s concept of human development (HDI) and the FAO’s definition of food security (FS). As a result, we provide new perspectives by departing from the current literature, which focuses on the impact of agriculture on poverty and GDP growth, and incorporating more recent growth and development indicators, such as the HDI.

2.2. An Overview of the Human Development Index (HDI)

In the 1990s, the late Pakistani economist Mahbub-ul-Haq collaborated with the Indian professor Amartya Sen to develop the concept of human development (HDI). The HDI can be used in place of traditional measures of human achievement. Since the 1990s, many researchers have used the human development index (HDI) to measure human progress [35,36,37]. Human progress can be measured in three ways, according to the United Nations Development Program (UNDP) [26,38]: increased education; increased life expectancy; and increased access to a decent standard of living. Progress in these dimensions is used as a measure of a country’s development in the annual reports of the United Nations Development Program (UNDP). The HDI divides countries into four categories: extremely high, high, medium, and low [39]. The main argument of the HDI concept has been to challenge the historical national accounting notion of real GDP per capita as an insufficient indicator of living standards. Poverty is defined solely as a lack of income as a result of this mindset.
The HDI, on the other hand, has been criticized as being redundant and highly correlated with GDP per capita [40,41,42]. Although some researchers have questioned this claim and supported the HDI’s linear association between variables [41,42], the UNDP has modified variables used in the HDI metrics to address critics’ concerns. For example, the standard of living variable, GDP per capita, has been replaced by per capita GNI (gross national income); for education, mean years of schooling and expected years of schooling have replaced the literacy rate variable; and for health, life expectancy has been retained (see Figure 2 for the HDI construct). Data for all variables are freely available and can be downloaded directly from the UNDP’s official databases. Therefore, the study used HDI scores calculated by the UNDP from their official databases. According to the data (HDI scores), many countries in Africa have seen a small but steady rise in the level of human development (2002–2019).

3. Materials and Methods

3.1. Study Sample and Design

This study covered 35 African countries drawn from five regional subdivisions of the African continent, covering a period from 2001 to 2019. A combination of random and purposeful techniques were utilized. Countries were first selected randomly across Africa, but while collecting data, it was observed that some countries did not have data for all variables and all periods. Those countries were replaced with those with the required data.
To estimate productivity growth and determine its effect on human development, we derived a two-stage exploration strategy (see Figure 3). First, the DEA-Malmquist productivity index was employed to estimate TFP in Africa. The TFP result was then interpreted using the macro-analysis approach. The outcomes of countries were studied based on regions and levels of human development. Second, the dynamic panel IV (instrumental variable) model, as proposed by Anderson and Hsiao (1981) [43], was used to quantify the impact of TFP change on human development in Africa. To account for endogeneity and assure the reliability and consistency of empirical conclusions, appropriate panel data validation procedures were executed [43,44]. The study concludes with policy suggestions that can help Africa’s economy grow faster and more inclusively.

3.2. DEA-Based Malmquist Index

The DEA-based Malmquist index is a nonparametric data envelopment analysis that estimates the production frontier using a linear programming system (LPS). This method is extensively used to assess the relative efficiency of decision-making units (DMUs) with identical production technologies (i.e., inputs and outputs), and its introduction has boosted total factor productivity research [10,45,46,47,48].
The index accounts for the movement of the frontier as well as the distance between each production entity and the frontier. Countries (DMUs) that have adopted best practice technology as a result of innovations have the potential to be located on the frontier. The movement of the production frontier as a result of a specific DMU (country) input combination is referred to as technological advancement. The Malmquist index also decomposes productivity change into technical efficiency changes and a component of technological progress. One of its advantages is that it assesses changes in productivity over time without imposing previous assumptions on parameter and data dimension estimation [10,49,50]. Based on the constant return to scale assumption (CRS), this paper applied the single output-oriented DEA-Malmquist index to measure TFP growth in Africa’s agriculture.
Thus, the Malmquist distance function at time t, for the production technology under the CRS assumption, where the period starts from one and so on (t = 1, …, T), and the production technology of the output-oriented   P t O model at each period (t) for a given DMU that transforms inputs x t R + N into outputs y t R + M d are defined following (Färe et al., 1994; Färe, 1988):
P t O c r s = x t ,   y t : x   p r o d u c e s   y
The output distance function at period (t) following Shepherd’s (1970) is given as follows:
D t 0 y t ,   x t = m i n θ : x t , y t P t O c r s   = m a x θ : x t , y t P t O c r s 1
Equation (2) is the reciprocated maximum relational expansion of the output vector y t , relative to inputs x t , with their corresponding time (t) dimensions. For any given difference in two time periods (t + 1), the distance function technology is computed below:
D t 0 y t + 1 ,   x t + 1 = m i n θ : x t + 1 , y t + 1 / θ P t O c r s
Concerning to Equation (3), the index productivity change from period t to t + 1 can be written as follows (Fare et al. 1994):
D t 0 y t + 1 ,   x t + 1 , y t ,   x t = d t 0 x t + 1 , y t + 1 d t 0 x t , y t d t + 1 0 x t + 1 , y t + 1 d t + 1 0 x t , y t 1 / 2
where x t + 1 , y t + 1 and x t , y t represent vectors of productivity factors (input and output) for the periods t and t +1, respectively; the distance from period t to period t + 1 technology is denoted by the function   d t 0 x t , y t , where a value of D 0 > 1 shows TFP growth regarding period t and t + 1. Similarly, a value of D 0 < 1 signals a TFP decline, while D 0 = 1 denotes productivity stagnation. Note, D 0 is the geometric mean of two TFP indices for a given period Caves et al. (1982).
At the right-hand side of Equation (4), the first component in the bracket d t 0 x t + 1 , y t + 1 d t 0 x t , y t represents the referenced technology which is denoted by period t. while the second component d t + 1 0 x t + 1 , y t + 1 d t + 1 0 x t , y t   represents the period t + 1 reference technology. Importantly, this component can be further decomposed into two separate mechanisms: efficiency change (EFCH) and technological change (TECH) as shown in equations (5 and 6 below). Note: The numerators and denominators of the two reference technologies in Equation (4) represent separate distance functions:     d t 0 x t , y t ; d t + 1 0 x t , y t ; d t 0 x t + 1 , y t + 1 ; and d t + 1 0 x t + 1 , y t + 1 , which must be calculated through a linear programming method [51]. Each function calculates the comparative explicit efficiency of a given DMU (country).
E F C H = d t + 1 0 x t + 1 , y t + 1 d t + 1 0 x t , y t  
T E C H = d t 0 x t + 1 , y t + 1 d t + 1 0 x t + 1 , y t + 1 × d t 0 x t + 1 , y t + 1 d t + 1 0 x t + 1 , y t + 1 1 / 2      
Hence, the mathematical expression for the decomposed Malmquist index as referenced in Equations (4) and (5) can be written as follows (Färe et al., 1994):
  M t 0 y t + 1 ,     x t + 1 , y t ,   x t = d t 0 x t + 1 , y t + 1 d t 0 x t , y t d t + 1 0 x t + 1 , y t + 1 d t + 1 0 x t + 1 , y t + 1 × d t 0 x t + 1 , y t + 1 d t + 1 0 x t , y t 1 / 2      
The component outside the bracket represents efficiency change (EFCH) in Equation (5). It indicates changes that occur in the ratio of the actual output that can enable an efficient DMU to move to a more efficient frontier as a result of efficient use of production factors (land, labor, and capital). It captures the ‘catch-up effect’ between two periods (i.e., period t and t + 1). While the second is the technological change component (TECCH); it represents the potential movement of a productive technology toward the frontier between two periods (t and t + 1) [52].

3.3. Dynamic Panel IV Model

Panel data are widely studied because they are more informative and flexible. They allow for extra variability, less collinearity, and increased degrees of freedom [46,48,53]. However, based on the nature of the panel, endogeneity biases may arise due to a correlation between explanatory variables and idiosyncratic errors [43,54]. To address this problem, many estimation approaches have been recommended, among which is the Anderson–Hsiao (1981) technique. In comparison with traditional GMM estimators, many studies have found the computational power of the Anderson–Hsiao estimator to perform quite well in a moderately increasing panel [43]. It stands as one of the most efficient ways of dealing with endogeneity problems in panels with a relatively large dimension (N and T), like in our panel. Considering this, we assessed the impact of TFP growth on human development using Anderson and Hsiao’s (1981) approach for error corrections in dynamic panel estimation.
We assumed agricultural TFP is correlated with some of our regressors, especially the education and physical assets variables [55]. The correlation between the HDI and its components was also taken into account, especially the income measure, which is a proxy for standard of living. As a result, the unobserved individual effects in the error term may be correlated with some of our regressors, which would bias our coefficients when considering the ordinary least squares (OLS) estimators [35]. Thus, we employed the Anderson and Hsiao (1981) approach in our dynamic panel estimation.
The dynamic fixed-effects panel model is as follows:
y i t = β 0 + δ Y i , t 1 + β 1 x i t + α i + μ i t
Equation (8) introduces a lag of the dependent variable as one of the regressors, indicating the dynamic nature of the model. However, due to the potential of endogeneity, the usual LSDV estimator for fixed effects is not the best choice in dealing with endogeneity problems [56]. To estimate this model and account for endogeneity, Anderson and Hsiao (1981) suggested a two-in-one approach: first, remove the fixed effect by employing the first difference transformation, and second, introduce the second or third lag of the dependent variable as an instrumental variable in the model. Thus, we began this process by starting with the fixed-effects transformation:
Y i t Y ¯ i = δ Y i , t 1 Y ¯ i , 1 + β 1 X i t X ¯ i + μ i t u ¯ i
The demeaned version of the fixed-effects model (9) eliminates any endogeneity bias associated with individual-specific effects. However, there are idiosyncratic errors μ i t u ¯ i in the model that were deemed uncorrelated with our exogenous variable but may still be correlated with the new demean version Y i t Y ¯ i , t 2 . Employing the first difference transformation in the fixed-effects estimator only enhances the consistency of the model in the elimination of individual-specific effects (ai) but does not effectively deal with endogeneity bias. An introduction of instrumental variables is an appropriate option. Below is the first difference in the equation:
Y i t Y i , t 1 = δ Y i , t 1 Y i , t 2 + β 1 X i t X i 1 + μ i t μ i , t 1
This equation can be rewritten as follows:
Δ Y i t = δ Δ Y i , t 1 + β 1 Δ X i t + Δ μ i t
the difference in the idiosyncratic error term μ i t μ i , t 1 , where μ i , t 1 directly affects Y i , t 1 in that time period in the first difference transformation δ Y i , t 1 Y i , t 2 , results in a correlation between the differenced error term Δ μ i t and the differenced lagged dependent variable δ Δ Y i , t 1   in the equation, which can cause an endogeneity problem [43,57].
To address this situation, we followed Anderson and Hsiao’s (1981) second recommendation and introduced an instrumental variable by reaching back to two periods Y i , t 1 Y i , t 2 and adopting the 3rd lag Δ Y i . t 3 of Equation (11) as our instrumental variable. With the introduction of an instrumental variable at period t − 2 or t − 3, any correlation between period t and t − 1 is broken. This is because there is no overlapping of time periods that can result in endogeneity bias in the data.
We thus defined our panel dimension (N × T) and modeled our variable by following [58]:
Δ Y i t = β 1 Δ Y i t 1 + β 2 Δ lnHDI index i t + β 3 lnTFPCH i t + β 4 lnedu expBTH i t + β 5 lnFSI GDPpc i t + β 6 lnedu EYS i t + β 7 lnlif expBTH i t + Δ μ i t
Hence, we used STATA (16.0) software to estimate the above model. For the IV specification, we used the first difference option (FD), the 3rd lag of the dependent variable (t − 3), or Δ Y i , t 3 as an instrument for   Y i , t 1 .

3.4. Variable Selection, Measurement, and Data Sources

We used a single output and three input variables (land, labor, and capital) to calculate the Malmquist index. Table 1 contains summary statistics of variables used in the Malmquist estimation. Variables were selected based on the work of previous researchers [6,8,17,21,28]. The output variable used in the Malmquist index is a value-added measure of agriculture, forestry, and fishing (in current US dollars). The value-added (TFPVA) measure in agriculture assumes that intermediate inputs cannot be substituted in production for capital, labor, or land [59,60]. Many studies have shown that resource constraints limit farmers’ ability to use improved intermediate inputs in African agriculture [7,61]. The agricultural labor variable was approximated by the number of men and women, aged 15 and above, who are economically active in agriculture. Agricultural land was calculated by the amount of agricultural land used per 1000 ha. Consumption of fixed capital in agriculture, forestry, and fishing was used as a proxy for capital investment in African agriculture while assuming a homogeneous utilization of fixed assets. A more detailed description of these variables is given in Table A1, Appendix A.
In the second analysis, the HDI was used as the dependent variable (see Section 2.2 for details). The main explanatory variable was the TFP outputs obtained from the DEA-Malmquist estimate using STATA 16.0 software. TFP growth is thought to boost food availability and accessibility, a concept known as “food security” [18,62]. As a result, it is used to assess the impact of African agriculture on human development (HDI) as a proxy for food security (FS). The gross domestic product per capita (PPP, distribution, constant 2011 international dollars) was our second measure of food security. In the FAOSTAT database, it is a food security indicator under the access to food classification. It was chosen as a proxy for other food security measures that take into account the entire domestic economy, including non-agricultural sectors.
The HDI three-dimensional indicators were also included as variables (knowledge, standard of living, longevity, and healthy living). To quantify knowledge, the mean and expected years of schooling were used. The standard of living variable was GNI per capita based on purchasing power parity (PPP); its value was normalized using a logarithmic transformation. Life expectancy at birth, which is calculated in each country at the time of a child’s birth, was used to assess longevity and healthy living. Its index was normalized so that it equals 0 when life expectancy is 20 and 1 when life expectancy is 85. The HDI was created using data from UNDP databases and the World Bank [63]. The data were collected from 35 African countries, covering the period between 2001 and 2019. The summary statistics for variables used in the dynamic panel IV regression model are shown in Table 2.

4. Results

Following [46,48,64], we estimated the DEA-based Malmquist method using the command “malmq2” developed in STATA version 16.0 software. This command enables the decomposition of TFPCH outputs and its three components (TECH, TECCH, and SECH) in the most consistent manner that can easily be used for further analysis. Consequently, we used the annual TFPCH scores to assess the influence of productivity growth on human development in Africa. This section begins with the results of the Malmquist index, followed by the results of the Anderson–Hsiao’s (1981) first-differenced IV panel regression model.

4.1. DEA-Based Malmquist Result

According to the Malmquist estimation, agricultural TFP in Africa experienced moderate growth over the study period. Between 2001 and 2019, TFP increased by 5.4% (1.054) on average across countries and over time. With the exception of Zambia, which saw a decline in productivity (0.956), the results showed that 18 countries grew with productivity growth rates mostly between the range of 5% and 10%. Among the countries with growth rates exceeding 10%, Zimbabwe experienced the highest (18.4 percent), follow by Egypt (14.2 percent), Ghana (11.9 percent), Cote d’Ivoire (11.4 percent), and Nigeria (11.0 percent). Table 3 shows the results of the distribution of the TFP growth rate and its determinants for the 18 countries.
Technological progress (TECH) was the most important determinant of TFP growth, with a mean of 1.082. TFP growth was also affected by a slight increase in technical efficiency (TECH—1.022) and a slight decrease in scale efficiency (0.996). This implied that African agriculture has become more technologically dependent in recent years. However, the rate of technological advancement varied greatly among countries and regions. Differences in the availability, quality, and usage of production technologies such as labor, land, and capital resources coupled with environmental factors such as climate change were among the major determinants of the observed heterogeneity in growth patterns across countries and regions in Africa. This was also true for most of the countries whose growth rates fell below 5%. These countries struggle to stabilize productivity and the limited technical capacity and decline in scale efficiency hindered their ability to experience substantial growth in the sector.
The variation in TFP as explained by productivity determinants revealed much about African countries’ TFP growth patterns. Zimbabwe, for example, grew by 13.8% due to increased technical efficiency (TECH) rather than technological advancement. Explained another way, technical efficiency accounted for 13.8% of Zimbabwe’s 18.5% TFP growth during that time period. TFP growth in Egypt, the second most productive country, was fueled by the polar opposite of Zimbabwe’s, and TFP growth in Ghana, the third most productive country, was fueled by a mix of technical and technological changes. It is also worth noting that these countries are spread across Africa’s various regions. When used as case studies for regional classification, it was clear that regional divergences play a significant role in explaining Africa’s growth. As a result, regional cooperation is critical for Africa’s inclusive growth and development. Figure 4 illustrates the trends and patterns of TFP growth from 2001/2002 to 2018/2019 for the 35 countries in our sample.

4.1.1. TFP Annual Results (2001/2002–2018/2019)

As can be seen in Table 4, TFP increased at a 5.4% annual rate during the period, with higher growth rates in 2004, 2008, 2003, and 2005 (14.8, 13.6, 10.6, and 10.9%, respectively). TFP growth rates were less than 5% for most of the periods. Higher growth occurred mainly between 2003 and 2009, while 2013 and 2019 saw the lowest productivity growth. A slight decline in productivity was observed in 2015 (0.976). Meanwhile, annual TFP growth was mostly due to technology innovation (TECCH), which grew at a 9.5% annual rate. In comparison, scale efficiency change (SECH) and technical efficiency (TECH) somewhat declined (0.986 and 0.997, respectively). Agricultural TFP growth in Africa is slow and moderate, according to a number of studies [10,33,49,61,65].

4.1.2. Regional Analysis of TFP Results

The regional analysis approach examines how agricultural TFP growth varies across regions and levels of human development (Table 5). We employed this approach to deepen our understanding on how geographical and sociodemographic factors may explain productivity growth in African agriculture. The finding from this comparative analysis revealed that North Africa experienced the highest TFP (1.067) growth rate of all African sub-regions. Western and Central Africa came in second and third, with 1.058 and 1.057, respectively. Eastern and Southern Africa had the lowest average TFP growth rates in the regional classification of TFP growth trends (1.045 and 1.043, respectively). Growth in East, North, and Southern Africa was solely driven by technological advancements, whereas growth in Central and West Africa was influenced by other factors such as technical efficiency and scale efficiency. Importantly, the analysis of TFP growth varied modestly across human development levels. At both high and medium levels of human development, TFP grew at the same rate. On the contrary, many countries in the low human category experienced lower growth rates in TFP.
The determinants of productivity growth, on the other hand, differed across HDI levels. TFP increase in the high and low human development categories was due mainly to technology improvements, while in the medium human development category, technology improvement (1.064) was backed by technical efficiency (1.016). This demonstrated that a wide range of regional differences contribute to Africa’s growth [11,21,66]. When discussing the future of African growth, policymakers must consider the consequences of these regional inequalities.

4.2. Empirical Analysis

Testing for Stationarity, Cointegration, and Cross-Sectional Dependence

Depending on the nature of the data or estimation techniques, the data and variables used in econometric analysis are usually subjected to some form of empirical examination. This is necessary to ensure the accuracy of the coefficient estimates [44,67]. Several procedures for unit root tests and cointegration for panel data models have recently been developed in STATA software. In order to learn the stationary properties and cointegration relationship between our key variables, we used the xtcointtest and xtunitroot commands in STATA 16.0 software to perform the Kao (1999), Pedroni (1999, 2004), and Westerlund (2005) tests of cointegration on our panel variables. The null hypothesis for all of these tests was that cointegration does not exist. The alternative hypothesis of the Kao and Pedroni tests was that the variables are cointegrated in all panels. In one version of the Westerlund test, the alternative hypothesis was that “the variables are cointegrated in some of the panels,” whereas the alternative hypothesis in the other version was that “the variables are cointegrated in all of the panels.” We used both versions but only reported on one because the test results were not statistically different. Because cross-sectional averages must be considered, we added the demean option to the xtcointtest specification (Levin, Lin, and Chu) (2002). Appendix B contains the results in Table A2 and Table A3. The correlation matrix is also reported in Table A4.

4.3. Empirical Results of the Effects of TFP

The Anderson–Hsiao specification eliminates country-specific effects while applying the first-difference transformation to the two-stage (2sls) IV estimator. These effects are eliminated in the fixed-effects transformation because of their potential association with the lagged outcome variables. We avoided using the traditional GMM estimator to reduce the risk of instrument proliferation biasing our parameter estimates (Asongu and Odhiambo, 2020). The result showed that agricultural TFP had a long-term impact on human development (Table 6). However, the nature of this effect depended on the level of TFP growth over time. For instance, higher TFP growth rates commanded higher effects, while lower TFP growth rates had a mitigating effect on human development. Evaluating the effect of the decomposed production technologies (TECH, TECCH, and SECH) on human development, we found improved technical efficiency in agriculture to be a significant factor for long-term impact on human development in Africa. In further analysis, we predicted the linear connections of the two variables (HDI and TFP). We discovered that TFP’s influence reduced as the level of human development rose, implying that TFP’s impact was stronger in developing countries but weaker in industrialized nations. This conclusion supports a widely held assumption in the growth literature that agriculture’s position in the economy is dynamic [28,68]. It also supports the current evidence on agriculture’s role in poverty alleviation [30,69,70].

5. Discussion and Policy Implications

In this study, the Malmquist index and a dynamic panel IV model were used to assess the impact of agricultural TFP growth on human development. The motivation stemmed from the fact that Africa is grappling with a growing population, food shortages, and poor levels of human development, as well as the important role of agriculture in the economies of many African countries. As highlighted by a number of researchers, TFP growth plays a significant role in promoting and sustaining food security [65]. However, the literature on this subject is scanty. As a result, there is much disagreement in the literature about the nature and trends of TFP growth in Africa. Additionally, there exists limited knowledge about the impact of TFP on human development.
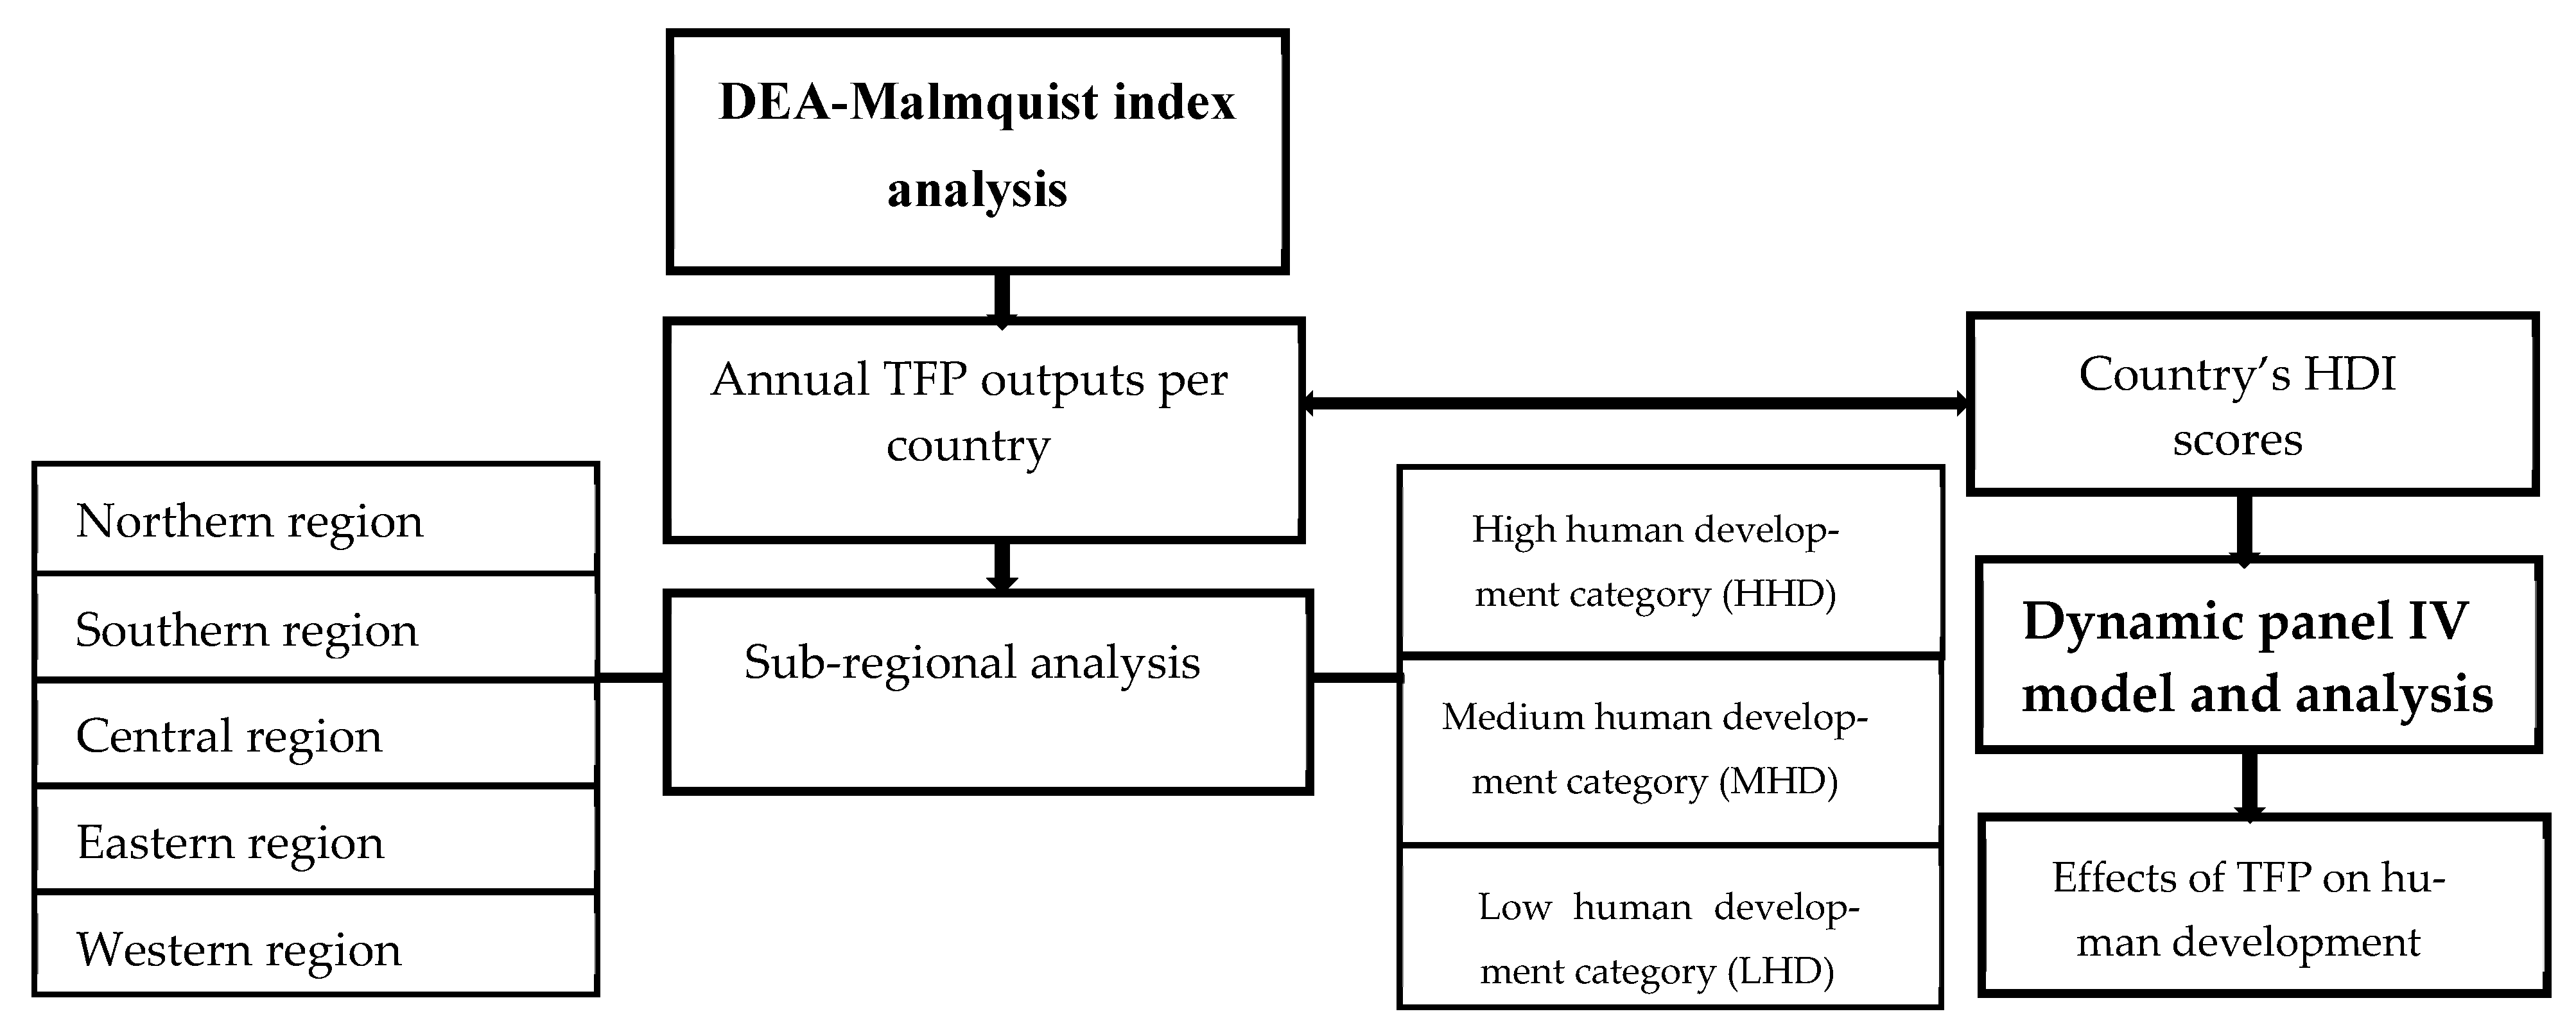
Thus, the first objective was to provide new estimates of TFP growth, determine sources of productivity growth, and conduct a comparative analysis of TFP results based on countries, regions, and human development levels. This objective was achieved using the Malmquist index approach. The advantage of this approach is that it determines sources of productivity growth by decomposing TFP into components of efficiency changes (TECH and SECH) and technology progress (TECCH). Unlike previous studies, our data extended to 2019 and our analysis introduced the human development grouping into the cross-country and regional analysis of productivity growth. This enabled us to provide insight into the TFP growth trend and address the knowledge gap in the literature.
Our second and final objective was to conduct an econometric study of the impact of agricultural TFP on human development. According to our knowledge of the literature, the dynamic panel IV model proposed by Anderson and Hsiao (1981 and 1982) was estimated for the first time in the analysis of the impact of African agricultural development. One of the advantages of this estimator in panel data studies is that it takes into account indigeneity bias when the numbers of cross-sectional units (N) increase moderately while the time period (T) is relatively small and fixed. This approach was preferred over the traditional GMM estimators to mitigate the risk of instrumental proliferation bias. In the empirical analysis, the TFP outputs and HDI scores of countries were the two main variables of interest.
The HDI data showed slow but consistent progress in the human development efforts of many African countries. However, most countries are still at low and medium levels of human development as a result of low growth rates, causing the continent to lag behind other parts of the world [38,71,72]. The fact that there are gradual improvements in growth rates means that there is hope that Africa is capable of catching up if the appropriate policy measures are instituted and implemented at both the national and regional levels.
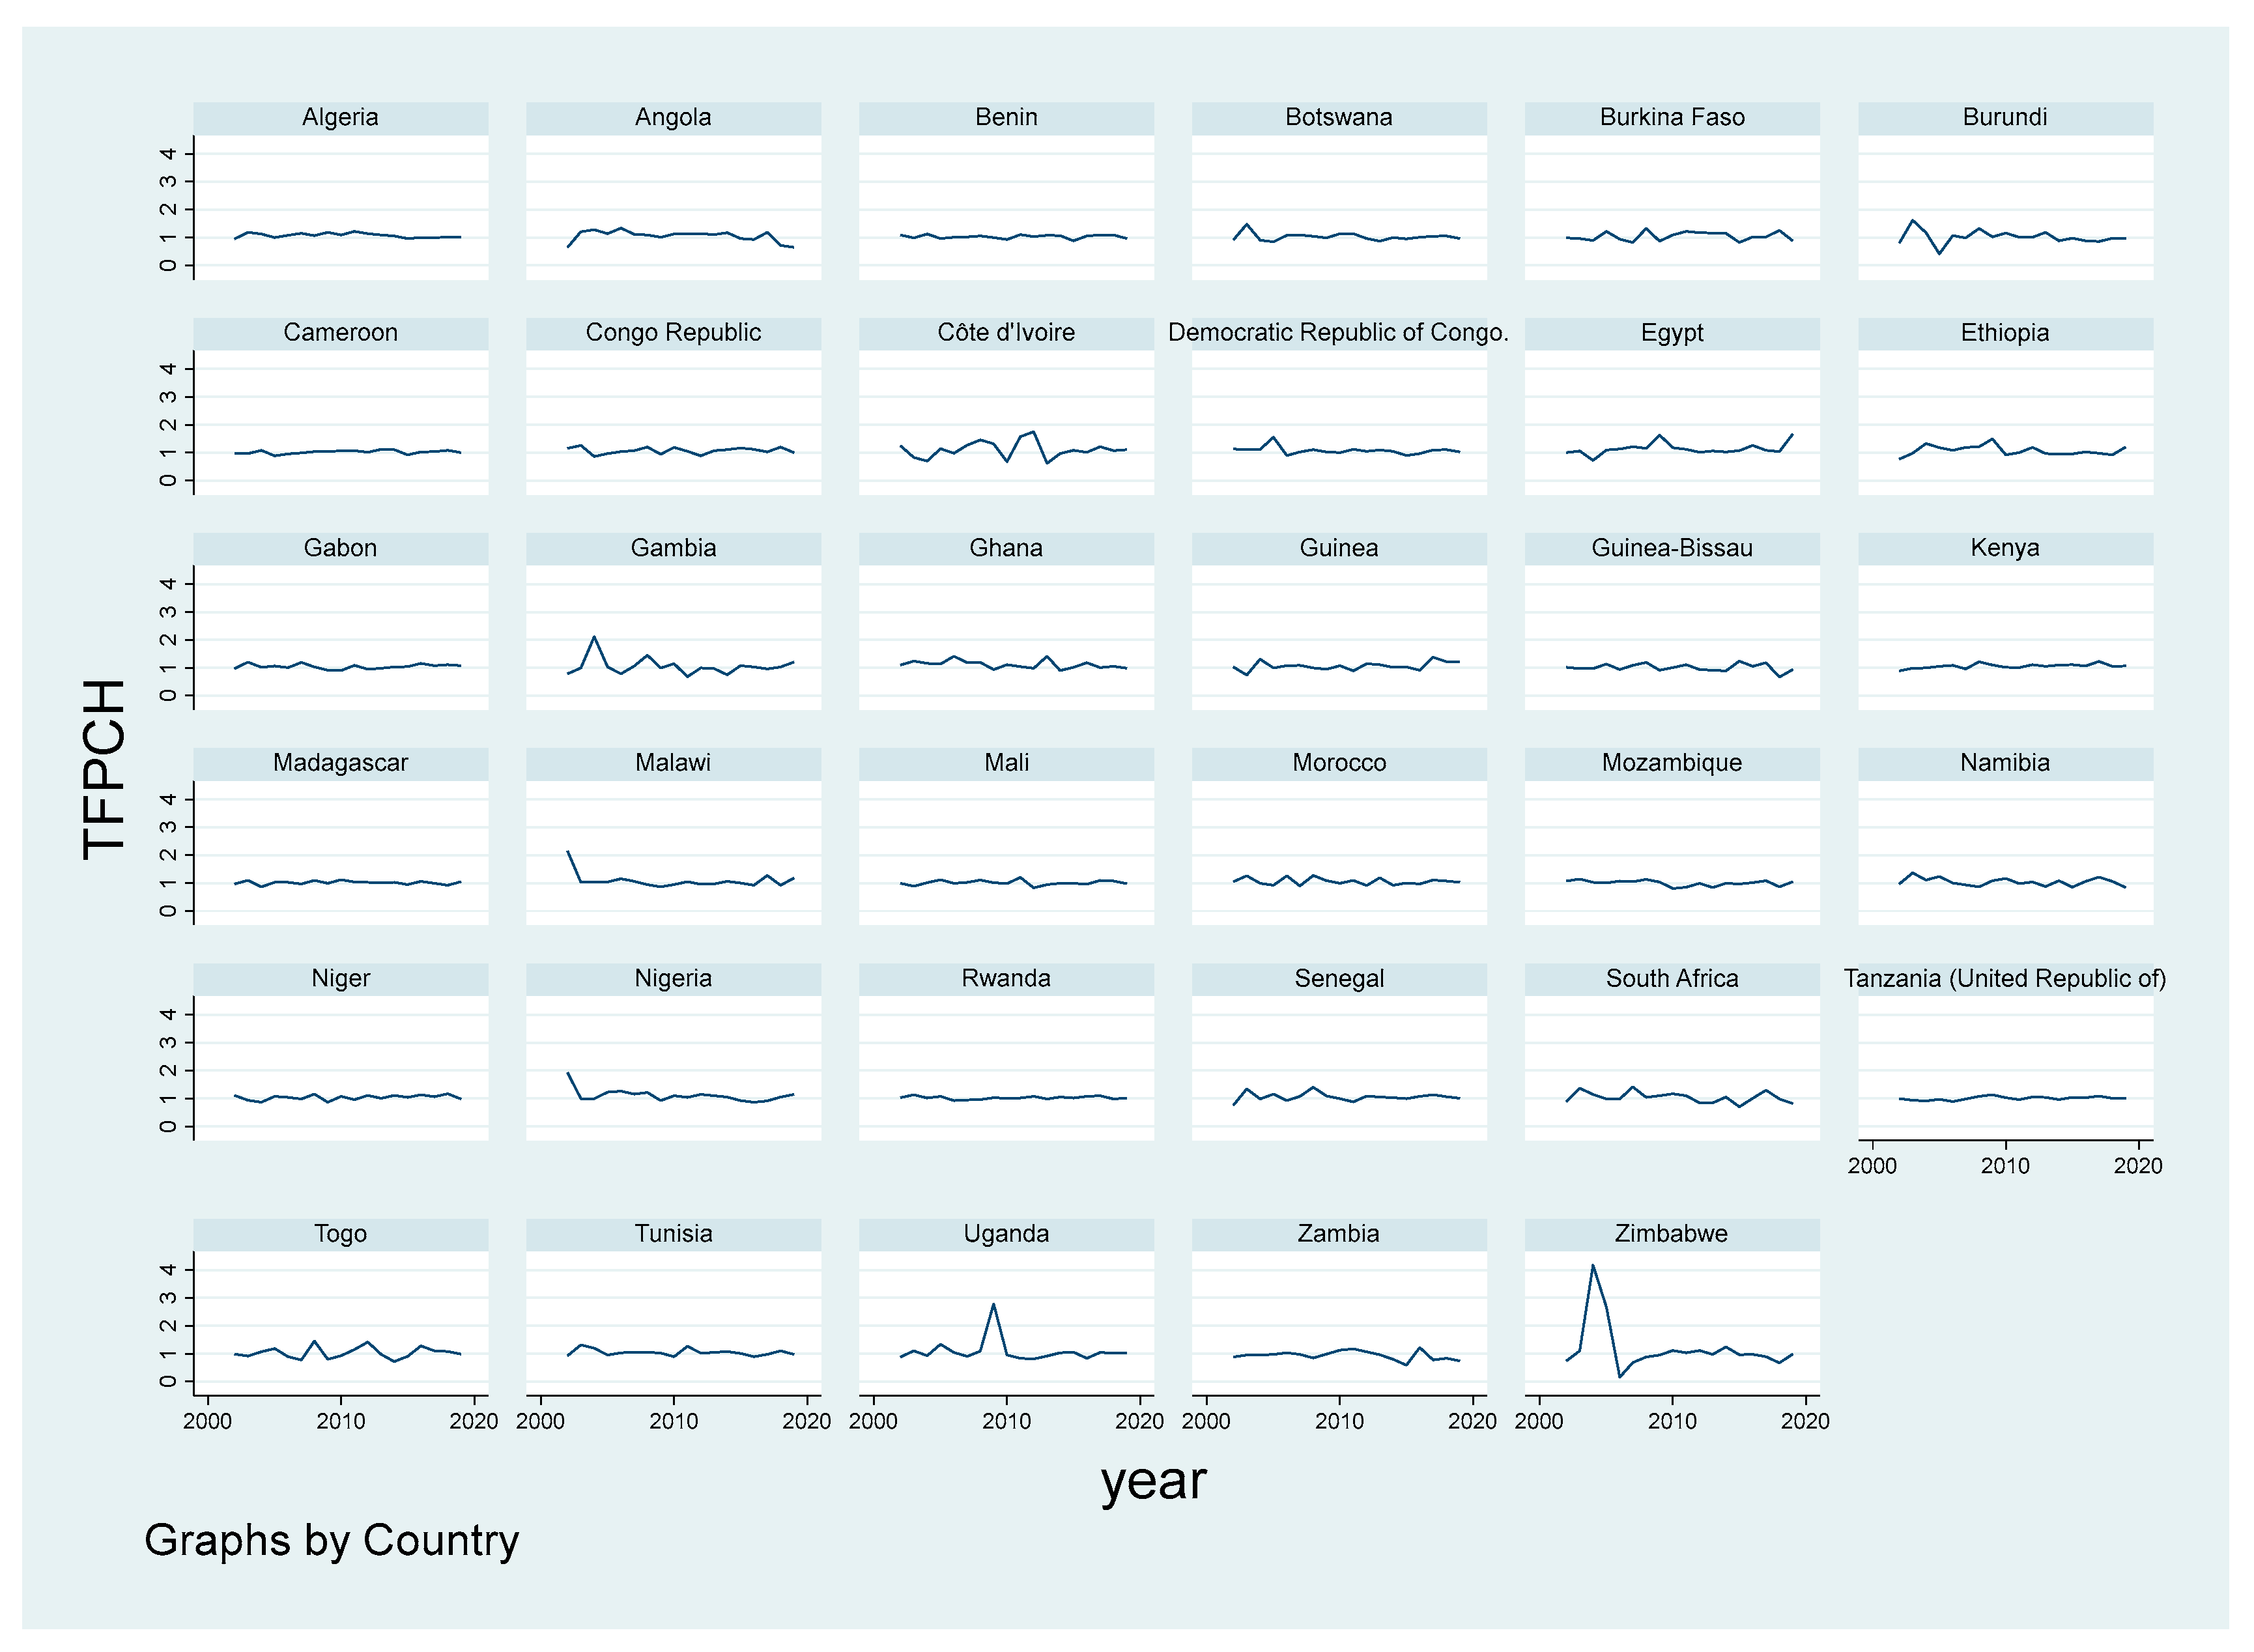
Similarly, the analysis of countries’ TFP outputs showed a moderate trend of productivity increase across countries and over time, with technological change accounting for 5.9 percent of annual TFP growth. The reported slight decline in technical efficiency and scale efficiency indicates that technology plays an important role in Africa’s agriculture industry. However, because Africa’s agriculture is still dominated by smallholders, the majority of whom engage in traditional farming practices with limited technical capacity, there is a need to increase support for farmers’ capacity building in order to improve their ability to access new technologies, adopt innovative practices, and ensure sustainable production for food security. The evidence regarding slow TFP growth rates found in this study is in line with previous findings [10,50,73].
Despite agriculture accounting for a large portion of the economies of many African countries [3,15,20,53], not enough has been accomplished to transform the sector and improve its ability to produce enough food to meet people’s needs. Compared to its size and position in the economy, agriculture’s contribution to national growth has been negligible. The decades of slow growth, attributable to resource constraints and minimum use of agricultural technologies, have negatively impacted the sector’s ability to achieve its primary goal of mitigating food insecurity and ensuring sustainable food production for the rising population [14,20,74]. This slow productivity trend means that progress in fighting poverty and hunger is at risk, which could have serious implications for Africa’s chances of reaching the Sustainable Development Goals (SDGs).
Hence, a holistic and pragmatic policy approach must be adopted to address the underperformance of Africa’s agricultural sector and promote TFP growth in Africa. The focus must be to address the region’s primary concerns, such as rising food consumption, population growth, and climate change. Policymakers must also consider agriculture’s role in promoting equitable economic growth. Regional differences must be considered, as they present a variety of issues. However, in the midst of this diversity, there are common constraints confronting most African countries’ agricultural businesses that must be addressed collaboratively. These difficulties range from trade regulations and infrastructure to market restraints.
The econometric findings confirmed that TFP is crucial to the socioeconomic development of Africa. However, its effect on wellbeing was small and only significant in the long run, which means that despite the exclaimed role of agriculture in poverty reduction, TFP growth in African agriculture has had little effect on inclusive growth. This finding supports that of Lindner and Wagner [34], who reported a significant but minimum effect of agricultural productivity on human development. Further investigation showed that improvement in human development mitigated the influence of agricultural TFP in Africa. Unlike in this study, the analysis of Ahao, A.O. et al. [33] adopted the HDI as a measure of poverty and used data only from sub-Saharan countries. Therefore, their finding regarding a significant effect of productivity growth on the HDI was limited to poverty reduction analysis. The current study also produced evidence that technical efficiency enhances long-term human development. Meanwhile, agricultural technology has not made any significant impact on human development. Contrary to this finding, Self and Grabowski [32] reported a substantial impact of agricultural technology on human development (HDI). However, they also used per capita GDP as a measure of agricultural productivity. Given the different measurement tools employed by previous studies, the novelty of the current study can thus be established. Henceforth, there is a need for more empirical research on this subject.
To summarize, the primary goal of this research was to determine the extent to which the agriculture sector fosters inclusive growth and ensures food security in Africa. As long as there is skepticism about this contribution, the answer to this question compelled us to consider some serious policy implications raised in this discussion. Countries whose economies are strongly reliant on agriculture must make structural changes (income and non-income). Action must also be taken to identify other potential industries in order to diversify economies and reduce their reliance on agriculture. To achieve more inclusive economic growth, African countries must prioritize human capacity development. One of the main reasons for low productivity growth in many African countries is a lack of technical skills in the farming industry [75].

6. Limitation

Due to recent developments in versions of STATA software (16.0), the study used some of the most consistent and efficient estimators (malmq2) of productivity growth to estimate total factor productivity (TFP) in African agriculture from 2001 to 2019, using the Malmquist productivity index approach. This approach has been used in a number of studies, and our productivity estimates may be influenced by some limitations. The Malmquist approach, for example, does not satisfy all of the axioms of index number theory, which is a problem. Information about individual countries’ production technology could not be extracted. As a result, we do not know much about them. Furthermore, the actual contributions of associated TFP efficiency measures cannot be accounted for when comparing cross-country and over time [50,76].

Author Contributions

Conceptualization, B.M.B.J.; data curation, F.A. and X.W.; formal analysis, S.H. and F.A.; funding acquisition, Y.S.; methodology, B.M.B.J. and X.W.; software, X.W.; supervision, Y.S.; validation, Y.S.; visualization, S.H.; writing—original draft, B.M.B.J. All authors have read and agreed to the published version of the manuscript.

Funding

This study received no external funding support.

Institutional Review Board Statement

Not applicable.

Informed Consent Statement

Not applicable.

Data Availability Statement

All the generated data are available in the manuscript.

Acknowledgments

We would like to thank the College of Economics and management, Anhui Agricultural University, for supporting the publication of this work.

Conflicts of Interest

The authors declare no conflict of interest.

Appendix A

Table A1. Variables and definitions.
Variable NameDefinition/Unit of MeasurementVariable Source
Human development index (HDI)A composite index measuring average achievement in three basic dimensions of human development—a long and healthy life, knowledge, and a decent standard of livingUNDP database
Gross domestic product (GDP) per capitaGross domestic product per capita, PPP, dissemination (constant 2011 international dollars) FAOSTAT database. food security Indicators database.
Life expectancy at birth (years)Number of years a newborn infant can expect to live if prevailing patterns of age-specific mortality rates at the time of birth stay the same throughout the infant’s life.UNDESA (2019a). World Population Prospects database. Accessed 30 April 2020.
Mean years of schoolingAverage number of years of education received by people ages 25 and older.World Bank database: UNESCO Institute for Statistics (2020) and other sources.
Expected years of schooling (years)Number of years of schooling that a child of school entrance age can expect to receive if prevailing patterns of age-specific enrolment rates persist throughout the child’s lifeWorld Bank database: UNESCO Institute for Statistics (2020) and other
Agricultural laborEconomically active adults (men and women) primarily employed in agriculture (1000 persons)ILO ILOSTAT labor force survey estimates (if available) or modeled estimates (1991+), supplemented with GDCC estimates and previously published FAO estimates (pre 1991)
Agricultural landAgricultural land use (1000 ha)World Bank database
Agricultural outputAgriculture, forestry, and fishing, value added (current US dollars)World Bank (2020a). World Development Indicators database.
Agricultural capitalConsumption of fixed capital (agriculture, forestry and fishing values in Millioms USD)FAO database

Appendix B

Table A2. Cointegration test.
Kao Test for CointegrationCross-Sectional Means Removed
Augmented lags: 1 (AIC) Statisticp-value
Modified Dickey–Fuller t0.11760.4532
Dickey–Fuller t−3.60690.0002
Augmented Dickey–Fuller t−2.04870.0202
Unadjusted modified Dickey–Fullert1.42930.0765
Unadjusted Dickey–Fuller t−2.75870.0029
The null hypothesis of no cointegration was vehemently rejected in support of the alternative hypothesis (HA: all panels are cointegrated), suggesting that there exists a long ground relationship.
Table A3. Tests for stationarity and consistency of data.
Fisher-Type Unit Root Test for lnHD_Index: Based on Augmented Dickey–Fuller Tests
Statisticp-Value
Inverse chi-squared(70)p148.83300.0000
Inverse normalZ−4.15540.0000
Inverse logit t(179)L*−4.98010.0000
Modified inv. chi-squaredPm6.66260.0000
Im-Pesaran-Shin unit-root test for lnHD_index
W-t-bar−3.74580.0001
The probability values for the test for unit roots proved the normality and stability of our panel. Note. Ho: all panels contain unit roots Ha: at least one panel is stationary. Cross-sectional means removed; ADF regressions: 2 lags.
Table A4. Test for cointegration and cross-sectional dependence.
VariableslnHDI_~xlnTFPCHlnFSI_~clned~MYSlned~EYSlnlif_~HlnTECHlnTECCHlnTSECH
lnHDI_index1.0000
lnTFPCH0.02751.0000
lnFSI_GDPpc0.86560.04521.0000
lnedu_MYS0.80960.00550.66431.0000
lnedu_EYS0.85560.01870.6030.76241.0000
lnlif_expBTH0.67030.01810.41630.26760.48941.0000
lnTECH0.05950.72910.09650.05020.00870.02261.0000
lnTECCH−0.04730.0646−0.1033−0.06580.00750.026−0.52981.0000
lnTSECH−0.00910.23990.0327−0.00190.006−0.0629−0.0213−0.23861.000
From the correlation matrix, it could be observed that our data did not have multicollinearity issues because the association between key variables was mostly below 0.04.

References

  1. Adedeji, A.A.; Häggblom, M.M.; Babalola, O.O. Sustainable agriculture in Africa: Plant growth-promoting rhizobacteria (PGPR) to the rescue. Sci. Afr. 2020, 9, e00492. [Google Scholar] [CrossRef]
  2. Adenle, A.A.; Wedig, K.; Azadi, H. Sustainable agriculture and food security in Africa: The role of innovative technologies and international organizations. Technol. Soc. 2019, 58, 101143. [Google Scholar] [CrossRef]
  3. Nassirou Ba, M. Strategic Agricultural Commodity Value Chains in Africa for Increased Food: The Regional Approach for Food Security. Agric. Sci. 2016, 7, 549–585. [Google Scholar] [CrossRef] [Green Version]
  4. Rahman, A.; Sarkar, A.; Yadav, O.P.; Achari, G.; Slobodnik, J. Potential human health risks due to environmental exposure to nano- and microplastics and knowledge gaps: A scoping review. Sci. Total Environ. 2021, 757, 143872. [Google Scholar] [CrossRef]
  5. Gava, O.; Bartolini, F.; Venturi, F.; Brunori, G.; Pardossi, A. Improving policy evidence base for agricultural sustainability and food security: A content analysis of life cycle assessment research. Sustainability 2020, 12, 1033. [Google Scholar] [CrossRef] [Green Version]
  6. Sorgho, R.; Quiñonez, C.A.M.; Louis, V.R.; Winkler, V.; Dambach, P.; Sauerborn, R.; Horstick, O. Climate change policies in 16 west african countries: A systematic review of adaptation with a focus on agriculture, food security, and nutrition. Int. J. Environ. Res. Public Health 2020, 17, 8897. [Google Scholar] [CrossRef]
  7. Sarkar, D.; Kar, S.K.; Chattopadhyay, A.; Shikha; Rakshit, A.; Tripathi, V.K.; Dubey, P.K.; Abhilash, P.C. Low input sustainable agriculture: A viable climate-smart option for boosting food production in a warming world. Ecol. Indic. 2020, 115, 106412. [Google Scholar] [CrossRef]
  8. Baráth, L.; Fertő, I. Accounting for TFP Growth in Global Agriculture—A Common-Factor-Approach-Based TFP Estimation. Agris On-line Pap. Econ. Inform. 2020, 12, 3–13. [Google Scholar] [CrossRef]
  9. Bado, B.V.; Whitbread, A.; Sanoussi Manzo, M.L. Improving agricultural productivity using agroforestry systems: Performance of millet, cowpea, and ziziphus-based cropping systems in West Africa Sahel. Agric. Ecosyst. Environ. 2021, 305, 107175. [Google Scholar] [CrossRef]
  10. Nondo, C.; Jaramillo, J.R. Analyzing Africa’s Total Factor Productivity Trends. Int. J. Sustain. Econ. Manag. 2018, 7, 45–61. [Google Scholar] [CrossRef]
  11. Adom, P.K.; Adams, S. Decomposition of technical efficiency in agricultural production in Africa into transient and persistent technical efficiency under heterogeneous technologies. World Dev. 2020, 129, 104907. [Google Scholar] [CrossRef]
  12. Apata, T.G. Public spending mechanisms and gross domestic product (GDP) growth in the agricultural sector (1970–2016): Lessons for Nigeria from agricultural policy progressions in China. Bull. Geogr. Socio-Econ. Ser. 2019, 44, 57–72. [Google Scholar] [CrossRef] [Green Version]
  13. Gabriel Apata, T.; Oladapo, M.O.; Kehinde, A.L.; Motunrayo Apata, O.; Agboola, T.O. Agricultural Sector and HIV/AIDS Pandemic in Africa: The Economic Retrogression Model. Agric. Sci. 2016, 7, 206–224. [Google Scholar] [CrossRef] [Green Version]
  14. Frija, A.; Chebil, A.; Mottaleb, K.A.; Mason-D’Croz, D.; Dhehibi, B. Agricultural growth and sex-disaggregated employment in Africa: Future perspectives under different investment scenarios. Glob. Food Sec. 2020, 24, 100353. [Google Scholar] [CrossRef]
  15. Onyiriuba, L.; Okoro, E.U.O.; Ibe, G.I. Strategic government policies on agricultural financing in African emerging markets. Agric. Financ. Rev. 2020, 80, 563–588. [Google Scholar] [CrossRef]
  16. Msowoya, K.; Madani, K.; Davtalab, R.; Mirchi, A.; Lund, J.R. Climate Change Impacts on Maize Production in the Warm Heart of Africa. Water Resour. Manag. 2016, 30, 5299–5312. [Google Scholar] [CrossRef] [Green Version]
  17. Nwozor, A.; Olanrewaju, J.S. The ECOWAS agricultural policy and the quest for food security: Assessing Nigeria’s implementation strategies. Dev. Stud. Res. 2020, 7, 59–71. [Google Scholar] [CrossRef]
  18. Izraelov, M.; Silber, J. An assessment of the global food security index. Food Secur. 2019, 11, 1135–1152. [Google Scholar] [CrossRef]
  19. Bertelli, O. Food security measures in sub-saharan Africa. A validation of the LSMS-ISA scale. J. Afr. Econ. 2020, 29, 90–120. [Google Scholar] [CrossRef]
  20. Onyutha, C. African food insecurity in a changing climate: The roles of science and policy. Food Energy Secur. 2019, 8, e00160. [Google Scholar] [CrossRef] [Green Version]
  21. Lipton, M. Learning from Others: Increasing Agricultural Productivity for Human Development in Sub-Saharan Africa. 2012, pp. 1–52. Available online: http://www.researchgate.net/publication/259754452_Learning_from_others_increasing_agricultural_productivity_for_African_human_development (accessed on 11 April 2022).
  22. Barrett, C.B.; Christiaensen, L.; Sheahan, M.; Shimeles, A. On the structural transformation of rural Africa. J. Afr. Econ. 2017, 26, i11–i35. [Google Scholar] [CrossRef] [Green Version]
  23. Susilastuti, D. Agricultural Production and its Implications on Economic Growth and Poverty Reduction. Eur. Res. Stud. J. 2018, 21, 309–320. [Google Scholar] [CrossRef] [Green Version]
  24. Magbadelo, J.O. Africa’s Development Trajectory: Lessons from China. Insight Turk. 2020, 22, 257–265. [Google Scholar] [CrossRef]
  25. UNDP. The Next Frontier: Human Development and the Anthropocene; UNDP: New York, NY, USA, 2020; pp. 1–7. [Google Scholar]
  26. Mangaraj, B.K.; Aparajita, U. Constructing a generalized model of the human development index. Socioecon. Plann. Sci. 2020, 70, 100778. [Google Scholar] [CrossRef]
  27. Alemu, M.M. Agricultural Extension for Enhancing Production and Productivity: The Case of Southern Ethiopia, Arba Minch Zuriya District. OALib 2017, 4, 1–4. [Google Scholar] [CrossRef]
  28. Zhang, Y.; Diao, X. The changing role of agriculture with economic structural change—The case of China. China Econ. Rev. 2020, 62, 101504. [Google Scholar] [CrossRef]
  29. Djoumessi, Y.F.; Kamdem, C.B.; Ndeffo Nembot, L. Moving off Agrarian Societies: Agricultural Productivity to Facilitate Economic Transformations and Non-agricultural Employment Growth in Sub-Saharan Africa. J. Int. Dev. 2020, 32, 324–341. [Google Scholar] [CrossRef]
  30. Corral, S.; Díaz, A.S.; Monagas, M.D.C.; García, E.C. Agricultural policies and their impact on poverty reduction in developing countries: Lessons learned from three water basins in Cape Verde. Sustainability 2017, 9, 1841. [Google Scholar] [CrossRef] [Green Version]
  31. Christiaensen, L.; Demery, L.; Kühl, J. The Role of Agriculture in Poverty Reduction an Empirical Perspective; World Bank Publications: Washington, DC, USA, 2006; pp. 49–55. [Google Scholar] [CrossRef] [Green Version]
  32. Self, S.; Grabowski, R. Economic development and the role of agricultural technology. Cato J. 2008, 28, 313–340. [Google Scholar] [CrossRef] [Green Version]
  33. Ajao, A.O.; Ogunniyi, L.T.; Oyedele, G.A. Agricultural Productivity Growth and Incidence of Poverty: An Experience from Africa. J. Econ. Sustain. Dev. 2013, 4, 207–215. Available online: https://www.researchgate.net/publication/299478139_Agricultural_Productivity_Growth_and_Incidence_of_Poverty_An_Experience_from_Africa (accessed on 11 April 2022).
  34. Lindner, A.; Wagner, A. Agricultural Productivity, Economic Growth & Human Development in Sub-Saharan Africa: A Least Squares Dummy Variables (LSDV) Approach. 2020. Available online: https://www.rose-hulman.edu/academics/academic-departments/mathematics/mathreu/_assets/pdfs/2020_Agricultural_Productivity_Lindner_Wagner.pdf (accessed on 11 April 2022).
  35. Amate-Fortes, I.; Guarnido-Rueda, A.; Molina-Morales, A. Economic and Social Determinants of Human Development: A New Perspective. Soc. Indic. Res. 2017, 133, 561–577. [Google Scholar] [CrossRef]
  36. Seth, S. Inequality, Interactions, and Human Development. J. Hum. Dev. Capab. 2009, 10, 375–396. [Google Scholar] [CrossRef] [Green Version]
  37. Karagiannis, R.; Karagiannis, G. Constructing composite indicators with Shannon entropy: The case of Human Development Index. Socioecon. Plann. Sci. 2020, 70, 100701. [Google Scholar] [CrossRef]
  38. Emara, A.M. The impact of corruption on human development in egypt. Asian Econ. Financ. Rev. 2020, 10, 574–589. [Google Scholar] [CrossRef]
  39. UNDP. Human Development Report 2020: The Next Frontier—Human Development and the Anthropocene; UNDP: New York, NY, USA, 2020; ISBN 9789211264425. [Google Scholar]
  40. McGillivray, M. The human development index: Yet another redundant composite development indicator? World Dev. 1991, 19, 1461–1468. [Google Scholar] [CrossRef]
  41. Cahill, M.B. Is the human development index redundant? East. Econ. J. 2005, 31, 1–5. [Google Scholar]
  42. Yakunina, R.P.; Bychkov, G.A. Correlation Analysis of the Components of the Human Development Index Across Countries. Procedia Econ. Financ. 2015, 24, 766–771. [Google Scholar] [CrossRef] [Green Version]
  43. Semykina, A.; Wooldridge, J.M. Estimating Panel Data Models in the Presence of Endogeneity and Selection: Theory and Application. J. Econom. 2010, 157, 375–380. [Google Scholar] [CrossRef] [Green Version]
  44. Kripfganz, S. Generalized method of moments estimation of linear dynamic panel data models. In Proceedings of the London Stata Conference, Exeter, UK, 5 September 2019; pp. 1–128. Available online: https://www.stata.com/meeting/uk19/slides/uk19_kripfganz.pdf (accessed on 11 April 2022).
  45. Doumi, A. Measurement of Total Factor Productivity in Agriculture: Study on a Panel of Mediterranean Countries (1980–2012). J. Int. Glob. Econ. Stud. 2016, 9, 41–56. Available online: http://www2.southeastern.edu/orgs/econjournal/index_files/JIGES%20DECEMBER%202016%20ALI%20DOUMI%20JAN-31-2017.pdf (accessed on 11 April 2022).
  46. Liu, J.; Wang, M.; Yang, L.; Rahman, S.; Sriboonchitta, S. Agricultural productivity growth and its determinants in south and southeast Asian countries. Sustainability 2020, 12, 4981. [Google Scholar] [CrossRef]
  47. Li, Q.; Wu, X.; Zhang, Y.; Wang, Y. The effect of agricultural environmental total factor productivity on urban-rural income gap: Integrated view from China. Sustainability 2020, 12, 3327. [Google Scholar] [CrossRef] [Green Version]
  48. Ding, C.; Zhang, R. The measurement and influencing factors of total factor productivity in the chinese rural distribution industry. Sustainability 2021, 13, 8581. [Google Scholar] [CrossRef]
  49. Rada, N.E.; Fuglie, K.O. New perspectives on farm size and productivity. Food Policy 2019, 84, 147–152. [Google Scholar] [CrossRef]
  50. Anik, A.R.; Rahman, S.; Sarker, J.R. Five decades of productivity and efficiency changes in world agriculture (1969–2013). Agric. 2020, 10, 200. [Google Scholar] [CrossRef]
  51. Luh, Y.; Road, R. the Impact of Education on Agricultural Productivity: Evidence From East Asian Economies. Int. J. Food Agric. Econ. 2017, 5, 11–24. [Google Scholar] [CrossRef]
  52. O’Donnell, C.J. Nonparametric estimates of the components of productivity and profitability change in U.S. agriculture. Am. J. Agric. Econ. 2012, 94, 873–890. [Google Scholar] [CrossRef]
  53. Gebrerufael, S. Dynamics of technology gap between OECD and African countries: A structural estimation. Sci. Afr. 2021, 11, e00674. [Google Scholar] [CrossRef]
  54. Inoue, T. Financial development, remittances, and poverty reduction: Empirical evidence from a macroeconomic viewpoint. J. Econ. Bus. 2018, 96, 59–68. [Google Scholar] [CrossRef]
  55. Liu, F.; Lv, N. The threshold effect test of human capital on the growth of agricultural green total factor productivity: Evidence from China. Int. J. Electr. Eng. Educ. 2021. [Google Scholar] [CrossRef]
  56. Persyn, D.; Westerlund, J. Error-correction-based cointegration tests for panel data. STATA J. 2008, 8, 232–241. [Google Scholar] [CrossRef] [Green Version]
  57. Eberhardt, M.; Teal, F. Econometrics for grumblers: A new look at the literature on cross-country growth empirics. J. Econ. Surv. 2011, 25, 109–155. [Google Scholar] [CrossRef] [Green Version]
  58. Sheahan, M.; Barrett, C.B.; Goldvale, C. Human health and pesticide use in Sub-Saharan Africa. Agric. Econ. 2017, 48, 27–41. [Google Scholar] [CrossRef]
  59. Sheng, Y.; Nossal, K.; Ball, E. Comparing agricultural total factor productivity between Australia, Canada and the United States. Int. Product. Monit. 2015, 29, 38–59. [Google Scholar]
  60. Schreyer, P. The OECD Productivity Manual: A Guide to the Measurement of Industry-Level and Aggregate Productivity. Int. Product. Monit. 2001, 2, 37–51. [Google Scholar]
  61. Wiggins, S. African agricultural development: Lessons and challenges. J. Agric. Econ. 2014, 65, 529–556. [Google Scholar] [CrossRef]
  62. Silva, J.V.; Reidsma, P.; Baudron, F.; Laborte, A.G.; Giller, K.E.; van Ittersum, M.K. How sustainable is sustainable intensification? Assessing yield gaps at field and farm level across the globe. Glob. Food Sec. 2021, 30, 100552. [Google Scholar] [CrossRef]
  63. UNDP. Technical Notes: Calculating the Human Development Indices—Graphical Presentation; UNDP: New York, NY, USA, 2018; pp. 1–16. [Google Scholar]
  64. Rahman, S.; Salim, R. Six decades of total factor productivity change and sources of growth in bangladesh agriculture (1948–2008). J. Agric. Econ. 2013, 64, 275–294. [Google Scholar] [CrossRef] [Green Version]
  65. Alene, A.D. Productivity growth and the effects of R & D in African agriculture. Agric. Econ. 2010, 41, 223–238. [Google Scholar] [CrossRef]
  66. Warr, P.; Suphannachart, W. Agricultural Productivity Growth and Poverty Reduction: Evidence from Thailand. J. Agric. Econ. 2021, 72, 525–546. [Google Scholar] [CrossRef]
  67. Asongu, S.A.; Odhiambo, N.M. Foreign direct investment, information technology and economic growth dynamics in Sub-Saharan Africa. Telecomm. Policy 2020, 44, 101838. [Google Scholar] [CrossRef]
  68. Gollin, D.; Lagakos, D.; Waugh, M.E. Agricultural productivity differences across countries. Am. Econ. Rev. 2014, 104, 165–170. [Google Scholar] [CrossRef] [Green Version]
  69. Christiaensen, L.; Demery, L.; Kuhl, J. The (evolving) role of agriculture in poverty reduction-An empirical perspective. J. Dev. Econ. 2011, 96, 239–254. [Google Scholar] [CrossRef] [Green Version]
  70. Dhahri, S.; Omri, A. Foreign capital towards SDGs 1 & 2—Ending Poverty and hunger: The role of agricultural production. Struct. Chang. Econ. Dyn. 2020, 53, 208–221. [Google Scholar] [CrossRef]
  71. Prados de la Escosura, L. Human development in Africa: A long-run perspective. Explor. Econ. Hist. 2013, 50, 179–204. [Google Scholar] [CrossRef]
  72. Akisik, O.; Gal, G.; Mangaliso, M.P. IFRS, FDI, economic growth and human development: The experience of Anglophone and Francophone African countries. Emerg. Mark. Rev. 2020, 45, 100725. [Google Scholar] [CrossRef]
  73. Note, B.; Nehru, J. Total Factor Productivity in Agriculture: A Review of Measurement Issues in the Indian Context. Rom. J. Reg. Sci. 2014, 8, 45–61. [Google Scholar]
  74. Otsuka, K.; Muraoka, R. A Green Revolution for sub-Saharan Africa: Past failures and future prospects. J. Afr. Econ. 2017, 26, i73–i98. [Google Scholar] [CrossRef]
  75. Sørensen, L.B.; Germundsson, L.B.; Hansen, S.R.; Rojas, C.; Kristensen, N.H. What skills do agricultural professionals need in the transition towards a sustainable agriculture? A qualitative literature review. Sustainability 2021, 13, 3556. [Google Scholar] [CrossRef]
  76. Baráth, L.; Fertő, I. Productivity and Convergence in European Agriculture. J. Agric. Econ. 2017, 68, 228–248. [Google Scholar] [CrossRef] [Green Version]
Figure 1. Graphical abstract: H1a is the primary hypothesis being tested in the study. It links productivity growth in agricultural total factor productivity (TFP) to human development (HDI). The diagram shows the indicators that are involved in both concepts (TFP and HDI).
Sustainability 14 06411 g001
Figure 2. Human Development Index construct (HDI).
Sustainability 14 06411 g002
Figure 3. Study design framework.
Sustainability 14 06411 g003
Figure 4. Growth pattern of agricultural TFP in Africa by country (35 countries) for the period (2002–2019). Note that the left axis (y-axis) depicts TFP growth rates over the study period, while the right axis (x-axis) depicts the study period (2001/2002–2018/2019). The annual growth patterns of a country can be observed and compared to those of other countries in the region.
Sustainability 14 06411 g004
Table 1. Summary statistics of variables used for DEA-MI calculation.
VariableAgricultural OutputAgricultural LaborAgricultural CapitalAgricultural LandYearREG_DIVHD_LEV
Mean6.73 × 1095093.793455.531623,475.4620103.5428572.085714
Std. Dev.1.38 × 10106147.4331226.36221,163.485.4813481.4019290.6495066
Minimum1.30 × 108101.5454.303598495200111
Maximum1.09 × 101134,604.7710,622.0998,028201953
Observations665665665665665665665
Note: see Appendix A for variable details (Table A1).
Table 2. Summary statistics of variables used in panel IV regression model.
VariableVariable DescriptionObsMeanStd. Dev.MinMax
HDI_indexHuman development index (HDI)6260.5097520.1052510.2730.748
TFPCHTFP outputs6301.0543740.2293410.1544.171
FSI_varFood security indicator (GDP)6304454.1874069.503715.517,776.8
edu_MYSMean years of schooling 6264.8929712.1446381.210.2
edu_EYSExpected years of schooling63010.02732.287628315.1
lif_birth Life expectancy at birth 63059.517627.05688643.176.9
TECHTechnical efficiency change (outputs)6300.9860110.2241520.15034.124
TECCHTechnology change (outputs)6301.0953660.20842612.3003
SECHScale efficiency change (outputs)6300.9965030.0937380.53722.1254
Agr_laborAgricultural labor6305137.416197.633103.01634,604.76
Agr_vadAgricultural value added6306.97 × 1091.41 × 10101.30 × 1081.09 × 1011
Agr_landAgricultural land63023,529.2221,187.8549598,028
Note: see Appendix A for variable details (Table A1).
Table 3. Distribution of 18 Countries’ TFP Growth Mean.
No.CountryRegionHDI Category TFPCHTECHTECCHSECH
1ZimbabweSouthern AfricaMEDIUM HDI1.1841.1381.0531.000
2EgyptNorth AfricaHIGH HDI1.1421.0031.1381.000
3GhanaWest AfricaMEDIUM HDI1.1191.0771.0461.000
4Côte d’IvoireWest AfricaLOW HDI1.1141.0371.1310.973
5NigeriaWest AfricaLOW HDI1.1100.9961.0451.071
6MalawiSouthern AfricaLOW HDI1.0890.9721.1901.000
7UgandaEast AfricaLOW HDI1.0890.9911.1200.971
8Congo (D.R)Central AfricaLOW HDI1.0791.0291.0471.006
9EthiopiaEast AfricaLOW HDI1.0761.0691.1320.922
10Congo RepublicCentral AfricaMEDIUM HDI1.0761.0321.0471.000
11GuineaWest AfricaLOW HDI1.0711.0101.0911.000
12KenyaEast AfricaMEDIUM HDI1.0651.0281.1060.967
13GambiaWest AfricaLOW HDI1.0641.0061.0491.033
14MoroccoNorth AfricaMEDIUM HDI1.0611.0101.0521.001
15SenegalWest AfricaLOW HDI1.0561.0141.0490.999
16AngolaSouthern AfricaMEDIUM HDI1.0501.0121.0470.994
17GabonCentral AfricaHIGH HDI1.0491.0011.0600.992
18TunisiaNorth AfricaHIGH HDI1.0450.9811.0690.996
Mean 1.0851.0221.0820.996
TFPCH indicates TFP change during the period, TECH means technical efficiency change, TECCH represents technological changes, and SECH denotes scale efficiency change. A value equal to 1 means productivity remained stagnant for the period, a value above 1 indicates productivity increase, and a value below 1 signifies productivity decline. Source: authors’ estimation. Note: the remaining countries whose growth rates fell below 5% are not reported because of space.
Table 4. TFP and productivity determinants’ growth trends (2001/2002–2018/2019).
YearTFPCHTECHTECCHSECH
2001~20021.0220.9941.0001.028
2002~20031.1061.0091.0851.011
2003~20041.1481.0881.0431.018
2004~20051.1091.0931.0001.016
2005~20061.0191.0101.0091.001
2006~20071.0410.9961.0331.012
2007~20081.1361.0831.0321.020
2008~20091.0900.7221.6950.952
2009~20101.0360.9111.1640.979
2010~20111.0640.9571.1220.990
2011~20121.0581.0151.0461.000
2012~20131.0170.9991.0590.974
2013~20141.0120.9881.0350.989
2014~20150.9760.9231.0571.005
2015~20161.0320.9451.1850.960
2016~20171.0761.0421.0281.008
2017~20181.0171.0071.0071.006
2018~20191.0210.9651.1200.967
Mean1.0540.9861.0950.997
Note: TFPCH is the TFP growth rate, TECH is the technical efficiency change, TECCH is the technological progress, and SECH is the scale efficiency. Source: authors’ estimation.
Table 5. TFP and HDI growth rates by region and HDI category (2002–2019).
SUB-REGIONSTFPCHTECHTECCHSECHHDIFREQ.PERCENT
Central Africa1.0571.0071.0561.0000.530411.43
East Africa1.0450.9801.1360.9690.467617.14
North Africa1.0800.9981.0830.9990.678411.43
Southern Africa1.0430.9721.1000.9980.531925.71
West Africa1.0580.9891.0891.0080.4511234.29
Mean/total1.0570.9891.0930.9950.53235100
HDI CATEGORY
High Human Development1.0620.9841.0781.0011.062617.14
Medium Human Development1.0621.0161.0640.9961.062925.71
Low Human Development1.0490.9731.1150.9951.0492057.14
Mean/total1.0580.9911.0860.9970.55535100
Note: FREQ and PERCENT represent the distribution of countries in each sub-group and category within the sample. For example, low human development had 20 countries, accounting for 57.14% of our sample size, followed by the medium human development category, with 9 countries amounting to 3%, and high human development, which included 6 countries, accounting for 17.11% of the total (same applied to the sub-regional division). Source: authors’ calculation.
Table 6. The effect of TFP change on human development.
Human Development is the Dependent Variable
Model 1Model 2Model 3Model 4Model 5
LD.lnHDI_index 0.196 **0.201 **0.200 **0.198 **0.202 **
(2.73)(2.80)(2.74)(2.75)(2.78)
L2D. lnTFPCH 0.00205 **
(2.77)
D. lnedu_MYS 0.0834 ***0.0820 ***0.0825 ***0.0824 ***0.0822 ***
(12.57)(12.34)(12.26)(12.33)(12.21)
D.lnFSI_GDPpc 0.0789 ***0.0783 ***0.0817 ***0.0819 ***0.0838 ***
(10.86)(10.59)(11.15)(11.28)(11.27)
D. lnlif_expBTH 0.496 ***0.493 ***0.488 ***0.488 ***0.487 ***
(8.53)(8.52)(8.31)(8.36)(8.12)
D. lnedu_EYS 0.210 ***0.210 ***0.209 ***0.210 ***0.211 ***
(20.90)(20.95)(20.56)(20.76)(20.66)
L2D.lnTECH 0.00207 **
(3.18)
L2D.lnTECCH −0.00031
(−0.32)
L2D.lnSECH −0.00230
(−1.43)
D.lnAgr_labor 0.00118
(0.21)
D.lnAgr_vad −0.00191
(−1.27)
D.lnAgr_land 0.00221
(0.18)
_cons−0.00113 *−0.00113 *−0.00111 *−0.00110 *−0.00109 *
(−2.38)(−2.39)(−2.32)(−2.30)(−2.28)
N521521521521521
R20.8350.8340.8310.8320.831
adj. R20.8330.8320.8290.8300.829
t statistics in parentheses. * p < 0.05, ** p < 0.01, and *** p < 0.001. Source: authors’ estimation. Note: the human development index (HDI) was the dependent variable in this panel data regression analysis. All variables were first-differenced at their natural log levels (see Table 2 for variable description). In addition, TFP variables were taken by their 2nd lag values in order to reduce the possibility of reversed causality and also to account for their long-run explanatory effects. TFP had a coefficient of 0.00205 ** at the 1% level of significance.
Publisher’s Note: MDPI stays neutral with regard to jurisdictional claims in published maps and institutional affiliations.

