Article

The Application of Visible and Near-Infrared Spectroscopy Combined with Chemometrics in Classification of Dried Herbs

by
Anna Dankowska
1,*,
Agnieszka Majsnerowicz
2,
Wojciech Kowalewski
3 and
Katarzyna Włodarska
1
1
Institute of Quality Science, Poznań University of Economics and Business, al. Niepodległości 10, 61-875 Poznań, Poland
2
BELiN Poland Sp. z o. o., Sucholeska 34/36, 60-479 Poznań, Poland
3
Faculty of Mathematics and Computer Science, Adam Mickiewicz University, Uniwersytetu Poznańskiego 4 Street, 61-614 Poznań, Poland
*
Author to whom correspondence should be addressed.
Sustainability 2022, 14(11), 6416; https://0-doi-org.brum.beds.ac.uk/10.3390/su14116416
Submission received: 11 April 2022 / Revised: 14 May 2022 / Accepted: 18 May 2022 / Published: 24 May 2022
(This article belongs to the Special Issue Non-destructive Techniques for Sustainable Food Quality Evaluation)

Abstract

:
The fast differentiation and classification of herb samples are complicated processes due to the presence of many various chemical compounds. Traditionally, separation techniques have been employed for the identification and quantification of compounds present in different plant matrices, but they are tedious, time-consuming and destructive. Thus, a non-targeted approach would be specifically advantageous for this purpose. In the present study, spectroscopy in the visible and near-infrared range and pattern recognition techniques, including the principal component analysis (PCA), linear discriminant analysis (LDA), quadratic discriminant analysis (QDA), regularized discriminant analysis (RDA), super k-nearest neighbor (SKNN) and support vector machine (SVM) techniques, were applied to develop classification models that enabled the discrimination of various commercial dried herbs, including mint, linden, nettle, sage and chamomile. The classification error rates in the validation data were below 10% for all the classification methods, except for SKNN. The results obtained confirm that spectroscopy and pattern recognition methods constitute a good non-destructive tool for the rapid identification of herb species that can be used in routine quality control by the pharmaceutical industry, as well as herbal suppliers, to avoid mislabeling.

1. Introduction

Herbs have multiple applications in food and beverage processing, cosmetics and medicines. Consumers are now aware of the harmful effects of synthetic additives and are, therefore, turning to foods and drinks containing natural herbs and spices. Due to the growing demand for natural food ingredients, the consumption of plant-based ingredients is increasing, as compared to artificial ones. The willingness of consumers to pay a premium price for a more natural product has changed the dynamics of the herb and spice market. Over the last few decades, the global herb and spice market has grown considerably. In 2022, the global spice and herb market was estimated at approximately USD 79 billion [1].
Worldwide interest in herbs has increased due to their pleasant flavor, as well as their health benefits and high nutritive value. Individual herbs have different biological and chemical properties with different compositions of biologically active compounds. Herbs are abundantly aromatic due to a large number of volatile organic compounds, whereas their biological activity is associated with secondary metabolites, such as polyphenols, including flavonoids, terpenes and anaerobically derived hydrocarbons [2,3]. These compounds correspond to anti-oxidant, anti-inflammatory, anti-cancer and anti-microbial properties [4]. Therefore, herb consumption is associated with protection against certain diseases [5]. A report by the World Health Organization has stated that approximately 80% of the population in developing countries relies on traditional medicine for their primary healthcare, and that 85% of these traditional medicines are derived from herbs [6].
Because of the environments in which herbs are cultivated, they are often contaminated with pathogenic microorganisms [7]. The most common and basic technique for preserving herbs after harvest is drying. Drying herbs in various ways helps to maintain quality by reducing the moisture content and inhibiting the growth of microorganisms, resulting in minor changes in the composition of biologically active compounds [4,6]. Therefore, microbial safety remains an aspect of the highest concern in dried herb quality assurance [7]. Herbal products are perceived as low-risk, because they are considered natural and, thus, safe. Therefore, the quality of these products is ineffectively regulated and controlled. The growing evidence for their lack of authenticity is of deep concern, but the scale of this phenomenon remains unknown [8]. In recent years, there have been a number of fraud incidents potentially posing a health risk, such as the mislabeling of product varieties and the addition of undeclared contaminants, substitutes, toxic colorants or bulking agents, used for the purpose of the substitution or dilution of herbs [8,9,10,11]. The fraudulent practices in herbal products may be accidental or intentional and economically motivated. Each food fraud incident has the potential to threaten consumers’ well-being, but also undermine confidence in the food market [12]. Thus, the European Parliament issued a call to develop and implement fast and simple analytical quality control tools to detect food fraud, such as sensor technology and the fingerprinting approach [10]. Herb properties are related to individual ingredients usually found in the parts-per-million (ppm) and/or parts-per-billion (ppb) quantities. Traditionally, separation techniques, including liquid chromatography, gas chromatography, mass spectrometry, high-performance capillary electrophoresis, etc., have been employed for the identification and quantification of compounds present or deriving from different plant matrices [13]. As an alternative or complementary method to those mentioned above, the non-targeted approach is specifically advantageous to identify herb variety in the market without the intervention of human experts, as well as to detect food fraud with previously unexpected substances [14,15]. Spectroscopic techniques are often applied in routine food analyses. Spectroscopy in the ultraviolet (200–380 nm) and visible (380–780 nm) ranges is associated with the excitation of electrons forming chemical bonds in the molecule corresponding to different chromophores presented in foods, such as carbonyl groups, nitro groups, double and triple bonds, conjugated double bonds, etc. The absorption in the visible region is due to the presence of food pigments [16]. The spectra in the near-infrared range (780–2500 nm) consist of broad overlapping bands arising from overtones and combination tones of the fundamental vibrations involving C–H, O–H and N–H chemical bonds [17]. An important advantage of NIR spectroscopy is the ability to directly measure the spectra of the samples in different forms. The spectral bands in the NIR range are less intense than those in the MIR range, which is beneficial for the samples with a high optical density and allows them to be measured directly without the need for dilution or other preparations. There are also some other techniques, e.g., fluorescence, which may be complementary to Vis and NIR spectroscopy, since fluorescence spectroscopy consists of measuring the photoluminescence of molecules that emit light after having absorbed ultraviolet, visible or infrared light [18]. The unique spectral pattern of a food product depends on the chemical components present, their interactions and may also be affected by the physical properties of the sample. Therefore, the use of chemometrics in the analysis of spectral data is necessary due to the limited selectivity of signals. Chemometrics is a powerful data reduction tool used qualitatively for grouping or classifying unknown samples with similar characteristics and quantitatively for determining components or adulterant analytes in samples [11]. An essential part of the chemometric data analysis is data pre-processing used to remove unwanted variations, such as instrumental and experimental artifacts, from raw data [19]. The non-targeted methods based on spectroscopy, combined with chemometric techniques, seem to be promising tools for determining the presence of adulterants and contaminants in herbs [20,21,22,23], as well as the ingredients responsible for their therapeutic properties [24] and for distinguishing herb varieties [25] and their geographical origins [26,27,28].
The aim of the present study was the non-targeted analysis of NIR spectra of various commercially available dried herbs, including mint, linden, nettle, sage and chamomile, to develop models that allowed us to distinguish the variety of herbs.

2. Materials and Methods

2.1. Herb Samples

A total of 159 samples of mint (Mentha piperita L.), originating from Polish suppliers offering products from their own harvests as well as imported from plantations located in the European Union, was used for analysis. Additionally, 30 samples of linden (Tilia L.), 67 samples of nettle (Urticadioica L.), 41 samples of sage (Salvia officinalis L.) and 116 samples of chamomile (Matricaria chamomilla L.) were used, coming from Polish producers offering raw materials from their own plantations or traders mediating between small cultivation farms. The choice of the above samples was determined because of some of them belonging to the herbal “top five” used for centuries to this day, which are the pillar of modern herbalism, and they are herbs available to consumers on the food market in the greatest amounts. Due to the fact that they are the most popular herbs, there is also a high risk of suppliers wanting to falsify them, e.g., linden inflorescence with its leaf or apple leaf, chamomile flower with chamomile straw, nettle and sage often have a high total ash content, which indicates contamination, and due to the many popular varieties of mint, we must be sure that we are using peppermint not additionally flavored with essential oils. The applied method did not require any special preparation of samples, as the raw materials were only ground with an electric mill to obtain a uniform consistency of the dried product. Each analyzed sample was first subjected to basic physicochemical tests. The following parameters were checked: humidity, total ash and sieve analysis to control the fraction. The granulometry of the samples that is desired in the herbal tea production process was selected, i.e., 0.315–1.60 mm. The measurements were carried out in conditions consistent with the requirements for storing finished products (herbal teas). Room temperature was 21–22 degrees Celsius (maximum allowed: 25 °C) and average room humidity was 30% (maximum relative humidity: 75%).

2.2. Vis–NIR Spectra Measurement

The absorption spectra of herbal raw materials were measured in triplicate on a NIRSTM DS2500 analyzer from Foss (number 91820790). Each sample was placed in a large cup-type 2502 measuring vessel (cup ID 57487) to form a 1 cm layer (according to the manufacturer’s recommendation, 1 cm, i.e., approximately 30–40 g of the raw material, depending on its bulk weight). The analysis was performed at wavelengths from 400 to 2500 nm (in 0.5 nm increments) in the spectral range of visible and near-infrared light.

2.3. Statistical Analysis

The spectra measurement was followed by statistical analyses. All the statistical calculations were carried out using R software, Version. 4.1.0. As a first step, principal component analysis (PCA) was applied to the raw spectra to reduce the number of variables in the data set. The number of principal components included in the further analysis was chosen on the basis of the Kaiser criterion; it is one of the most popular criteria used to select significant PCs [29]. For further analysis, four components were used with the percentage of explanation on the levels 78.48% 15.48% 4.24% and 0.79%, respectively. Five classification methods, namely, linear discriminant analysis (LDA), quadratic discriminant analysis (QDA), regularized discriminant analysis (RDA), super k-nearest neighbor (SKNN) and support vector machine (SVM), were applied to a combination of PC scores. Principal components (PCs) are characterized by a decreasing variance (which is a measure of their linear information capacity), so that the first principal component explains the highest percentage of total observable variable variance. Samples were classified into one of the five classes: chamomile (Ca), linden (Li), mint (Mi), nettle (Ne) and sage (Sa). All the samples from each class were randomly split 100 times into two subsets: the calibration set (80% of all the samples) and the test set (20%). The 80:20 division was carried out separately in each class, so that 80% of the samples of each class was allocated to each calibration set and 20% in the training set. The division had to be carried out in this way due to the significantly different size of the groups (number of samples in classes totaled from 30 to 159). Each time, all the classification methods (LDA, QDA, RDA, SKNN and SVM) were performed on the calibration set to estimate the parameters of the discriminant functions, and classification accuracy rates were calculated on the basis of the test set. The calculation was repeated 100 times and then mean classification accuracy was calculated.
Moreover, sensitivity and specificity parameters were calculated. Sensitivity is the metric that evaluates a model’s ability to predict true positives of each available category. Specificity is the metric that evaluates a model’s ability to predict true negatives of each available category. Both of these parameters were expressed in percentages.

3. Results

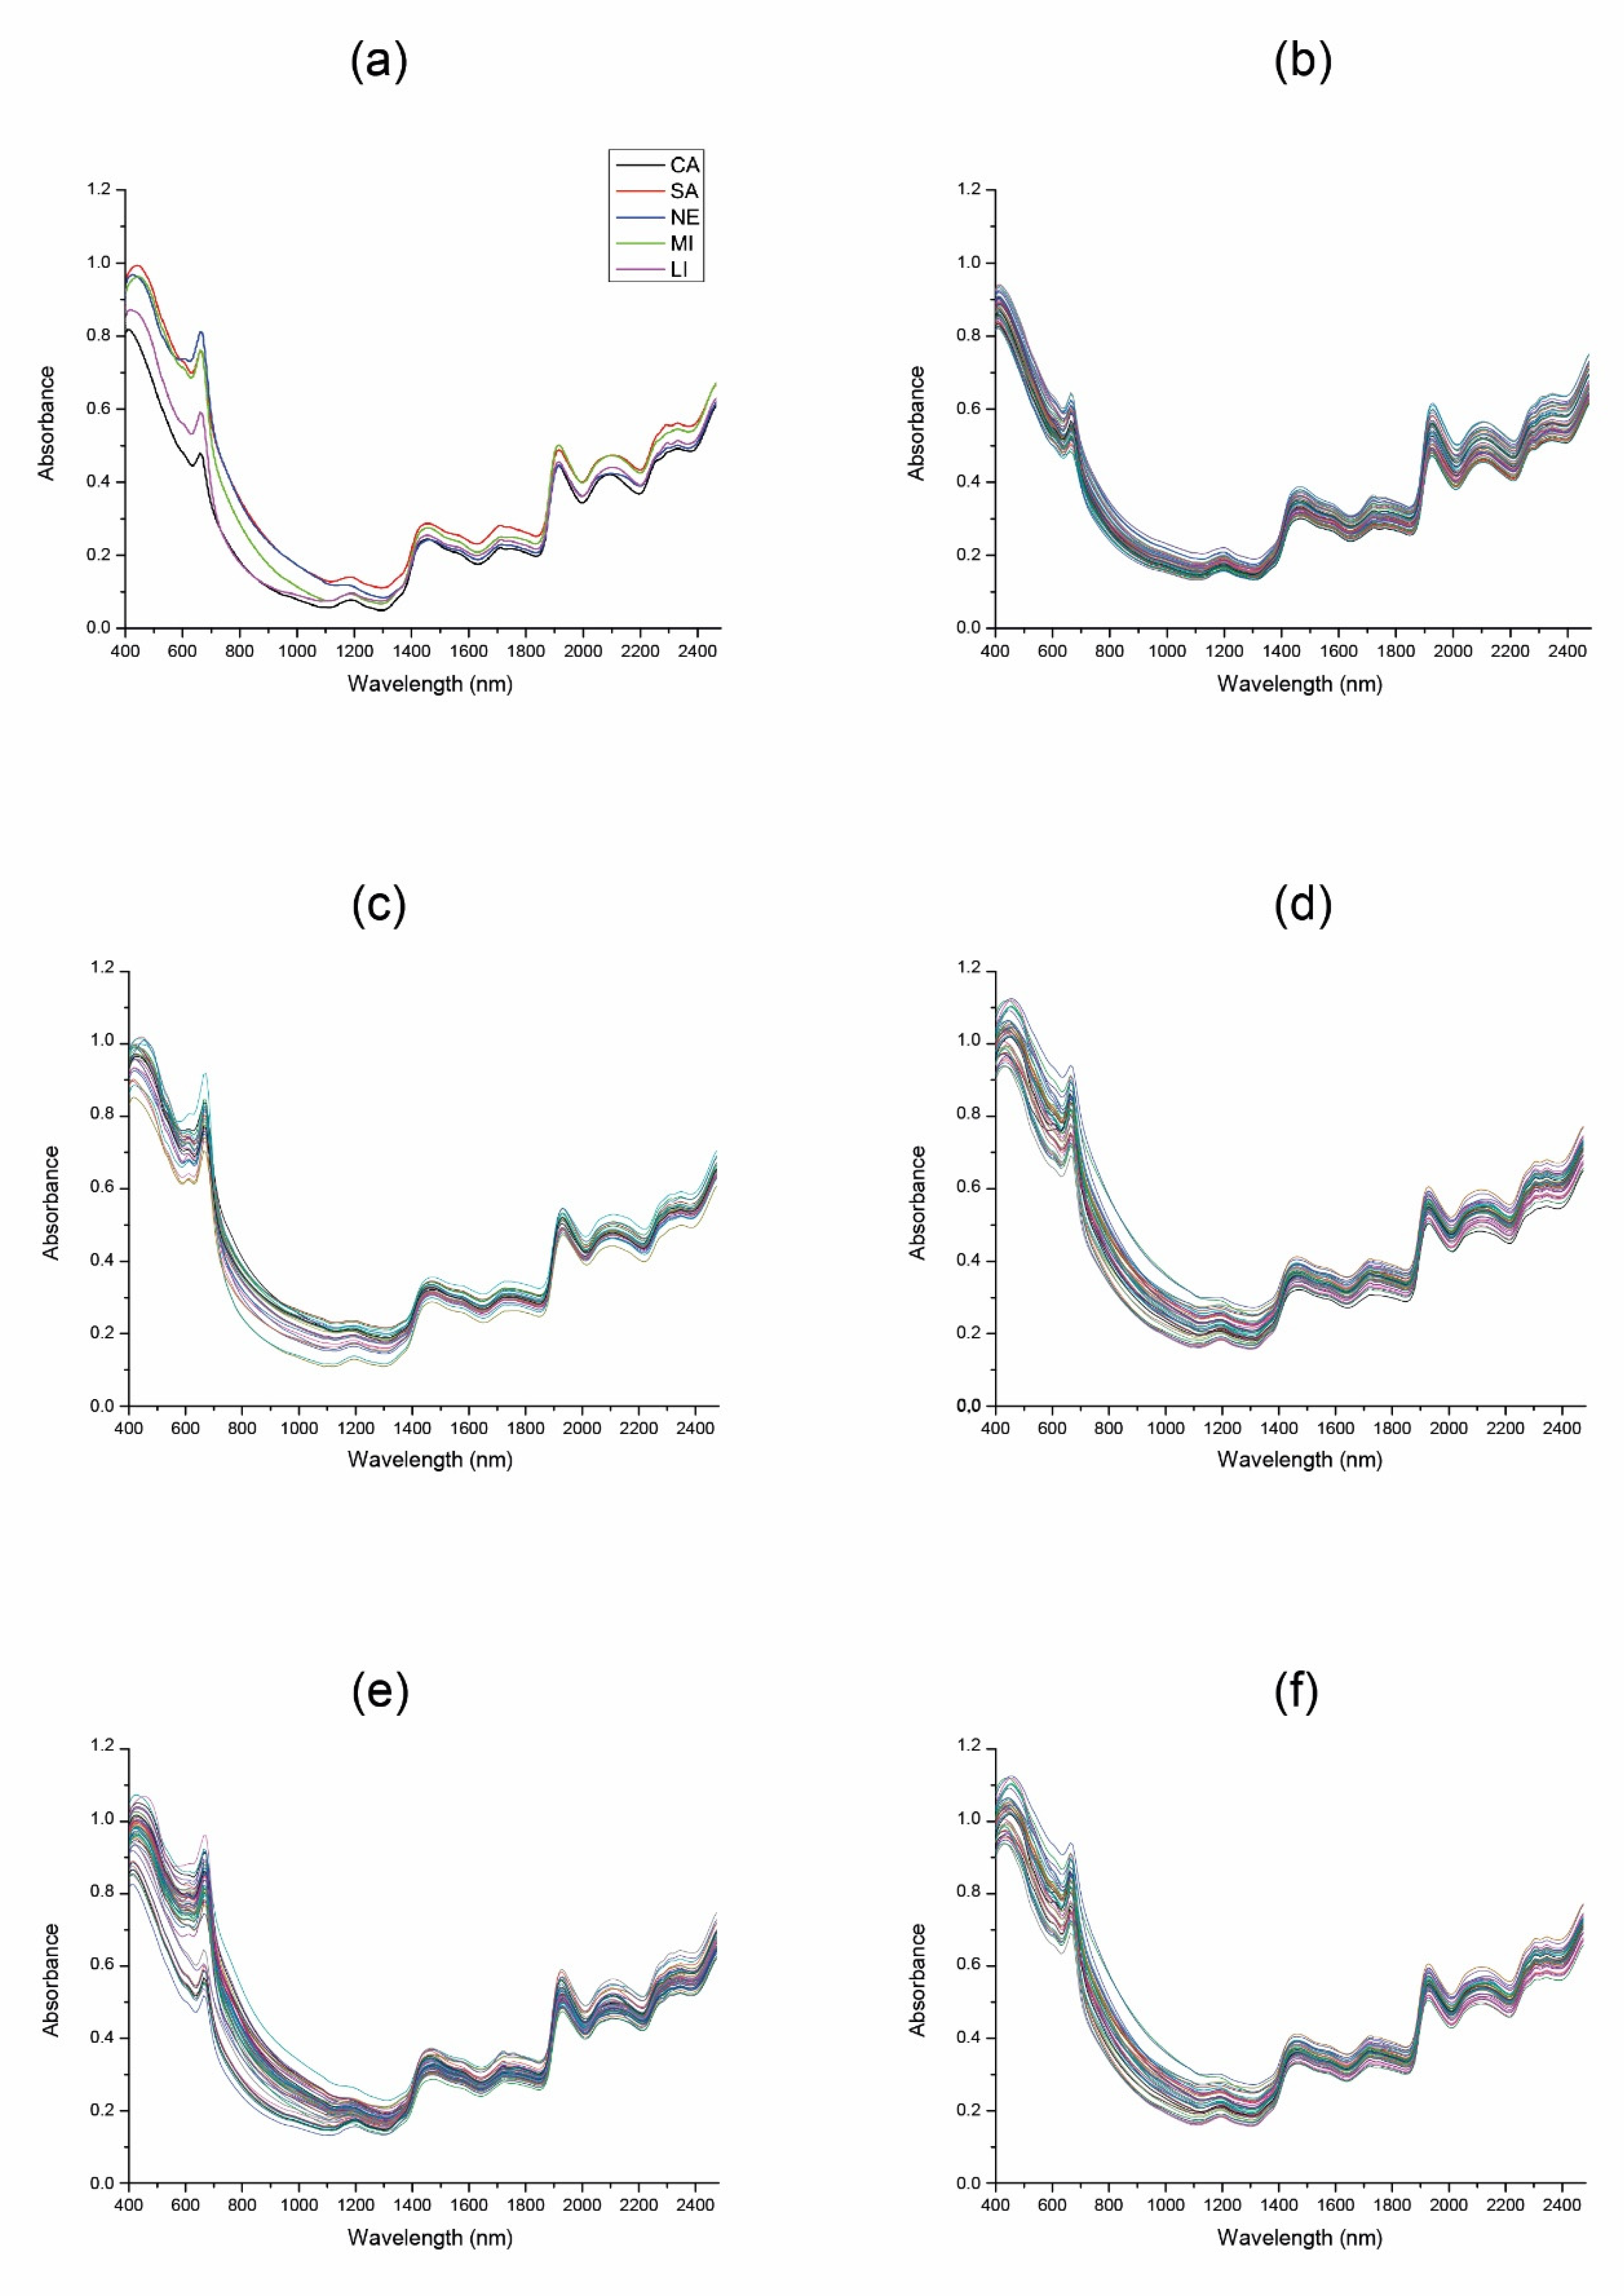
3.1. Vis–NIR Spectra of Herbs

The mean spectra acquired for herbs as a function of the wavelength are shown in Figure 1.
Figure 1a shows the calculated mean spectra of all Ca, Sa, Ne, Mi and Li samples. Significant differences between the spectra could be observed. The mean spectrum of Ca clearly differed from the mean spectrum of Sa and Mi samples, and was characterized by lower intensities in almost the entire measuring range. Figure 1b–f show the individual spectra of all measured samples: chamomile (Ca), linden (Li), mint (Mi), nettle (Ne) and sage (Sa). It could be noticed that the spectra of chamomile samples were all very similar to each other (Figure 1b). On the other hand, the spectra of the other herb species were more diverse, especially the spectra of nettle samples (Figure 1e). In the visible region, two absorption bands were observed, located in the 460–470 and 665–675 nm spectral ranges, corresponding to the lipid-soluble pigments lutein, β-carotene, chlorophyll b, chlorophyll a and pheophytin a, related to the green color of herbs [30]. As can be seen, there were numerous bands in the 1400–2300 nm region as a result of the vibration of the different groups present in such compounds as polyphenols, alkaloids, proteins, volatile and nonvolatile acids and some aroma compounds [31]. In particular, absorbance around 1490 nm was attributed to the N–H stretch first overtone and O–H stretch first overtone, thus, indicating amides or, for example, cellulose. The absorbance around 1400 nm indicated a –CH2 structure. The absorbances around 1450 nm were attributed to carbonyl groups, e.g., ketones and aldehydes, as well as O–H polymeric groups, which could be due to complex carbohydrates [32]. The 1400–1440 nm region was attributed to aliphatic alcohols and to phenols [33]. The absorbance at 2057 nm observed for all the models indicated an N–H stretch attributed to protein [32].

3.2. Reduction in Multidimensionality

The principal component analysis (PCA) was performed on the matrix containing 413 objects (herb samples) and 4200 variables (number of wavelengths) to reduce the multidimensionality of the data. The number of principal components (PCs) taken for a further analysis was chosen in accordance with the Kaiser criterion. The PCA was followed by LDA, QDA, RDA, SKNN and SVM classification analyses.

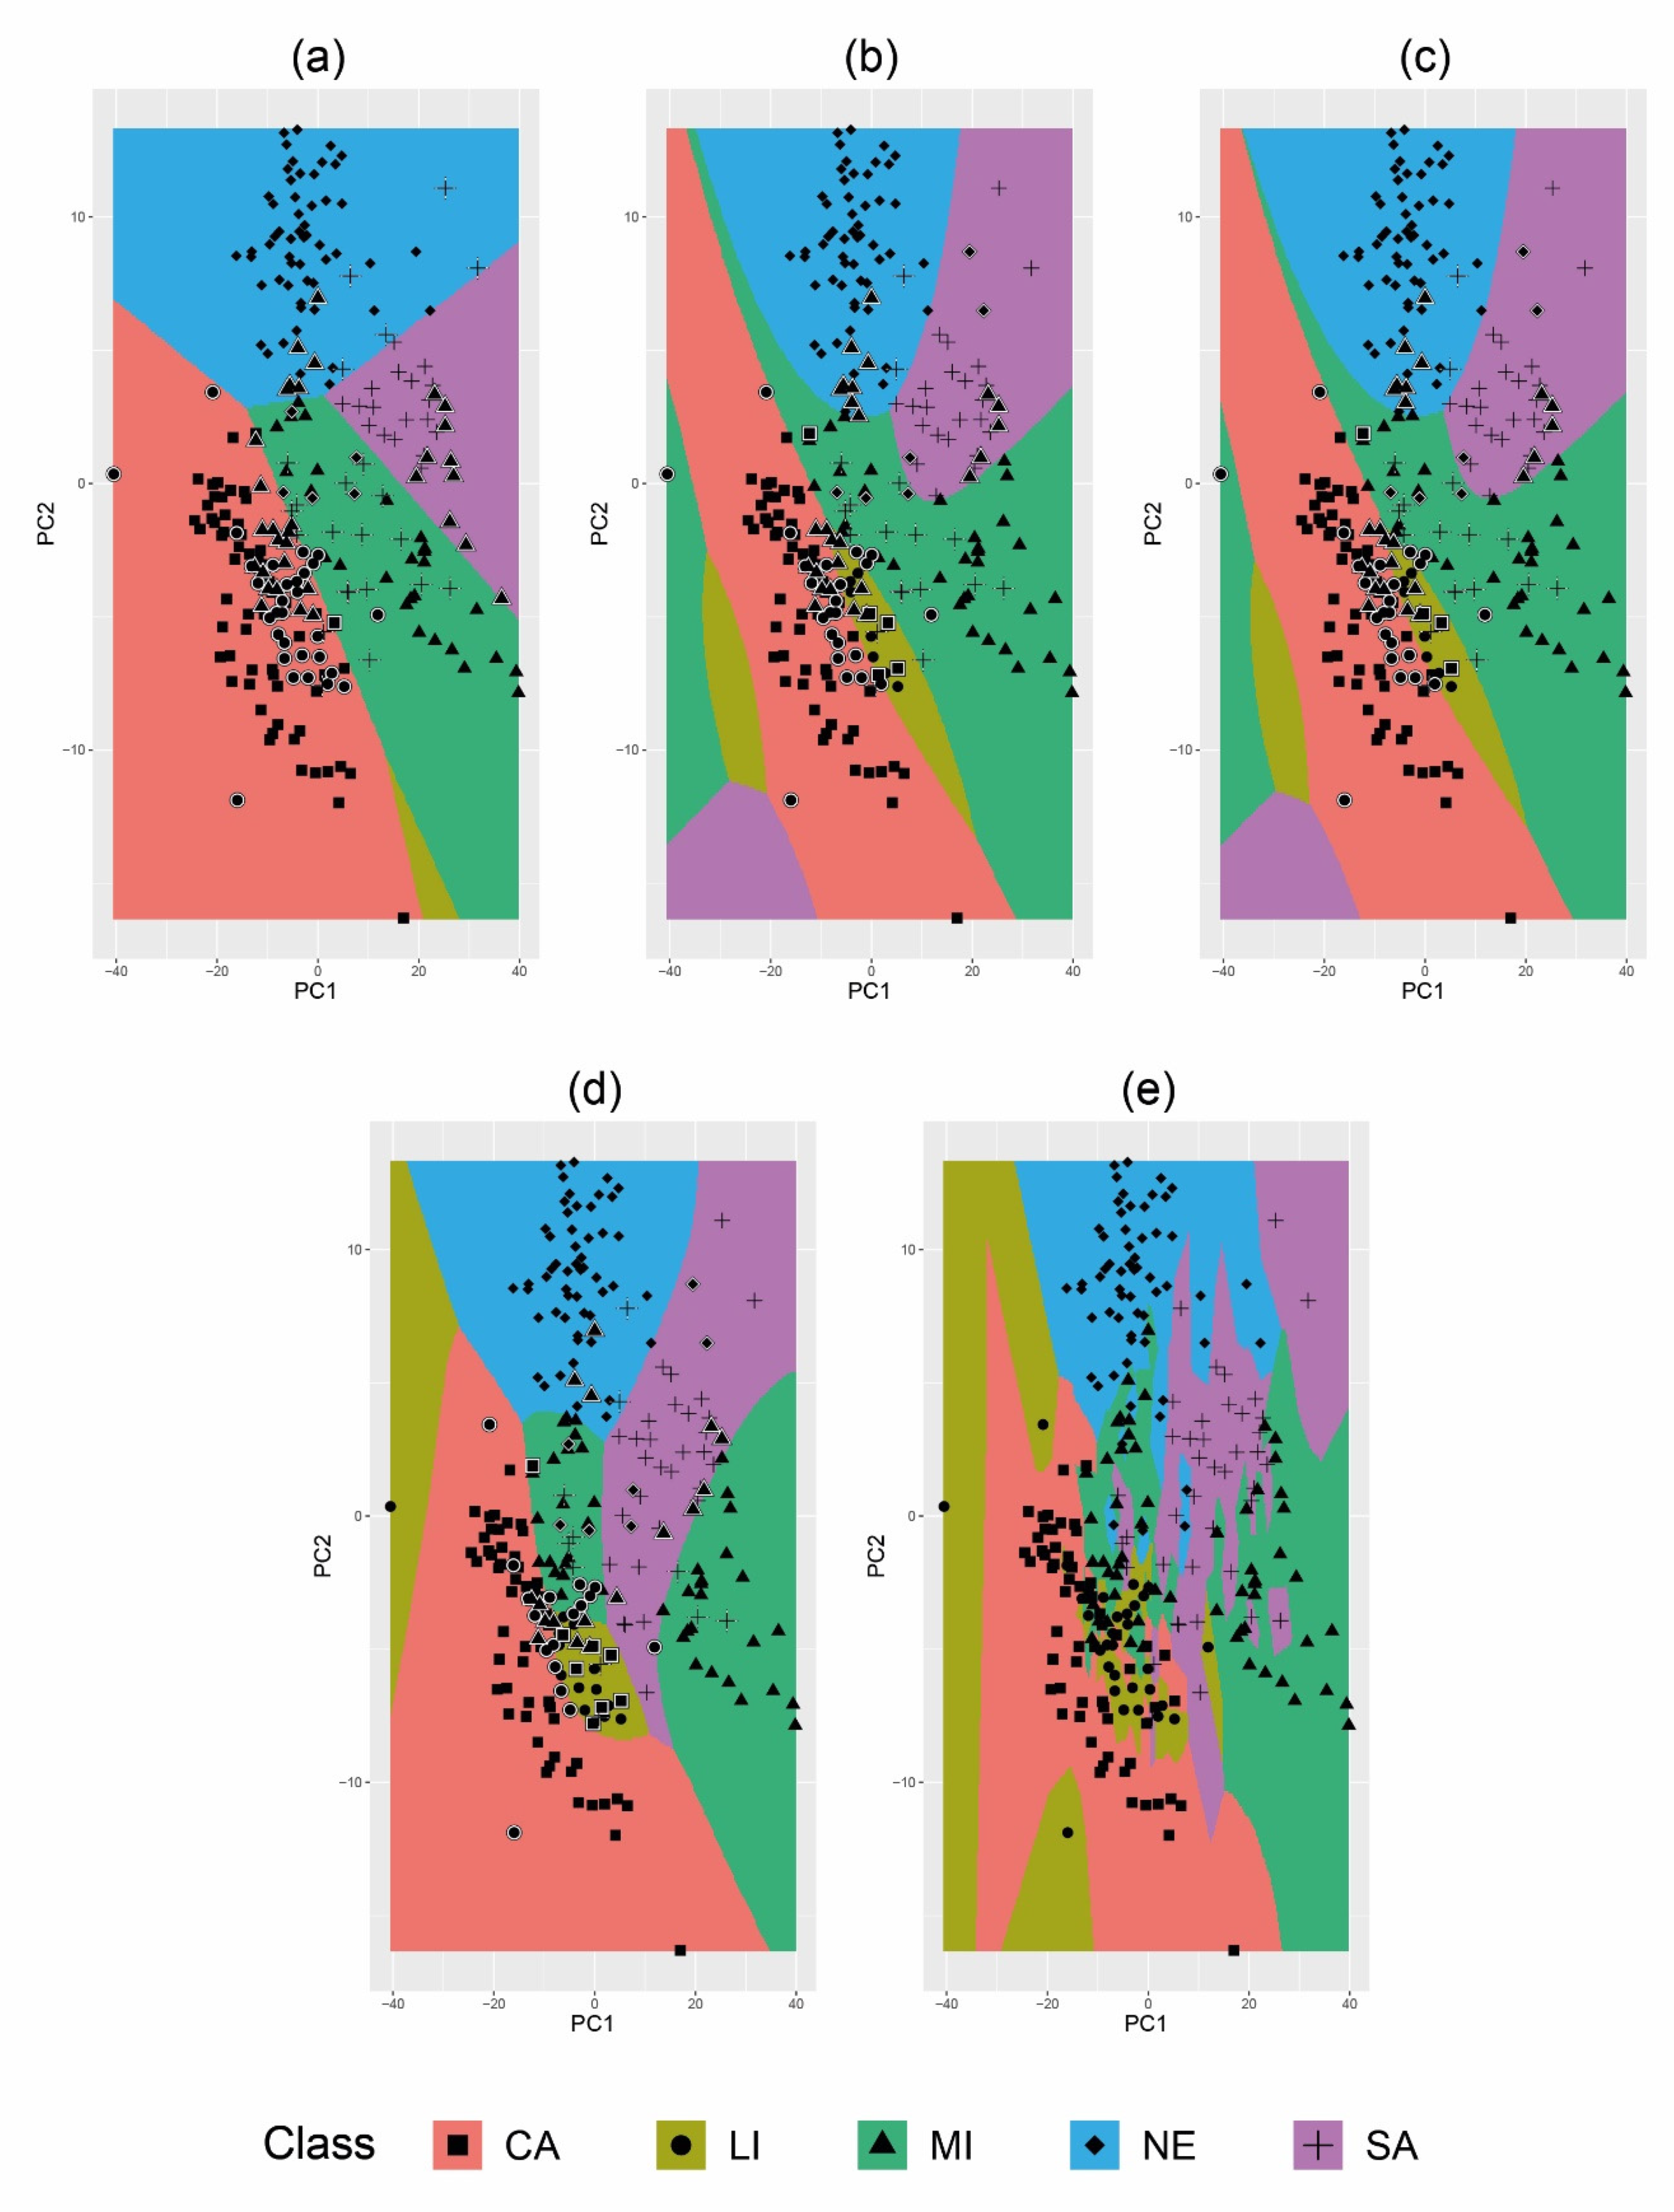
3.3. Classification of Herbs with Vis–NIR Spectra

Figure 2 visualizes different types of herb samples in the relative coordinated systems obtained by classification methods such as LDA, QDA, RDA, SKNN and SVM. It could be observed that the classes formed by different types of herbs were very close to each other, and in many cases they overlapped. In Figure 2, incorrectly classified samples have white circles around the marker. As can be seen for methods LDA, QDA, RDA and SVM, there was a similar number of highlighted samples. This corresponded to the accuracies of classification obtained for these statistic methods. From Figure 2, it could be concluded that mint (Mi) and linden (Li) samples were often incorrectly classified as chamomile (Ca) samples. Figure 2d presents the results obtained for the SKNN classification method. As it can be noticed, linden (Li), sage (Sa) and nettle (Ne) were the most misclassified samples.
Table 1 presents the accuracy, sensitivity and specificity obtained for different classification methods. Accuracy is understood as the overall percentage of correctly classified (PCC) samples. The highest accuracy rates totaled approximately92%, and were obtained for the RDA and SVM classification methods. The results obtained while applying the LDA and QDA methods were slightly worse and equaled approximately 91%. The lowest accuracy in the validation data sets equaled 86.6%, and was obtained with the SKNN method. The classification error rates in the validation data sets were below 10% for all herb classification methods, except for the SKNN chemometric method. As can be observed, the results obtained using most of the classification methods were very good, which proves that NIR spectroscopy is very useful for the classification of herbs. The results presented in Figure 2 did not always come along with error rates of the validation data sets (Table 1), as the figures visualized the results of classification methods obtained with the use of only the first two PCs, while the results presented in Table 1 are mean values obtained for 100 random calculations.
Generally, the specificity rate was better than the sensitivity rate regardless of the classification method used. The specificity exceeded 90% for all classification methods and all herb types. The lowest sensitivity rates were obtained with the SKNN method, which were 50% for linden (Li) and sage (Sa) and 75% for nettle (Ne).

4. Discussion

The literature analysis showed a great number of papers dedicated to herbal discrimination using spectroscopy and chemometrics. The results obtained in the present study were in agreement with previous findings published by Dankowska and Kowalewski [34], who examined the potential of NIR, UV–Vis and synchronous fluorescence spectroscopy for the classification of different tea types: black, green, white, yellow, dark and oolong. In that study, the lowest error rate for NIR spectroscopy was obtained with the application of the SVM method, but the results obtained with the QDA and RDA methods were also very low and did not exceed 5%. Moreover, Dankowska and Kowalewski [34] established that the lowest classification errors in the validation data set among the individual spectroscopic methods were obtained by NIR spectroscopy and did not exceed 3%. The lowest classification error rate in the validation data set was obtained by a combination of measurements with NIR and UV–Vis spectroscopies (1.4%), which proved that the use of data fusion could be very beneficial. For comparison, Chen et al. [31] used NIR spectroscopy for the rapid identification of green, black and oolong teas. The identification results of the three tea categories were achieved by the RBF-SVM classifiers and the polynomial SVM classifiers in different parameters. The best identification accuracies were up to 95%, 100% and 90%, respectively.
For comparison, in the study performed by Mishra et al. [35], near-infrared hyperspectral imaging technology (NIRHSI), followed by error-correcting output coding SVM, enabled the authors to obtain an excellent accuracy rate of 97.41% for six different commercial tea products. Chen et al. [36] achieved similar accuracy rates (between 86% and 95%) in the study using NIR spectroscopy combined with machine learning techniques for the classification of three Chrysanthemum species. Lai et al. [37] examined the potential of NIR spectroscopy methods for the discrimination of Rhizoma Corydalis according to its geographical origins. A training set of such Rhizoma Corydalis spectral objects was modeled using LS-SVM, radial BP-ANN, PLS-DA and k-nearest neighbor (KNN) methods. Comparisons of the four different approaches were carried out, and LS-SVM performed best with a correct discrimination rate of over 95%.
In a study by Fu et al. [38], NIR spectroscopy and pattern recognition methods based on the linear discriminant analysis (LDA) and partial least squares–discriminant analysis (PLS-DA) were applied to identify two common kinds of herbal medicines, Hibiscus mutabilis L. and Berberidis radix, and excellent forecasted results of NIR with PLS-DA were obtained, all with the recognition rate of 100%. The NIR fingerprinting and soft independent modeling of class analogy (SIMCA) were used to discriminate the Korean and Chinese Angelicae gigantis Radix [28]. The Korean and Chinese samples were clearly identified with 100% accuracy. The potential of NIR spectroscopy was also investigated for the discrimination of saffron’s geographical origins [39]. The proposed NIR approach showed an excellent performance for saffron geographical origin discrimination, yielding 100%, 95% and 88% recognition accuracies for Iranian, Greek and Spanish samples, respectively. NIR, in combination with SIMCA, DA and PLS-DA, was reported by Lucio-Gutiérrez et al. [40] for the rapid identification of E. senticosus from eight other herbs, which were related and not related to the Aralianceae family, and good results were obtained in the detection of adulterations when using SIMCA and PLS-DA.
Our research, and the numerous results reported by other authors, confirmed that spectroscopy and pattern recognition methods constitute a good non-destructive tool for the fast identification of herb species and can be used to identify different origins or various species, which proved to be a promising approach for the identification of complex information of herbal products.

5. Conclusions

Food fraud is a risk for valuable products such as herbs. The application of a non-targeted approach based on visible and near-infrared spectroscopy enabled rapid and simple non-destructive measurements, so could, therefore, be used in the routine quality control of a large number of samples in an environmentally friendly way. In the present study, we developed and checked the classification models based on Vis–NIR spectra that could be used in distinguishing varieties of dried herbs, including mint, linden, nettle, sage and chamomile, with high efficiency. Although there is a lack of standardization and legislation for non-targeted techniques, the results reported here, as well as numerous previously documented results, showed their great potential as high-throughput screening techniques in food quality control. The developed methods could be routinely used by the pharmaceutical industry or herbal suppliers to avoid labeling errors or adulteration.

Author Contributions

Conceptualization, A.D. and K.W.; methodology, A.D. and W.K.; software, W.K.; validation, A.D. and W.K.; formal analysis, A.D., K.W. and W.K.; investigation, A.D. and A.M.; resources, A.D. and K.W.; data curation, A.D. and A.M.; writing—original draft preparation, A.D. and K.W.; writing—review and editing, A.D., A.M. and K.W.; visualization, A.D. and W.K.; project administration, A.D.; funding acquisition, A.D., A.M. and K.W. All authors have read and agreed to the published version of the manuscript.

Funding

This research received no external funding.

Institutional Review Board Statement

Not applicable.

Informed Consent Statement

Not applicable.

Data Availability Statement

Not applicable.

Conflicts of Interest

The authors declare no conflict of interest.

References

  1. Statista Inc. Estimated Value of Spices and Herbs Market Worldwide in 2022 and 2023 (in Billion U.S. Dollars). Available online: https://www-1statista-1com-1s8fui2y11038.han11033.ue.poznan.pl/statistics/876234/global-seasoning-and-spices-market-size/ (accessed on 10 March 2022).
  2. Khodabakhshian, R.; Bayati, M.R.; Emadi, B. An evaluation of IR spectroscopy for authentication of adulterated turmeric powder using pattern recognition. Food Chem. 2021, 364, 130406. [Google Scholar] [CrossRef] [PubMed]
  3. Radzi, N.F.M.; Che Soh, A.; Ishak, A.; Hassan, M.K.; Yusof, U. Aromatic Herbs Classification by Using Discriminant Analysis Techniques. Indones. J. Electr. Eng. Comput. Sci. 2017, 5, 530–535. [Google Scholar] [CrossRef] [Green Version]
  4. Cheenkachorn, K.; Paulraj, M.G.; Tantayotai, P.; Phakeenuya, V.; Sriariyanun, M. Characterization of biologically active compounds from different herbs: Influence of drying and extraction methods. J. Indian Chem. Soc. 2022, 99, 100297. [Google Scholar] [CrossRef]
  5. Tapsell, L.C.; Hemphill, I.; Cobiac, L.; Sullivan, D.R.; Fenech, M.; Patch, C.S.; Roodenrys, S.; Keogh, J.B.; Clifton, P.M.; Williams, P.G.; et al. Health benefits of herbs and spices: The past, the present, the future. Med. J. Aust. 2006, 185, S1–S24. [Google Scholar] [CrossRef] [PubMed] [Green Version]
  6. Chua, L.Y.W.; Chong, C.H.; Chua, B.L.; Figiel, A. Influence of Drying Methods on the Antibacterial, Antioxidant and Essential Oil Volatile Composition of Herbs: A Review. Food Bioproc. Tech. 2019, 12, 450–476. [Google Scholar] [CrossRef]
  7. Ouf, S.A.; Ali, E.M. Does the treatment of dried herbs with ozone as a fungal decontaminating agent affect the active constituents? Environ. Pollut. 2021, 277, 116715. [Google Scholar] [CrossRef]
  8. Ichim, M.C. The DNA-Based Authentication of Commercial Herbal Products Reveals Their Globally Widespread Adulteration. Front. Pharmacol. 2019, 10, 1227. [Google Scholar] [CrossRef]
  9. Black, C.; Haughey, S.A.; Chevallier, O.P.; Galvin-King, P.; Elliott, C.T. A comprehensive strategy to detect the fraudulent adulteration of herbs: The oregano approach. Food Chem. 2016, 210, 551–557. [Google Scholar] [CrossRef] [Green Version]
  10. Wielogorska, E.; Chevallier, O.; Black, C.; Galvin-King, P.; Delêtre, M.; Kelleher, C.T.; Haughey, S.A.; Elliott, C.T. Development of a comprehensive analytical platform for the detection and quantitation of food fraud using a biomarker approach. The oregano adulteration case study. Food Chem. 2018, 239, 32–39. [Google Scholar] [CrossRef] [Green Version]
  11. Moore, J.C.; Spink, J.; Lipp, M. Development and Application of a Database of Food Ingredient Fraud and Economically Motivated Adulteration from 1980 to 2010. J. Food Sci. 2012, 77, R118–R126. [Google Scholar] [CrossRef]
  12. Marieschi, M.; Torelli, A.; Poli, F.; Sacchetti, G.; Bruni, R. RAPD-Based Method for the Quality Control of Mediterranean Oregano and Its Contribution to Pharmacognostic Techniques. J. Agric. Food Chem. 2009, 57, 1835–1840. [Google Scholar] [CrossRef] [PubMed]
  13. Huck, C. Infrared Spectroscopic Technologies for the Quality Control of Herbal Medicines. In Evidence-Based Validation of Herbal Medicine; Elsevier: Berlin/Heidelberg, Germany, 2015; pp. 477–493. [Google Scholar] [CrossRef]
  14. Dali, A.; Omar, N.A.; Mustapha, A. Data Mining Approach to Herbs Classification. Indones. J. Electr. Eng. Comput. Sci. 2018, 12, 570–576. [Google Scholar] [CrossRef]
  15. Kuballa, T.; Brunner, T.S.; Thongpanchang, T.; Walch, S.G.; Lachenmeier, D.W. Application of NMR for authentication of honey, beer and spices. Curr. Opin. Food Sci. 2018, 19, 57–62. [Google Scholar] [CrossRef]
  16. Penner, M.H. Ultraviolet, Visible, and Fluorescence Spectroscopy. In Food Analysis; Nielsen, S.S., Ed.; Springer International Publishing: Cham, Switzerland, 2017; pp. 89–106. [Google Scholar]
  17. Nicolaï, B.M.; Beullens, K.; Bobelyn, E.; Peirs, A.; Saeys, W.; Theron, K.I.; Lammertyn, J. Nondestructive measurement of fruit and vegetable quality by means of NIR spectroscopy: A review. Postharvest Biol. Technol. 2007, 46, 99–118. [Google Scholar] [CrossRef]
  18. Vaudour, E.; Cerovic, Z.G.; Ebengo, D.M.; Latouche, G. Predicting Key Agronomic Soil Properties with UV-Vis Fluorescence Measurements Combined with Vis-NIR-SWIR Reflectance Spectroscopy: A Farm-Scale Study in a Mediterranean Viticultural Agroecosystem. Sensors 2018, 18, 1157. [Google Scholar] [CrossRef] [Green Version]
  19. Engel, J.; Gerretzen, J.; Szymańska, E.; Jansen, J.J.; Downey, G.; Blanchet, L.; Buydens, L.M.C. Breaking with trends in pre-processing? TrAC -Trends Anal. Chem. 2013, 50, 96–106. [Google Scholar] [CrossRef]
  20. Kucharska-Ambrożej, K.; Karpinska, J. The application of spectroscopic techniques in combination with chemometrics for detection adulteration of some herbs and spices. Microchem. J. 2020, 153, 104278. [Google Scholar] [CrossRef]
  21. Oliveira, M.M.; Cruz-Tirado, J.P.; Barbin, D.F. Nontargeted Analytical Methods as a Powerful Tool for the Authentication of Spices and Herbs: A Review. Compr. Rev. Food Sci. Food Saf. 2019, 18, 670–689. [Google Scholar] [CrossRef] [Green Version]
  22. Drabova, L.; Alvarez-Rivera, G.; Suchanova, M.; Schusterova, D.; Pulkrabova, J.; Tomaniova, M.; Kocourek, V.; Chevallier, O.; Elliott, C.; Hajslova, J. Food fraud in oregano: Pesticide residues as adulteration markers. Food Chem. 2019, 276, 726–734. [Google Scholar] [CrossRef]
  23. Cantarelli, M.Á.; Moldes, C.A.; Marchevsky, E.J.; Azcarate, S.M.; Camiña, J.M. Low-cost analytic method for the identification of Cinnamon adulteration. Microchem. J. 2020, 159, 105513. [Google Scholar] [CrossRef]
  24. Beć, K.B.; Grabska, J.; Huck, C.W. NIR spectroscopy of natural medicines supported by novel instrumentation and methods for data analysis and interpretation. J. Pharm. Biomed. Anal. 2021, 193, 113686. [Google Scholar] [CrossRef] [PubMed]
  25. Ni, L.; Zhang, F.; Han, M.; Zhang, L.; Luan, S.; Li, W.; Deng, H.; Lan, Z.; Wu, Z.; Luo, X.; et al. Qualitative analysis of the roots of Salvia miltiorrhiza and Salvia yunnanensis based on NIR, UHPLC and LC–MS-MS. J. Pharm. Biomed. Anal. 2019, 170, 295–304. [Google Scholar] [CrossRef] [PubMed]
  26. Duan, X.; Zhang, D.; Nie, L.; Zang, H. Rapid discrimination of geographical origin and evaluation of antioxidant activity of Salvia miltiorrhiza var. alba by Fourier transform near infrared spectroscopy. Spectrochim. Acta A Mol. 2014, 122, 751–757. [Google Scholar] [CrossRef] [PubMed]
  27. Yang, Y.; Wu, Y.; Li, W.; Liu, X.; Zheng, J.; Zhang, W.; Chen, Y. Determination of geographical origin and icariin content of Herba Epimedii using near infrared spectroscopy and chemometrics. Spectrochim. Acta A Mol. 2018, 191, 233–240. [Google Scholar] [CrossRef] [PubMed]
  28. Woo, Y.A.; Kim, H.J.; Ze, K.R.; Chung, H. Near-infrared (NIR) spectroscopy for the non-destructive and fast determination of geographical origin of Angelicae gigantis Radix. J. Pharm. Biomed. Anal. 2005, 36, 955–959. [Google Scholar] [CrossRef]
  29. Kaiser, H.F. The Application of Electronic Computers to Factor Analysis. Educ. Psychol. Meas. 1960, 20, 141–151. [Google Scholar] [CrossRef]
  30. Li, X.; Jin, J.; Sun, C.; Ye, D.; Liu, Y. Simultaneous determination of six main types of lipid-soluble pigments in green tea by visible and near-infrared spectroscopy. Food Chem. 2019, 270, 236–242. [Google Scholar] [CrossRef]
  31. Chen, Q.; Zhao, J.; Fang, C.H.; Wang, D. Feasibility study on identification of green, black and Oolong teas using near-infrared reflectance spectroscopy based on support vector machine (SVM). Spectrochim. Acta A Mol. 2007, 66, 568–574. [Google Scholar] [CrossRef]
  32. Burns, D.A.; Ciurczak, E.W. Handbook of Near-Infrared Analysis, 3rd ed.; CRC Press: Boca Raton, FL, USA, 2007. [Google Scholar] [CrossRef]
  33. Workman, J., Jr.; Weyer, L. Practical Guide and Spectral Atlas for Interpretive Near-Infrared Spectroscopy, 2nd ed.; CRC Press: Boca Raton, FL, USA, 2012. [Google Scholar] [CrossRef]
  34. Dankowska, A.; Kowalewski, W. Tea types classification with data fusion of UV–Vis, synchronous fluorescence and NIR spectroscopies and chemometric analysis. Spectrochim. Acta A Mol. 2019, 211, 195–202. [Google Scholar] [CrossRef]
  35. Mishra, P.; Nordon, A.; Tschannerl, J.; Lian, G.; Redfern, S.; Marshall, S. Near-infrared hyperspectral imaging for non-destructive classification of commercial tea products. J. Food Eng. 2018, 238, 70–77. [Google Scholar] [CrossRef] [Green Version]
  36. Chen, C.-w.; Yan, H.; Han, B.-x. Rapid identification of three varieties of Chrysanthemum with near infrared spectroscopy. Rev. Bras. Farmacogn. 2014, 24, 33–37. [Google Scholar] [CrossRef] [Green Version]
  37. Lai, Y.; Ni, Y.; Kokot, S. Discrimination of Rhizoma Corydalis from two sources by near-infrared spectroscopy supported by the wavelet transform and least-squares support vector machine methods. Vib. Spectrosc. 2011, 56, 154–160. [Google Scholar] [CrossRef]
  38. Fu, H.; Fan, Y.; Zhang, X.; Lan, H.; Yang, T.; Shao, M.; Li, S. Rapid Discrimination for Traditional Complex Herbal Medicines from Different Parts, Collection Time, and Origins Using High-Performance Liquid Chromatography and Near-Infrared Spectral Fingerprints with Aid of Pattern Recognition Methods. J. Anal. Methods Chem. 2015, 2015, 727589. [Google Scholar] [CrossRef] [PubMed] [Green Version]
  39. Zalacain, A.; Ordoudi, S.A.; Díaz-Plaza, E.M.; Carmona, M.; Blázquez, I.; Tsimidou, M.Z.; Alonso, G.L. Near-Infrared Spectroscopy in Saffron Quality Control:  Determination of Chemical Composition and Geographical Origin. J. Agric. Food Chem. 2005, 53, 9337–9341. [Google Scholar] [CrossRef]
  40. Lucio-Gutiérrez, J.R.; Coello, J.; Maspoch, S. Application of near infrared spectral fingerprinting and pattern recognition techniques for fast identification of Eleutherococcus senticosus. Food Res. Int. 2011, 44, 557–565. [Google Scholar] [CrossRef]
Figure 1. Spectra in visible and near-infrared range of different herbs: (a) average spectra for all herbs, (b) chamomile (Ca) spectra, (c) linden (Li) spectra, (d) mint (Mi) spectra, (e) nettle (Ne) spectra and (f) sage (Sa) spectra.
Sustainability 14 06416 g001
Figure 2. Classification plots of Vis–NIR spectra of different herb types, for (a) LDA, (b) QDA, (c) RDA, (d) SKNN and (e) SVM.
Sustainability 14 06416 g002
Table 1. Sensitivity, specificity and accuracy (%) of LDA, QDA, RDA, SKNN and SVM classification methods for different herb types.
Method Chamomile (Ca)Linden (Li)Mint (Mi)Nettle (Ne)Sage (Sa)
LDASensitivity (%)100.086.791.888.385.4
Specificity (%)96.999.697.999.595.3
Accuracy (%)91.3
QDASensitivity (%)91.783.3100.075.087.5
Specificity (%)100.0100.094.7100.090.5
Accuracy (%)91.4
RDASensitivity (%)100.083.391.775.0100.0
Specificity (%)97.4100.0100.0100.090.5
Accuracy (%)92.2
SKNNSensitivity (%)100.050.091.775.050.0
Specificity (%)94.797.794.794.790.5
Accuracy (%)86.6
SVMSensitivity (%)100.076.791.775.087.5
Specificity (%)97.4100.094.7100.090.5
Accuracy (%)92.1
Publisher’s Note: MDPI stays neutral with regard to jurisdictional claims in published maps and institutional affiliations.

