
The Importance of Digital Transformation in International Business


1
REMIT (Research on Economics, Management and Information Technologies), IJP (Portucalense Institute for Legal Research), University Portucalense, 4200-072 Porto, Portugal
2
Institute of Electronics and Telematics Engineering of Aveiro (IEETA), University of Aveiro, 3810-193 Aveiro, Portugal
3
INESC TEC—Institute for Systems and Computer Engineering, Technology and Science, University Portucalense, 4200-072 Porto, Portugal
*
Author to whom correspondence should be addressed.
†
These authors contributed equally to this work.
Sustainability 2022, 14(2), 834; https://0-doi-org.brum.beds.ac.uk/10.3390/su14020834
Submission received: 22 November 2021
/
Revised: 31 December 2021
/
Accepted: 31 December 2021
/
Published: 12 January 2022
(This article belongs to the Special Issue Digital Transformation, Social Innovation and Sustainable Business Model Innovation)
Abstract
:This study was developed under the scope of a Portuguese project focused on the entrepreneur’s perspective and perception on the internationalization process of his company: more specifically, about the factors that enhanced the company entry into foreign markets as well as the constraints found in this process. This work focuses on the importance of using digital transformation to integrate technological tools in international business practice and strategy and the obstacles encountered with introducing these new technologies. This study aims to determine the relationships between technology categories and obstacles. The final goal is to assess the impact of these characteristics of the companies by the sector of economic activity, size, and percentage of profits resulting from international expansion. A questionnaire was designed and sent by email to 8183 companies from the AICEP database, distributed by three main activity sectors. A total of 310 valid answers were gathered from the Portuguese internationalized companies. The research limitations are related to the reduced number of interviews. These interviews showed that managers were not aware of the concept of digital transformation and misunderstood the use of digital technologies in the internationalization process of the business. This limitation can add some bias to the qualitative results. In addition to these limitations, the number of responses per sector was also not homogeneous. The practical implications of this study are that managers and top-level executives can use that to better understand how companies could use digital tools and what obstacles they should avoid when they want to internationalize their business. This paper is one of the first research contributions to analyze the impact of digital transformation in the internalization of Portuguese companies.
1. Introduction
The internationalization of companies is increasingly dependent on their digitalization. Since companies started dematerializing borders and reducing costs with the usage of e-commerce, they have also changed how business is conducted Gregory et al. [1]. The introduction of mobile technologies, storage solutions (cloud computing), learning algorithms, and big data technologies has created new opportunities for companies and has increased digitalization. Data scientists can extract the most outstanding possible customer knowledge from a large amount of data produced by these technologies. The goal is to define new personalized products and services described by Kraus et al. [2]. Three-dimensional printers also represent a crucial advance in manufacturing techniques, as does the Internet of Things (IoT). According to Iansiti and Lakhani [3], the opportunities introduced by blockchain technology provide companies with transparent storage and transmission of information, which is secure and works without third parties based on code.
In this context, it is possible to define, according to Hervé et al. [4], four fields of activity related to the main internationalizing criteria. These are (i) costs, accessibility, resources and competencies; (ii) market knowledge; (iii) distance and location; and (iv) relational competencies and partner networks.
Technologies listed above have greater or lesser relevance in all the fields of activity previously mentioned. These technologies are always present when the companies want to become more international and more competitive. For the first criteria, the use of IoT described by Strange and Zucchella [5], and virtual reality (VR)/augmented reality (AR) technologies are good examples of tools to reduce production costs and to have the potential to influence organizations and employees dramatically. For the second criteria, Neubert [6] shows that capturing and disseminating large amounts of data can accelerate internationalization. Processing these data allow, through predictive algorithms, to assess the current conditions of the company, as well as the possible attractiveness of new markets where it intends to conduct its activity. The authors also add that, based on the volume of data, it is also possible to use advanced data-mining techniques, such as machine learning, for decision making. Artificial intelligence and statistical approaches can help companies build more adequate internationalization strategies.
On the other hand, in Strange and Zucchella [5], it is shown that in machine-to-machine and machine-to-human interaction, IoT facilitates product customization. In addition, three-dimensional (3D) printers provide customers with more significant influence over the design of their products and the control of manufacturing origins. Regarding the third criteria, according to Coviello et al. [7], it is possible to develop a large community of users and create partnerships with local companies via platforms. Finally, for the last criterion, it is possible to highlight, according to Coviello et al. [7] and Strange and Zucchella [5], the sharing of data between partners to reach target networks and to make sustainable use of social networks and mass media. The goal is to get feedback on products and even as local manufacturers.
According to Kraus et al. [8], digitalization is changing businesses worldwide because of globalization. In recent decades, the pressure for business has increased to change radically; the emergence of global businesses, such as Uber, Airbnb, among others, can be highlighted, which sustain their globalization through technology and the proposal of innovative business models. White [9] shows that it is possible to find an efficient integration through the digitalization of processes and collaboration tools. In this context, the importance of digital transformation (DT) has increased (Bouncken et al. [10]) and virtually affects all segments of the business (Hess et al. [11], Bouwman et al. [12]). To the best of our knowledge, there are only six studies that were carried out for Portuguese SMEs companies (Alves [13]). The present study aims to find out the perception of the Portuguese entrepreneurs about the internationalization process of their companies, more specifically, the importance of using DT to integrate technological tools in international business practice and strategy and the obstacles encountered with introducing these new technologies.
According to Muthuraman [14] and Isensee et al. [15], the digitalization processes have become part of every aspect of business with a major impact on business growth and sustainable development. Bai et al. [16] describe digitalization and sustainability as a good practice that should be part of strategic plans for organizations. Denicolai et al. [17] presents some findings indicating that sustainability is going to become a competitive driver for those SMEs having an international orientation. Sustainability issues on SMEs have also gained further attention in “the new normal” era, confirming that there are two dimensions—digitalization and sustainability [18].
To validate and measure the reliability of constructs, Cronbach’s alpha was applied, mainly, because it is the common test for internal reliability of latent constructs suggested by Malhotra et al. [19]. The results show that all constructs were satisfied. In other words, we want to find out whether these variables, whatever the sector, size, and rate of profits resulting from global growth, can result in competitive advantages for the internationalization of business.
This paper follows the following structure: Section 2 presents the background concepts involved in this study. Section 3 reviews the central literature for business digitalization. Section 4 is devoted explicitly to the proposed methodology, and Section 5 presents the obtained results as well as the discussion. Finally, in Section 6, we conclude with final remarks and envision potential future research directions.
2. Background
According to Sestino et al. [20], digitalization blurs the boundaries between technology and management (facilitating new business models integrated into digital environment concepts, methods and tools that lead to the DT).
2.1. Digitalization
Digitalization within a business context is a concept of more automatic and digital operations. All data are transferred to computer systems and become more accessible. Thus, the development of automation enabled by robotics and artificial intelligence brings the promise of higher levels of productivity and also better efficiency, security, and convenience described by Company and Manyika [21], as well as, according to Valenduc and Vendramin [22], transforming the world of work, creating new types of digital or virtual work. This digitalization, according to Huckstep [23], is transforming entrepreneurship in two ways. The first transformation is the inconstant location of entrepreneurial opportunities in the economy, and the second is the transformation of entrepreneurial practices themselves. The same author uses the term “digital disruption” to describe the transformational impact of digital technologies and infrastructures on how the business, economy, and society operate. This digital disruption creates opportunities for small medium enterprises (SMEs) to grow and internationalize. If they do not follow the digitalization trend, they will fall behind their competitors, eventually leading to their closure, for example, with Kodak.
2.2. Digital Transformation
Gong and Ribiere [24] created a unified definition of DT because, up to the time of the publication, there were 134 definitions. They present the following unified definition of digital transformation: “A fundamental change process, enabled by the innovative use of digital technologies accompanied by the strategic leverage of key resources and capabilities, aiming to radically improve an entity and redefine its value proposition for its stakeholders”.
Companies that present disruptive digital business models (Google, Tesla, Apple, Amazon, Netflix, Uber, and Airbnb, among others) use the most recent technologies (cloud computing, Internet of Things (IoT), big data analytics, and machine learning) that have been supporting and driving DT. As concrete examples presented by Oswald and Kleinemeier [25], the business model of Uber and Airbnb is entirely digital and uses the mentioned technologies. Another example is the change seen in the television and film industry with the emergence of companies such as Netflix and HBO that use streaming services. These organizations could gain access to the global market because they strategically leveraged their resources and capabilities (using the suitable means, that is, the right technologies) to recreate value (having a far-reaching impact reaching all parts of the world). It allows them to adapt to changes in customer preferences and market dynamics, as is happening in this pandemic that we are currently experiencing.
All organizations/companies (organization, business network, industry, and society) have valuable digital assets, whether they are data or functionality, but resources (human, financial, and knowledge) and capabilities (digital capabilities and dynamic resources) are the strategic assets for initiating or accelerate DT, leveraging, reusing, combining, and sharing with stakeholders. Zavery [26] describe DT as not about using digital technologies themselves, launching more mobile apps or migrating to the cloud or enjoying machine learning or most of the other finite things that people associate with it. Nevertheless, the strategic leverage of resources and capabilities radically improves an organization/company and redefines its value proposition for stakeholders. Preferences and market dynamics are happening in this pandemic that the world is currently experiencing.
2.3. Internationalization
Beneki et al. [27] describe internationalization as a “means that a company acts in one or several foreign markets and thus develops its activities in an international context”. The authors also explain that internationalization helps companies to have a competitive advantage in doing business abroad. This competitive advantage appears with the advent of globalization and the knowledge economy, allowing the establishment of strategies that increase the internationalization of companies, especially SMEs. However, SMEs are generally limited in their resources and international experience.
Internationalization is an essential source for the company’s growth and to improve its performance. For example, there was a clustering of internationalization in large organizations in the past, but the internationalization strategy of SMEs started to increase when digital technologies allowed them easy access to other types of markets. These technologies increased the speed of internationalization and created the global recognition of opportunities, as evidenced by trends in using these means to promote, communicate and reach various partners. Thus, internationalizing has become a competitive necessity for many companies, allowing their survival and growth under challenging conditions, such as globalization and in the middle of the knowledge economy.
2.4. Digital Business Transformation
The digital transformation of the business, according to Schwertner [28], is the application of technology to build new business models, processes, software, and systems that result in higher profits, more significant competitive advantage, and greater efficiency. Companies achieve this goal by transforming business processes and models, enhancing the efficiency and innovation of the workforce, and customizing the experiences of customers/citizens. Among companies where cloud, mobile, social, and big data technologies (key pillars of DT) are critical parts of their infrastructure, these technologies are already profitable, on average, have higher revenues, and have achieved a higher market valuation than competitors, without an appropriate view of usage aligned with their strategy. However, as with any emerging technology, significant challenges are associated with cloud, mobile, social, and big data initiatives. The main risks that prevent its wider adoption are data security issues, legal issues, lack of interoperability with existing information technology (IT) systems, and lack of control, which can somehow, in the initial phase, delay the digital transformation of the business and, as a consequence, slow down the internationalization of the business.
2.5. Digital Technologies
2.5.1. 5th Generation (5G) Telecommunications
5G wireless communications meet the challenges that large-scale complex network connections pose. These networks have extremely low latency, greater capacity, and improved data transmission speed, using millimeter higher frequency waves than existing networks (Simkó and Mattsson [29]). The transmission latency and the download speed of these networks are much better than those of previous generations (3G and 4G). In the first case, it allows a much lower transmission latency (Samsung [30]), and in the second case, it can increase the download speed by 20 times (Nordrum et al. [31]), which substantially improves the service provided to end users.
2.5.2. The Internet of Things (IoT)
The number of mobile devices has exceeded the number of the global population (Simkó and Mattsson [29]). In this way, there is an increased interconnection between devices and machines, maintaining connections without direct human intervention. This network is known as the IoT to differentiate it from the traditional internet connecting people. It is the network of physical objects incorporated with sensors and transmitting and processing data, communicating with other machines or humans, being often automated. Nowadays, networks connect individuals, but as individuals begin to use monitoring devices, such as smartwatches, smart homes, mobile payments, and travel in smart cities with driverless cars, the capacity required of networks is growing exponentially. All this connectivity requires that communication infrastructures be improved, and 5G will support this ubiquitous connectivity and enable IoT, connecting virtually all aspects of human life. Connected devices will reach around 500 billion, about 59 times the projected human population, by 2030, when mass marketing of 6G is expected (Newsroom [32]).
2.5.3. Artificial Intelligence and Important Subareas
The concept of artificial intelligence (AI) proposed by McCarthy et al. [33] appeared for the first time in 1956, and the authors stated that: “The study is to proceed based on the conjecture that every aspect of learning or any other feature of intelligence can in principle be so precisely described that a machine can be made to simulate it”. Since then, there has been a significant evolution in this activity area, where the machine learning (ML) developed by Samuel [34] appeared as a subarea. The focus of this technique is on systems learning automatically from experience instead of being programmed. In the 1980s, ML demonstrated great potential in computational forecasting and predictive analysis (Bengio et al. [35]). Deep learning (DL), a subarea of ML, allows studying the underlying resources in data from various processing layers using neural networks, similar to the human brain (Goodfellow et al. [36]). As of 2010, DL has attracted immense attention in many fields, especially image recognition and speech recognition (Ferreira et al. [37], Schmidhuber [38]).
2.5.4. Augmented and Virtual Reality
Virtual reality (VR) will significantly impact society when 5G and later 6G emerge. Technology has a widespread presence since it will provide the technical conditions, namely the communications infrastructures, that will allow users to interact with the simulated elements practically in real time. Augmented reality (AR), in which computer-aided information is generated and graphically augmented for display in real time, may also have vast implications in any sector of activity. VR creates a digital experience in which the user’s environment is immersive. The user usually wears an immersive headset that limits peripheral vision in the VR environment. AR combines digital information with real-world environmental data, allowing users to simultaneously interact with digital images and view the real physical environment. AR integrates virtual objects in real-world space, while VR generally blocks information from the real environment and transports users to a simulated virtual world (Cipresso et al. [39]).
2.5.5. Big Data and Associated Analytics
As discussed in Chen et al. [40], on the one hand, big data is considered an abstract concept, and, on the other hand, the academic and industrial communities have different views on the definition (Team et al. [41]). However, some definitions have appeared over time, namely by Apache Hadoop, IBM, McKinsey & Company, and IDC. Though introduced by Doug Laney in 2001, the first definition was of the 3Vs model (volume, velocity, and variety) (Gantz and Reinsel [42]). This definition has changed, and in 2011, IDC defined big data as follows: “Big data technologies describe a new generation of technologies and architectures, designed to economically extract value from huge volumes of a wide variety of data, by enabling the high-velocity capture, discovery, and analysis” (Labrinidis and Jagadish [43]). This definition implied a change from the 3Vs model to a 4Vs model with the inclusion of value (tremendous value but very low density).
2.5.6. Cloud Computing
The basic definition of cloud computing is described by Armbrust et al. [44] and is given as follows: “Cloud computing refers to both the applications delivered as services over the Internet and the hardware and systems software in the data centres that provide those services”. The services themselves have long been referred to as software as a service (SaaS). Some providers use infrastructure as a service (IaaS) and platform as a service (PaaS) to describe their products. While realizing that the definition may vary, Ochian et al. [45] describe cloud computing “as a mechanism for generating ubiquitous access to a pool of convenient, on-demand computing resources (compute, storage, platform, application, and services) through a web interface with low administration overhead and the least intervention from a cloud service provider”. Providers such as Amazon, Google, and Microsoft support this new paradigm. Microsoft offers SaaS, PaaS, and IaaS cloud packages to end users. Regarding the advantages of the implementation of the cloud computing paradigm, Uhl and Gollenia [46] put forward the following enhancers for organizations: “(i) Increase user mobility by a ubiquitous approval of information on any device; (ii) Flexibility and cost savings by eliminating the need for heavy local installations of end-user applications and high-powered client computers; and (iii) Boost your business by the shift from fixed costs to variable costs”.
3. Theoretical Foundation
Knight and Cavusgil [47] argue that it is not enough to have digital technology and the necessary strong strategic market orientation; they also need to have distribution networks and market knowledge, among others, which can be obstacles to the companies and compromise the internationalization process. However, according to Dethine et al. [48], the market, with an increasing level of demand, means that the internationalization strategy is closely associated with digital transformation.
It is possible to automate processes and assist in business internationalization with digital technologies as long as they are appropriately incorporated. In this context, Sebastian et al. [49] show how social technologies, mobile technologies, analytics, clouds, and the Internet of Things (IoT) are considered new digital technologies. Similarly, White [9], state that cloud services are a significant technology development that adds value, especially to digital workplaces, providing location-independent access. Moreover, the research conducted by Bondar et al. [50] shows that traditional systems engineering and management approaches are inadequate and insufficient for a system of systems (SoS). The advances in network communication and human–machine interface demand reliable interoperability between component systems in a SoS environment because traditional functional decomposition is no longer valid. In complement, the data technologies (new database technologies to NoSQL, in-memory, distributed file systems, or blockchain; IT infrastructure can be local, on-premise, cloud, serverless or employing edge computing; data analytics—data mining and predictive analysis; big data techniques; artificial intelligence—rule-based systems, machine learning, neuronal networks and general artificial intelligence; and information security techniques) could be used to increase the potential of digital technologies in internationalization (Pousttchi et al. [51]).
The combination of capabilities developed by companies and capabilities provided by digital technologies allow companies to establish new internationalization strategies. The above-mentioned obstacles that limit the desired internationalization, as discussed by Westerman et al. [52], Bharadwaj et al. [53], Pagani [54], Kane et al. [55], Ross et al. [56] and Sebastian et al. [49]. Additionally, according to Knight [57], the effect of the globalization of companies performance through the impact of digitalization must be considered in international entrepreneurship, as shown in several studies (Bouwman et al. [12], Foroudi et al. [58]).
According to Hervé et al. [59], research has shown that companies need to adopt “an entrepreneurial orientation by being innovative, proactive, and risk-taking in their decisions” to make a difference in international markets to achieve a more successful internationalization. In parallel to the attitude described above, according to Nambisan [60] “technologies are creating more fluidity and nonlinearity in entrepreneurial processes and activities across time and space”. This is an area of intense activity as can be seen from the large number of studies carried out (Neubert [6], Hannibal and Knight [61], Ojala et al. [62], Stallkamp and Schotter [63], Watson IV et al. [64], Wittkop et al. [65] and Enjolras et al. [66]).
Alves [13] presents a biometric study on the impact of digitalization on SMEs international strategies, and one of the topics studied is the “Number of publications by geographical focus”. According to the same author, “Most papers focused on only one country. Only 27 publications focused on two or more countries—16.67%. In total, 55 countries were analyzed 347 times, in which 82% were European Countries, followed by the Asian continent with 13%, America with 4%, and, finally, Africa with 1%. The other continents were not part of our database’s publications (Alves [13], p. 41), and the same work showed only six papers in Portugal (Alves [13], p. 42). The primary geographic focus has been on European countries, emphasizing Italy and Germany. However, all papers are target SMEs.
The present study aims to find out the perception of the Portuguese entrepreneurs about the internationalization process of their companies. In other words, we want to know if these variables, whatever the sector, size, and rate of profits resulting from global growth, can result in competitive advantages for the internationalization of business.
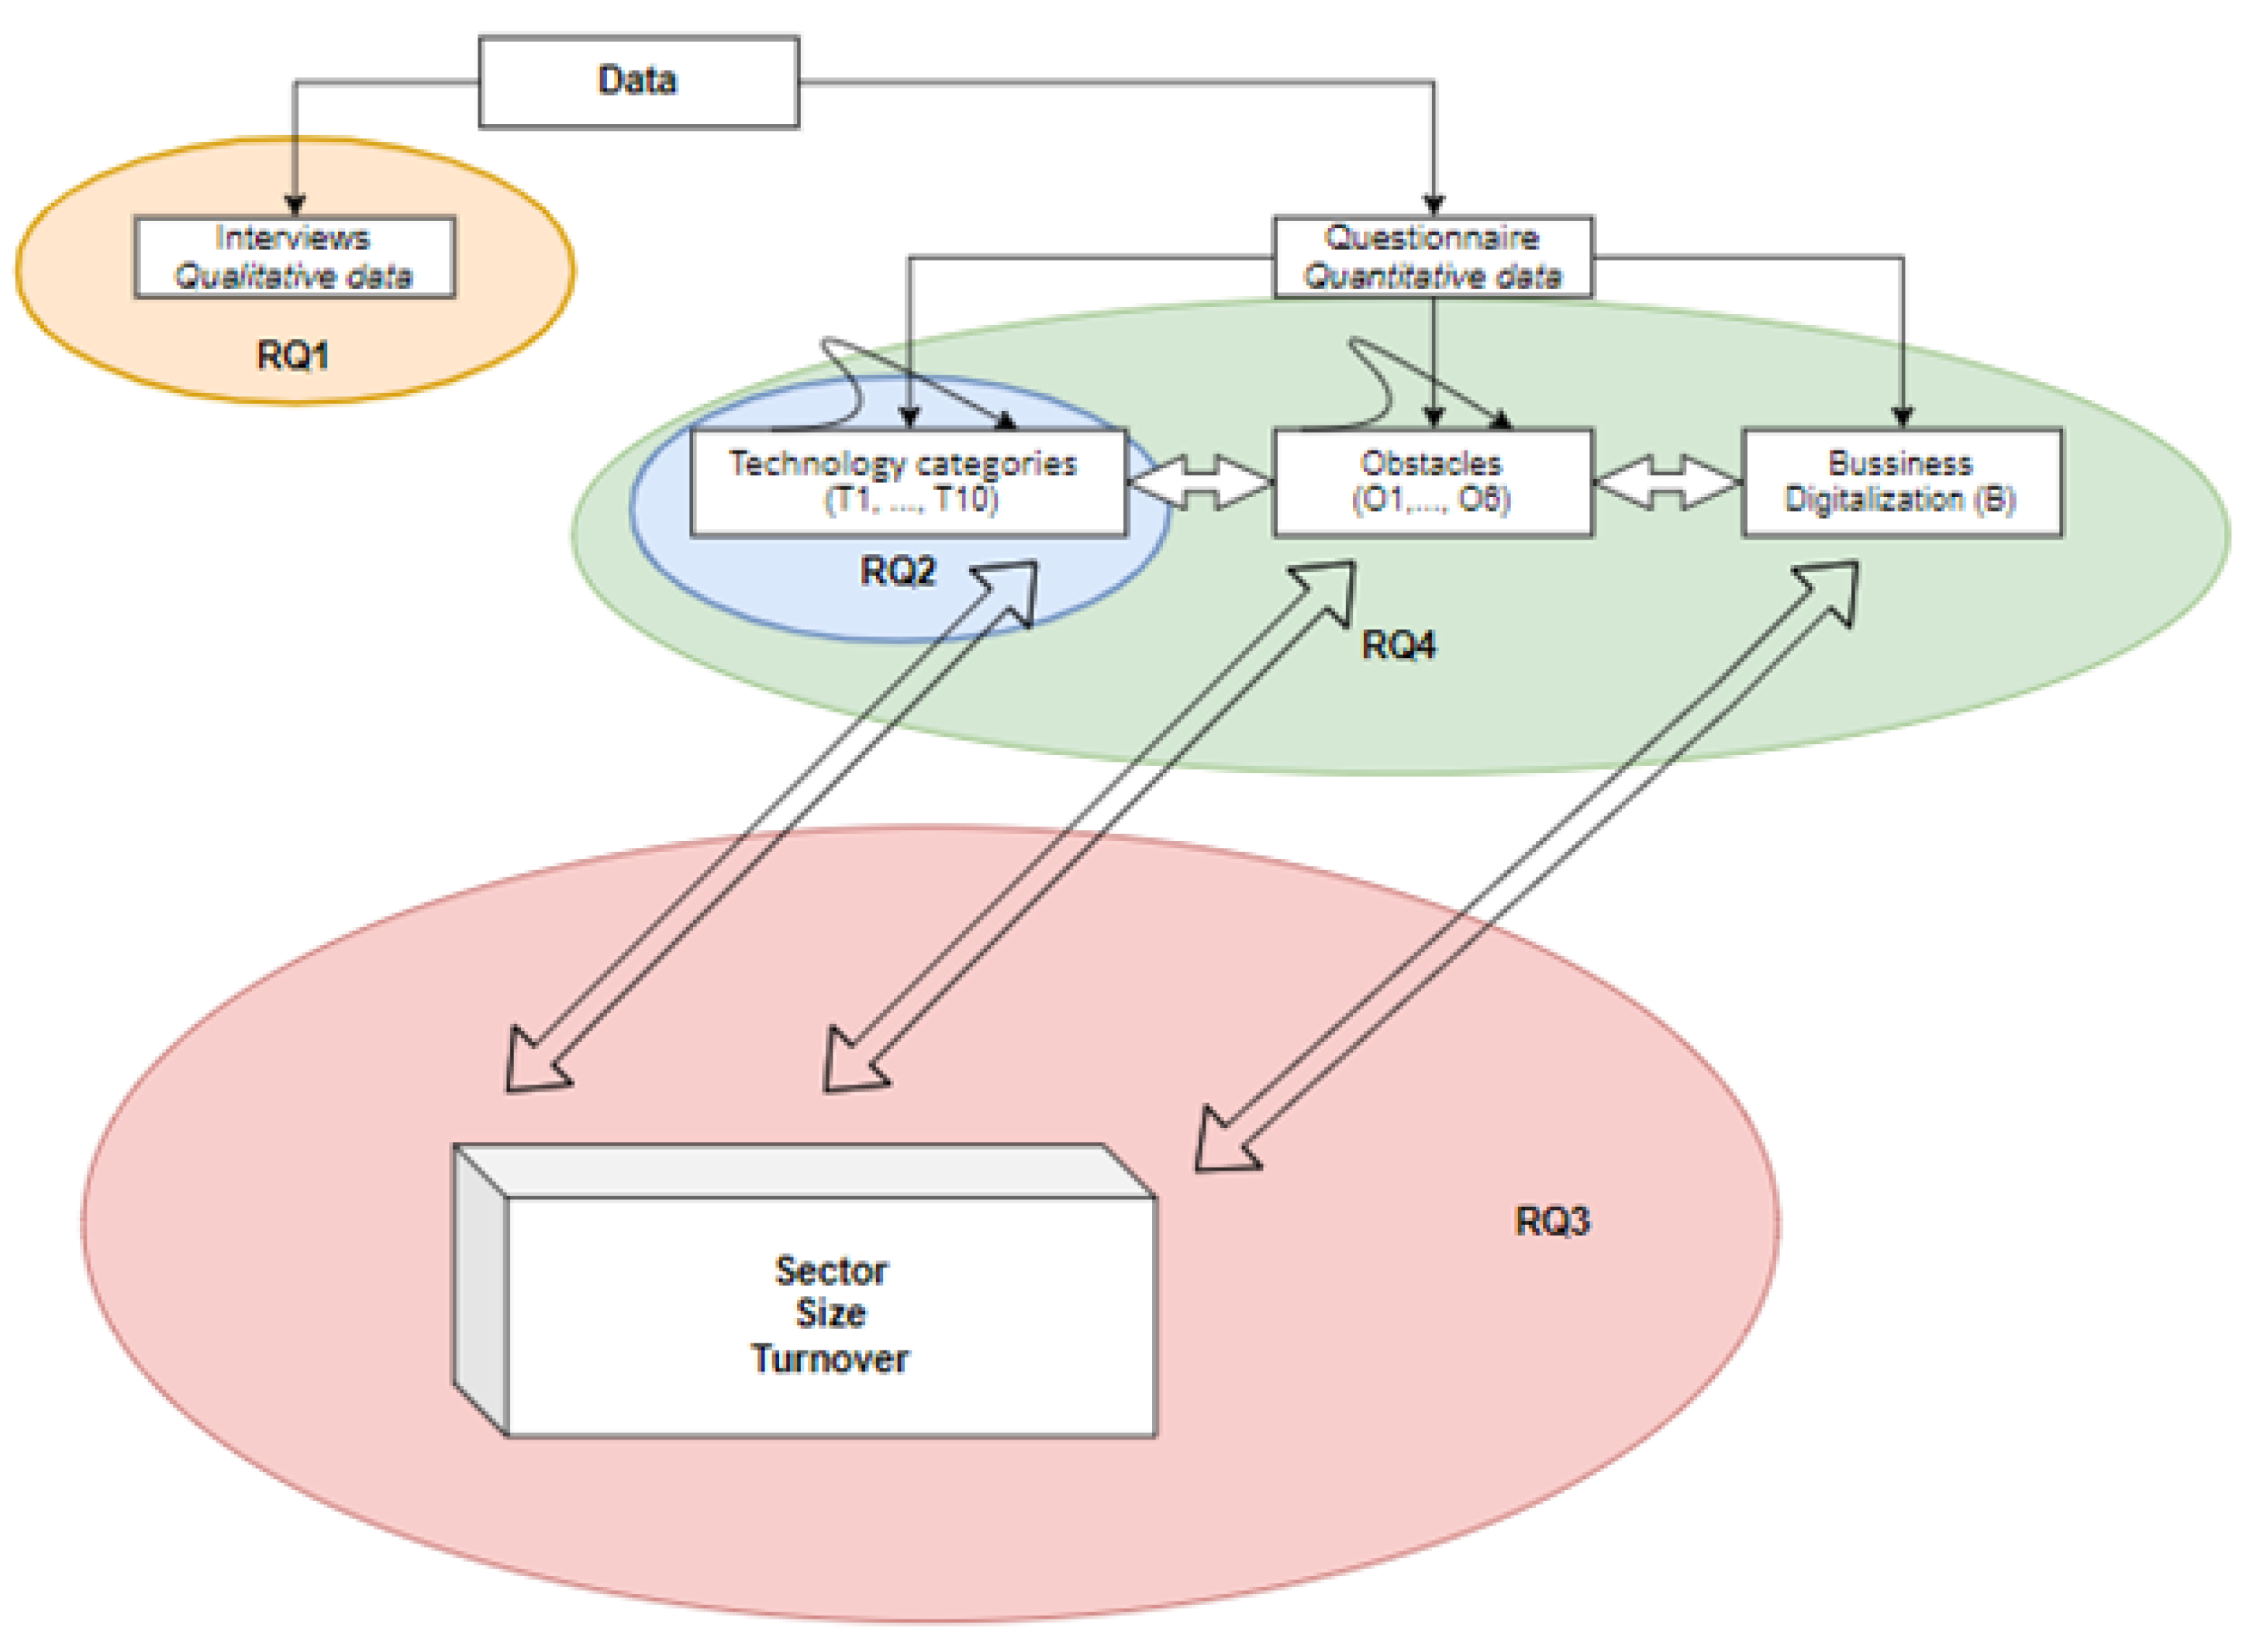
Although a lot of research has been done in the last decade (Alves [13]) in this field (internationalization, business, and digital transformation), some authors Verhoef et al. [67] have identified 21 open research questions. The four-research question is justified with all the research questions mentioned and the studies gap on Portuguese companies in general. We define the following research questions (see Figure 1) to assess the importance of using digital transformation in international business practice and strategy.
- RQ1: What is the perception of entrepreneurs concerning business digitalization?
- RQ2: What is the relevance attributed to the technology tools and obstacles? Is there a relationship between them in the business internationalization?
- RQ3: There are significant differences in the following:
- –
- Degrees of relevance attributed to the technology tools.
- –
- Degrees of relevance attributed to business digitalization.
- –
- The frequency with which the entrepreneurs face the obstacles, depending on the following:
- *
- Sector of activity?
- *
- Size of the company?
- *
- Percentage of business that resulted from internationalization?
- RQ4: What are the relationships and the interdependencies between the variables of this study?
4. Methodology
Qualitative and quantitative approaches supported the research at the methodological level. Some qualitative research works with a small number of non-representative cases Malhotra et al. [19] are used to understand concepts, thoughts or experiences. Quantitative research is expressed in numbers and graphs, and it is used to test or confirm theories and assumptions. Qualitative research provides unstructured data insights, whereas quantitative research seeks to quantify the data and typically applies statistical analysis. For the qualitative research, a structured interview guideline was developed with 22 questions. From these 22 questions, only the following was analyzed: “Digital transformation was important? How?”. This is because it is the only question covering digital transformation in international businesses. The interviews (obtained by convenience) were realized by managers and top-level executives from different activity sectors. These interviews collected the experiences of some Portuguese internationalized companies through twelve qualitative interviews. The aim of this qualitative study was to classify their emotions (very positive, positive, neutral, negative or very negative). To achieve this, the sentiment analysis (SA) [68,69] is a powerful text analysis tool that automatically mines unstructured data for opinion and emotion. According to Becker et al. [70], SA is simpler to execute and has been shown to deliver accurate and repeatable results. Regarding the quantitative research, a questionnaire was designed, composed of 33 questions, distributed by three dominant sectors of economic activity (see Table 1). These companies are located in Portugal and are internationalized. This questionnaire intends to study the enhancing factors of Portuguese business internationalization and assess the most frequent barriers and constraints in this process. All 8183 companies registered in the AICEP database of Portuguese internationalized companies received the questionnaire by e-mail. We collected 310 valid answers between May 2019 and May 2020. The questionnaire had an evaluation period, where some businesses experts assessed it and a pre-test was done. According to the two most widely adopted approaches (power analysis presented by Cohen [71] and rules of thumb described by Hair [72]) for estimating the sample size, it can be considered that the sample size used is sufficient for this study. For example, for the Spearman correlation coefficient, with a sample size of 310, we found a power value of 1. For the multivariate techniques, we used rules of thumb, and the sample size used verified the condition of being between 5 k and 10 k, where k is the number of variables.
In this work, the emphasis is business digitalization (BD). Thus, from the sample of 310 internationalized Portuguese companies, and 12 interviews to managers and top-level executives, in order to know if the integration of technological innovations in business practice can allow significant competitive advantages in internationalization, we determine which are the obstacles found for their implementation and which technologies are more relevant in this process. Table 1 presents the information of interest collected in the questionnaire to address digital transformation (DT).
Data collected were treated using the IBM SPSS Statistics 26.0, R software, and Gephi 0.9.2. software. The statistical analysis used to answer RQ1 was sentiment analysis. It is essential to classify entrepreneurs’ emotions (very positive, positive, neutral, negative or very negative) concerning business digitalization (business digitalization) from the sample constituted by the interviews. Next, a quantitative analysis to answer RQ2, RQ3 and RQ4 was performed.
Cronbach’s alpha reliability analysis was used to verify whether the variability of the answers effectively resulted from differences in entrepreneurs’ opinions to analyze the degree of relevance attributed to each technology tool and the correlation between them (RQ2). Descriptive measures were used to summarize information, hierarchical cluster analysis (Ward linkage) to achieve clusters of obstacles and Spearman’s correlation coefficient (this coefficient was used instead of Pearson’s correlation because our variables were measured on an ordinal scale) to find correlations between the variables.
RQ3 aims to find out if there are significant differences in the degrees of relevance attributed to the technological solutions, business digitalization and in the frequency with which the entrepreneurs face the obstacles, depending on the sector of activity, the size of the company and the percentage of business that resulted from internationalization (Turnover). The nonparametric Kruskal–Wallis test was used due to the ordinal nature of variables because the normality condition was not verified. However, where there are significant differences, the Kruskal–Wallis test does not indicate which sector(s)/size/turnover gives rise to these significant differences. To the multiple comparisons, Dunn’s test was performed, as well as Bonferroni error correction (given by adjusted significance) to compensate for the number of rejections of the hypothesis for being tested by mere chance-addition of type I error (Marôco [73]).
The Kruskal–Wallis test was performed, and an undirected graph was built to study the relationships and interdependencies between variables (RQ4). The Kruskal–Wallis test was used to assess whether turnover was influenced by the company’s characteristics (sector and company size). By another hand, to determine the relationships between ordinal variables by expressing their interdependencies, an undirected network was built based on Spearman rank-order correlations.
5. Results
5.1. Sentiment Analysis
In order to obtain information about the feeling of entrepreneurs concerning business digitalization (business digitalization), the first objective (RQ1) of this study was to classify their emotions (very positive, positive, neutral, negative or very negative) regarding the question, “Digital transformation (DT) was important? How?”, from the sample constituted by the 12 interviews. Sentiment analysis (Tian et al. [68]) is a powerful text analysis tool that automatically mines unstructured data for opinion and emotion. Harnessing the power of deep learning, sentiment analysis models can be trained to understand text beyond simple definitions. Once fully trained to teach themselves effectively, machine learning models can perform phenomenal feats. Text analysis, for example, uses natural language processing (NLP) to break down language and understand it much as a human would: subject, verb, object. The application of the method results in two numbers: magnitude and score. A magnitude is a number in the interval [0, [ which represents the absolute magnitude of sentiment regardless of score (general strength of the emotion), that is, the sentiment polarity (positive or negative). Each expression of emotion within the text contributes to the magnitude of the text. Score is the sentiment expressed from −1.0 (negative sentiment) to 1.0 (positive sentiment). There is available one online tool to perform this analysis (https://text2data.com/Demo, accessed on 1 July 2021).
Table 2 presents the results (magnitude and score) for the 12 interviews carried out, allowing to conclude that six of them reveal a very positive sentiment on the part of the entrepreneurs regarding the use of DT in internationalization, three reveal a neutral sentiment, and the remaining three a negative sentiment (very negative).
Additionally, to this evaluation (Table 3), the method detected the following keywords with a very positive score: able (score 0.742), enormous (score 0.737), and create (score 0.734). That is, the results show the importance of DT in internationalization essentially as “able to maintain closer relations with everyone”, “enormous impact as they allow to reach new markets with much less investment” and “create excellent facilities contact with customers and partners”. Some companies explicitly said (by analyzing the sentences) that they do not apply the DT in internationalization. These companies correspond in Table 2 to the negative scores.
5.2. Descriptive and Exploratory Analysis of the Companies
Let us now consider the sample of 310 internationalized Portuguese companies that will be the object of our subsequent study.
These companies come from different sectors of activity (three predominant sectors) and of different sizes. The sample structure includes 34.8% micro-companies, 40.0% small companies, 17.8% medium companies, and 7.4% large companies. Regarding the percentage of business resulting from internationalization (turnover), 65.8% of companies have a turnover value of less than 50.0%, and for the remaining companies, this value is at least 50.0%.
To answer RQ2, let us start by analyzing the degree of relevance attributed to each of the ten technological tools for the company’s internationalization process. In order to verify whether the variability of the answers effectively resulted from differences in entrepreneurs’ opinions, we applied a reliability analysis using Cronbach’s alpha for the ten mentioned technologies. The value obtained for this measure was 0.918, which is above the 0.6 recommended by Malhotra et al. [19], revealing high reliability in these measurements. With this result, it makes sense to present the descriptive results to have an initial view of the panorama of the degree of relevance attributed to the ten technological tools presented. Table 4 presents the descriptive measures, mean, median, standard deviation (SD), and coefficient of variation (CV).
Regarding the value obtained for the median (the most appropriate measure considering that data is an ordinal scale), we found that the tools considered most relevant are e-commerce (T1) and agile tools (T8), for which the median takes the value four (on a 5-point Likert scale) meaning that these entrepreneurs consider these two technological solutions as being “very relevant” to the internationalization process of their companies. We also found that, if we do not exclusively evaluate the median, put this together with the mean, in addition to T1 and T8, they remain the most relevant solutions by entrepreneurs; the BI (T9), Cloud (T2), and Big Data (T3) solutions are also considered relevant (values around 3) for them. The technological tool with the lowest degree of relevance (considered of little relevance) is 3D printing (T5).
In terms of variability in responses, through the coefficient of variation (CV), we conclude that the results show moderate to large dispersion, suggesting some lack of homogeneity in the responses obtained. However, the two technological solutions with the highest relevance (T1 and T8) have negligible heterogeneity.
It is also still important to highlight the significant results obtained for these technological categories, regarding the “term unknown” and “not applicable” options (Table 5).
Thus, we can conclude that big data (T3) is the least-known term for these entrepreneurs in the ten technologies presented. According to Forbes, 90% of the data were produced in the last two years (Marr [74]). Regarding the “not applicable” option, we can emphasize the relatively higher percentage (about 20%) of companies that choose this option in the 3D printing (T5), VR/AR (T6), and AI (T10) categories. Furthermore, we can also see that these are the technological categories that are the least relevant for the company’s internationalization process in the opinion of entrepreneurs. Given these results and to answer the second part of RQ2, our study is interested in assessing the possible existence of correlations between the degree of relevance attributed to the various technological solutions (see Figure 2), using Spearman’s correlation coefficient. The highest correlations existing between technological solutions and statistically significant at 1% are between VR/AR (T6) and 3D printing (T5); cloud solutions (T2) and big data (T3); agile tools (T8) and business intelligence (T9); and big data (T3) and IoT/sensors (T4). The proximity and dependence justify the existing correlation and interdependence between the various technologies used. The relationship between T6 and T5 is directly related to how the industry uses T6 to present new products and services and through T5 to develop innovative and personalized products. The relationship between T2 and T3 is explained by the high data generation and the theoretically infinite and distributed storage capacity. The direct connection between T8 and T9 is justified by the new business models and the way they use the combination of these tools to enable efficient and effective decision making. Finally, the relationship between T3 and T4 is directly related to the growing number of solutions provided by T4 and T3 for storing and processing large volumes of generated data.
Moreover, as expected, we also verified the existence of statistically significant positive correlations at 1% between the degree of relevance assigned to business digitalization (variable B) and each of the ten technologies. The greater the degree of relevance attributed to business digitalization (B), the greater the degree of relevance attributed to each technology.
Concerning the degree of relevance assigned to business digitalization (B), the mean obtained was 3.90, and the median 4, meaning that business digitalization is considered very relevant in business practice and the internationalization of business. Based on the frequency table of variable B (see Table A1), only 8.44% of the entrepreneurs consider the business digitalization as being nothing or little relevant, and, on the other hand, 68.8% of entrepreneurs consider it very or highly relevant. Finally, through the coefficient of variation value of (CV = 25.8%) indicates that the dispersion of the responses obtained for variable B is moderate.
According to Pereira et al. [75], the authors found that when comparing the degree of relevance attributed to business digitalization (B) before and during the COVID-19 period, it increased significantly: the median increased from 3 to 4 (on a 5-point Likert scale), which means that, as expected, business digitalization is even more valued today than before the COVID-19 pandemic by entrepreneurs.
The last question of interest in the questionnaire for this study concerns the frequency with which entrepreneurs face certain obstacles when using technological tools in the internationalization process of their companies. The reliability of the constructs, given by Cronbach’s alpha with the value of 0.845, was satisfied. Table 6 presents the descriptive measures mean, median, standard deviation (SD), and coefficient of variation (CV) for the six types of obstacles observed.
The values of the coefficients of variation show a moderate dispersion in the opinions of the entrepreneurs. Both the means and the medians show that the degree of the frequency with which they encountered obstacles did not exceed the value 3, which means they encountered these obstacles “sometimes”. The most frequently encountered obstacles were inadequate budgets (O4), employees without the necessary skills (O5), few technological partners (O3), and culture of organization (O1).
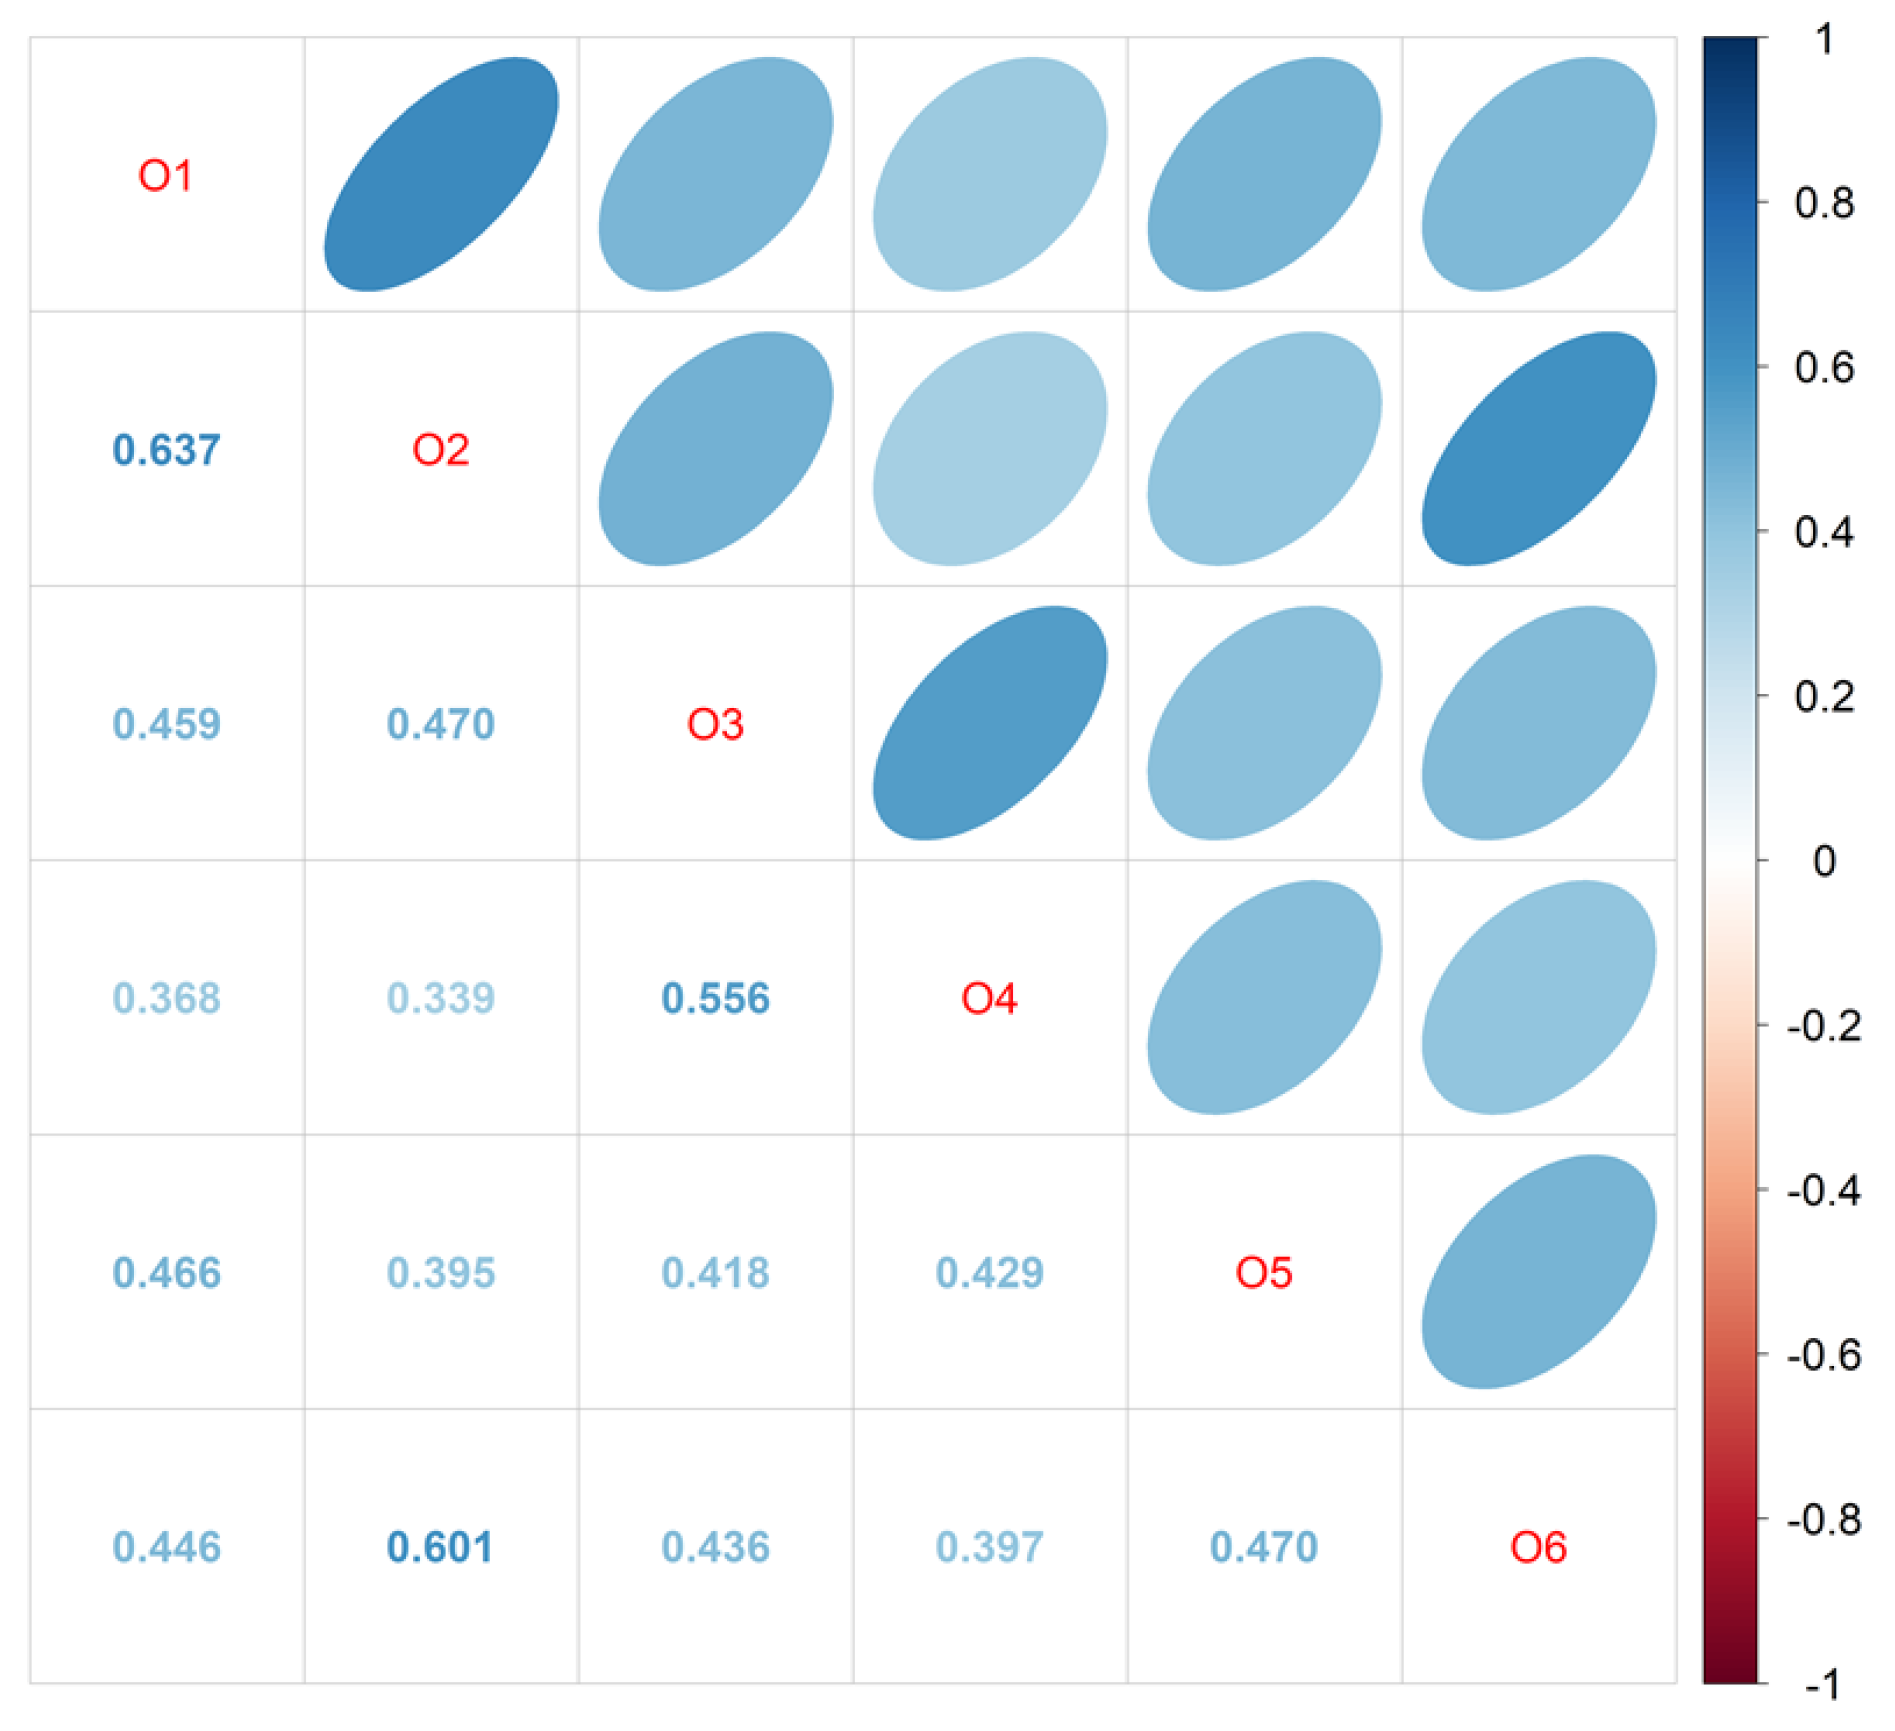
The Spearman’s correlation coefficients were applied between the various obstacles (see Figure 3) which led to the expected results—strong correlations between the following:
- Culture of organization (O1) and resistance of managers (O2)—r = 0.64
- Confused leadership (O6) and resistance of managers (O2)—r = 0.60
- Few technological partners (O3) and inadequate budgets (O4)—r = 0.56
The high correlations between the various obstacles (O1 and O2; O6 and O2; and O3 and O4) have to do with most of the Portuguese business fabric. The organizational culture (O1) of the Portuguese industry and commerce is directly based on family businesses that are averse to changing to new management paradigms. Consequently, conflicts are very high. In the case of the correlation between O6 and O2, it has to do with the reduced educational qualifications that the leaders and managers of most Portuguese companies have, which means that the leadership is not able to have sufficient insight to absorb and include in the companies the changes that the world is going through. As for the last correlation, the pandemic has aggravated this problem; with reduced or inadequate budgets, the technological issue is decreasing, even in association with partners. Only companies with a vision of the future, strong leadership and openness to change could respond to the difficulties imposed by the COVID-19 pandemic. An example of the last statement is that the textile sector, which produces clothing in Portugal (adult or child), realized that to survive, it had to produce surgical masks, having to technologically adapt its entire production line and even its business model.
Given that the item under analysis is obstacles (which can hypothetically give rise to the non-internationalization of the companies) and not incentives to internationalization, it makes sense to verify whether these form groups among themselves in terms of similarities in the opinions expressed by entrepreneurs.
For this, we apply hierarchical cluster analysis with Ward linkage. We apply Ward linkage because it is the method (among all those implemented in IBM SPSS) that gives rise to the most homogeneous clusters and is better separated from the other clusters (Marôco [73]). Figure 4 presents a dendrogram, which is a graphical representation of the clusters.
According to the dendrogram, we can consider two clusters of obstacles. The first cluster integrates the culture of the organization (O1), the resistance to changes (O2), and confused leadership (O6), and a second cluster that integrates employees without the necessary skills (O5), few technological partners (O3), and inadequate budgets (O4). In the first cluster, the obstacles (O1) and (O2) are very close (strong correlation), and (O6) is associated with them at a slightly greater distance, forming this cluster. In the same way, in the second cluster, the obstacles (O3) and (O4) are very close, and (O5) is associated with them at a slightly greater distance. This result is in agreement with the correlations found above.
5.3. Nonparametric Hypothesis Tests by Sector, Company Size, and Turnover
To answer RQ3, we assess if there are significant differences in the degrees of relevance attributed to (i) the ten technological solutions; (ii) business digitalization; and (iii) in the frequency with which the entrepreneurs face the six obstacles mentioned, depending on the sector of activity, the size of the company and the percentage of business that resulted from internationalization (turnover), respectively.
5.3.1. Analysis by Sector
Regarding the sector in which the companies operate, the majority (256 out of the 310 companies in the sample, corresponding to 82.6% of the total) belongs to one of the three sectors: (A) manufacturing industries (162); (B) wholesale and retail trade, car and motorcycle repair (66); and (C) consulting, scientific, technical and similar activities (28). For this reason, the focus of our study is on the variable sector of activity recorded in these three dominant categories. Due to the ordinal nature of variables, the normality condition is not verified, and the Kruskal–Wallis non-parametric test was applied to detect significant differences. Analyzing the results of the Kruskal–Wallis test (Table 7), it is possible to conclude that, for a significance level of 5%, there are no statistically significant differences between the degree of relevance attributed to these technologies within the company’s activity sectors (all p-values > 0.05).
Using the same procedure to assess whether there are significant differences between the degree of relevance attributed to business digitalization (variable B) according to the sector, we conclude that there are no differences at a level of significance of 5% (p-value = 0.83 > 0.05). Therefore, according to Section 5.2, the companies consider the digitalization of businesses (B) to be very relevant in business practice and the internationalization of business, regardless of their sector of activity.
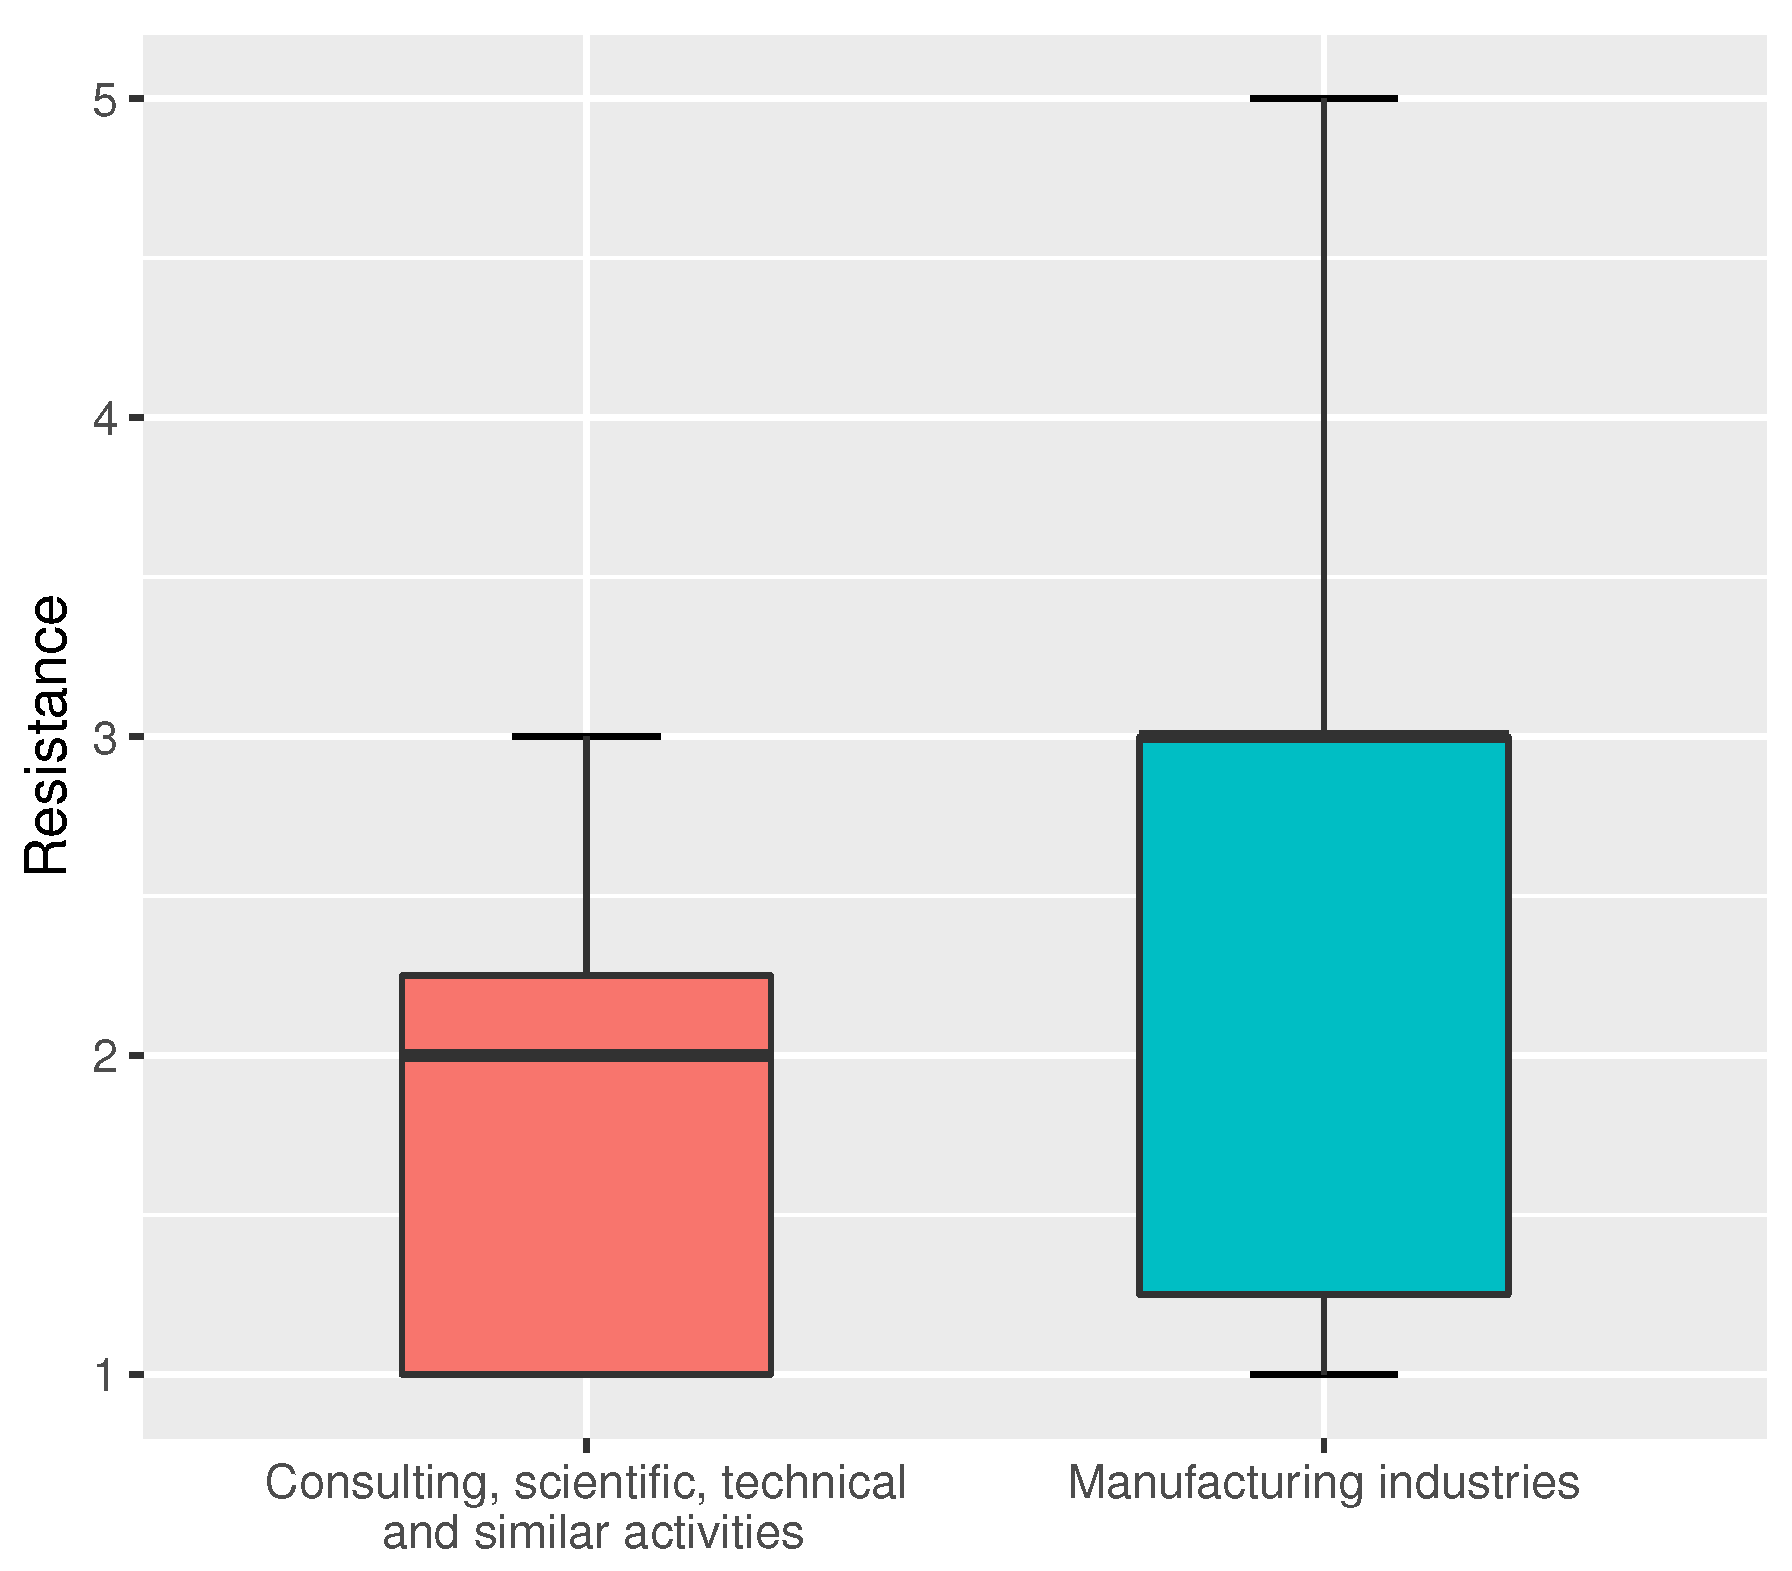
According to the objective proposed, the Kruskal–Wallis test was used to assess differences in the frequency with which entrepreneurs face the six obstacles by sector. Table 8 shows the results of the Kruskal–Wallis test for obstacles by sector. It is possible to conclude that, for a significance level of 5%, there are statistically significant differences between the degree of frequency attributed to the obstacle “Resistance” (O2) by sector (p-value = 0.01).
However, the Kruskal–Wallis test does not indicate which sector(s) of the company give rise to these significant differences. Thus, in order to proceed to the multiple comparisons, Dunn’s test was performed as well as the Bonferroni error correction (given by adjusted significance) to compensate for the number of rejections of the hypothesis for being tested by mere chance addition of type I error (Marôco [73]).
Analyzing the output of the multiple comparisons (Table 9), it is possible to conclude that for a significance level of 5%, the statistically significant differences in the degrees of frequency assigned to the obstacle “Resistance of managers” occur between the sectors “Manufacturing industries” (A), and “Consulting, scientific, technical and similar activities” (C) (adjusted p-value = 0.00 < 0.05). Moreover, entrepreneurs in the “Manufacturing industries” sector attribute a greater degree of resistance from managers when using technological solutions for internationalization than those in the "Consulting, scientific, technical and similar activities” sector (Figure 5).
5.3.2. Analysis by the Size of the Companies
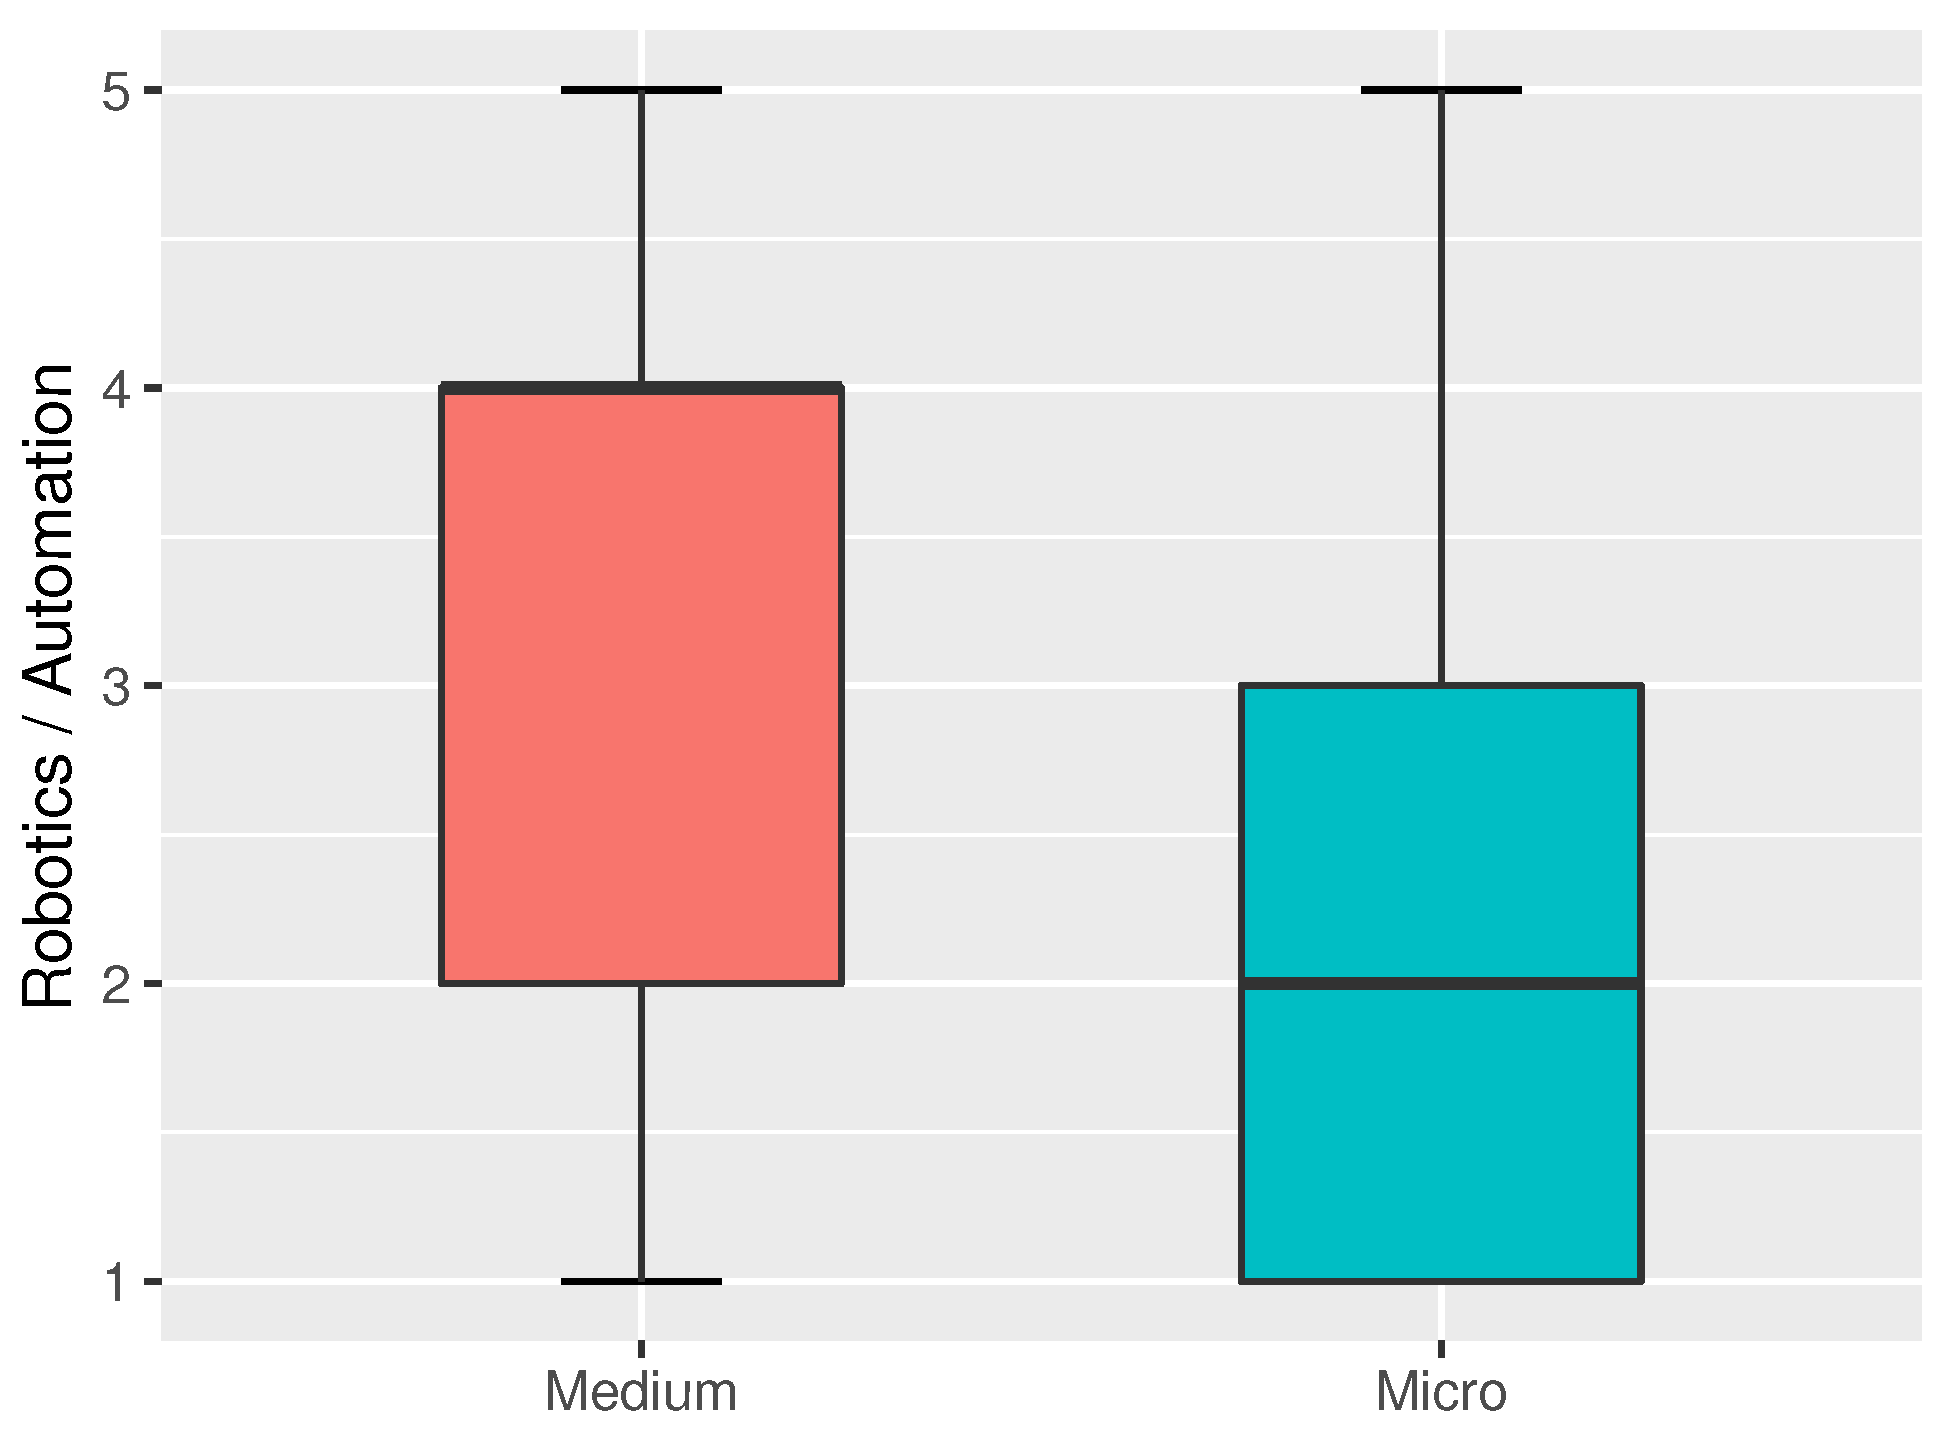
The next step is to determine if there are significant differences in the degrees of relevance attributed to (i) the ten technological solutions, in the degree of relevance attributed to (ii) business digitalization, and (iii) in the degree of the frequency with which the entrepreneurs face the six obstacles, depending on the size of the company: micro, small, medium or large. Firstly, observing the results of the Kruskal–Wallis test (Table 10), regarding the technological tools by company size, we conclude that there are only statistically significant differences at a significance level of 5%, in the “Robotics/Automation” solution depending on the size of the company (p-value = 0.03 < 0.05).
As suggested in Section 5.3.1, we applied multiple comparisons with Dunn’s test (Table 11). The results let us conclude that the differences statistically observed in the degree of relevance attributed to the technological solution “Robotics/Automation” occur between the micro and medium companies (adjusted p-value = 0.02 < 0.05): medium companies attribute a greater degree of relevance to the “Robotics/Automation" technological solution than micro companies (Figure 6).
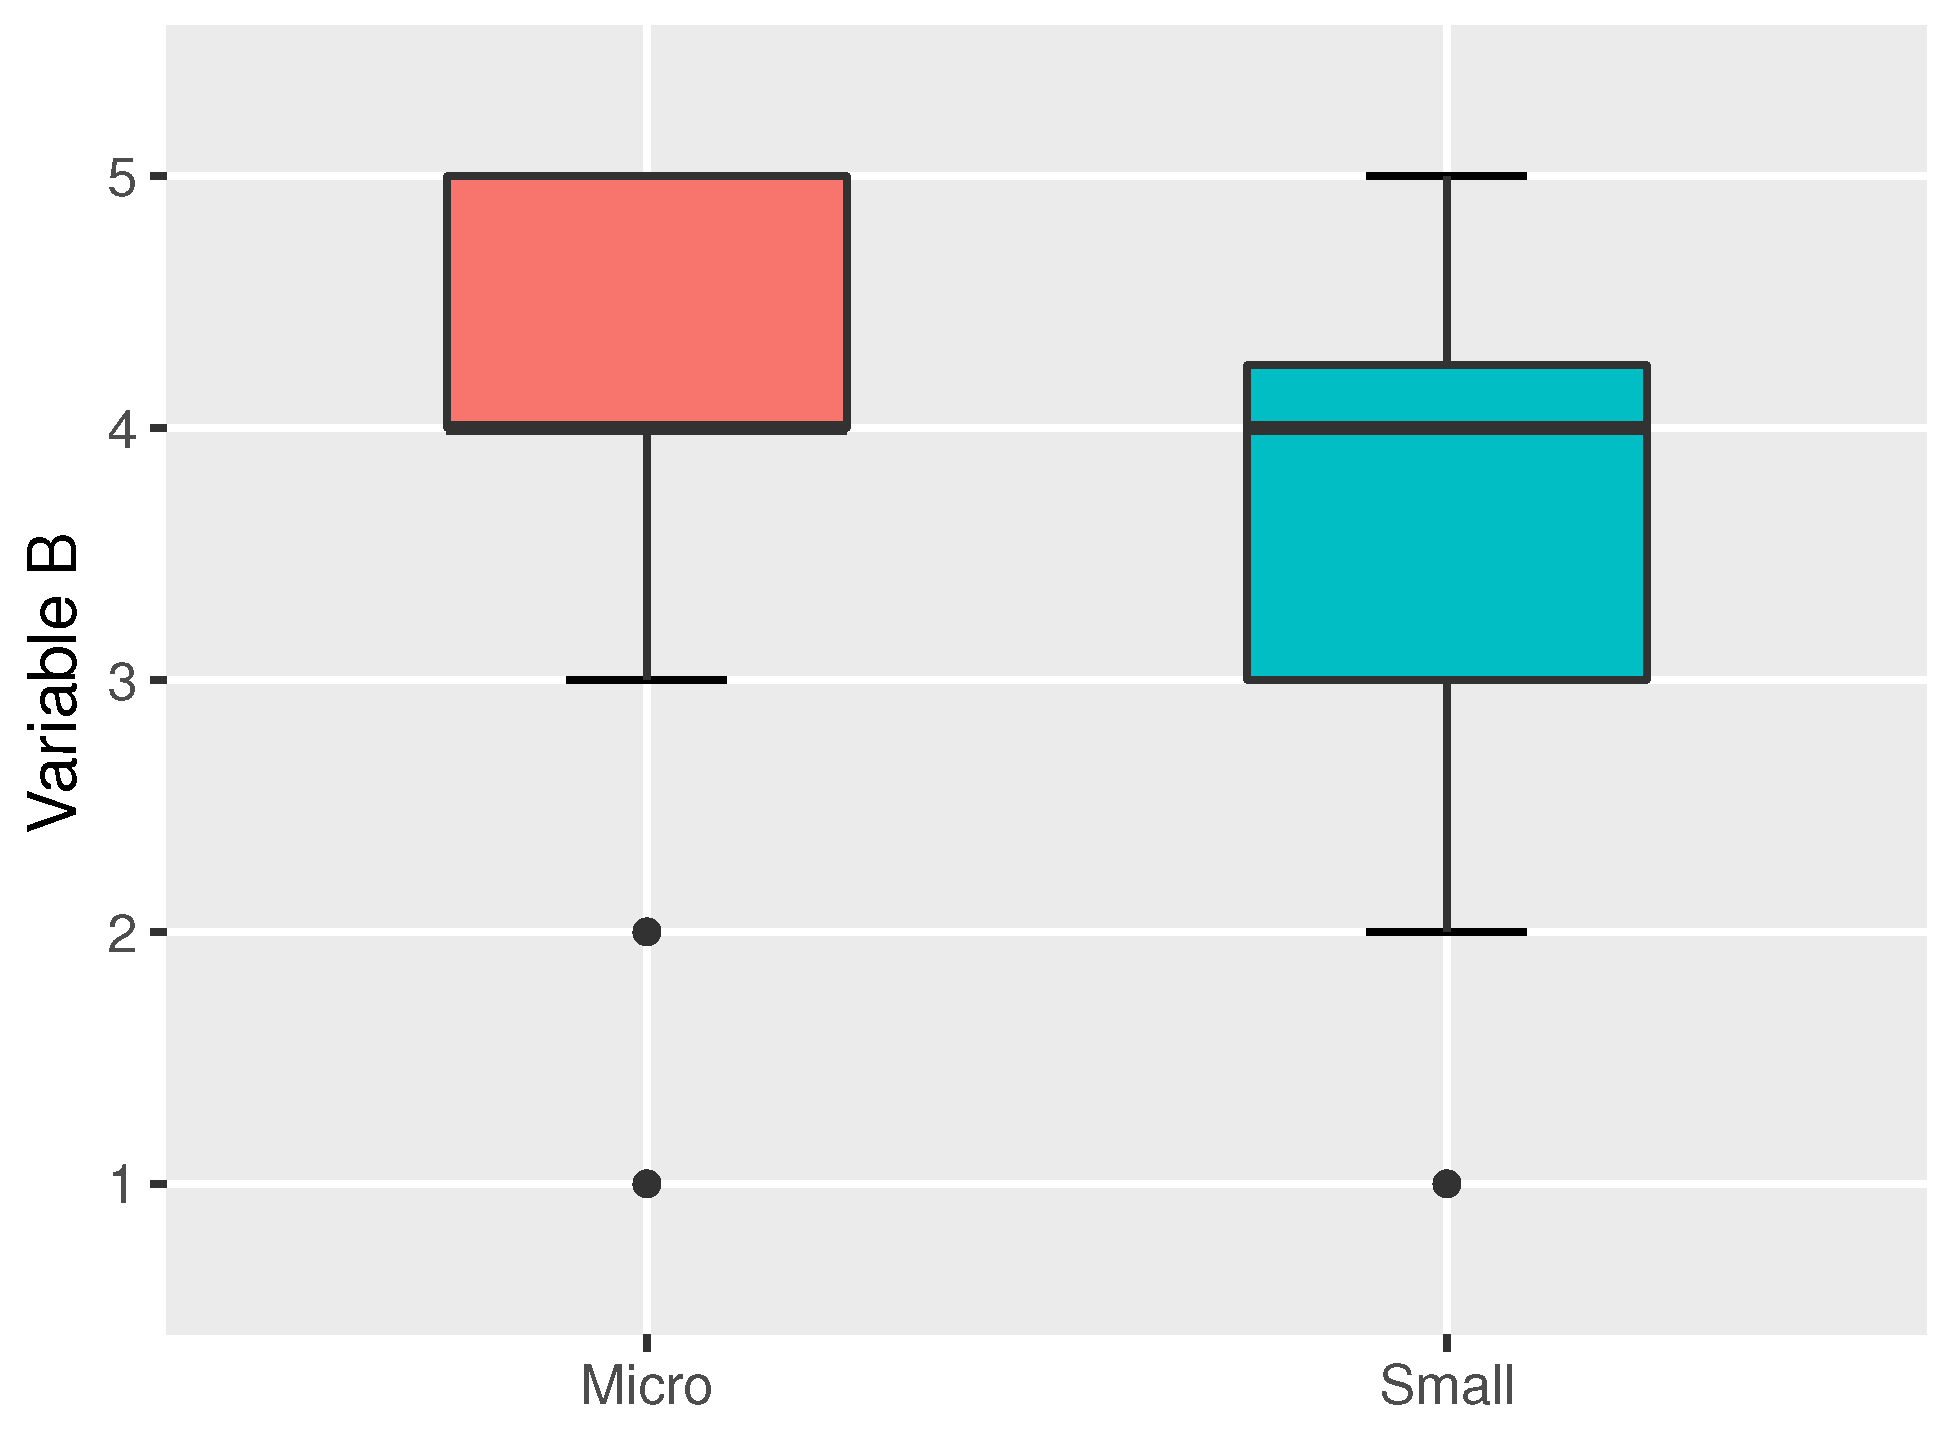
Next, to verify whether there are statistically significant differences in the degree of relevance attributed to business digitalization (variable B) according to the company’s size, we applied the Kruskal–Wallis test. The result obtained allows us to conclude that there are also significant differences for variable B for a significance level of 5%, depending on this characteristic of the company (p-value = 0.02 < 0.05). These differences occur between small and micro companies, as seen from Dunn’s multiple comparisons (Table 12).
Entrepreneurs from micro companies attribute a greater degree of relevance to the digitalization of businesses (B) within the scope of the internationalization strategy than those from small businesses (see Figure 7). Despite the high degree of relevance (very relevant/extremely relevant) attributed by most micro-companies entrepreneurs to business digitalization, the boxplot identifies two pairs of outliers corresponding to six entrepreneurs (moderate outliers) for whom this relevance is little or none. In small firms, the marked outlier corresponds only to one entrepreneur.
Finally, Table 13 allows us to conclude that there are no statistically significant differences at the level of 5%, in the degree of frequency attributed by entrepreneurs regarding the obstacles they encounter when they use technological tools in the internationalization of their companies, whatever the size of the company (all p-values are greater than 0.05).
5.3.3. Analysis by Turnover
In this section, we evaluate whether there are significant differences in the degrees of relevance attributed to (i) the ten technological solutions, in the degree of relevance attributed to (ii) business digitalization and (iii) in the degree of the frequency with which the entrepreneurs face the six obstacles, according to the percentage of business in the company resulting from the internationalization (turnover).
So we start by evaluating whether the degree of relevance attributed to the ten technological categories is different depending on whether the turnover is less than 50% or greater than or equal to 50%. According to the results presented in Table 14 resulting from the application of the Mann–Whitney test, we can conclude that there are significant differences, at a level of significance of 10%, concerning the BI solution (p-value = 0.06 < 0.10).
It appears that the entrepreneurs who indicated the highest percentage of business resulting from internationalization are the ones who have the highest degree of relevance to the BI tool (Table 15): 57.3% of those with more significant turnover (>=50.0%) consider BI to be very or extremely relevant and 79.3% consider it at least relevant (against 69.3% that presents turnover < 50.0%). Moreover, 30.8% of the entrepreneurs that had a turnover < 50.0% consider BI not or little relevant (against 20.7% from those who had turnover ≥ 50.0%).
Next, we assess whether the degree of relevance attributed to the digitalization of businesses by entrepreneurs is different depending on the turnover. The Mann–Whitney test (Table 16) lets us conclude that for a significance level of 5%, there are statistically significant differences between the degree of relevance attributed to business digitalization (B) and turnover (p-value = 0.04 < 0.05). Because of this result, we built a crosstable between the two variables, which allowed us to conclude that the greater the degree of relevance (B) attributed by an entrepreneur to business digitalization, the higher the percentage of business resulting from internationalization (turnover).
Regarding the percentage of business of the company that resulted from internationalization (turnover), we again applied the Mann–Whitney test to assess whether there are differences in the degree of frequency attributed by entrepreneurs regarding the obstacles they encounter when using technological tools in the internationalization of their companies. Table 17 lets us conclude that there are no significant differences between the obstacles in the use of the technological tools and turnover (all p-values > 0.05); that is, the obstacles encountered in the internationalization process did not influence the percentage of business resulting from it.
5.4. Multivariate Analysis
This section studies the relationships and interdependencies between the variables (RQ4) using the Kruskal–Wallis nonparametric test and an undirected network of correlations.
The previous sections found that the percentage of business resulting from internationalization (turnover) is only affected by the degree of relevance attributed to business digitalization (variable B) and BI technology. For this reason, it seemed to us of interest to assess whether turnover was influenced by the characteristics of the business (sector and company size). Analyzing turnover, by sector and company size, with the Kruskal–Wallis test, we conclude that there are no statistical differences (p-value = 0.844 and p-value = 0.337, respectively).
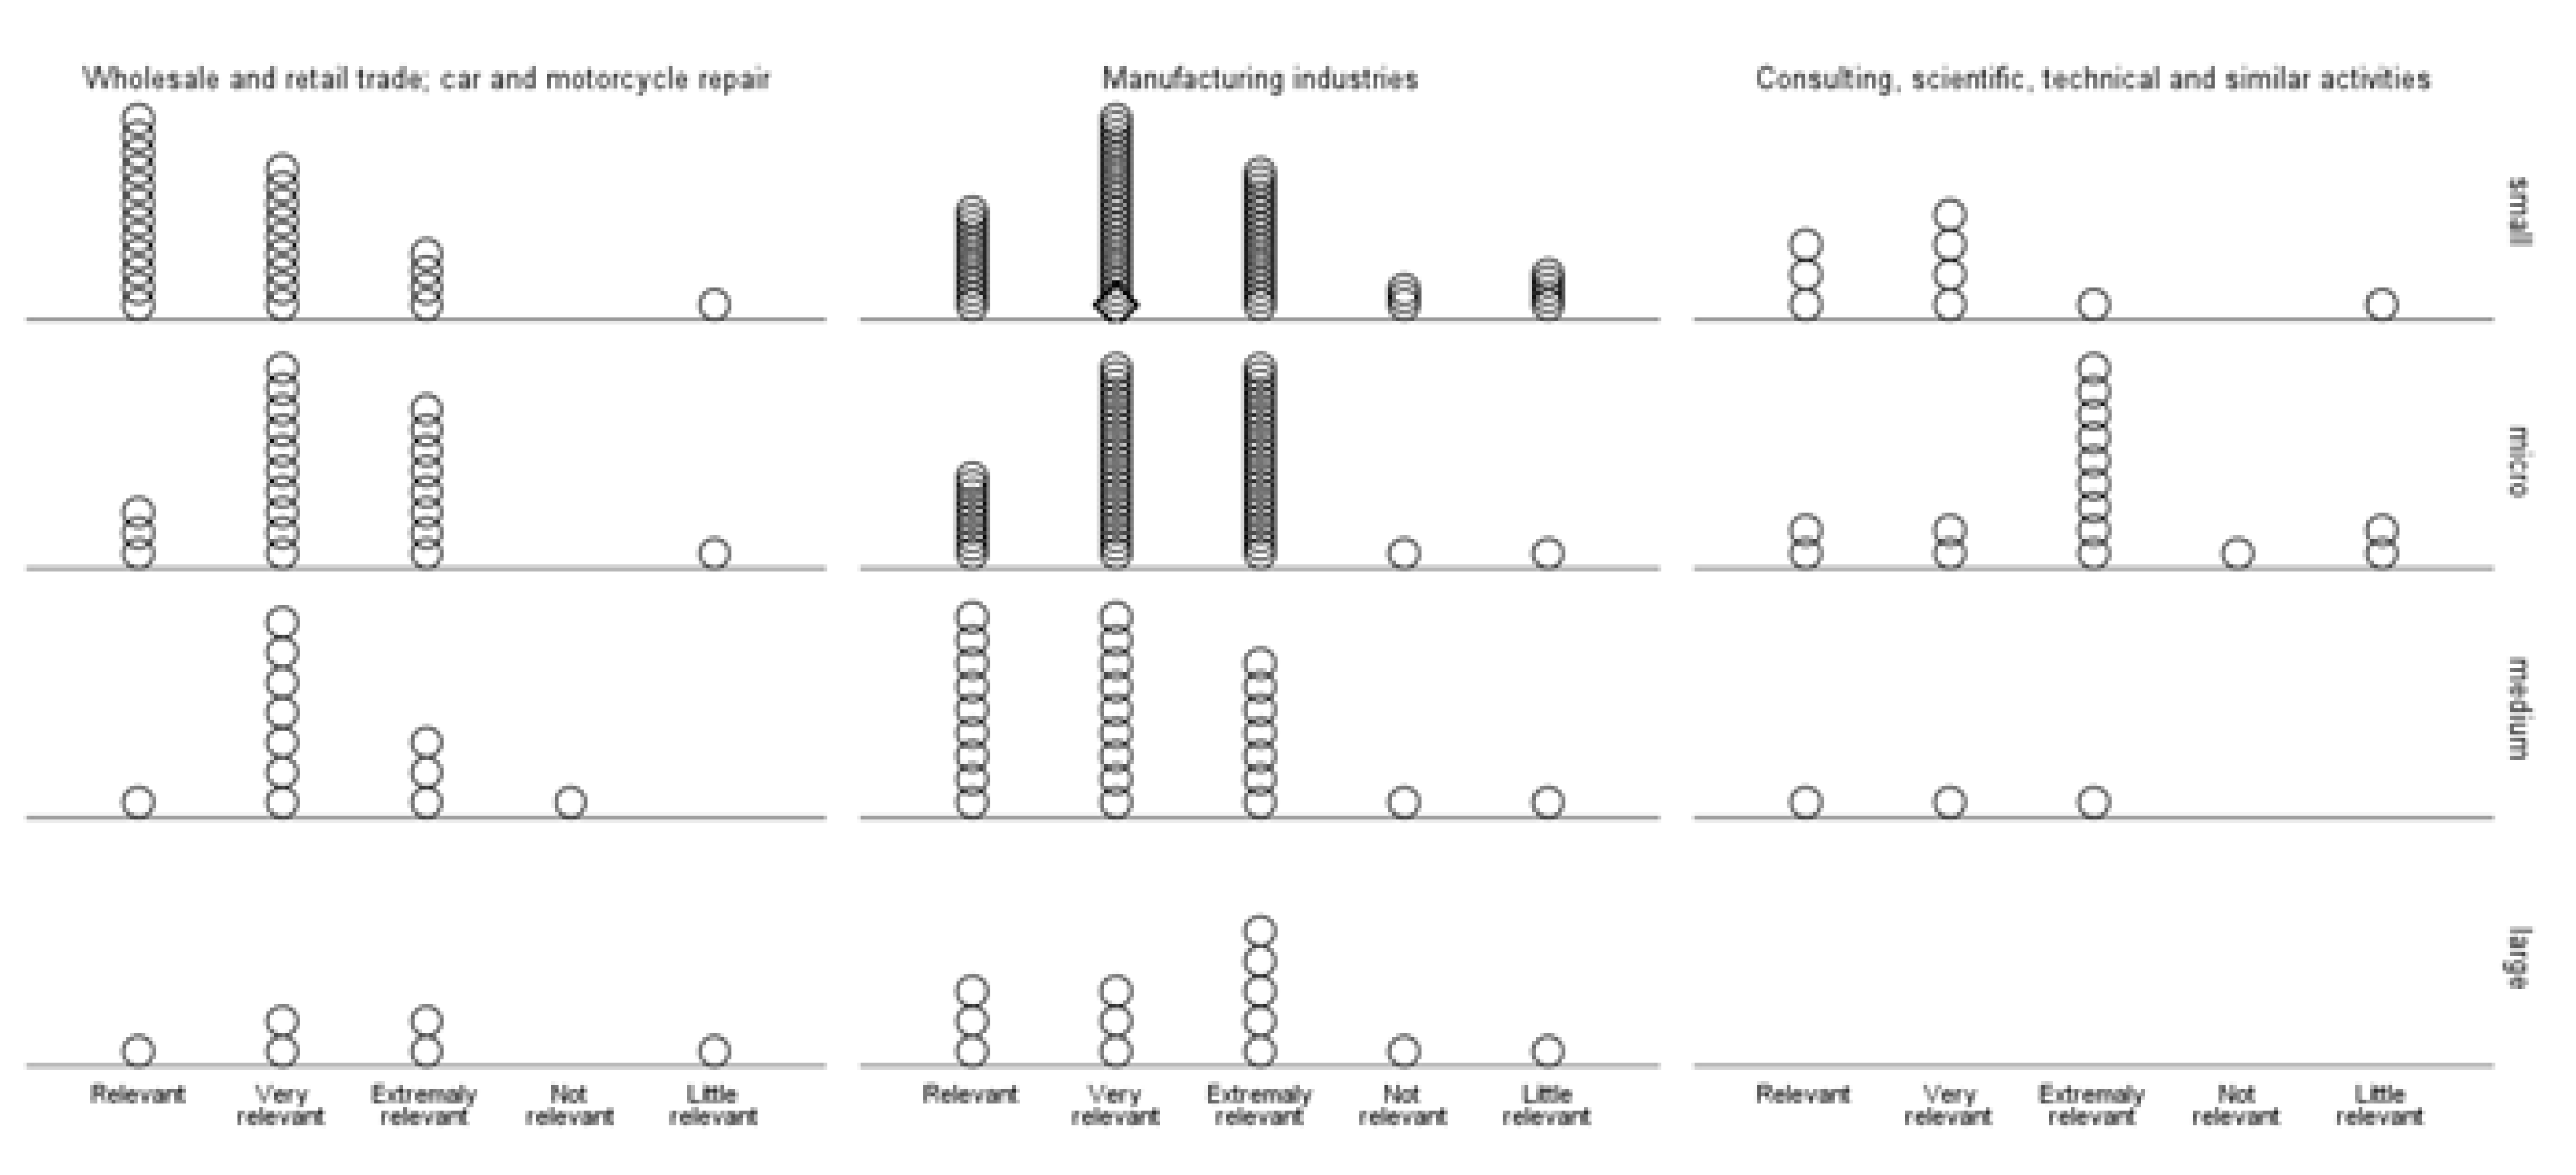
After careful analysis of the degrees of relevance attributed to business digitalization (variable B) and the technological tools for internationalization, as well as the degree of the frequency with which obstacles occurred when using these tools, we decided to assess the impact of variable B according to the characteristics of the companies (sector and size) through a graphical representation of the three referred variables (Figure 8).
Analyzing the representation obtained (Figure 8), we can conclude that, whatever the sector of economic activity and company size, we find that the degree of relevance that entrepreneurs assigned to business digitalization (B) are for most of them at least relevant, these opinions being balanced for each sector taking into account the number of companies of each size. Regardless of the sector, they belong to micro companies attributed a greater degree of relevance to variable B than small companies.
Finally, we determine the relationships between the initial set of 17 ordinal variables (ten technological categories, six obstacles and variable B) by expressing their interdependencies. To this end, we built an undirected network of correlations based on Spearman rank-order correlations (Figure 9).
The undirected network of correlations built is composed of 17 nodes (variables) and 136 edges (correlations). The nodes size is ranked by total degree, i.e., the bigger the node (variable), the higher number of correlations with other variables (nodes). The edges thickness is ranked and labeled with the correlation coefficient (r ) (see Table A2).
Observing Figure 9, the existence of two clusters is evident: one consisting of obstacles (O1–O6) and the other by technological solutions (T1–T10) and variable B. As expected by previous results, we verified that this association is stronger between technologies (T1–T10) than between obstacles (O1–O6). It is also important to mention that, as for in the first cluster, variable B (degree of business digitalization) has a moderate association with T1, T2, and T3 (edges thicker). The thinner edges correspond to the associations between the variables of the two clusters; that is, the degree of relevance attributed to technological solutions by entrepreneurs is not associated with (it is independent of) the degree of frequency attributed by them regarding the obstacles found in the use of these tools during the internationalization process.
6. Conclusions
The importance of digital transformation has been increasing across the last years (Alves [13]). The study focuses on integrating technological tools in international business practice and strategies and the obstacles encountered with introducing these new technologies. In the project within which this study was conducted, the goal was to develop a theoretical model that measures the enhancing factors of Portuguese business internationalization and to assess the most frequent barriers and constraints in this process. This study contributes to creating guidelines (the set of digital tools and the avoidable obstacles) for Portuguese companies interested in business internationalization. A posteriori, these guidelines could be integrated into the abroad companies interested in this process.
Although the qualitative analysis, i.e., the sentiment analysis, realized for the first research question, is preliminary, it shows that DT is an enhancer. DT helps to maintain closer relations, reaches new markets with much less investment, and creates excellent facilities in contact with customers and partners.
For the second research question, the results obtained show that the tools e-commerce (T1), agile tools (T8), BI (T9), cloud solutions (T2), and big data (T3) have the same importance given in the literature by Strange and Zucchella [5], Neubert [6] and Coviello et al. [7]. However, the 3D printing (T5) tool contradicts the international literature of Kraus et al. [2]. Perhaps one reason for this unexpected result is that the sectors of activities that responded to the survey are outside the industrial area, hence the difference in results.
It is also possible to conclude that the second research question is proven concerning business digitalization, being considered very relevant in business practice and the internationalization of business, as indicated by Schwertner [28].
Of the issues studied, the one in the second research question has to do with the obstacles (O1–O6) found in the use of technological tools (T1–T10) when implemented by international companies. The results obtained reveal that, in line with Singh [76], Mergel et al. [77] and Bucy et al. [78] (problems with the introduction of digital transformation in companies), the degree of frequency of the obstacles encountered indicates the frequency entrepreneurship faced is relevant, that is, sometimes they face these pointed obstacles.
Regarding RQ3, the obstacles that we observed with a significance level of 5%, there is a statistically significant difference in the degree of frequency assigned to the obstacle “Resistance of managers” between the sectors. Entrepreneurs of “manufacturing industries” sector attaches a higher degree of frequency of resistance of the managers than the sector “consulting, scientific, technical and similar activities”. In addition, regarding technological tools by company size, we only found differences for a significance level of 5% in robotics/automation: medium companies attribute a greater degree of relevance to robotics/automation than micro companies. When the study has to do with the degree of relevance assigned to business digitalization between small and micro companies, there are statistically significant differences (micro companies attribute a greater degree). The greater the degree of relevance (B) attributed by entrepreneurs to business digitalization, the higher the percentage of business resulting from internationalization (turnover). The entrepreneurs who indicated the highest percentage of business resulting from internationalization are the ones who have the highest degree of relevance to the BI tool.
Regarding RQ4, whatever the sector of economic activity and company size, we found that the degree of relevance that entrepreneurs assigned to business digitalization (B) is for most of them at least relevant, these opinions being balanced for each sector taking into account the number of companies of each size. We also observed that micro companies, regardless of the sector they belong to, attributed a greater degree of relevance to variable B than did small companies. The undirected network of correlations shows us the evident existence of two clusters: cluster of obstacles and cluster of technologies tools and variable degree of relevance attributed to business digitalization (B). It was found that this association is stronger among technologies than among obstacles. It is also important to mention that, as for in the first cluster, variable B has a moderate association with e-commerce, cloud solutions and big data. Finally, the degree of relevance attributed to technological solutions by entrepreneurs is not associated with (it is independent of) the degree of frequency attributed by them regarding the obstacles found in the use of these tools during the internationalization process.
This project was intended to develop a framework based on an empirical study that will be available, planned for Portuguese and European companies to facilitate business internationalization. This framework will be built upon some of the guidelines identified in this study and will help companies to avoid some obstacles.
The research limitations are related to the reduced number of conducted interviews. The analysis of these interviews allowed to infer that managers are not aware of the concept of digital transformation; rather, they are only aware of the isolated use of digital technologies in the internationalization process of the business. This limitation can bias, in some way, the qualitative results obtained. In addition to these limitations, the number of responses to the questionnaire by sector was also not homogeneous. Furthermore, it is necessary to collect further information about other sectors and define orientation guidelines.
This study contributes to the advancement of knowledge (i) theoretically, with the identification of the obstacles and possible guidelines—the most important included in the DT domain; and (ii) practically, with the framework.
For future work, it is intended to repeat the post-pandemic study to analyze the evolution of internationalization interconnected with digital transformation, the associated tools and whether the obstacles found in the present study remain or whether others emerge.
Author Contributions
Conceptualization, C.S.P., N.D., B.V. and F.M.; methodology C.S.P., N.D., B.V. and F.M.; validation, C.S.P., N.D., B.V. and F.M.; formal analysis, C.S.P., N.D., B.V. and F.M.; data curation, C.S.P., N.D., B.V. and F.M.; writing—original draft preparation, C.S.P., N.D., B.V. and F.M.; writing—review and editing, C.S.P., N.D., B.V. and F.M.; supervision, C.S.P., N.D., B.V. and F.M.; project administration, C.S.P., N.D., B.V. and F.M. All authors have read and agreed to the published version of the manuscript.
Funding
This work was supported by the FEDER funds from COMPETE 2020 and Portuguese funds—PORTUGAL 2020. Project IEcPBI—Interactive Ecosystem for Portuguese Business Internationalization—POCI-01-0145-FEDER-032139.
Institutional Review Board Statement
Not applicable.
Informed Consent Statement
Not applicable.
Data Availability Statement
Data are contained within the paper.
Conflicts of Interest
The authors declare no conflict of interest.
Abbreviations
The following abbreviations are used in this manuscript:
| SME | small and medium enterprises |
| DT | digital transformation |
| 3D printing | three-dimensional printing |
| IoT | internet of things |
| IT | information technology |
| 3G | 3th generation |
| 4G | 4th generation |
| 5G | 5th generation |
| AI | artificial intelligence |
| ML | machine learning |
| DL | deep learning |
| VR | virtual reality |
| AR | augmented reality |
| IaaS | infrastructure as a service |
| PaaS | platform as a service |
| SaaS | software as a service |
| NLP | natural language processing |
| SD | standard deviation |
| CV | coefficient of variation |
| NA | not applicable |
| BD | business digitalization |
| BIM | building information modeling |
Appendix A

Table A1.
Degree of relevance assigned to business digitalization (B).
| Frequency | Percent | Cumulative Percent | |
|---|---|---|---|
| Nothing relevant | 8 | 2.6 | 2.6 |
| Not very relevant | 18 | 5.8 | 8.4 |
| Relevant | 71 | 22.9 | 31.3 |
| Very relevant | 113 | 36.5 | 67.7 |
| Extremely relevant | 100 | 32.3 | 100.0 |
| Total | 310 | 100.0 |
Table A2.
Spearman’s correlations.
| T1 | T2 | T3 | T4 | T5 | T6 | T7 | T8 | T9 | T10 | O1 | O2 | O3 | O4 | O5 | O6 | |
|---|---|---|---|---|---|---|---|---|---|---|---|---|---|---|---|---|
| T1 | 1.00 | 0.54 | 0.56 | 0.47 | 0.34 | 0.40 | 0.30 | 0.34 | 0.35 | 0.37 | −0.02 | −0.06 | −0.05 | 0.03 | −0.02 | −0.03 |
| T2 | 0.54 | 1.00 | 0.78 | 0.61 | 0.48 | 0.50 | 0.44 | 0.53 | 0.49 | 0.52 | −0.05 | −0.07 | −0.11 | 0.06 | 0.02 | 0.03 |
| T3 | 0.56 | 0.78 | 1.00 | 0.71 | 0.53 | 0.55 | 0.49 | 0.56 | 0.55 | 0.65 | 0.00 | 0.01 | −0.07 | 0.04 | 0.05 | 0.11 |
| T4 | 0.47 | 0.61 | 0.71 | 1.00 | 0.63 | 0.67 | 0.65 | 0.46 | 0.54 | 0.62 | −0.02 | −0.07 | −0.14 | 0.02 | 0.10 | 0.08 |
| T5 | 0.34 | 0.48 | 0.53 | 0.63 | 1.00 | 0.78 | 0.68 | 0.50 | 0.48 | 0.63 | 0.01 | 0.01 | −0.07 | 0.02 | 0.06 | 0.11 |
| T6 | 0.40 | 0.50 | 0.55 | 0.67 | 0.78 | 1.00 | 0.62 | 0.48 | 0.48 | 0.66 | −0.04 | −0.05 | −0.10 | −0.04 | 0.07 | 0.08 |
| T7 | 0.30 | 0.44 | 0.49 | 0.65 | 0.68 | 0.62 | 1.00 | 0.59 | 0.49 | 0.64 | −0.01 | −0.11 | −0.05 | 0.04 | 0.07 | −0.03 |
| T8 | 0.34 | 0.53 | 0.56 | 0.46 | 0.50 | 0.48 | 0.59 | 1.00 | 0.67 | 0.53 | 0.01 | −0.05 | −0.08 | 0.03 | 0.02 | −0.01 |
| T9 | 0.35 | 0.50 | 0.55 | 0.54 | 0.48 | 0.48 | 0.49 | 0.67 | 1.00 | 0.63 | 0.03 | 0.04 | −0.05 | 0.08 | 0.11 | 0.04 |
| T10 | 0.37 | 0.52 | 0.65 | 0.62 | 0.63 | 0.66 | 0.64 | 0.53 | 0.63 | 1.00 | −0.01 | −0.03 | −0.06 | 0.08 | 0.08 | 0.02 |
| O1 | −0.02 | −0.05 | 0.00 | −0.02 | 0.01 | −0.04 | −0.01 | 0.01 | 0.03 | −0.01 | 1.00 | 0.64 | 0.46 | 0.37 | 0.47 | 0.45 |
| O2 | −0.06 | −0.07 | 0.01 | −0.07 | 0.01 | −0.05 | −0.11 | −0.05 | 0.04 | −0.03 | 0.64 | 1.00 | 0.47 | 0.34 | 0.40 | 0.60 |
| O3 | −0.05 | −0.11 | −0.07 | −0.14 | −0.07 | −0.10 | −0.05 | −0.08 | −0.05 | −0.06 | 0.46 | 0.47 | 1.00 | 0.56 | 0.42 | 0.44 |
| O4 | 0.03 | 0.06 | 0.04 | 0.02 | 0.02 | −0.04 | 0.04 | 0.03 | 0.08 | 0.08 | 0.37 | 0.34 | 0.56 | 1.00 | 0.43 | 0.40 |
| O5 | −0.02 | 0.02 | 0.05 | 0.10 | 0.06 | 0.07 | 0.07 | 0.02 | 0.11 | 0.08 | 0.47 | 0.40 | 0.42 | 0.43 | 1.00 | 0.47 |
| O6 | −0.03 | 0.03 | 0.11 | 0.08 | 0.11 | 0.08 | −0.03 | −0.01 | 0.04 | 0.02 | 0.45 | 0.60 | 0.44 | 0.40 | 0.47 | 1.00 |
| B | 0.49 | 0.43 | 0.45 | 0.35 | 0.20 | 0.25 | 0.17 | 0.28 | 0.38 | 0.28 | 0.01 | 0.03 | −0.04 | 0.08 | 0.05 | 0.07 |
References
- Gregory, G.D.; Ngo, L.V.; Karavdic, M. Developing e-commerce marketing capabilities and efficiencies for enhanced performance in business-to-business export ventures. Ind. Mark. Manag. 2019, 78, 146–157. [Google Scholar] [CrossRef]
- Kraus, S.; Palmer, C.; Kailer, N.; Kallinger, F.L.; Spitzer, J. Digital entrepreneurship: A research agenda on new business models for the twenty-first century. Int. J. Entrep. Behav. Res. 2018, 25, 353–375. [Google Scholar] [CrossRef]
- Iansiti, M.; Lakhani, K.R. The Truth About Blockchain. Available online: https://hbr.org/2017/01/the-truth-about-blockchain (accessed on 21 November 2021).
- Hervé, A.; Schmitt, C.; Baldegger, R. Internationalization and Digitalization: Applying digital technologies to the internationalization process of small and medium-sized enterprises. Technol. Innov. Manag. Rev. 2020, 10, 28–40. [Google Scholar] [CrossRef]
- Strange, R.; Zucchella, A. Industry 4.0, global value chains and international business. Multinatl. Bus. Rev. 2017, 25, 174–184. [Google Scholar] [CrossRef]
- Neubert, M. The impact of digitalization on the speed of internationalization of lean global startups. Technol. Innov. Manag. Rev. 2018, 8, 44–54. [Google Scholar] [CrossRef] [Green Version]
- Coviello, N.; Kano, L.; Liesch, P.W. Adapting the Uppsala model to a modern world: Macro-context and microfoundations. J. Int. Bus. Stud. 2017, 48, 1151–1164. [Google Scholar] [CrossRef]
- Kraus, S.; Jones, P.; Kailer, N.; Weinmann, A.; Chaparro-Banegas, N.; Roig-Tierno, N. Digital Transformation: An Overview of the Current State of the Art of Research. SAGE Open 2021, 11, 21582440211047576. [Google Scholar] [CrossRef]
- White, M. Digital workplaces: Vision and reality. Bus. Inf. Rev. 2012, 29, 205–214. [Google Scholar] [CrossRef]
- Bouncken, R.B.; Kraus, S.; Roig-Tierno, N. Knowledge-and innovation-based business models for future growth: Digitalized business models and portfolio considerations. Rev. Manag. Sci. 2021, 15, 1–14. [Google Scholar] [CrossRef]
- Hess, T.; Matt, C.; Benlian, A.; Wiesböck, F. Options for formulating a digital transformation strategy. MIS Q. Exec. 2016, 15, 123–139. [Google Scholar]
- Bouwman, H.; Nikou, S.; Molina-Castillo, F.J.; de Reuver, M. The impact of digitalization on business models. Digit. Policy Regul. Gov. 2018, 20, 105–124. [Google Scholar] [CrossRef]
- Alves, A.M.R. The Impact of Digitalization on SMEs International Strategies: A Bibliometric Analysis. 2020. Available online: https://sigarra.up.pt/fep/pt/pub_geral.show_file?pi_doc_id=266800 (accessed on 21 November 2021).
- Muthuraman, S. Digital Business Models for Sustainability. Gedrag Organ. Rev. 2020, 33, 1095–1102. [Google Scholar] [CrossRef]
- Isensee, C.; Teuteberg, F.; Griese, K.M.; Topi, C. The relationship between organizational culture, sustainability, and digitalization in SMEs: A systematic review. J. Clean. Prod. 2020, 275, 122944. [Google Scholar] [CrossRef]
- Bai, C.; Quayson, M.; Sarkis, J. COVID-19 Pandemic Digitization Lessons for Sustainable Development of Micro-and Small-Enterprises. Sustain. Prod. Consum. 2021, 27, 1989–2001. [Google Scholar] [CrossRef] [PubMed]
- Denicolai, S.; Zucchella, A.; Magnani, G. Internationalization, digitalization, and sustainability: Are SMEs ready? A survey on synergies and substituting effects among growth paths. Technol. Forecast. Soc. Chang. 2021, 166, 120650. [Google Scholar] [CrossRef]
- Davis-Peccoud, J.; van den Branden, J.C. Covid-19 Gives Sustainability a Dress Rehearsal; Bain & Company: Boston, MA, USA, 2020. [Google Scholar]
- Malhotra, N.; Nunan, D.; Birks, D. Marketing Research: An Applied Approach; Pearson: London, UK, 2017. [Google Scholar]
- Sestino, A.; Prete, M.I.; Piper, L.; Guido, G. Internet of Things and Big Data as enablers for business digitalization strategies. Technovation 2020, 98, 102173. [Google Scholar] [CrossRef]
- Company, M.; Manyika, J. Technology, Jobs, and the Future of Work; McKinsey Insights: New York, NY, USA, 2017. [Google Scholar]
- Valenduc, G.; Vendramin, P. Digitalisation, between disruption and evolution. Transf. Eur. Rev. Labour Res. 2017, 23, 121–134. [Google Scholar] [CrossRef]
- Huckstep, R. Insurance of Things–How IoT Shows Prevention is Better Than Cure for Insurers. InsurTech Weekly. 2016, Volume 39. Available online: https://www.the-digital-insurer.com/blog/insurtech-insurance-of-things-how-iot-shows-prevention-is-better-than-cure-for-insurers/ (accessed on 21 November 2021).
- Gong, C.; Ribiere, V. Developing a unified definition of digital transformation. Technovation 2021, 102, 102217. [Google Scholar] [CrossRef]
- Oswald, G.; Kleinemeier, M. Shaping the Digital Enterprise; Springer International Publishing: Cham, Switzerland, 2017. [Google Scholar]
- Zavery, A. Google Cloud BrandVoice: Digital Transformation Isn’t A Project, It’s A Way Of Operating. Frobes, 22 January 2021. [Google Scholar]
- Beneki, C.; Papastathopoulos, A.; Tsagris, M. The influence of web-based enterprise systems on SMEs’ internationalization process. Int. Bull. Bus. Adm. 2011, 12, 51–65. [Google Scholar]
- Schwertner, K. Digital transformation of business. Trakia J. Sci. 2017, 15, 388–393. [Google Scholar] [CrossRef]
- Simkó, M.; Mattsson, M.O. 5G wireless communication and health effects—A pragmatic review based on available studies regarding 6 to 100 GHz. Int. J. Environ. Res. Public Health 2019, 16, 3406. [Google Scholar] [CrossRef] [Green Version]
- Samsung. 5G Vision. Available online: https://images.samsung.com/is/content/samsung/p5/global/business/networks/insights/white-paper/5g-vision/White-Paper_Samsung-5G-Vision.pdf (accessed on 1 July 2021).
- Nordrum, A.; Clark, K.; Spectrum, I. 5G Bytes: Small Cells Explained. 2021. Available online: https://www.fitce.gr/5g-bytes-small-cells-explained/ (accessed on 21 November 2021).
- Newsroom, S. Samsung’s 6G White Paper Lays Out the Company’s Vision for the Next Generation of Communications technology. 2020. Available online: https://news.samsung.com/global/samsungs-6g-white-paper-lays-out-the-companys-vision-for-the-next-generation-of-communications-technology (accessed on 21 November 2021).
- McCarthy, J.; Minsky, M.L.; Rochester, N.; Shannon, C.E. A proposal for the dartmouth summer research project on artificial intelligence, August 31, 1955. AI Mag. 2006, 27, 12. [Google Scholar]
- Samuel, A.L. Some studies in machine learning using the game of checkers. IBM J. Res. Dev. 1959, 3, 210–229. [Google Scholar] [CrossRef]
- Bengio, Y.; Courville, A.; Vincent, P. Representation learning: A review and new perspectives. IEEE Trans. Pattern Anal. Mach. Intell. 2013, 35, 1798–1828. [Google Scholar] [CrossRef]
- Goodfellow, I.; Bengio, Y.; Courville, A. Deep Learning; MIT Press: Cambridge, MA, USA, 2016. [Google Scholar]
- Ferreira, P.M.; Pernes, D.; Rebelo, A.; Cardoso, J.S. Desire: Deep signer-invariant representations for sign language recognition. IEEE Trans. Syst. Man Cybern. Syst. 2019, 51, 5830–5845. [Google Scholar] [CrossRef]
- Schmidhuber, J. Deep learning in neural networks: An overview. Neural Netw. 2015, 61, 85–117. [Google Scholar] [CrossRef] [PubMed] [Green Version]
- Cipresso, P.; Giglioli, I.A.C.; Raya, M.A.; Riva, G. The past, present, and future of virtual and augmented reality research: A network and cluster analysis of the literature. Front. Psychol. 2018, 9, 2086. [Google Scholar] [CrossRef] [Green Version]
- Chen, M.; Mao, S.; Zhang, Y.; Leung, V.C. Big Data: Related Technologies, Challenges and Future Prospects; Springer: Berlin, Germany, 2014. [Google Scholar]
- Team, O. Big Data Now: Current Perspectives from OReilly Radar; O’Reilly Media: Sebastopol, CA, USA, 2011. [Google Scholar]
- Gantz, J.; Reinsel, D. Extracting value from chaos. IDC Iview 2011, 1142, 1–12. [Google Scholar]
- Labrinidis, A.; Jagadish, H.V. Challenges and opportunities with big data. Proc. VLDB Endow. 2012, 5, 2032–2033. [Google Scholar] [CrossRef]
- Armbrust, M.; Fox, A.; Griffith, R.; Joseph, A.D.; Katz, R.; Konwinski, A.; Lee, G.; Patterson, D.; Rabkin, A.; Stoica, I.; et al. A view of cloud computing. Commun. ACM 2010, 53, 50–58. [Google Scholar] [CrossRef] [Green Version]
- Ochian, A.; Suciu, G.; Fratu, O.; Voicu, C.; Suciu, V. An overview of cloud middleware services for interconnection of healthcare platforms. In Proceedings of the 2014 10th International Conference on Communications (COMM), Bucharest, Romania, 29–31 May 2014; pp. 1–4. [Google Scholar]
- Uhl, A.; Gollenia, L.A. Digital Enterprise Transformation: A Business-Driven Approach to Leveraging Innovative IT; Routledge: London, UK, 2016. [Google Scholar]
- Knight, G.A.; Cavusgil, S.T. Innovation, organizational capabilities, and the born-global firm. J. Int. Bus. Stud. 2004, 35, 124–141. [Google Scholar] [CrossRef] [Green Version]
- Dethine, B.; Enjolras, M.; Monticolo, D. Digitalization and SMEs’ export management: Impacts on resources and capabilities. Technol. Innov. Manag. Rev. 2020, 10. [Google Scholar] [CrossRef]
- Sebastian, I.M.; Ross, J.W.; Beath, C.; Mocker, M.; Moloney, K.G.; Fonstad, N.O. How big old companies navigate digital transformation. In Strategic Information Management; Routledge: London, UK, 2020; pp. 133–150. [Google Scholar]
- Bondar, S.; Hsu, J.C.; Pfouga, A.; Stjepandić, J. Agile digital transformation of System-of-Systems architecture models using Zachman framework. J. Ind. Inf. Integr. 2017, 7, 33–43. [Google Scholar] [CrossRef]
- Pousttchi, K.; Gleiss, A.; Buzzi, B.; Kohlhagen, M. Technology impact types for digital transformation. In Proceedings of the 2019 IEEE 21st Conference on Business Informatics (CBI), Moscow, Russia, 15–17 July 2019; Volume 1, pp. 487–494. [Google Scholar]
- Westerman, G.; Calméjane, C.; Bonnet, D.; Ferraris, P.; McAfee, A. Digital Transformation: A Roadmap for Billion-Dollar Organizations; MIT Center for Digital Business and Capgemini Consulting: Cambridge, MA, USA, 2011; Volume 1, pp. 1–68. Available online: https://www.capgemini.com/resources/digital-transformation-a-roadmap-for-billiondollar-organizations/ (accessed on 21 November 2021).
- Bharadwaj, A.; El Sawy, O.A.; Pavlou, P.A.; Venkatraman, N. Digital business strategy: Toward a next generation of insights. MIS Q. 2013, 37, 471–482. [Google Scholar] [CrossRef]
- Pagani, M. Digital business strategy and value creation: Framing the dynamic cycle of control points. Mis Q. 2013, 37, 617–632. [Google Scholar] [CrossRef]
- Kane, G.C.; Palmer, D.; Phillips, A.N.; Kiron, D.; Buckley, N. Strategy, Not Technology, Drives Digital Transformation; MIT Sloan Management Review: Cambridge, MA, USA; Deloitte University Press: New York, NY, USA, 2015; Volume 14, Available online: https://www2.deloitte.com/cn/en/pages/technology-media-and-telecommunications/articles/strategy-not-technology-drives-digital-transformation.html (accessed on 21 November 2021).
- Ross, J.W.; Sebastian, I.; Beath, C.; Mocker, M.; Moloney, K.; Fonstad, N. Designing and Executing Digital Strategies. 2016. Available online: https://www.semanticscholar.org/paper/Designing-and-Executing-Digital-Strategies-Ross-Sebastian/9845053c4cd6e2a9ce61988fc060517c933341ff (accessed on 21 November 2021).
- Knight, G.A. Entrepreneurship and strategy in the international SME. J. Int. Manag. 2001, 7, 155–171. [Google Scholar] [CrossRef]
- Foroudi, P.; Gupta, S.; Nazarian, A.; Duda, M. Digital technology and marketing management capability: Achieving growth in SMEs. Qual. Mark. Res. Int. J. 2017, 20, 230–246. [Google Scholar] [CrossRef] [Green Version]
- Hervé, A.; Schmitt, C.; Baldegger, R. Digitalization, Entrepreneurial Orientation and Internationalization of Micro-, Small- and Medium-Sized Enterprises. Technol. Innov. Manag. Rev. 2020, 10, 5–17. [Google Scholar] [CrossRef]
- Nambisan, S. Digital entrepreneurship: Toward a digital technology perspective of entrepreneurship. Entrep. Theory Pract. 2017, 41, 1029–1055. [Google Scholar] [CrossRef]
- Hannibal, M.; Knight, G. Additive manufacturing and the global factory: Disruptive technologies and the location of international business. Int. Bus. Rev. 2018, 27, 1116–1127. [Google Scholar] [CrossRef]
- Ojala, A.; Evers, N.; Rialp, A. Extending the international new venture phenomenon to digital platform providers: A longitudinal case study. J. World Bus. 2018, 53, 725–739. [Google Scholar] [CrossRef]
- Stallkamp, M.; Schotter, A.P. Platforms without borders? The international strategies of digital platform firms. Glob. Strategy J. 2021, 11, 58–80. [Google Scholar] [CrossRef]
- Watson IV, G.F.; Weaven, S.; Perkins, H.; Sardana, D.; Palmatier, R.W. International market entry strategies: Relational, digital, and hybrid approaches. J. Int. Mark. 2018, 26, 30–60. [Google Scholar] [CrossRef]
- Wittkop, A.; Zulauf, K.; Wagner, R. How digitalization changes the internationalization of entrepreneurial firms: Theoretical considerations and empirical evidence. Manag. Dyn. Knowl. Econ. 2018, 6, 193–207. [Google Scholar] [CrossRef] [Green Version]
- Enjolras, M.; Camargo, M.; Schmitt, C. Are High-Tech Companies More Competitive Than Others? An Empirical Study of Innovative and Exporting French SMEs. Technol. Innov. Manag. Rev. 2019, 9, 33–49. [Google Scholar] [CrossRef] [Green Version]
- Verhoef, P.C.; Broekhuizen, T.; Bart, Y.; Bhattacharya, A.; Dong, J.Q.; Fabian, N.; Haenlein, M. Digital transformation: A multidisciplinary reflection and research agenda. J. Bus. Res. 2021, 122, 889–901. [Google Scholar] [CrossRef]
- Tian, L.; Lai, C.; Moore, J.D. Polarity and intensity: The two aspects of sentiment analysis. arXiv 2018, arXiv:1807.01466. [Google Scholar]
- Rambocas, M.; Gama, J. The Role of Sentiment Analysis; FEP Economics and Managment: 2013. Available online: http://wps.fep.up.pt/wps/wp489.pdf (accessed on 21 November 2021).
- Becker, I.; Parkin, S.; Sasse, M.A. Combining qualitative coding and sentiment analysis: Deconstructing perceptions of usable security in organisations. In Proceedings of the LASER Workshop: Learning from Authoritative Security Experiment Results (LASER 2016), San Jose, CA, USA, 26 May 2016; pp. 43–53. [Google Scholar]
- Cohen, J. Statistical Power Analysis for the Behavioral Sciences; Academic Press: Cambridge, MA, USA, 2013. [Google Scholar]
- Hair, J.F. Multivariate Data Analysis. 2009. Available online: https://www.scirp.org/%28S%28lz5mqp453edsnp55rrgjct55%29%29/reference/referencespapers.aspx?referenceid=1161849 (accessed on 21 November 2021).
- Marôco, J. Análise Estatística com o SPSS Statistics, 7th ed.; ReportNumber. Análise e Gestão de Informação, Lda.: Pêro Pinheiro, Portugal, 2018; Available online: https://books.google.pt/books?id=Ki5gDwAAQBAJ&printsec=frontcover&hl=pt-PT&source=gbs_vpt_buy (accessed on 21 November 2021).
- Marr, B. How Much Data Do We Create Every Day? The Mind-Blowing Stats Everyone Should Read. 2019. Available online: https://www.forbes.com/sites/bernardmarr/2018/05/21/how-much-data-do-we-create-every-day-the-mind-blowing-stats-everyone-should-read/ (accessed on 21 November 2021).
- Pereira, C.S.; Veloso, B.; Durão, N.; Moreira, F. The influence of technological innovations on international business strategy before and during COVID-19 pandemic. Procedia Comput. Sci. 2022, in press. [Google Scholar] [CrossRef]
- Singh, A. Role of HR in digital transformation. HR Future 2019, 2019, 16–17. [Google Scholar]
- Mergel, I.; Edelmann, N.; Haug, N. Defining digital transformation: Results from expert interviews. Gov. Inf. Q. 2019, 36, 101385. [Google Scholar] [CrossRef]
- Bucy, M.; Finlayson, A.; Kelly, G.; Moye, C. The ‘How’ of Transformation. 2020. Available online: https://www.mckinsey.com/industries/retail/our-insights/the-how-of-transformation (accessed on 21 November 2021).
Figure 1.
Research diagram.

Figure 2.
Spearman correlations between technological tools.

Figure 3.
Spearman correlations between obstacles.

Figure 4.
Dendrogram for obstacles.

Figure 5.
Boxplot for “Resistance” (sectors A and C).

Figure 6.
Boxplot for “Robotics/Automation” (micro and medium companies).

Figure 7.
Boxplot for variable B (micro and small companies).

Figure 8.
Frequencies of the degree of relevance assigned to business digitalization (B) by sector and company size.
Figure 8.
Frequencies of the degree of relevance assigned to business digitalization (B) by sector and company size.

Figure 9.
Undirected network of correlations.

Table 1.
Questionnaire variables with the respective scale.
| Variable | Categories | Scale |
|---|---|---|
| Sector of Economic activity | - Manufacturing industries (A) - Wholesale and retail trade; Car and motorcycle repair (B) - Consulting, scientific, technical and similar activities (C) | Nominal |
| Company size | - Micro—≤9 employees - Small— - Medium— - Large—≥250 employees | Four-point Likert scale |
| Turnover (% of business that resulted from internationalization) | - <50% (1) - ≥50% (2) | Two-point Likert scale |
| B (degree of relevance assigned to business digitalization) | - Nothing relevant (1) - Not very relevant (2) - Relevant (3) - Very relevant (4) - Extremely relevant (5) | Five-point Likert scale |
| Degree of relevance attributed to the ten technologies for the company’s internationalization process (10 variables): T1—E-commerce T2—Cloud solutions T3—Big data T4—IoT/sensors T5—3D printing T6—Virtual reality/augmented reality T7—Robotics/automation T8—Agile tools T9—Business intelligence T10—Artificial intelligence | - Nothing relevant (1) - Not very relevant (2) - Relevant (3) - Very relevant (4) - Extremely relevant (5) - Term unknown (6) - Not applicable for my business (7) | Five-point Likert scale plus 2 more options |
| Degree of frequency that occur the six obstacles to the business internationalization process: O1—Culture of organization O2—Resistance to changes O3—Few technological partners O4—Inadequate budgets O5—Employees without necessary skills O6—Leadership confused about what to do | - Never (1) - Almost never (2) - Sometimes (3) - Often (4) - Always (5) | Five-point Likert scale |
Table 2.
Results of sentiment analysis.
| Core Sentences | Magnitude | Sentiment Score |
|---|---|---|
| – DT made international business much easier | 0.46 | 0.134 |
| – Very important ISO 27 2001 to create technological dependence DT a lot of investment in R&D | 0.85 | 0.571 |
| – Very important DT electronic invoicing digitalization of the business process including production process | 0.83 | 0.522 |
| – DT was important | 0.49 | 0.126 |
| – DT important to know from a distance | 0.35 | 0.162 |
| – It is an objective for the next 5 years to develop techniques in the field of DT and dissemination | 0.56 | 0.478 |
| – The use of digital tools DT greatly facilitates contact with customers partners and future contacts | 0.81 | 0.555 |
| – Thanks to these tools we are able to be close to markets that are geographically distant and we are able to maintain closer relations with everyone | 0.94 | 0.519 |
| – Do not have DT | 0.72 | −0.547 |
| – Information technologies DT had an enormous impact as they allowed to reach new markets with much less investment | 0.69 | 0.514 |
| – At the moment we still do not do much exploration of the new digital media | 0.85 | −0.530 |
| – In general, DT was not important, although some markets, such as the British, imply the implementation of cutting-edge digital technologies, such as BIM | 0.70 | −0.559 |
Table 3.
Results of sentiment analysis—detected keywords.
| Detected Keywords | Magnitude | Sentiment Score |
|---|---|---|
| International | 0.001 | −0.250 |
| reach | 0.000 | 0.250 |
| closer | 0.001 | 0.250 |
| develop | 0.001 | 0.250 |
| maintain | 0.002 | 0.250 |
| able | 0.983 | 0.742 |
| enormous | 0.984 | 0.737 |
| create | 0.975 | 0.734 |
Table 4.
Descriptive measures for the ten technology tools.
| E-Commerce | Cloud Solutions | Big Data | IoT Sensors | 3D Printing | VR AR | Robotics Automation | Agile Tools | BI | AI | |
|---|---|---|---|---|---|---|---|---|---|---|
| Mean | 3.59 | 3.16 | 2.79 | 2.64 | 2.22 | 2.28 | 2.69 | 3.41 | 3.31 | 2.55 |
| Median | 4.00 | 3.00 | 3.00 | 2.00 | 2.00 | 2.00 | 2.00 | 4.00 | 3.00 | 2.00 |
| SD | 1.36 | 1.35 | 1.29 | 1.39 | 1.23 | 1.32 | 1.47 | 1.30 | 1.35 | 1.41 |
| CV (%) | 37.80 | 42.60 | 46.30 | 52.80 | 55.40 | 57.90 | 61.30 | 38.00 | 40.70 | 55.20 |
Table 5.
Percentages (%) of “term unknown” and “not applicable” by technologies.
| E-Comm | Cloud Solutions | Big Data | IoT Sensors | 3D Printing | VR AR | Robotics Automation | Agile Tools | BI | AI | |
|---|---|---|---|---|---|---|---|---|---|---|
| Term unknown | 0.30 | 1.00 | 8.40 | 5.20 | – | – | 1.00 | 2.60 | 2.60 | 1.00 |
| NA | 5.20 | 6.50 | 12.90 | 15.50 | 19.00 | 19.00 | 13.90 | 5.40 | 8.40 | 17.70 |
Table 6.
Descriptive measures for the six obstacles.
| Culture | Resistance | Few Partners | Budget | Few Skills | Confused Leadership | |
|---|---|---|---|---|---|---|
| Mean | 2.65 | 2.42 | 2.66 | 2.89 | 2.72 | 2.30 |
| Median | 3.00 | 2.00 | 3.00 | 3.00 | 3.00 | 2.00 |
| SD | 1.09 | 1.17 | 1.08 | 1.18 | 1.08 | 1.13 |
| CV (%) | 41.00 | 48.00 | 41.00 | 41.00 | 40.00 | 49.00 |
Table 7.
Results of Kruskal–Wallis test for technological tools by sector.
| E-Commerce | Cloud Solutions | Big Data | IoT Sensors | 3D Printing | VR AR | Robotics Automation | Agile Tools | BI | AI | |
|---|---|---|---|---|---|---|---|---|---|---|
| Kruskal–Wallis | 2.21 | 1.76 | 1.14 | 2.12 | 4.26 | 3.08 | 1.24 | 0.43 | 2.69 | 2.17 |
| df | 2.00 | 2.00 | 2.00 | 2.00 | 2.00 | 2.00 | 2.00 | 2.00 | 2.00 | 2.00 |
| Asymp. Sig. | 0.33 | 0.41 | 0.57 | 0.35 | 0.12 | 0.22 | 0.54 | 0.81 | 0.26 | 0.34 |
Table 8.
Results of Kruskal–Wallis test for obstacles by sector.
| Culture | Resistance | Few Partners | Budget | Few Skills | Confused Leadership | |
|---|---|---|---|---|---|---|
| Kruskal–Wallis | 4.85 | 10.68 | 1.43 | 2.39 | 2.62 | 2.26 |
| df | 2.00 | 2.00 | 2.00 | 2.00 | 2.00 | 2.00 |
| Asymp. Sig. | 0.09 | 0.01 | 0.49 | 0.30 | 0.27 | 0.32 |
Table 9.
Results of Dunn’s multiple comparisons for “Resistance”, by sector.
| Sample 1-Sample 2 | Test Statistic | Sig. | Adj. Sig. |
|---|---|---|---|
| B-C | 33.18 | 0.04 | 0.12 |
| A-C | 46.90 | 0.00 | 0.00 |
| A-B | 13.72 | 0.19 | 0.57 |
Table 10.
Results of Kruskal–Wallis test for technological tools, by company size.
| E-commerce | Cloud Solutions | Big Data | IoT Sensors | 3D Printing | VR AR | Robotics Automation | Agile Tools | BI | AI | |
|---|---|---|---|---|---|---|---|---|---|---|
| Kruskal-Wallis | 4.63 | 1.39 | 2.93 | 3.76 | 4.41 | 4.52 | 9.21 | 1.07 | 2.67 | 3.01 |
| df | 3.00 | 3.00 | 3.00 | 3.00 | 3.00 | 3.00 | 3.00 | 3.00 | 3.00 | 3.00 |
| Asymp. Sig. | 0.20 | 0.71 | 0.40 | 0.29 | 0.22 | 0.21 | 0.03 | 0.79 | 0.45 | 0.39 |
Table 11.
Results of Dunn’s multiple comparisons for “Robotics/Automation”, by company size.
| Sample 1-Sample 2 | Test Statistic | Sig. | Adj. Sig. |
|---|---|---|---|
| micro-large | −13.03 | 0.46 | 1.00 |
| micro-small | −17.75 | 0.08 | 0.51 |
| micro-medium | −37.72 | 0.00 | 0.02 |
| large-small | 4.72 | 0.78 | 1.00 |
| micro-medium | 24.69 | 0.18 | 1.00 |
| micro-medium | −19.97 | 0.09 | 0.54 |
Table 12.
Results of Dunn’s multiple comparisons for variable B, by company size.
| Sample 1-Sample 2 | Test Statistic | Sig. | Adj. Sig. |
|---|---|---|---|
| small-medium | −12.38 | 0.37 | 1.00 |
| small-large | −17.66 | 0.36 | 1.00 |
| small-micro | 35.43 | 0.00 | 0.01 |
| medium-large | −5.28 | 0.80 | 1.00 |
| medium-micro | 23.06 | 0.10 | 0.62 |
| large-micro | 17.78 | 0.36 | 1.00 |
Table 13.
Results of Kruskal–Wallis test for the obstacles, by company size.
| Culture | Resistance | Few Partners | Budget | Few Skills | Confused Leadership | |
|---|---|---|---|---|---|---|
| Kruskal–Wallis | 3.21 | 3.77 | 5.96 | 2.29 | 5.26 | 4.88 |
| df | 3.00 | 3.00 | 3.00 | 3.00 | 3.00 | 3.00 |
| Asymp. Sig. | 0.36 | 0.29 | 0.11 | 0.52 | 0.15 | 0.18 |
Table 14.
Results of Mann–Whitney test for technological tools, by turnover.
| E-Comm | Cloud Solutions | Big Data | IoT Sensors | 3D Printing | VR AR | Robotics Automation | Agile Tools | BI | AI | |
|---|---|---|---|---|---|---|---|---|---|---|
| Mann–Whitney | 6794 | 7343 | 4664 | 5068 | 5174 | 5428 | 5754 | 6791 | 5814 | 4923 |
| Wilcoxon | 22,019 | 22,743 | 15,104 | 15,508 | 16,650 | 7984 | 18,315 | 22,367 | 19,675 | 15,801 |
| Z | −1.25 | −0.17 | −0.91 | −0.44 | −0.43 | −0.01 | −0.53 | −0.78 | −1.91 | −1.49 |
| Asymp. Sig. (2-tailed) | 0.21 | 0.87 | 0.36 | 0.66 | 0.66 | 0.99 | 0.60 | 0.43 | 0.06 | 0.14 |
Table 15.
Results of cross tabulation between turnover and BI.
| Business Intelligence | ||||||||
|---|---|---|---|---|---|---|---|---|
| Not Relevant | Little Relevant | Relevant | Very Relevant | Extremely Relevant | Total | |||
| Turnover | <50% | Count | 29 | 22 | 40 | 39 | 36 | 166 |
| % within Turnover | 17.5 | 13.3 | 24.1 | 23.5 | 21.7 | 100.0 | ||
| ≥50% | Count | 7 | 10 | 18 | 25 | 22 | 82 | |
| % within Turnover | 8.5 | 12.2 | 22.0 | 30.5 | 26.8 | 100.0 | ||
| Total | Count | 36 | 32 | 58 | 64 | 58 | 248 | |
| % within Turnover | 14.5 | 12.9 | 23.4 | 25.8 | 23.4 | 100.0 | ||
Table 16.
Results of Mann–Whitney test for variable B, by turnover.
| Turnover | |
|---|---|
| Mann–Whitney | 9353.00 |
| Wilcoxon | 30,263.00 |
| Z | −2.02 |
| Asymp. Sig. (2-tailed) | 0.04 |
Table 17.
Results of Mann–Whitney test for obstacles by turnover.
| Culture | Resistance | Few Partners | Budget | Few Skills | Confused Leadership | |
|---|---|---|---|---|---|---|
| Mann–Whitney | 10,201.5 | 10,239.0 | 10,782.5 | 9638.5 | 10,357.5 | 10,593.5 |
| Wilcoxon | 15,872.5 | 31,149.0 | 31,692.5 | 30,548.5 | 31,267.5 | 31,503.5 |
| Z | −0.85 | −0.79 | −0.04 | −1.62 | −0.63 | −0.30 |
| Asymp. Sig. (2-tailed) | 0.40 | 0.43 | 0.97 | 0.11 | 0.53 | 0.76 |
Publisher’s Note: MDPI stays neutral with regard to jurisdictional claims in published maps and institutional affiliations. |
© 2022 by the authors. Licensee MDPI, Basel, Switzerland. This article is an open access article distributed under the terms and conditions of the Creative Commons Attribution (CC BY) license (https://creativecommons.org/licenses/by/4.0/).
Share and Cite
MDPI and ACS Style
Pereira, C.S.; Durão, N.; Moreira, F.; Veloso, B. The Importance of Digital Transformation in International Business. Sustainability 2022, 14, 834. https://0-doi-org.brum.beds.ac.uk/10.3390/su14020834
AMA Style
Pereira CS, Durão N, Moreira F, Veloso B. The Importance of Digital Transformation in International Business. Sustainability. 2022; 14(2):834. https://0-doi-org.brum.beds.ac.uk/10.3390/su14020834
Chicago/Turabian StylePereira, Carla Santos, Natercia Durão, Fernando Moreira, and Bruno Veloso. 2022. "The Importance of Digital Transformation in International Business" Sustainability 14, no. 2: 834. https://0-doi-org.brum.beds.ac.uk/10.3390/su14020834
Note that from the first issue of 2016, this journal uses article numbers instead of page numbers. See further details here.