1. Introduction
In October 2018, the United Nations Intergovernmental Panel on Climate Change (IPCC) stated in its special report “Global Warming of 1.5 °C” that human activities are estimated to have caused global warming to be about 1.0 °C higher than the pre-industrial era, with a possible range of 0.8 °C to 1.2 °C [
1]. Extreme weather has occurred more frequently in recent years due to climate change. The “2021 Global Risk Report” indicates that in the next 10 years, incidents caused by extreme weather are one of the top risks to be faced by the world which poses a threat to human well-being [
2]. Heatwaves, as one of the most typical extreme weather incidents, shows a potential increase in frequency, intensity, and duration under the effects of climate change [
3], which not only causes irreversible destruction to natural environment but also a great impact on human life [
4,
5,
6].
Heatwaves are generally defined as a long spell of hot days with extremely high temperature which puts a risk to human health, while most studies also take duration and intensity of heatwaves into account [
7]. However, in China, a day with a maximum temperature ≥35 °C is generally defined as a high temperature incident, and a span of over three consecutive high temperature incidents is defined as heat wave [
8]. Studies show that the frequent occurrence of extreme heat incidents has posed a threat to human health and also has a negative impact on people’s daily life and social economic development [
9]. Therefore, research on high temperature disasters has attracted widespread attention from government departments and the scientific community and has become a hot spot in climate change research [
10,
11,
12].
Current research on high temperature disasters mainly focuses on high temperatures’ temporal and spatial characteristics, including intensity, occurrence frequency, and duration, etc. [
13,
14,
15,
16,
17,
18,
19,
20,
21,
22,
23,
24]. Risk assessments [
11,
25,
26,
27,
28,
29,
30] and vulnerability (sensitivity) assessments [
31,
32,
33,
34,
35,
36,
37,
38,
39,
40,
41,
42,
43,
44,
45,
46,
47,
48,
49] of high temperature disasters are increasing, which becomes a strong support for urban high temperature risk prevention and community disaster prevention management. In addition, some scholars conduct research on urban structure to improve the climate change adaptability and urban sustainability [
50,
51]. It cannot be ignored that humans are the main victims of heat wave disasters. Studies have confirmed a significant relationship between high temperature and population morbidity and mortality [
52,
53]. Therefore, it is particularly important to identify the population exposure of a region under heat waves. At present, some scholars have studied the population exposure under heat waves based on climate and population scenario data [
54,
55,
56,
57,
58]. However, earlier studies are mostly based on static statistical data from city administrative units which are not up to date and lack precision, thus, it is hard to reflect the near-real-time exposure risk of population in the affected areas and to measure risk and damage degree of disaster to population spatially and temporally [
59]. With the development of big data, data such as mobile phone data and Weibo sign-in data with high accuracy, large coverage area, and high update frequency have provided richer data sources for research that requires temporal and spatial accuracy of the population.
Under these conditions, this paper takes a heat wave incident from 6 to 12 September 2021 in Zhuhai city as an example to discuss the spatial issues of population exposure under one heat wave incident from a geographical perspective. Meteorological monitoring data and mobile phone data were processed on a GIS software platform to obtain real-time temperature and population distributions. Meanwhile, the dynamic changes of population exposure were analyzed by using grid as the basic analysis unit, and the influencing factors of population exposure changes were further explored. This study not only shows areas that are affected more by the heat wave with finer real-time population distribution and temperature but can also be used to prevent and cope with heat waves and improve the urban environment.
2. Materials and Methods
2.1. Study Area
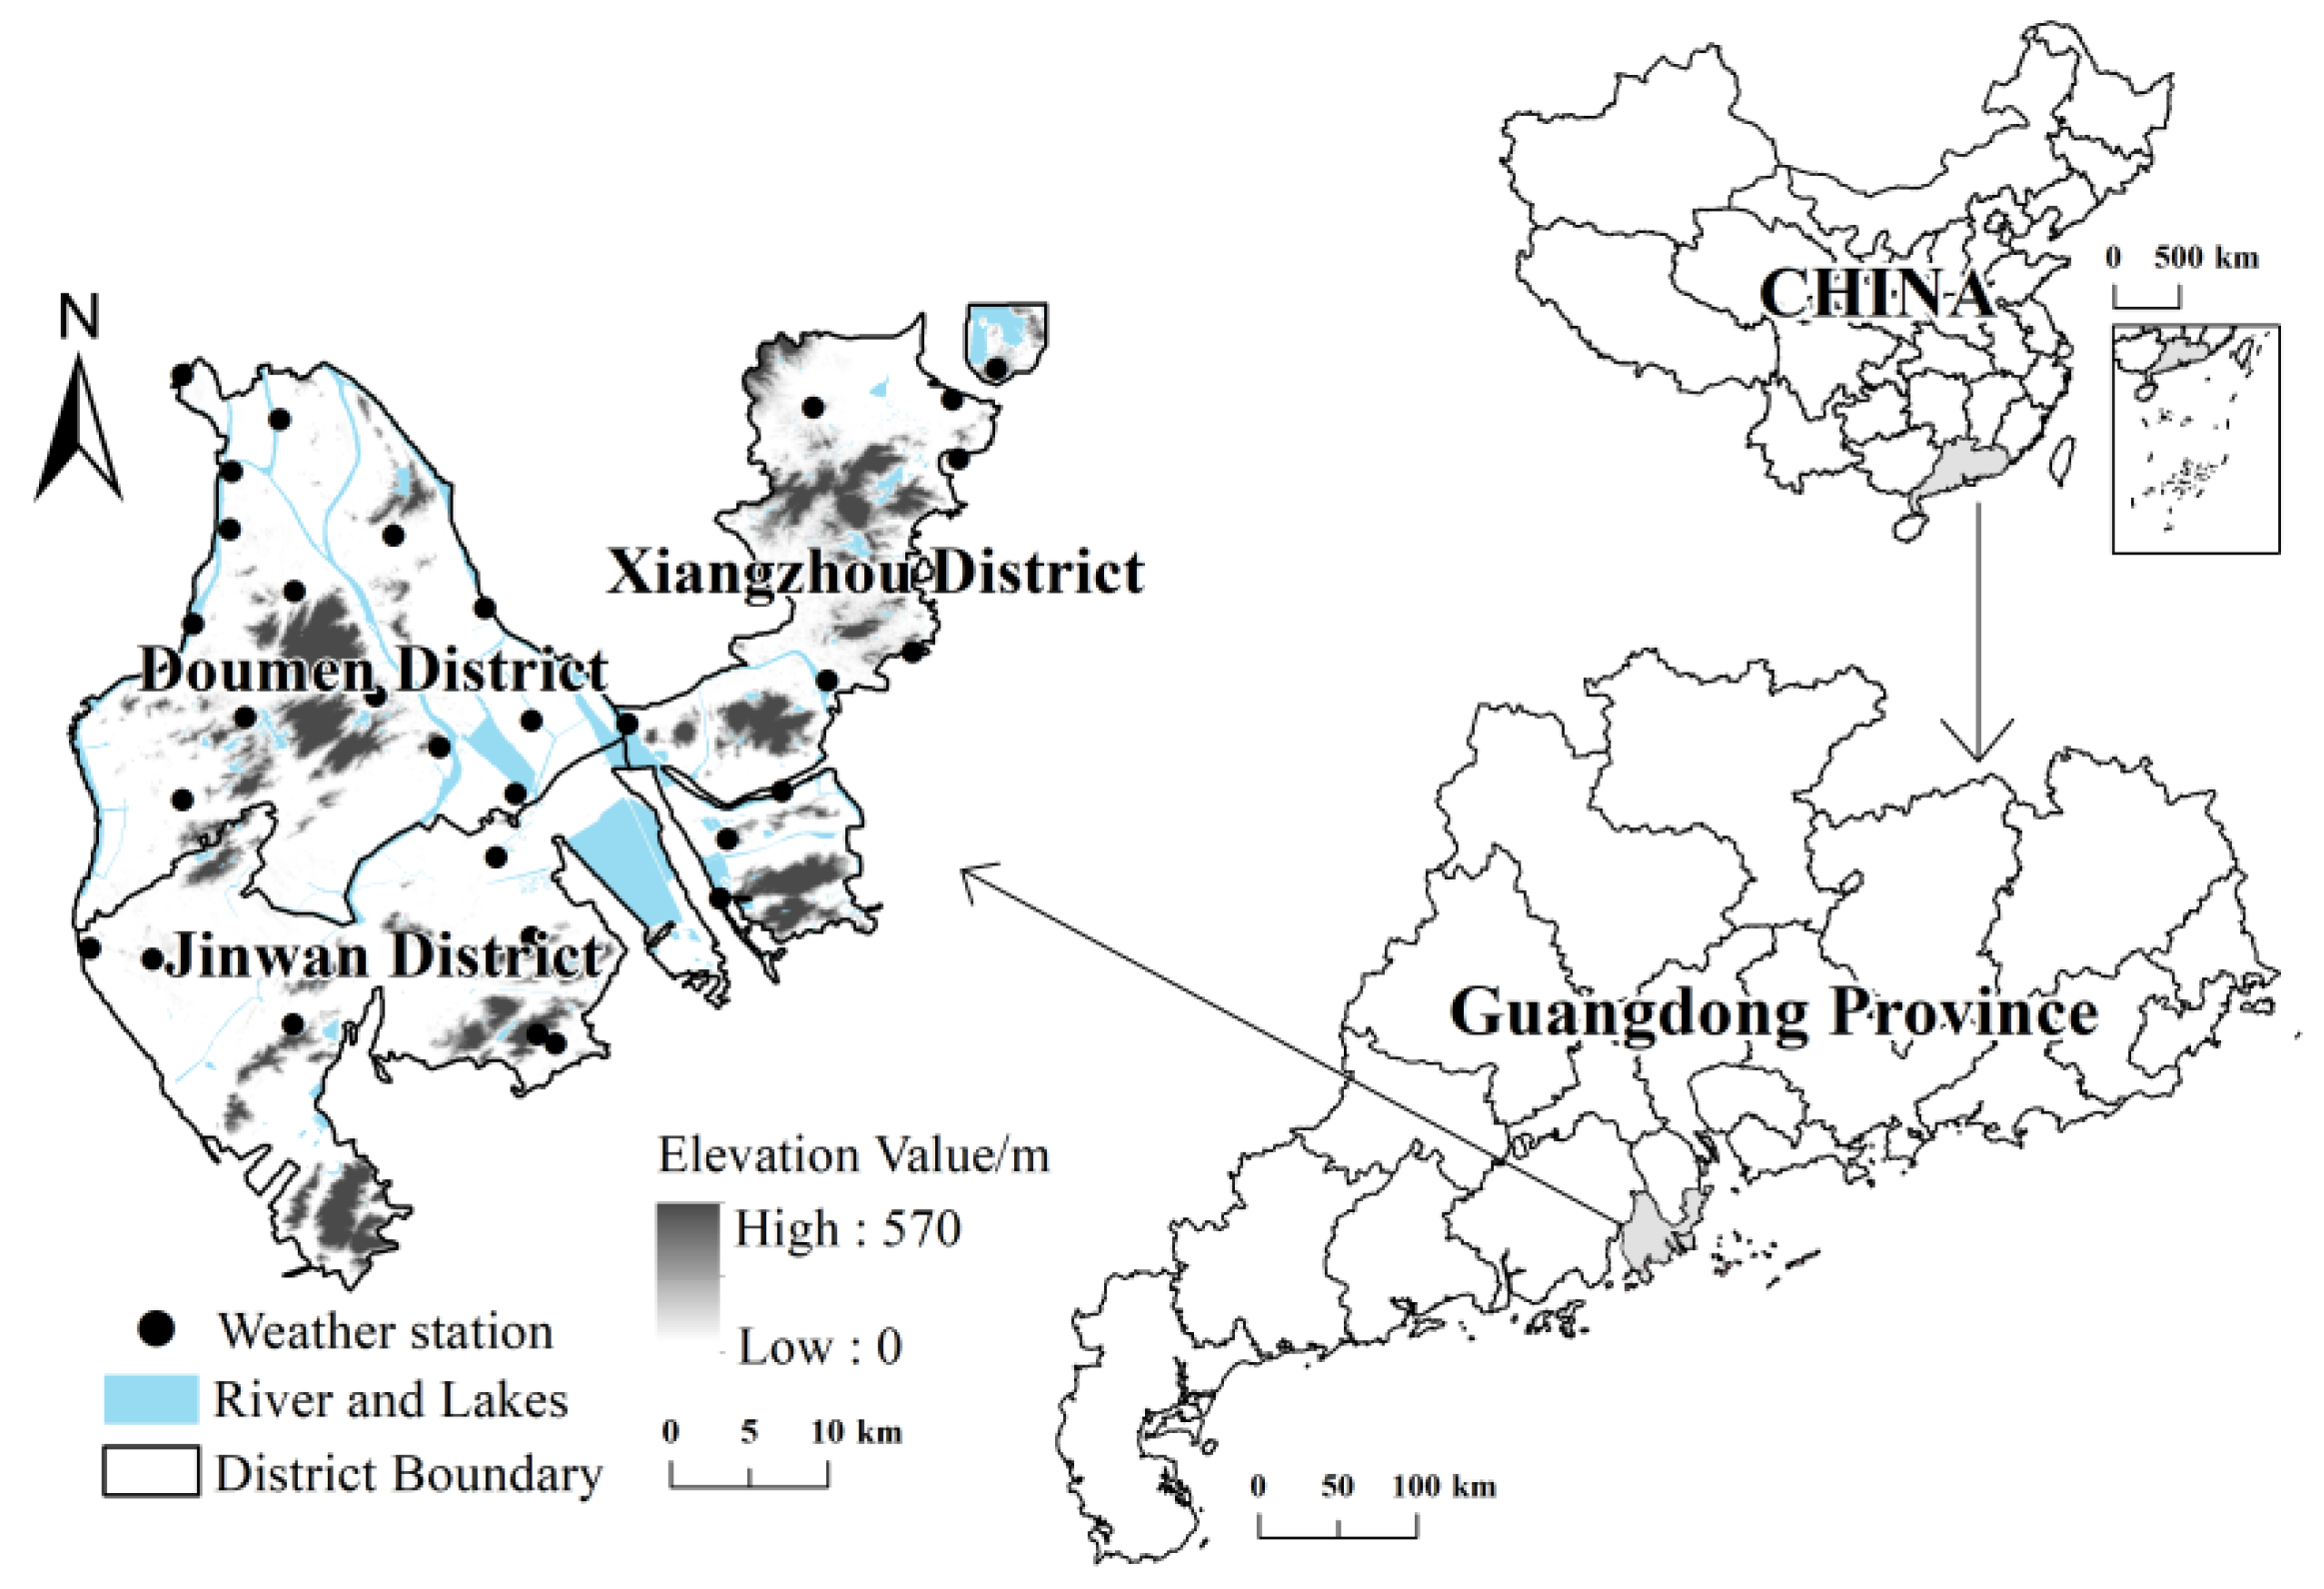
Zhuhai City is located in the southcentral part of Guangdong Province, China, with longitude from 113°03′ E to 114°19′ E and latitude from 21°48′ N to 22°27′ N. The inland area of Zhuhai City consists of hills, coasts, and plains of the Phoenix Mountain and Jiangjun Mountain, which faces Hong Kong across the sea to the east, connects with Macau in the south, Taishan City to the west, and Zhongshan City to the north. It has three administrative regions. As of the end of 2020, the land area of Zhuhai is 1736.45 km
2. Zhuhai City has a transitional oceanic climate between south subtropical and tropical, with obvious alternating winter and summer monsoons, high temperature throughout the year, with an average annual temperature of 23.8 °C, and an average annual rainfall of 1799.2 mm. From 1979 to 2000, the daily extreme maximum temperature occurred on 10 July 1980, with a temperature of 38.5 °C [
60]. During the study period of this article, the highest maximum temperature of some weather stations in Zhuhai City was monitored as high as 39.5 °C. The “Communiqué of the Seventh National Census of Guangdong Province” pointed out that the 10-year growth rate of Zhuhai’s permanent population ranks second in Guangdong Province. With the support of national policies and its own location advantages, Zhuhai has become an important city in Pearl River Delta and even the Guangdong–Hong Kong–Macao Greater Bay Area.
2.2. Data
2.2.1. Meteorological Data
The temperature data involved in this article come from the monitoring data released by the Zhuhai Meteorological Administration. There are 31 weather stations in the research area, which are more evenly distributed throughout Zhuhai City, the spatial distribution is shown in
Figure 1. In early September 2021, due to the combined effects of the downdraft surrounding the strong tropical storm “Conson” and the super typhoon “Sando”, along with subtropical high pressure, the weather in Zhuhai was hot, and the high temperature weather intensified, which led to the city’s socioeconomic and population exposure risks to increase. Based on the definition of heat waves given by China Meteorological Administrations: A heat wave is a span of at least 3 consecutive days with highest temperature over 35 °C [
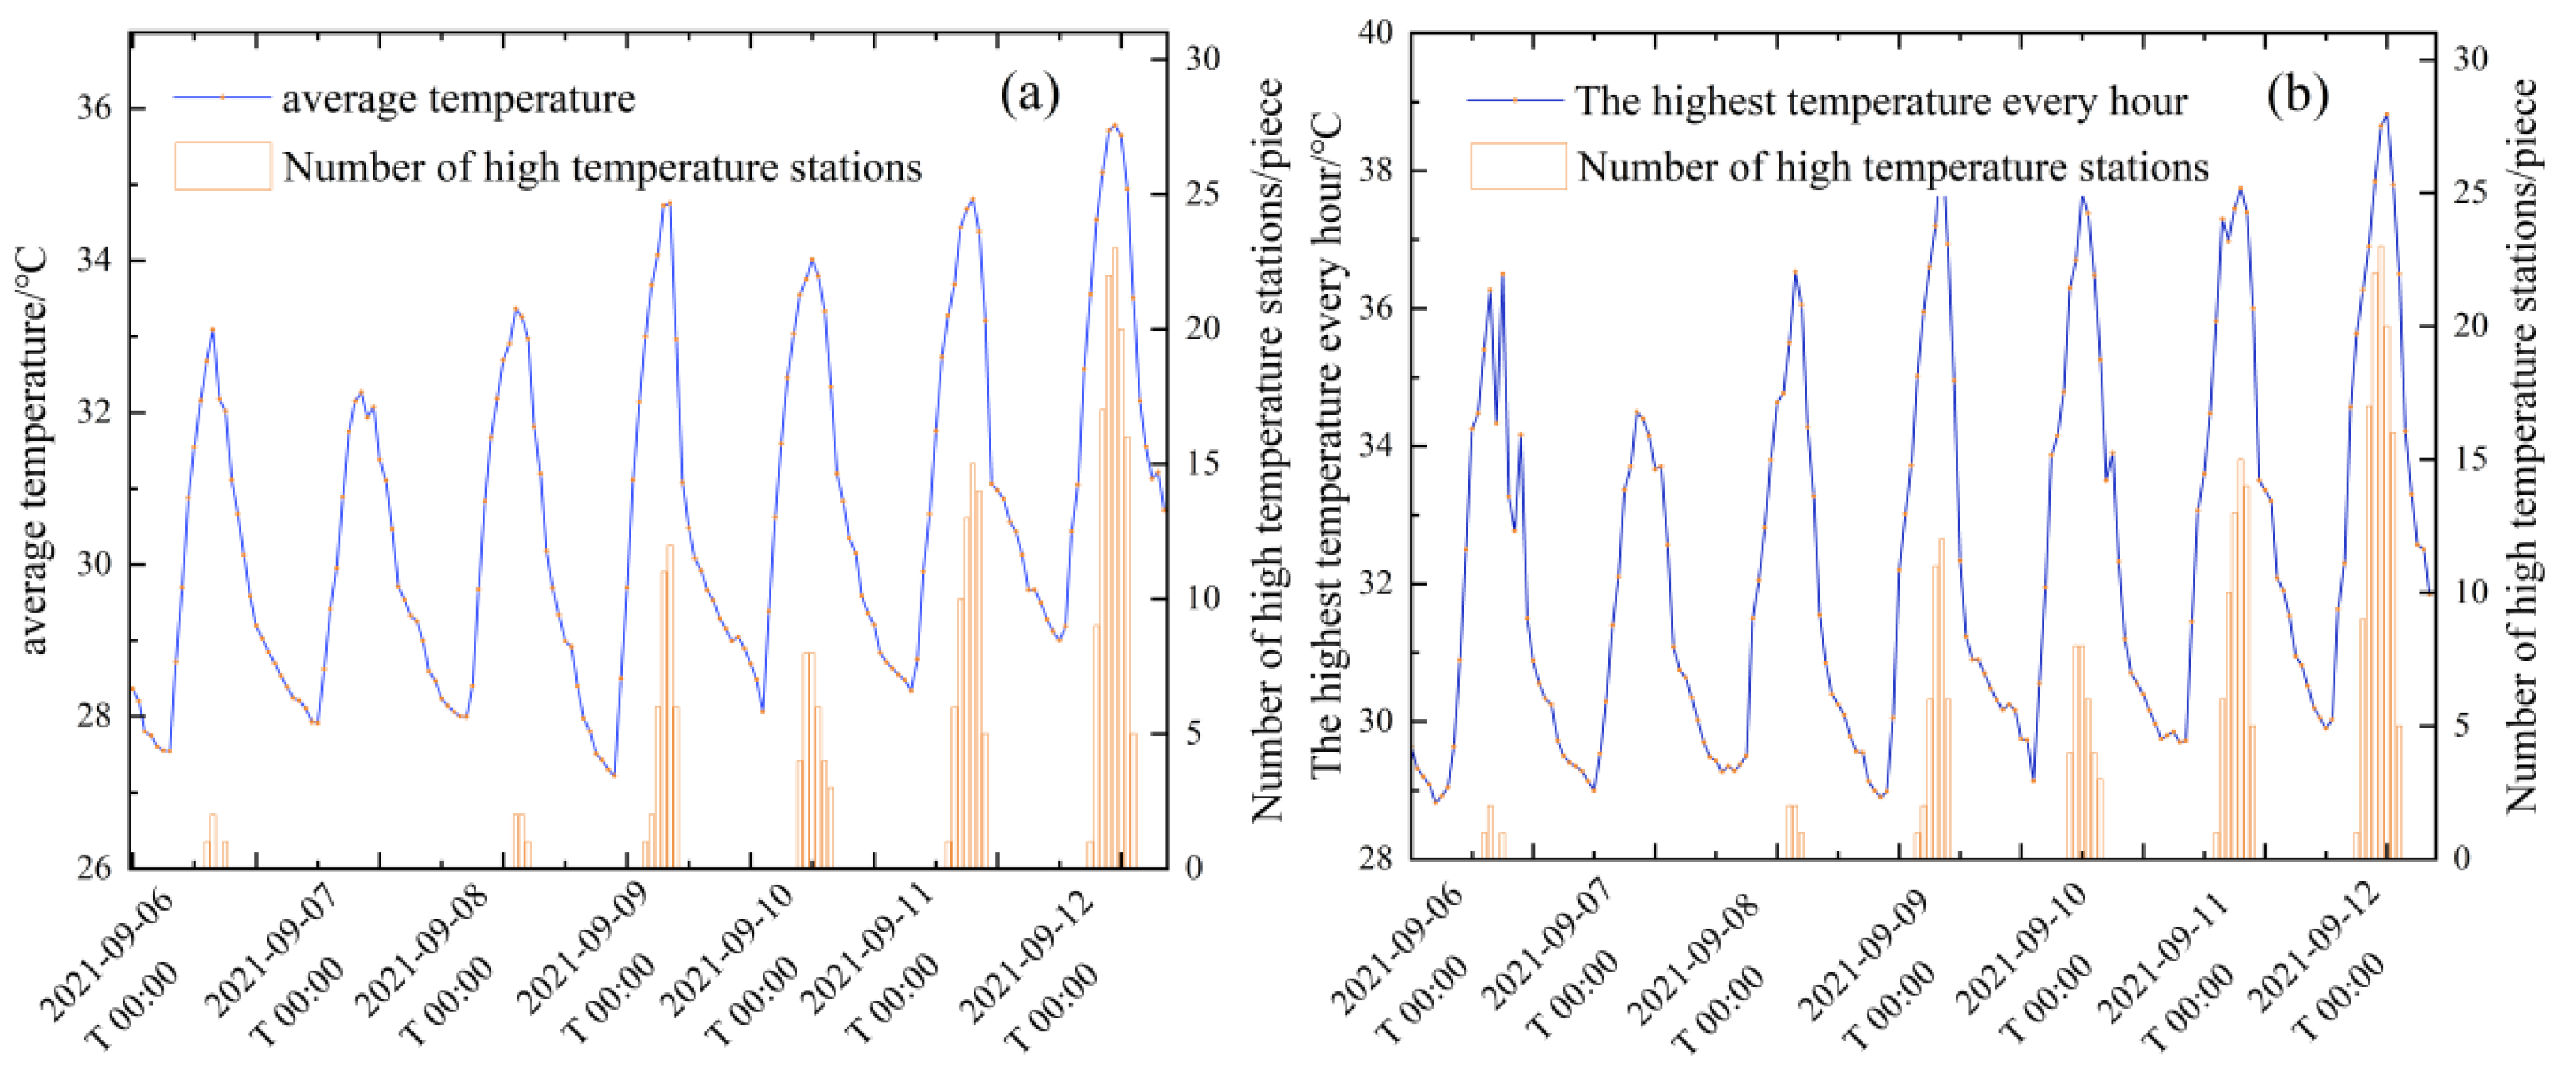
8]. Meteorological monitoring and high temperature warning information issued by the Zhuhai Meteorological Administration in September 2021 are screened for heat wave incidents, and one from 6 to 12 September 2021 is finally selected as the study period. The average temperature of various meteorological stations in Zhuhai (
Figure 2a) indicates that the average temperature of Zhuhai has obviously increased during the study period.
Figure 2b shows the hourly maximum temperature and the number of stations reaching high temperatures of various meteorological stations in Zhuhai. We can see that the maximum temperature of meteorological stations in a day generally occurs between 12:00 and 18:00. Starting from 9 September, the number of high-temperature stations in the city has increased significantly; there are 14, 9, 18, and 27 high-temperature stations above 35 °C. Since the 11th, more than half of the meteorological stations have monitored continuous high temperature, and the highest temperature reached 38.81 °C. In order to better present the exposure of Zhuhai’s population under heat waves, this article is based on the ordinary kriging method to conduct meteorological data. Spatial interpolation analysis is used to obtain a spatial and temporal distribution map of temperature in the entire area of Zhuhai, and then the hourly temperature data are rasterized and resampled to a 500 m × 500 m grid.
2.2.2. Population Data
The population data in this article involve both statistical population and mobile phone data, among which the permanent resident population comes from the “Zhuhai City Seventh National Census Bulletin” issued by the Zhuhai Bureau of Statistics in 2021, and the mobile phone data come from China Mobile operators, including all China Mobile users in Zhuhai in September 2021. The hourly population data are the anonymous mobile phone data, which are collected at the same frequency as temperature monitoring data. After the data are obtained, the geographic information system platform software ArcGIS is used to divide Zhuhai into 500 m × 500 m grids. According to the mobile phone data, the geographic coordinates of the base station to which the data belong will be gathered at the grid level, and each grid contains the population data within the corresponding geographic location.
2.3. Methods
2.3.1. Hourly Population Distribution Estimates
The mobile phone data can accurately locate spatial locations of the population and obtain real-time population data in a small scale, which makes it possible to achieve accurate small-scale research. However, there are still residents without mobile phones, one person can have multiple SIMs, and there are market share and data barriers between different providers. Raw mobile phone data cannot show real-time population distribution accurately without a trim. Therefore, this article draws on some scholars’ processing methods of mobile phone data [
59,
61] in order to estimate the real-time population distribution by integrating mobile phone data and Zhuhai City’s seventh census data. The first step is to calculate the mobile phone data population weight of each grid, then calculate the weighted statistical population and add it to the mobile phone population of each grid. Therefore, the result obtained is closer to the actual population distribution. The calculation steps are as follows:
where
is the population weight,
is the number of cell phone locations in the grid number
at the
time point,
represents the total number of grids,
is the total population in the grid number
at the
time point, and
is the seventh census population of Zhuhai City.
2.3.2. Population Exposure Estimation
This article defines the population exposure of heat waves as the number of people in the high temperature grid at 35 °C and above per hour. In order to study the population exposure changes during the heat wave cycle in Zhuhai, this paper calculated the population exposure during the study period. The specific calculation formula is as follows:
where
is the population exposure of the grid number
at the
time point,
represents the population number in the grid number
at the
time point,
represents all grids where the temperature is 35 °C and above, and
is Time (h).
2.3.3. Analysis of Factors Affecting the Change of Population Exposure under High Temperature
The population exposure of the heat wave is a function of the two factors of population and high temperature. By drawing on the contribution rate of different influencing factors to the population exposure under the heat wave calculated by other scholars [
12], the results suggests that the population exposure of high temperature changes are mainly affected by high temperature weather, population number, and population distribution changes, which can be decomposed into the impact of climate factors (temperature changes, population numbers remain unchanged), population factors (temperature unchanged, population changes), and the combined effects of population and climate factors (both temperature and population change).
The calculation method of the contribution rate of different influencing factors in the population exposure changes under the heat wave is as follows:
In the formula, is the influence of the population factor; is the influence of the climate factor; is the combined effect of both the population and climate factors. About delta, it refers to a fluctuation value. For example, refers to the temperature change on different days at the same time. For example, refers to the change in temperature difference between 6 September at 14:00 and 7 September at 14:00. refers to the amount of population change on different days at the same time. For example, refers to the population change in the jth grid at the ith time point between 7 September and 6 September.
3. Results
3.1. Temporal and Spatial Distribution Characteristics of Heat Waves
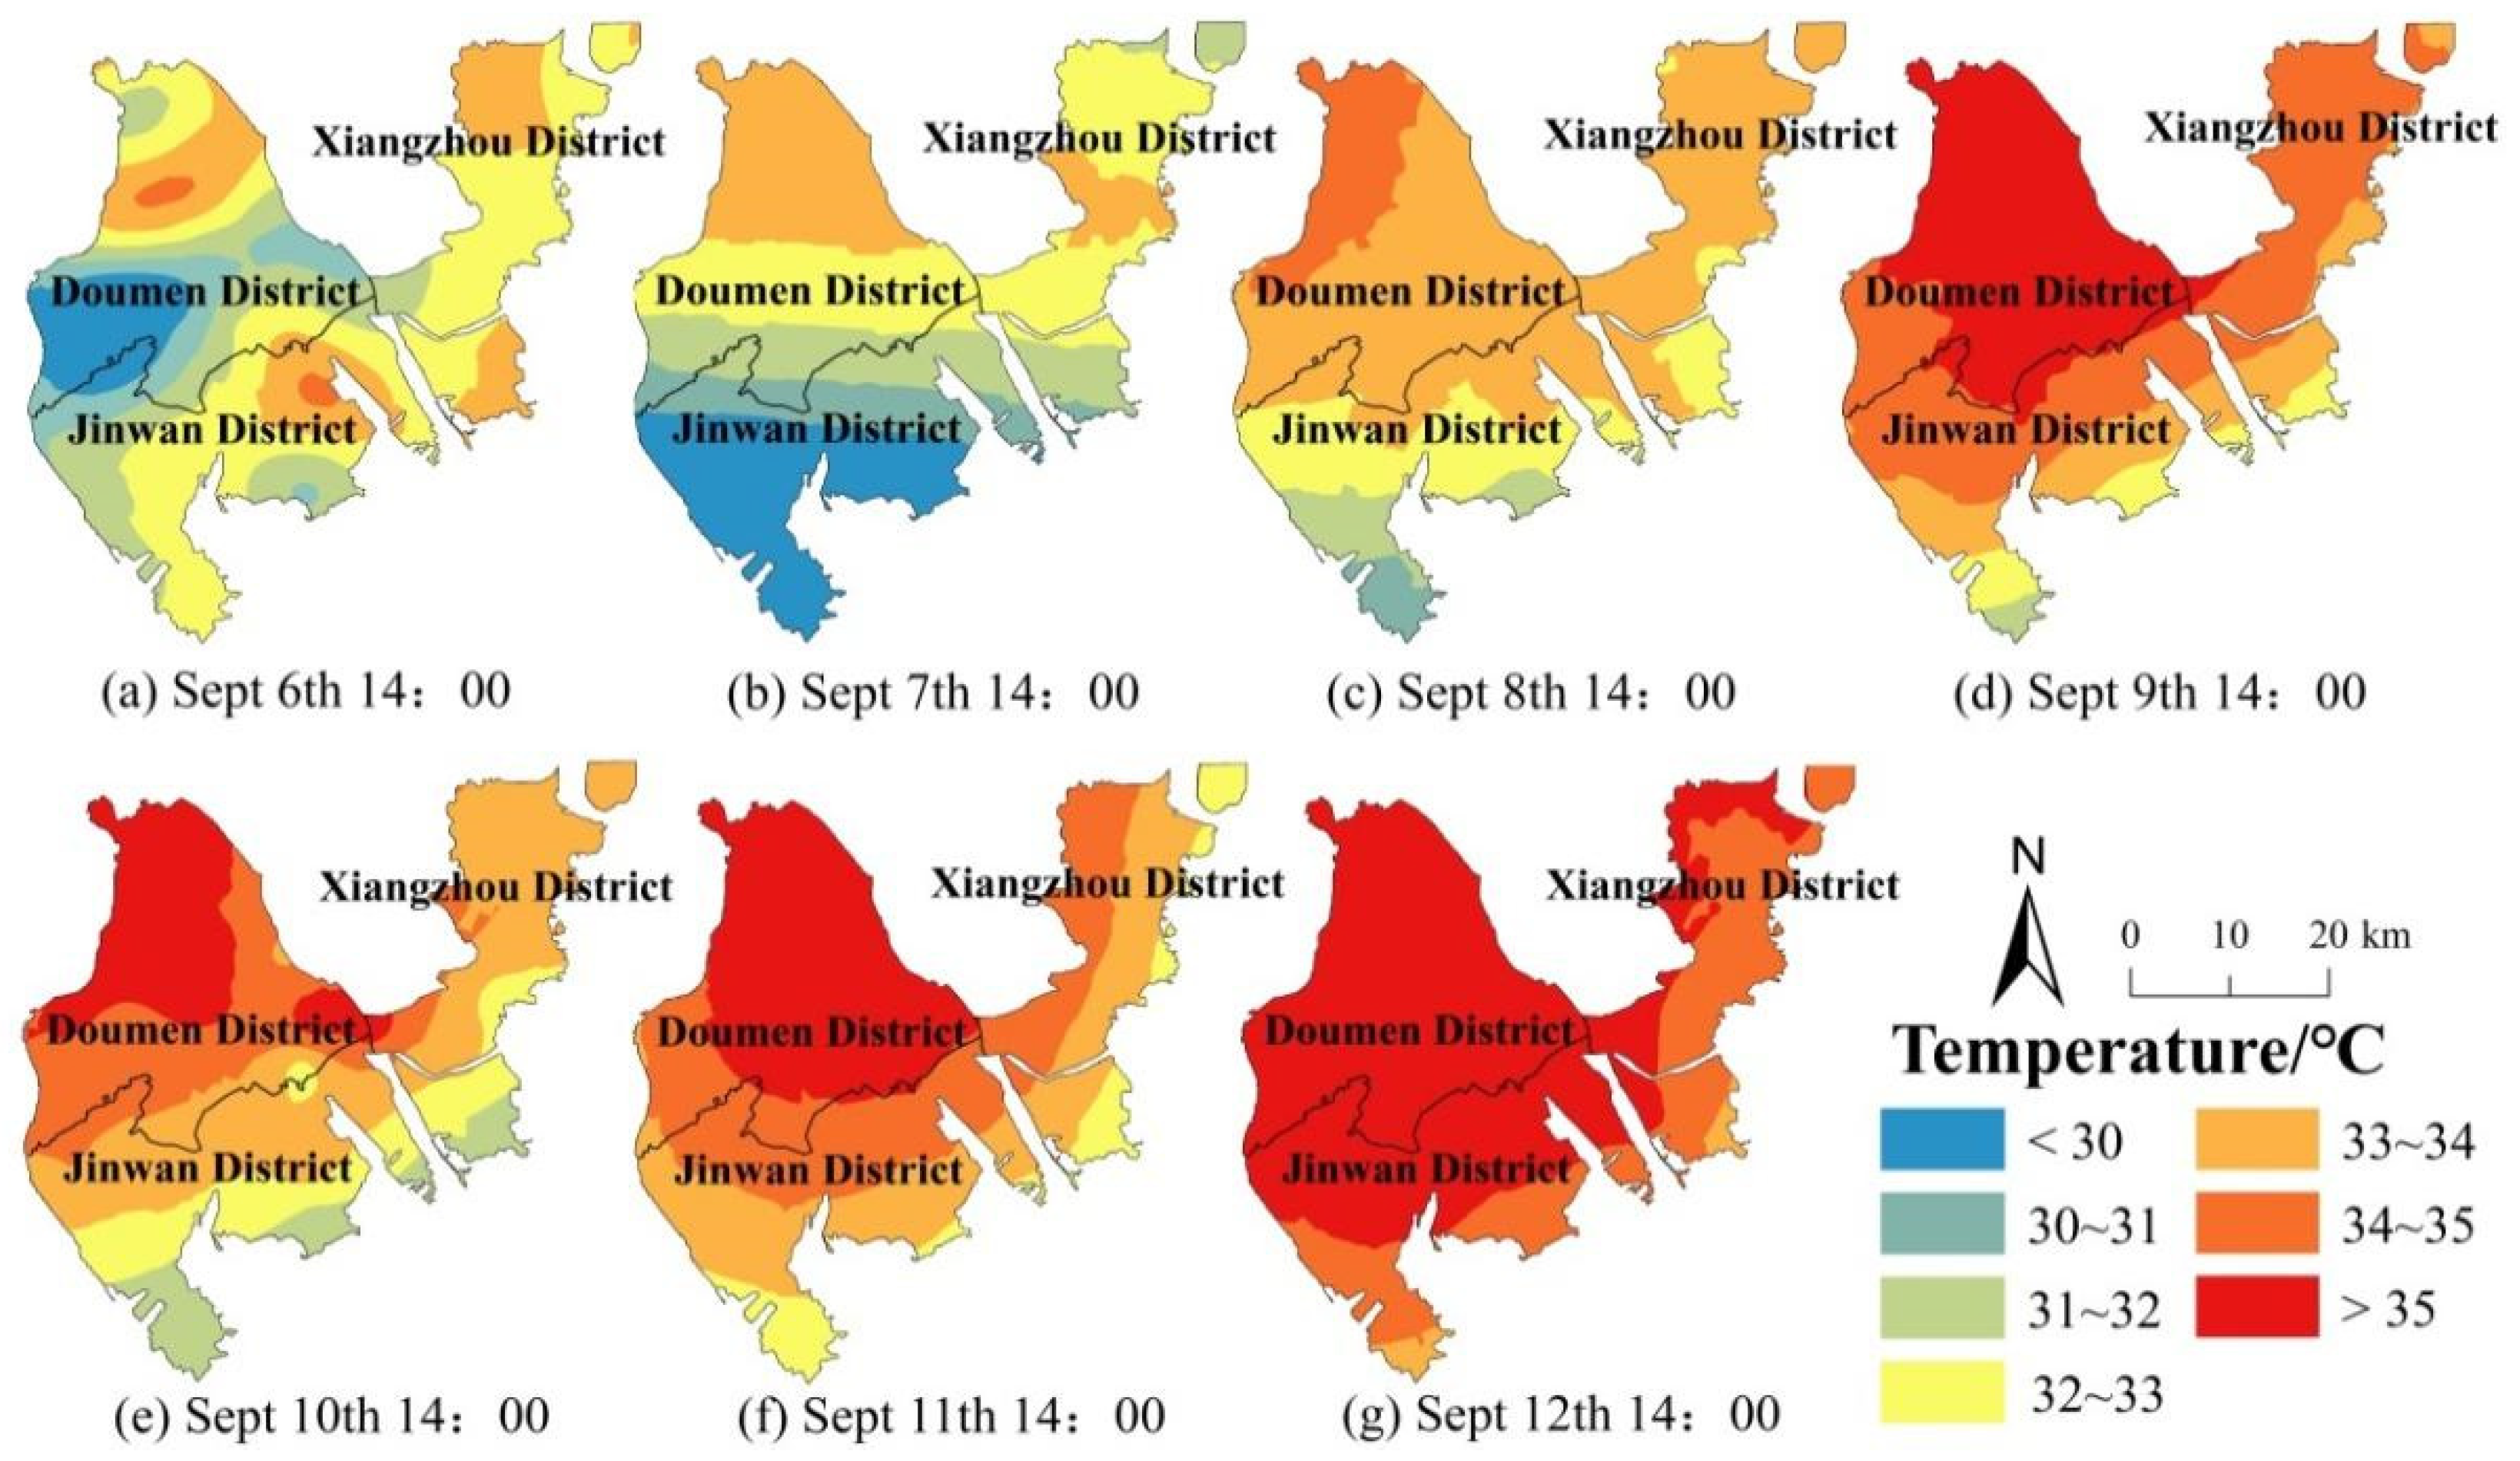
According to the temperature distribution map of Zhuhai City (
Figure 3), it shows that on 6 September and 8 September, some meteorological stations had short-term high temperatures at 13:00, 14:00, and 15:00. However, there is no significant high temperature phenomenon in the study area within the period. Throughout the entire heat wave incident, starting at 12:00 on 9 September, it gradually strengthened on 11 September and reached a peak on 12 September.
Table 1 shows the statistical results of the evolution of percentage of heat wave coverage over time from 12:00 to 18:00 during the study period, which lasted four days (9 September–12 September), starting at 12:00 on 9 September. The temperature dropped on 10 September, and the range of the heat wave expanded rapidly from 12:00 on 11 September, with a growth rate of 36.64 times that of 12:00 on 9 September. The duration was also delayed by 2 h from the previous 2 days. As of 12 September, the large-scale heat wave radiation effect appeared 2 h earlier than the previous 3 days. The heat wave coverage reached 71.57%, and the growth rate was 1.94 times of 9 September at 14:00.
According to the diurnal variation of temperature, the highest temperature in a day appears at 14:00. This article takes the spatial distribution of temperature at 14:00 during the heat wave cycle day as an example (
Figure 3). It shows that the temperature trend in Zhuhai City is generally distributed in a north–south direction or a southeast–northwest direction. The high temperature area (≥35 °C) in Zhuhai City has the characteristics of high in the north and low in the south, high in the northwest, and low in the southeast. The mountainous and coastal areas in the southeast of Jinwan District and east of Xiangzhou District are less affected by heat waves than other areas. Sustained high temperatures are mainly concentrated in most areas of Doumen District, the northern part of Jinwan District, and parts of western Xiangzhou District, where these areas have flatter terrain, higher population densities, and higher industrial densities. The dual effects of natural high temperature and man-made heat have caused the temperature in these areas to be higher than in other areas.
3.2. Temporal and Spatial Distribution Characteristics of Population Density
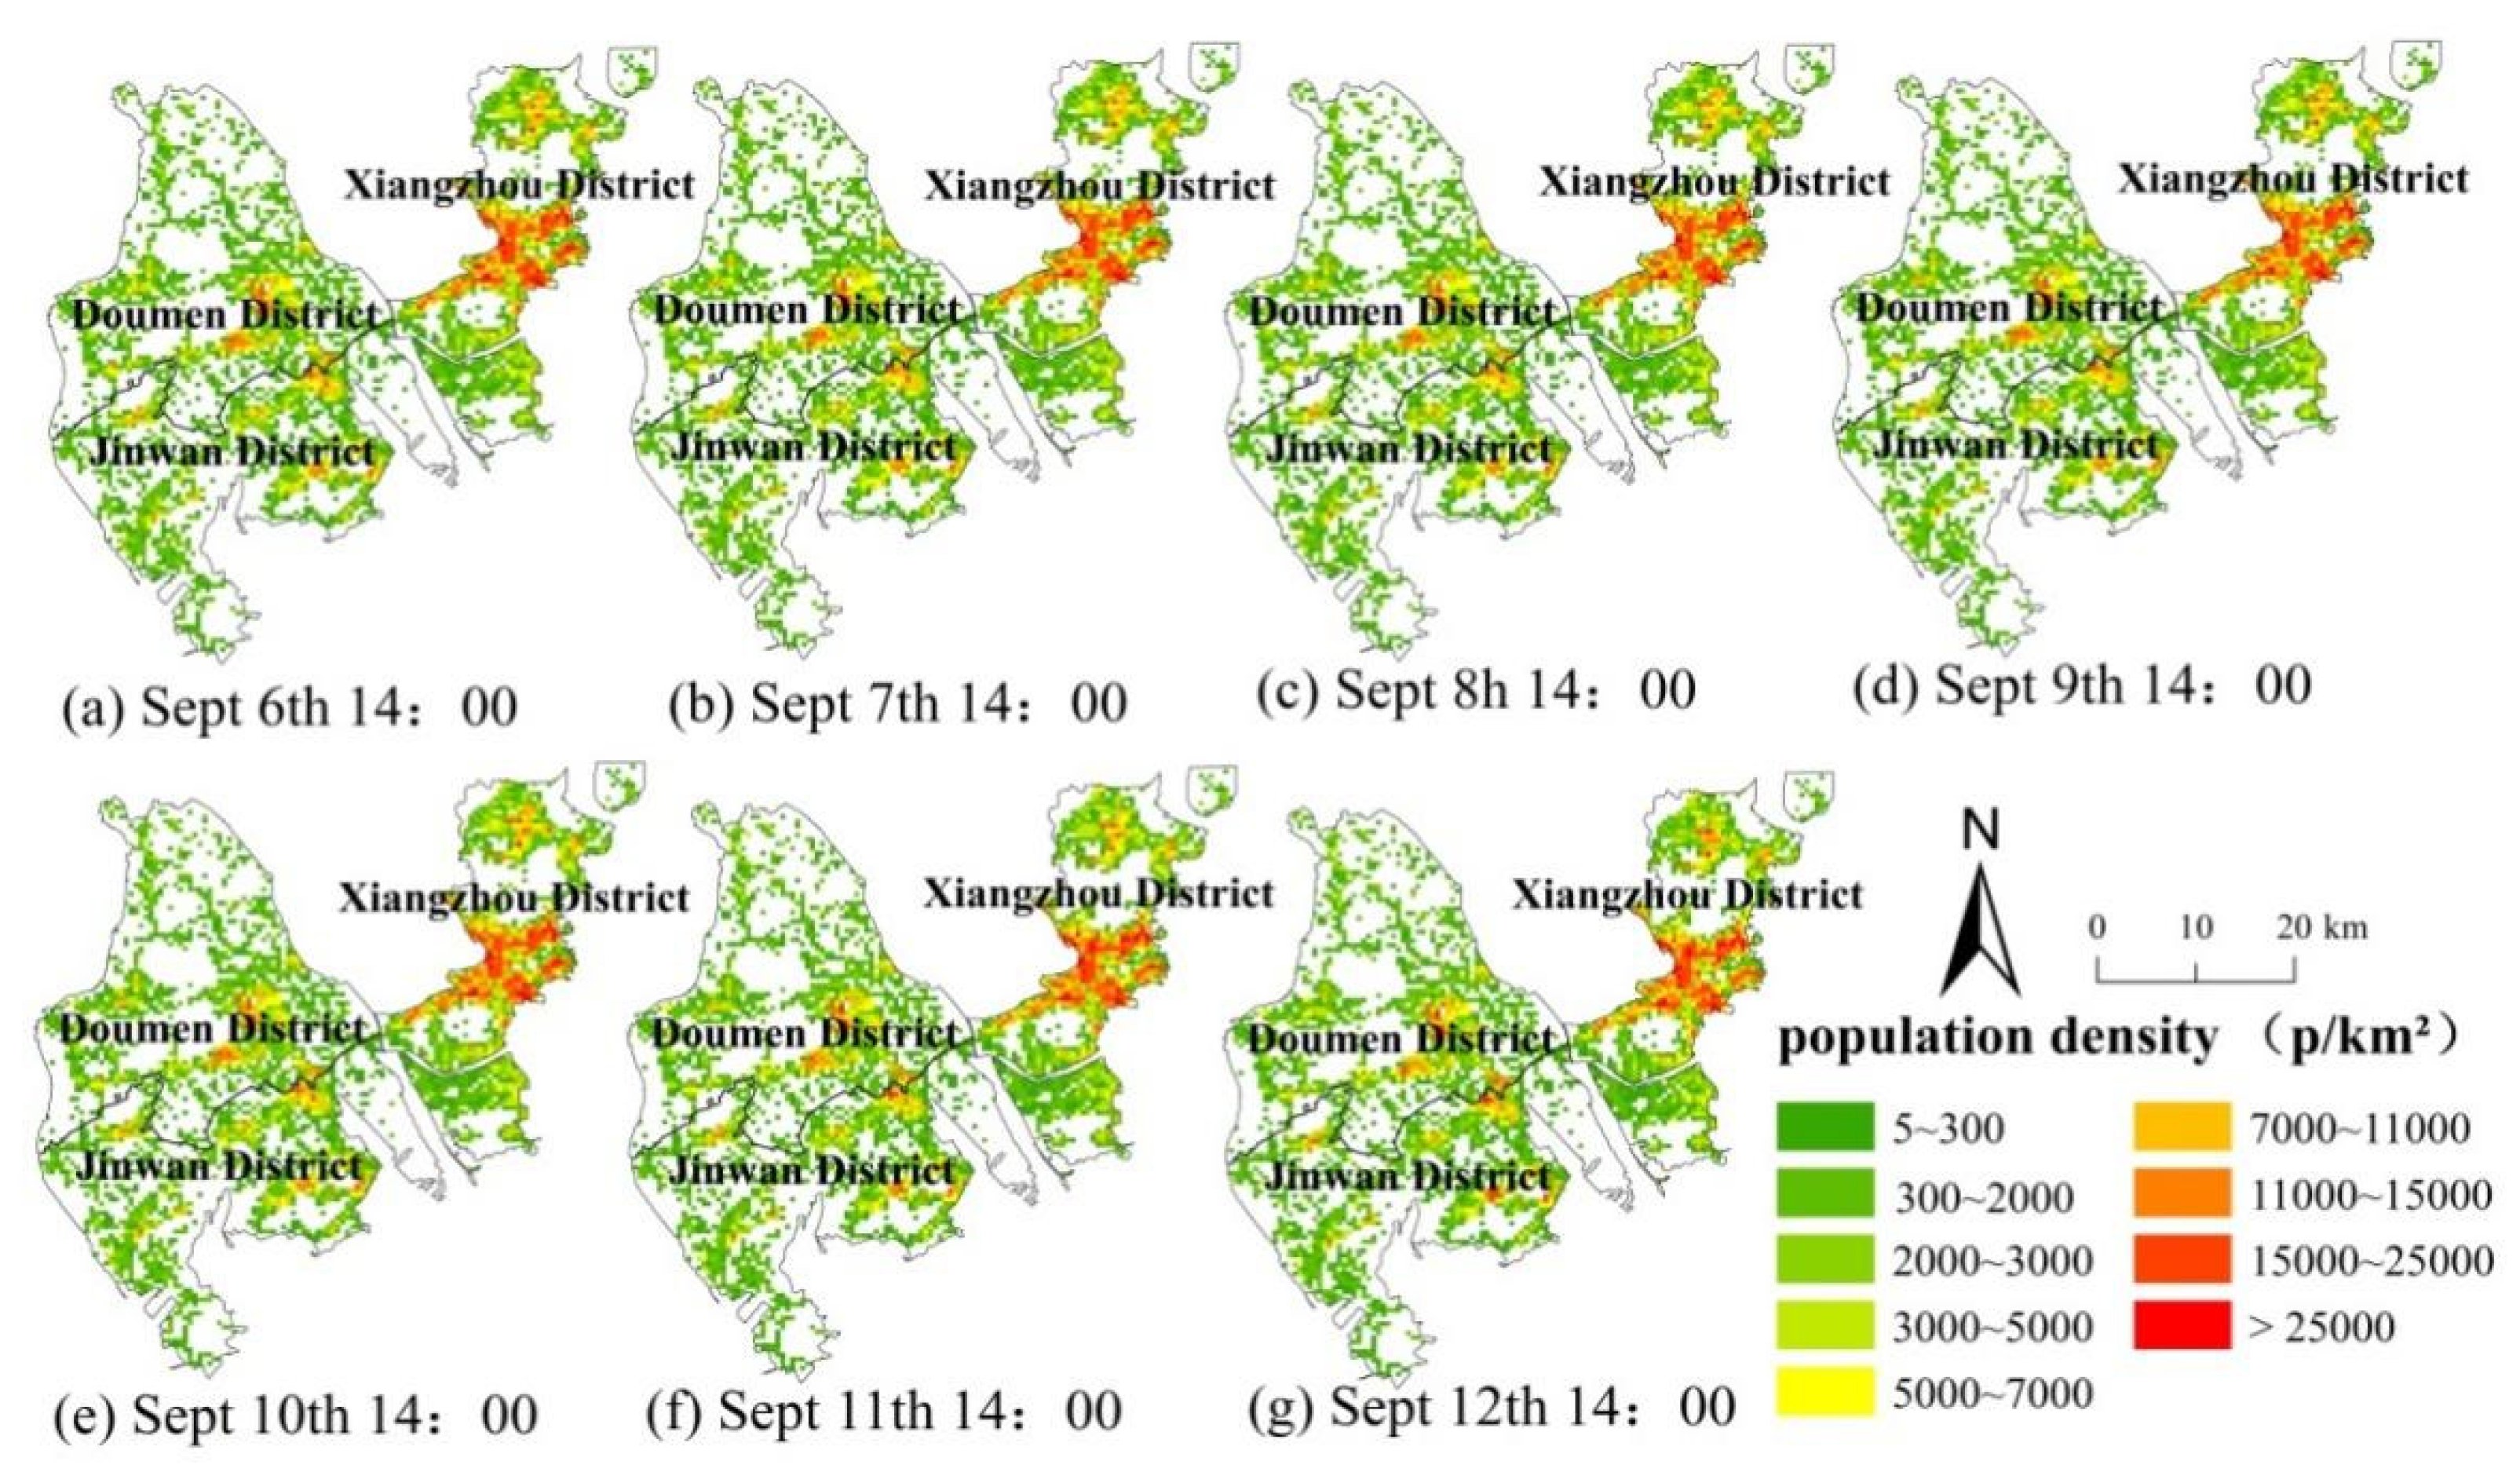
Based on the weighted calculation of hourly mobile phone data and statistical population data, the hourly population spatial distribution during the study period in Zhuhai City is obtained from 12:00 to 18:00.
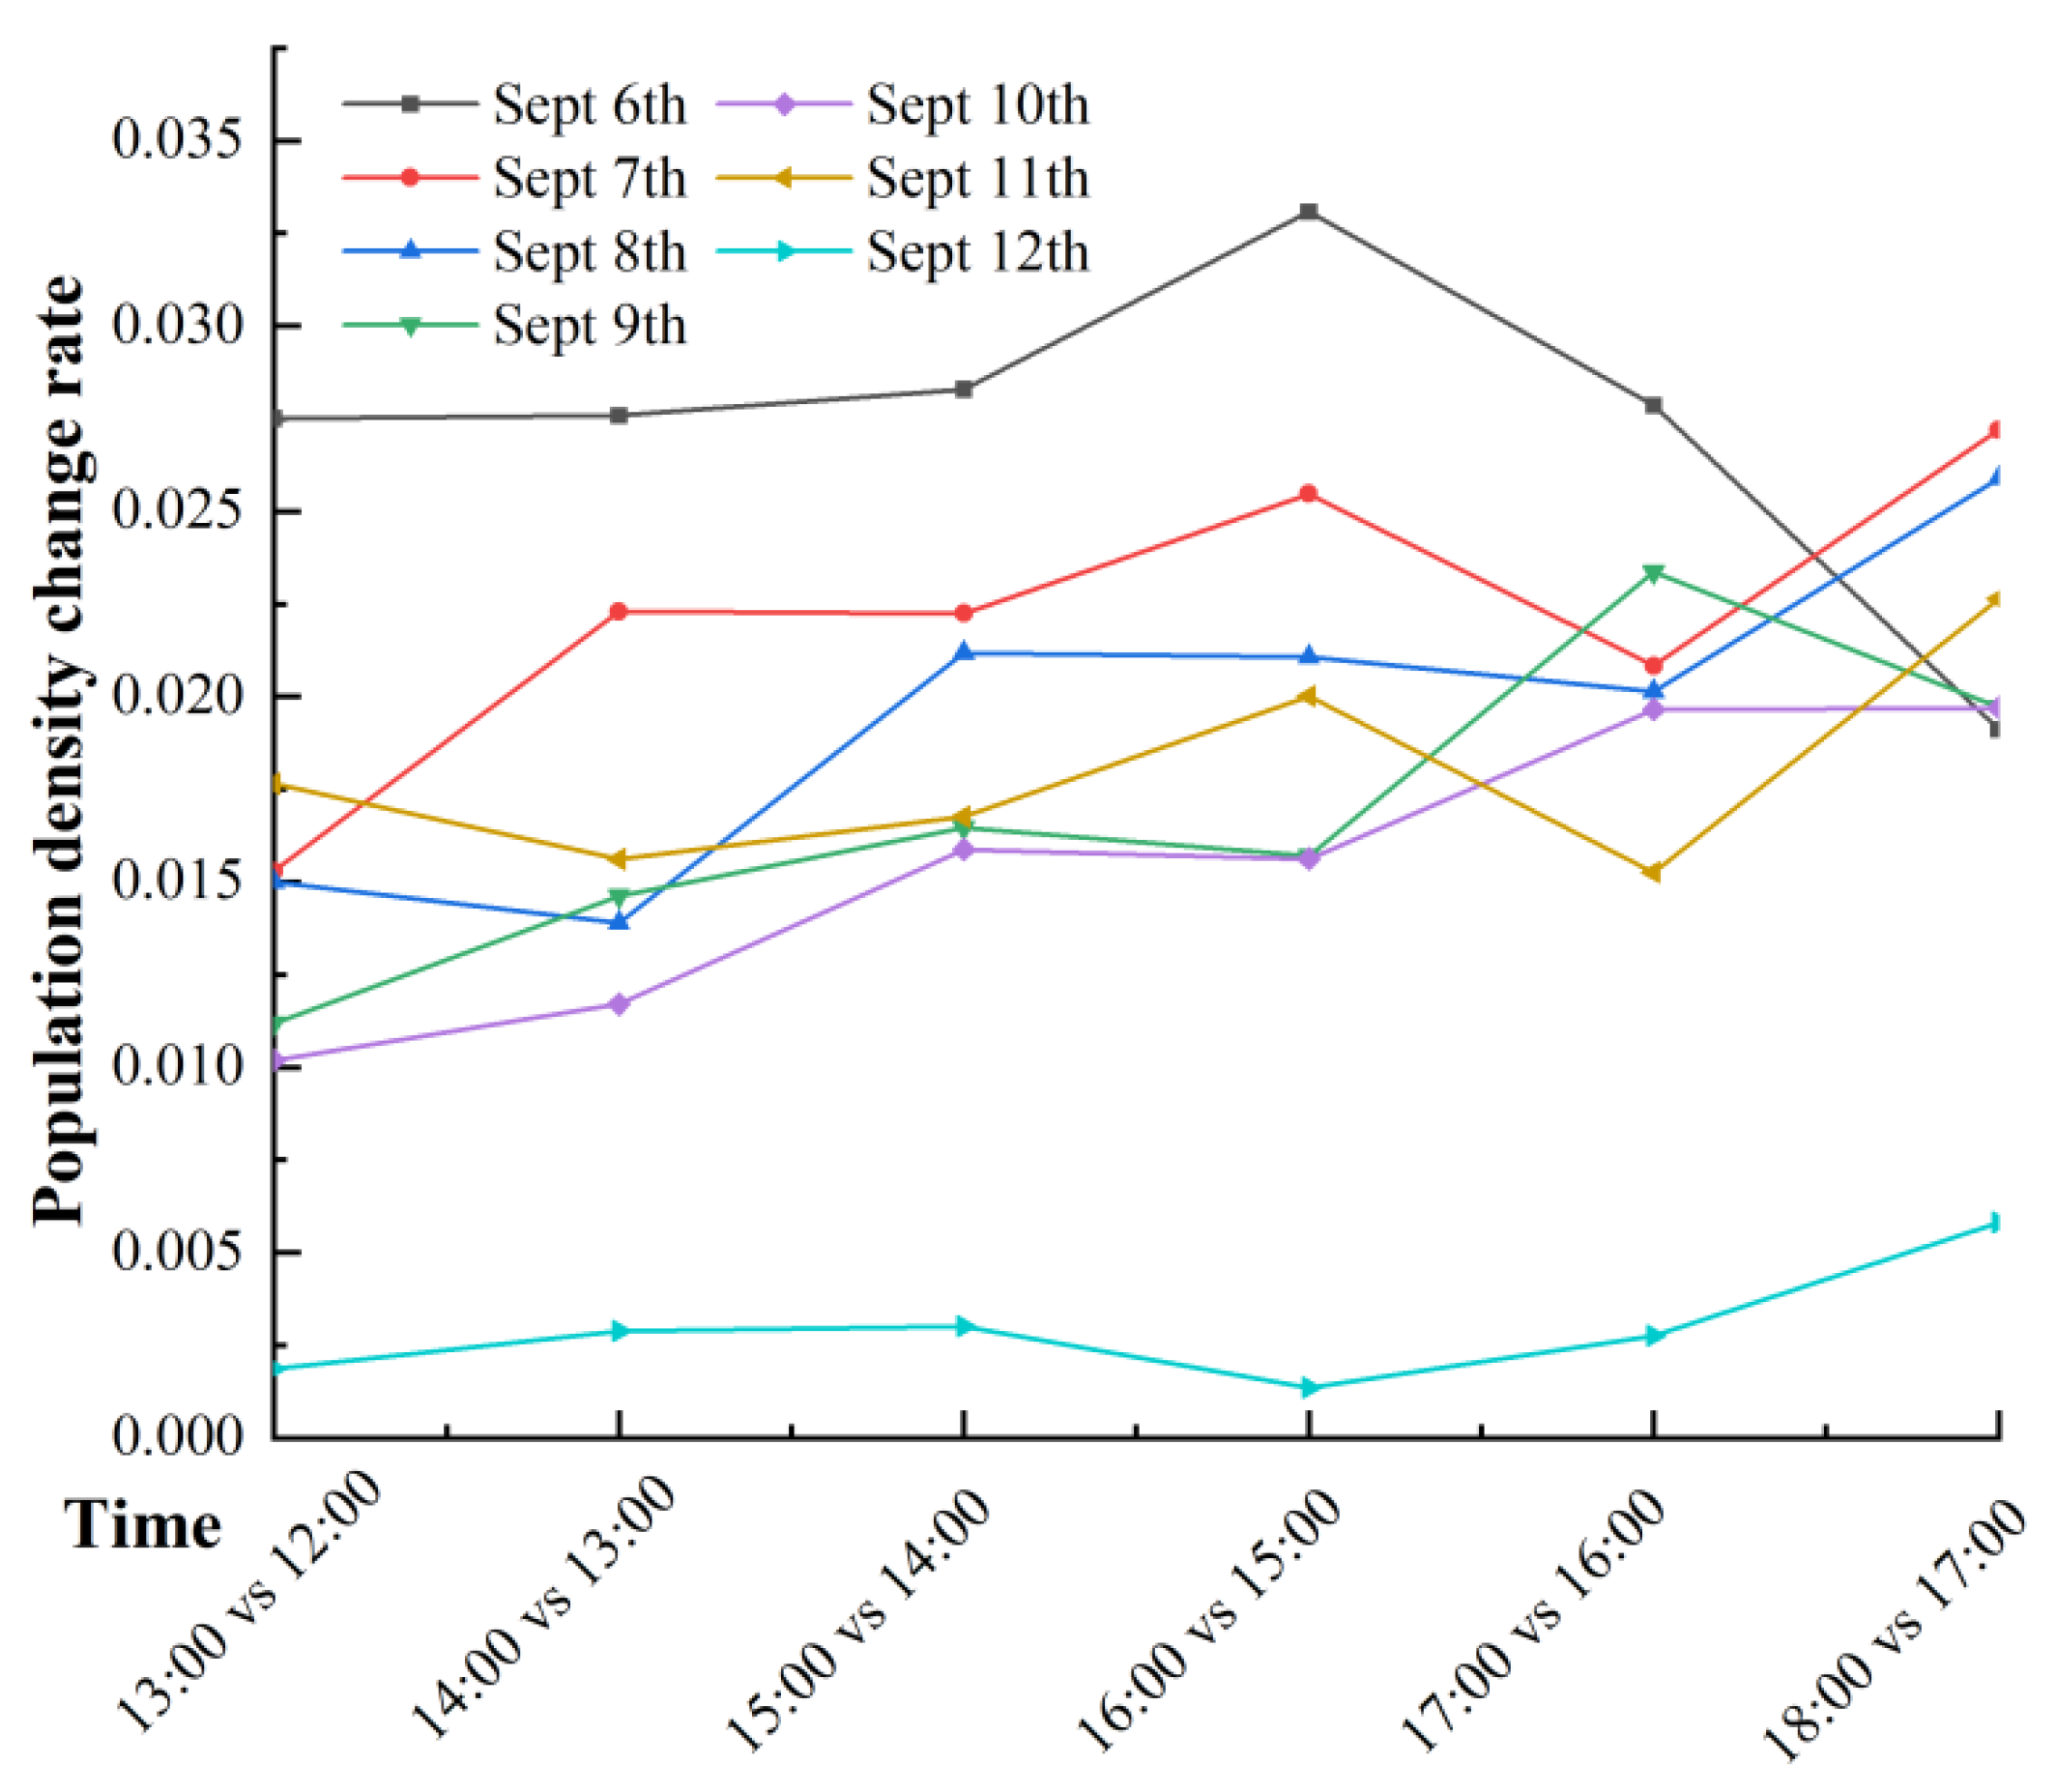
Figure 4 shows the population density distribution map at 14:00. It indicates that the high-value areas of population density are located in the central part of Xiangzhou District (the central city of Zhuhai City), and the low-value areas are scattered in the western area of Zhuhai City. The population spatial distribution of Zhuhai shows “less at both ends and more in the middle” in north–south direction; “more coastal areas in the east and less inland areas in the west” in east–west direction. The population density distribution of Doumen District and Jinwan District in the west is in a ring shape, while the Xiangzhou District in the east shows a clump distribution. Judging from the distribution trend, in the north–south direction, the population of Zhuhai City is concentrated at the central border of Doumen District and Jinwan District and the middle of Xiangzhou District. In the east–west direction, the population of Zhuhai City is mainly concentrated in the eastern coastal areas, and it is gradually decreasing to the western inland areas. During the study period, the population of Zhuhai City did not change much, and the areas with significant population increase were mainly scattered and dotted. From the daily hourly population density change rate during the study period (
Figure 5), the hourly population density change rate in Zhuhai City has the largest fluctuation on 6 September (Monday), and the smallest fluctuation occurred on 12 September (Sunday). Obviously, there are significantly more commuters on weekdays than on weekends. In addition, we can also see that the population density change rate of non-heat wave cycle days (6 September–8 September) during the study period is significantly higher than that of the heat wave cycle days (9 September–12 September). During the 4 days of the continuous heat wave, the hourly population density change rate decreased day by day. The sudden increase on 11 September (Saturday) was related to the increase in crowd travel activities. The high heat wave reached its peak on 12 September. The weather caused a decrease in outdoor activities, which explains that the population density change rate is the lowest compared to previous days.
3.3. Temporal and Spatial Characteristics of Population Exposure
In order to clarify the temporal and spatial distribution of population exposure during the heat wave period, this article defines the area below 35 °C as the heat wave zero exposure area, and people in this environment are accordingly deemed not to be harmed; meanwhile, for part of the time period when there is no population distribution in the heat wave area, the population exposure is counted as 0, and finally, the heat wave area containing the population distribution is regarded as the population exposure area under high temperature, and the hourly population exposure percentage analysis is carried out from 12:00 to 18:00. The statistical results are shown in
Table 2. By comparing
Figure 6, it shows that the time-to-hour exposure of the dynamic population is consistent with the time-to-hour high temperature range. The strongest heat wave population exposure was on 12 September, and the population exposure percentage was as high as 55.99%, followed by 9 and 11 September. It indicates that during the heat wave cycle, the population exposure of the first two days (9 September and 10 September) was mainly concentrated from 13:00 to 15:00, it began to fade at 16:00, and it finally hit 0 at 17:00 and 18:00; starting from 11 September, the population exposure starts to increase, when the time has been delayed by 2 h compared to previous two days, and the number of people affected by high temperature weather has increased. Taking the heat wave population exposure at 14:00 during the heat wave period (9 September–12 September) as an example, the population exposure to high temperature in Zhuhai is 543,900, 149,200, 479,000, and 1.214 million, respectively. Due to temperature changes on 10 September, the population exposure has decreased compared to 9 September. Starting on 11 September, the population exposure has increased, increasing by 3.2 times and 8.13 times, respectively, compared to 10 September. After 10 September, the population exposure of Zhuhai City has increased significantly. It is necessary to pay attention to negative impacts of high temperature on human health and focus on strengthening the early warning and prevention of high temperature.
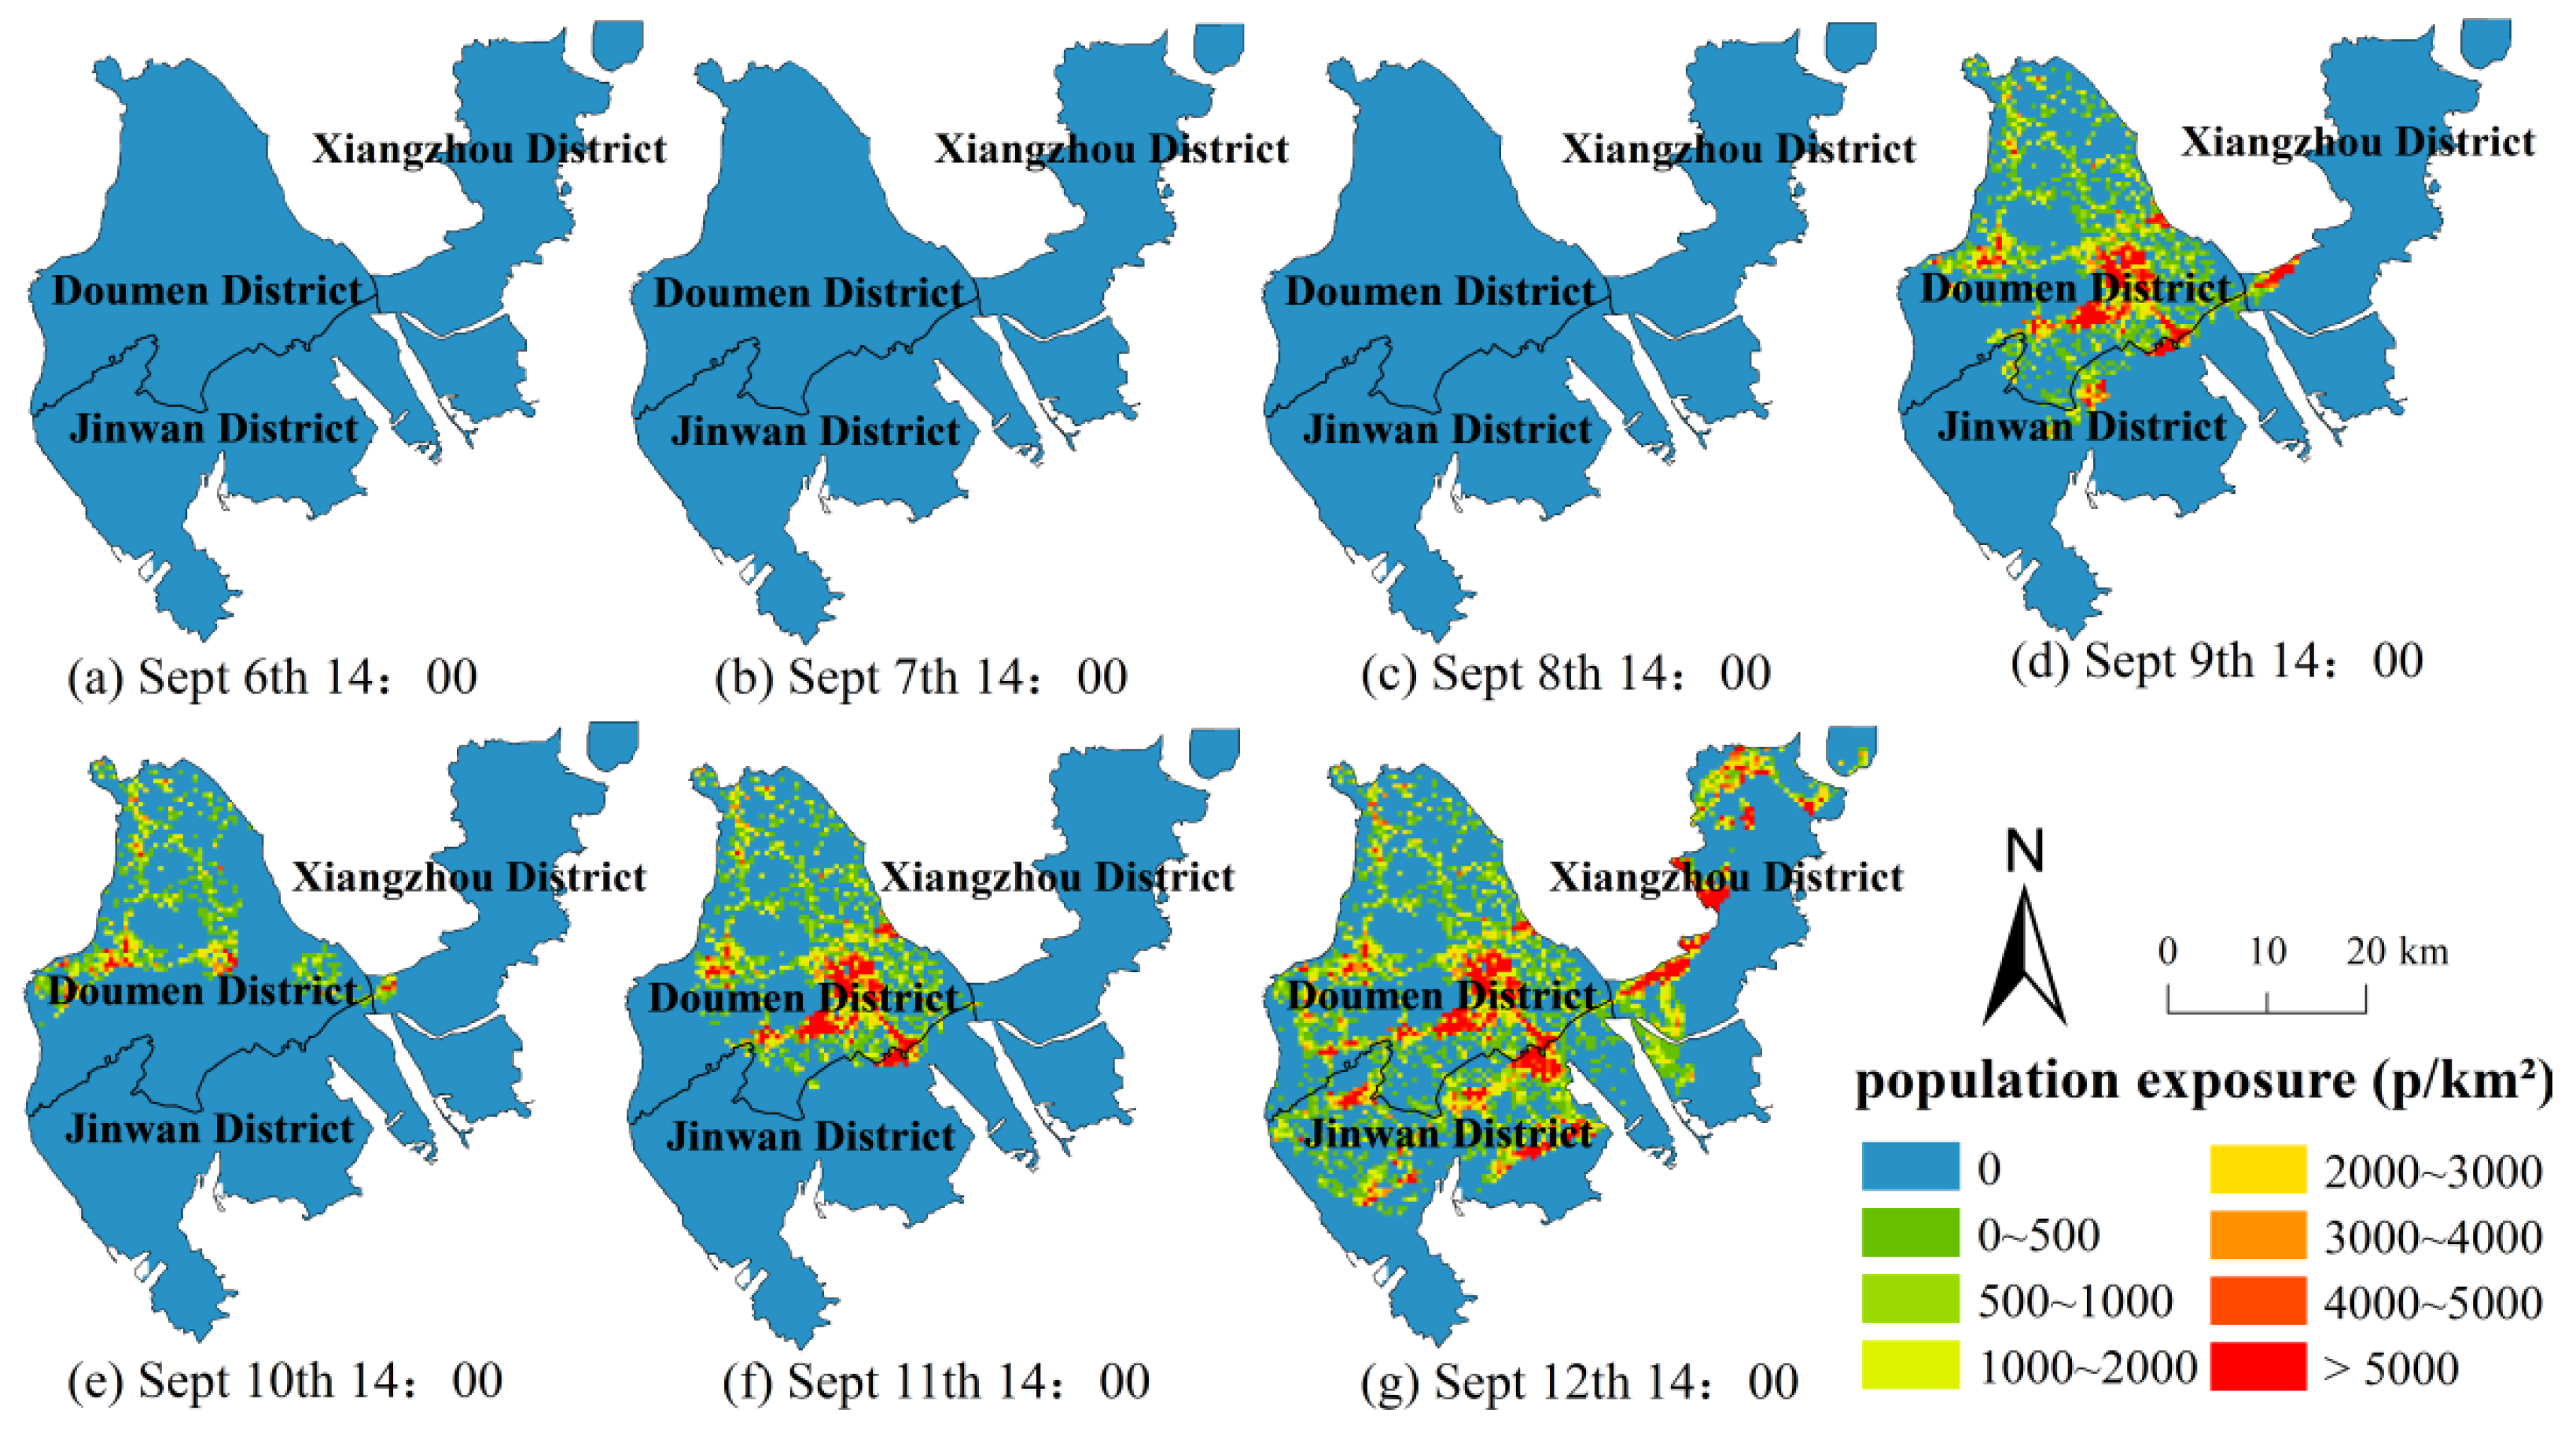
Taking the spatial distribution of temperature and population density in Zhuhai at 14:00 during the study period as the background, combined with the spatial distribution of population exposure at the same time (
Figure 6), it indicates that the persistent heat wave concentration area is always in Doumen District. The population in the north and west regions of the district is distributed in a circular pattern, with population exposure between 0~1000/person (km
2), which is at a relatively low level; Jingan Town and Baiteng Sub-districts in the east region with the most primary/secondary schools, colleges, office buildings, and residential areas have a population exposure rate higher than 5000 per person (km
2).
3.4. Analysis of Factors Affecting the Change of Population Exposure under Heat waves
Changes in population exposure under heat waves not only depend on climatic factors (temperature) but also on the scale of the population and its distribution. Looking into heat wave cycle (
Table 3) on 10 September, compared to 9 September, the population exposure change on 10 September is mainly affected by population factors, while the population exposure changes in the last two days of the heat wave cycle are mainly affected by the combined influence of population factors and climate factors.
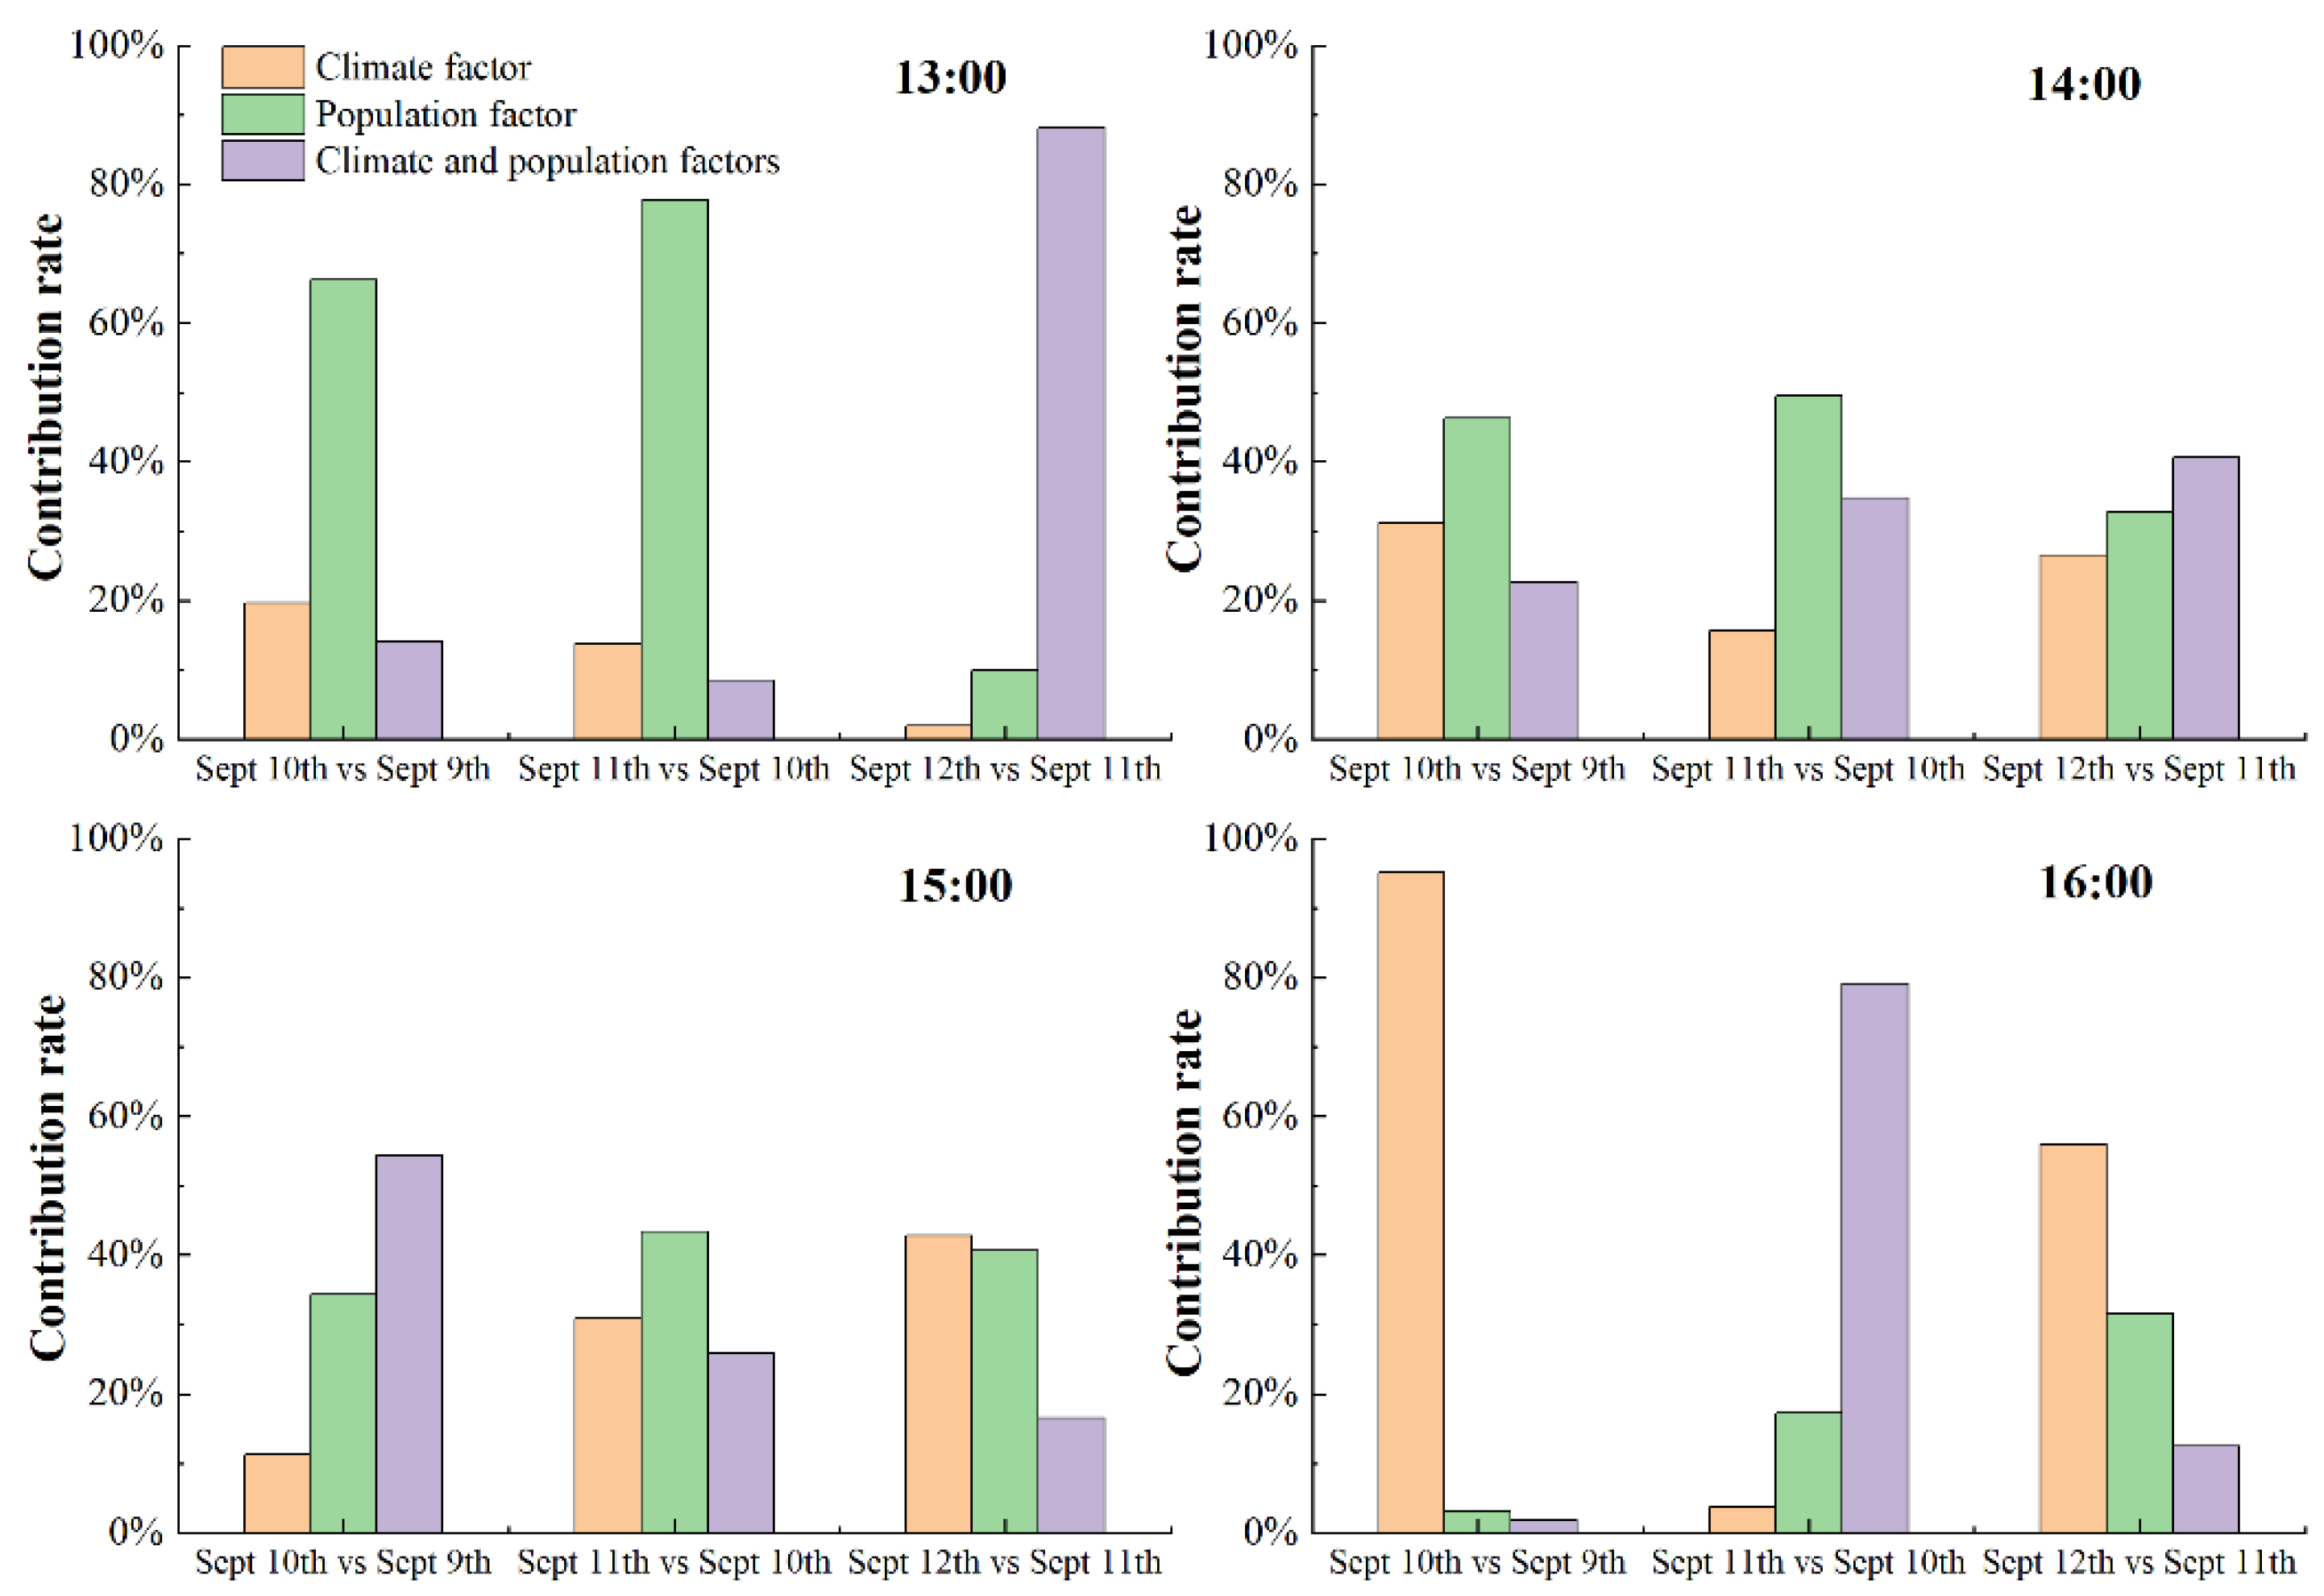
Considering that the population exposure of Zhuhai City under the heat wave incident mainly appeared at 13:00, 14:00, 15:00, and 16:00, only the factors affecting the changes in population exposure at these timestamps were analyzed (
Figure 7). From the perspective of different periods of the heat wave cycle, the leading factors of population exposure changes are different. From 13:00 and 14:00, the changes in population exposure between 10 September and 9 September and 11 September and 10 September are most affected by the population factor. The change in population exposure between 12 September and 11 September is mainly affected by the combined effects of climatic factors and population factors. At other time points, the dominant factors affecting population exposure changes on each day of the heat wave cycle are different. Comparing the contribution rate of each factor in the heat wave cycle, it shows that the population factor’s contribution rate of exposure changes gradually decreases, and its contribution rate gradually decreases from 66.16% and 77.69% to 3.13% and 17.19% between 10 September and 9 September and 11 September and 10 September, respectively. The contribution rate of climate factors to changes in population exposure has shown an increasing trend over time between 11 September and 10 September and between 12 September and 11 September. The comprehensive influence of climate factors and population factors has no obvious regularity in each period.
4. Summary and Discussion
This paper analyzes the population exposure situation in Zhuhai City under one heat wave incident from the perspective of geography. The real-time weather station data and mobile phone data present the temperature changes and population distribution in Zhuhai City more accurately, which helps to reveal the changes in population exposure under high temperature and to identify the hot spots of population exposure changes. Meanwhile, this article also analyzes the influencing factors of population exposure changes under high temperature, which has certain practical guiding significance for more effective high temperature warning and high temperature disaster risk prevention.
This paper finds that population exposure under heat waves is not only related to climate factors but also related to population factors. Areas with high population density and that are economically developed may not necessarily have high population exposure, and vice versa. In general, the population exposure of Zhuhai City has increased significantly during this high temperature cycle. Although it is not concentrated in the downtown area of Zhuhai, most of the other areas are affected by the high temperature. It is worth noting that the population exposure areas are mainly concentrated near schools, commercial buildings, industrial parks, and residential areas. The population in these areas is susceptible to high temperatures and has weak adaptability to high temperatures. In fact, indoor and outdoor population heat exposure is different [
62,
63,
64], and the resident’s age, gender, occupation, disease status, medical resources, economic level, and other factors will affect the degree of residents’ response to high temperatures and heat waves. Especially, construction workers, couriers, and takeaway delivery workers who work under high temperature exposure are mobile sensitive groups that need urgent attention under heat waves [
65,
66]. Therefore, these areas should focus on strengthening the early warning and prevention of high temperature, and this article needs to make improvements in the above aspects.
However, the research in this article still has some shortcomings: First, in terms of data acquisition, it is difficult to obtain hourly meteorological data throughout the year. In addition, mobile phone data are confidential and are difficult to obtain. Therefore, this paper only analyzes the population exposure under one typical heat wave incident during the data collection period. As far as the heat wave incidents occurring in history, this is only an ordinary heat wave incident. In fact, a typical event in history is more convincing [
67]. Secondly, in terms of methods, for the analysis of the influencing factors affecting population exposure under heat waves, this paper discusses the two aspects of climate factors and population factors at the macro-scale. In fact, urban structure, socioeconomic status, and urban ecological conditions at the micro-scale also have an impact on population exposure to heat waves, which is not explored in this paper [
12,
50,
51]. Finally, the results of this paper only refer to the population exposure situation in Zhuhai City under one heat wave event, which can contribute to the disaster prevention and mitigation planning of Zhuhai City and are not universally representative. If more abundant data can be obtained in the future, we will improve the above shortcomings.
5. Conclusions
This paper selected Zhuhai City as the heat wave research area. Taking a heat wave incident in September 2021 as an example, based on Zhuhai city’s hourly meteorological data, statistical population data, and hourly mobile phone data, the three types of data are spatialized to a 500 m × 500 m grid. Based on the high temperature distribution characteristics and the population weighting model, the qualitative and quantitative analysis of the population exposure situation by time under the influence of heat waves is carried out. At the same time, the influencing factors of population exposure changes were studied on this basis. The main conclusions are as follows:
(1) The results show a dynamicity in heat wave coverage which adjusts to temporal and spatial differences, and the coverage of the heat wave has an “increasing-decreasing-increasing” pattern over time. The heat wave was concentrated from 12:00 to 18:00, and from a spatial perspective, the area of heat wave coverage in west and north side of the city is bigger and lasts longer than in the east and south side regions.
(2) On the whole, the high-value areas of population density are located in central part of Xiangzhou District (the central city of Zhuhai City), and the low-value areas are scattered in the western area of Zhuhai City. The population spatial distribution of Zhuhai shows “less at both ends and more in the middle” in the north–south direction and “more coastal areas in the east and less inland areas in the west” in the east–west direction. The population density distribution of Doumen District and Jinwan District in the west is in a ring shape, while the Xiangzhou district in the east shows a clump distribution. Judging from the distribution trend, in the north–south direction, the population of Zhuhai City is concentrated at the central border of Doumen District and Jinwan District and the middle of Xiangzhou District. In the east–west direction, the population of Zhuhai City is mainly concentrated in the eastern coastal areas, and it is gradually decreasing to the western inland areas.
(3) The downtown area of Zhuhai (the central area of Xiangzhou District) is less affected by this heat wave incident, but most areas are affected by high temperature. The hourly population exposure is direct proportional to hourly heat wave coverage. In terms of the time dimension, the overall population exposure shows a trend of first decreasing and then increasing. In terms of spatial dimensions, high population exposure is concentrated in areas such as Jing’an Town and Baiteng Street in Doumen District. These areas are densely populated areas such as primary and secondary schools, colleges and universities, office buildings, and residential areas. Not only that, but high population exposure is also distributed in the area where industrial parks and commercial buildings are widely distributed in the east of Jinwan District. Low exposure is distributed in most of Xiangzhou District and the mountainous areas along the southern coast of Jinwan District due to topography.
(4) Looking into the heat wave cycle, compared to 9 September, the population exposure change on 10 September is mainly affected by population factors, but its contribution to population exposure changes gradually decreases over time. In other periods, the contribution rate of climate factors to changes in population exposure is gradually increasing, and the population exposure changes in the last two days of the heat wave cycle are mainly affected by the combined influence of population factors and climate factors. From the perspective of different periods of the heat wave cycle, the leading factors of population exposure changes are different.
Author Contributions
Conceptualization, J.L., Y.S. and P.G.; data curation, J.L., Y.S. and Z.L.; formal analysis, J.L., P.G., X.Z. and X.P.; funding acquisition, Y.S.; investigation, P.G., Z.L., X.Z. and X.P.; methodology, J.L. and Y.S.; resources, P.G.; software, P.G. and Z.L.; supervision, Y.S.; validation, J.L.; visualization, X.Z.; writing—original draft, J.L.; writing—review and editing, J.L. and Y.S. All authors have read and agreed to the published version of the manuscript.
Funding
This research was funded by the National Natural Science Foundation of China: 41001022.
Institutional Review Board Statement
Not applicable.
Informed Consent Statement
Not applicable.
Data Availability Statement
Not applicable.
Acknowledgments
Special thanks to anonymous reviewers for their valuable comments. In addition, the authors gratefully acknowledge Jie Liu and Fanyang Qian for assisting with the data preparation and grammar revision.
Conflicts of Interest
The authors declare no conflict of interest. The funders had no role in the design of the study; in the collection, analyses, or interpretation of data; in the writing of the manuscript, or in the decision to publish the results.
References
- IPCC. An IPCC Special Report on the Impacts of Global Warming of 1.5 °C above Pre-Industrial Levels and Related Global Greenhouse Gas Emission Pathways. Available online: https://www.ipcc.ch/sr15/ (accessed on 4 December 2021).
- World Economic Forum. The Global Risks Report 2021. Available online: https://www.weforum.org/reports/the-global-risks-report-2021,2021-01-19 (accessed on 4 December 2021).
- Meehl, G.; Tebaldi, C. More Intense, More Frequent, and Longer Lasting Heat Waves in the 21st Century. Science 2004, 305, 994–997. [Google Scholar] [CrossRef] [Green Version]
- Bell, A.M.L. Heat Waves in the United States: Mortality Risk during Heat Waves and Effect Modification by Heat Wave Characteristics in 43 U.S. Communities. Environ. Health Perspect. 2011, 119, 210–218. [Google Scholar]
- Im, E.S.; Pal, J.S.; Eltahir, E. Deadly heat waves projected in the densely populated agricultural regions of South Asia. Sci. Adv. 2017, 3, e1603322. [Google Scholar] [CrossRef] [Green Version]
- Xia, Y.; Li, Y.; Guan, D.B.; Tinoco, D.M.; Xia, J.J.; Yan, Z.W.; Yang, J.; Liu, Q.Y.; Huo, H. Assessment of the economic impacts of heat waves: A case study of Nanjing, China. J. Clean. Prod. 2017, 171, 811–819. [Google Scholar] [CrossRef] [Green Version]
- Xue, Q.; Xie, M.M.; Guo, Q.; Wang, Y.N.; Wu, R.R.; Liu, Q. Research progress on urban heat wave vulnerability assessment: A geographical perspective. Prog. Geogr. 2020, 39, 685–694. [Google Scholar] [CrossRef]
- QX/T 595-2021; Meteorological Industry Standard of the People’s Republic of China. Meteorological Press: Beijing, China, 2021.
- Gao, J.H.; Sun, Y.Z.; Liu, Q.Y.; Zhou, M.G.; Lu, Y.G.; Li, L.P. Impact of extreme high temperature on mortality and regional level definition of heat wave: A multi-city study in China. Sci. Total Environ. 2015, 505, 535–544. [Google Scholar] [CrossRef] [PubMed]
- Liu, G.L.; Zhang, L.C.; He, B.; Jin, X.; Zhang, Q.; Razafindrabe, B.; You, H.L. Temporal changes in extreme high temperature, heat waves and relevant disasters in Nanjing metropolitan region, China. Nat. Hazards 2015, 76, 1415–1430. [Google Scholar] [CrossRef]
- Jedlovec, G.; Crane, D.; Quattrochi, D. Urban Heat Wave Hazard and Risk Assessment. Results Phys. 2017, 7, 4294–4295. [Google Scholar] [CrossRef]
- Huang, D.P.; Zhang, L.; Gao, G.; Sun, S. Changes in population exposure to high temperature under a future scenario in China and its influencing factors. Acta Geogr. Sin. 2018, 28, 1371–1384. [Google Scholar]
- Ding, T.; Qian, W.; Yan, Z. Changes in hot days and heat waves in China during 1961–2007. Int. J. Climatol. 2009, 30, 1452–1462. [Google Scholar] [CrossRef]
- Habeeb, D.; Vargo, J.; Stone, B. Rising heat wave trends in large US cities. Nat. Hazards 2015, 76, 1651–1665. [Google Scholar] [CrossRef]
- Schoetter, R.; Cattiaux, J.; Douville, H. Changes of western European heat wave characteristics projected by the CMIP5 ensemble. Clim. Dyn. 2015, 45, 1601–1616. [Google Scholar] [CrossRef]
- Wang, W.W.; Zhou, W.; Li, X.Z.; Wang, X.; Wang, D.X. Synoptic-scale characteristics and atmospheric controls of summer heat waves in China. Clim. Dyn. 2016, 46, 2923–2941. [Google Scholar] [CrossRef]
- Shin, J.; Olson, R.; An, S.I. Projected Heat Wave Characteristics over the Korean Peninsula During the Twenty-First Century. Asia-Pac. J. Atmos. Sci. 2018, 54, 53–61. [Google Scholar] [CrossRef]
- Naveena, N.; Satyanarayana, G.C.; Rao, K.K.; Umakanth, N.; Srinivas, D. Heat wave characteristics over India during ENSO events. J. Earth. Syst. Sci. 2021, 130, 166. [Google Scholar] [CrossRef]
- Naveena, N.; Satyanarayana, G.C.; Rao, K.K.; Umakanth, N.; Srinivas, D. Changes in daily climate extremes in China and their connection to the large scale atmospheric circulation during 1961–2003. Clim. Dyn. Obs. Theor. Comput. Res. Clim. Syst. 2011, 36, 2399–2417. [Google Scholar]
- Trenberth, K.E.; Fasullo, J.T. Climate extremes and climate change: The Russian heat wave and other climate extremes of 2010. J. Geophys. Res.-Atmos. 2012, 117, 127–135. [Google Scholar] [CrossRef]
- Min, S.K.; Son, S.W.; Seo, K.H.; Kug, J.S.; An, S.I.; Choi, Y.S.; Jeong, J.H.; Kim, B.M.; Kim, J.W.; Kim, Y.H.; et al. Changes in weather and climate extremes over Korea and possible causes: A review. Asia-Pac. J. Atmos. Sci. 2015, 51, 103–121. [Google Scholar] [CrossRef]
- Luterbacher, J.; Dietrich, D.; Xoplaki, E.; Grosjean, M.; Wanner, H. European Seasonal and Annual Temperature Variability, Trends, and Extremes Since 1500. Science 2004, 303, 1499–1503. [Google Scholar] [CrossRef] [Green Version]
- Shi, J.; Tang, X.; Cui, L. Climatic characteristics of high temperature in East China during 1961–2005. J. Geogr. Sci. 2008, 18, 283–294. [Google Scholar] [CrossRef]
- Kim, O.Y.; Wang, B.; Shin, S.H. How do weather characteristics change in a warming climate? Clim. Dyn. 2013, 41, 3261–3281. [Google Scholar] [CrossRef]
- Blumberg, G.; DPhil, S.M. Assessing the Potential Impact of Heat Waves in Cities: Implications for Hazard Preparation and Planning. Procedia Econ. Financ. 2014, 18, 727–735. [Google Scholar] [CrossRef] [Green Version]
- Chen, K.; Bi, J.; Chen, J.; Chen, X.D.; Huang, L.; Zhou, L. Influence of heat wave definitions to the added effect of heat waves on daily mortality in Nanjing, China. Sci. Total Environ. 2015, 506, 18–25. [Google Scholar] [CrossRef] [PubMed]
- Zuo, J.; Pullen, S.; Palmer, J.; Bennetts, H.; Chileshe, N.; Ma, T. Impacts of heat waves and corresponding measures: A review. J. Clean. Prod. 2015, 92, 1–12. [Google Scholar] [CrossRef]
- Zaidi, R.Z.; Pelling, M. Institutionally configured risk: Assessing urban resilience and disaster risk reduction to heat wave risk in London. Urban Stud. 2015, 52, 1218–1233. [Google Scholar] [CrossRef]
- Huang, X.; Li, Y.; Guo, Y.; Zheng, D.; Qi, M. Assessing Urban Risk to Extreme Heat in China. Sustainability 2020, 12, 2750. [Google Scholar] [CrossRef] [Green Version]
- Lee, S.H.; Kang, J.E.; Park, C.S.; Yoon, D.K.; Yoon, S. Multi-risk assessment of heat waves under intensifying climate change using Bayesian Networks. Int. J. Disast. Risk Reduct. 2020, 50, 101704. [Google Scholar] [CrossRef]
- Eid, C.E.; O’Neill, M.S.; Gronlund, C.J.; Brines, S.J.; Brown, D.G.; Diez-Roux, A.V.; Schwartz, J. Mapping Community Determinants of Heat Vulnerability. Environ. Health Perspect. 2009, 117, 1730–1736. [Google Scholar]
- Wolf, J.; Adger, W.N.; Lorenzoni, I.; Abrahamson, V.; Raine, R. Social capital, individual responses to heat waves and climate change adaptation: An empirical study of two UK cities. Glob. Environ. Chang. 2010, 20, 44–52. [Google Scholar] [CrossRef]
- Depietri, Y.; Welle, T.; Renaud, F.G. Social vulnerability assessment of the Cologne urban area (Germany) to heat waves: Links to ecosystem services. Int. J. Disast. Risk Reduct. 2013, 6, 98–117. [Google Scholar] [CrossRef]
- Benmarhnia, T.; Deguen, S.; Kaufman, J.S.; Smargiassi, A. Vulnerability to Heat-related Mortality A Systematic Review, Meta-analysis, and Meta-regression Analysis. Epidemiology 2015, 26, 781–793. [Google Scholar] [CrossRef] [PubMed]
- Xie, P.; Wang, Y.L.; Liu, Y.X.; Peng, J. Incorporating social vulnerability to assess population health risk due to heat stress in China. Acta Geogr. Sinica 2015, 70, 1041–1051. [Google Scholar]
- Azhar, G.; Saha, S.; Ganguly, P.; Mavalankar, D.; Madrigano, J. Heat Wave Vulnerability Mapping for India. Int. J. Environ. Res. Public Health 2017, 14, 357. [Google Scholar] [CrossRef] [PubMed] [Green Version]
- Shui, W.; Chen, Z.C.; Deng, J.M.; Li, Y.J.; Wang, Q.F.; Wang, W.L.; Chen, Y.P. Evaluation of urban high temperature vulnerability of coupling adaptability in Fuzhou, China. Acta Geogr. Sin. 2017, 72, 830–849. [Google Scholar]
- Reischl, C.; Rauter, R.; Posch, A. Urban vulnerability and adaptation to heatwaves: A case study of Graz (Austria). Clim. Policy 2018, 18, 63–75. [Google Scholar] [CrossRef]
- Semenza, J.C.; Rubin, C.H.; Falter, K.H.; Selanikio, J.D.; Flanders, W.D.; Howe, H.L.; Wilhelm, J.L. Heat-related deaths during the July 1995 heat wave in Chicago. N. Engl. J. Med. 1996, 335, 84–90. [Google Scholar] [CrossRef]
- O’Neill, M.S.; Zanobetti, A.; Schwartz, J. Modifiers of the Temperature and Mortality Association in Seven US Cities. Am. J. Epidemiol. 2003, 157, 1074–1082. [Google Scholar] [CrossRef] [PubMed] [Green Version]
- Hajat, S.; Armstrong, B.; Baccini, M.; Biggeri, A.; Bisanti, L.; Russo, A.; Paldy, A.; Menne, B.; Kosatsky, T. Impact of High Temperatures on Mortality: Is There an Added Heat Wave Effect? Epidemiology 2006, 17, 632–638. [Google Scholar] [CrossRef]
- Kim, D.W.; Deo, R.C.; Chung, J.H.; Lee, J.S. Projection of heat wave mortality related to climate change in Korea. Nat. Hazards 2016, 80, 623–637. [Google Scholar] [CrossRef]
- Lee, W.K.; Lee, H.A.; Park, H. Modifying Effect of Heat Waves on the Relationship between Temperature and Mortality. J. Korean Med. Sci. 2016, 31, 702–708. [Google Scholar] [CrossRef] [Green Version]
- Van, S.Y.; Ntarladima, A.M.; Grobbee, R.; Karssenberg, D.; Vaartjes, I. Sex differences in mortality after heat waves: Are elderly women at higher risk? Int. Arch. Occup. Environ. Health 2019, 92, 37–48. [Google Scholar]
- Zhang, M.S.; Wang, H.; Jin, W.; Van Dijk, M.P. Assessing heat wave vulnerability in Beijing and its districts, using a three dimensional model. Int. J. Glob. Warm. 2019, 17, 297–314. [Google Scholar] [CrossRef]
- Canoui, P.F.; Cadot, E.; Spira, A. Excess deaths during the August 2003 heat wave in Paris, France. Rev. Dépidémiologie Et De St. Publique 2006, 54, 127–135. [Google Scholar] [CrossRef] [Green Version]
- Fouillet, A.; Rey, G.; Laurent, F.; Pavillon, G.; Bellec, S.; Guihenneuc, J.C.; Clavel, J.; Jougla, E.; Hemon, D. Excess mortality related to the August 2003 heat wave in France. Int. Arch. Occup. Environ. Health 2006, 80, 16–24. [Google Scholar] [CrossRef] [PubMed] [Green Version]
- Tran, K.V.; Azhar, G.S.; Nair, R.; Knowlton, K.; Jaiswal, A.; Sheffield, P.; Mavalankar, D.; Hess, J. A Cross-Sectional, Randomized Cluster Sample Survey of Household Vulnerability to Extreme Heat among Slum Dwellers in Ahmedabad, India. Int. J. Environ. Res. Public Health 2013, 10, 2515–2543. [Google Scholar] [CrossRef] [Green Version]
- China’s national assessment report on extreme weather and climate events and disaster risk management and adaptation is released. China Emerg. Manag. 2015, 3, 63.
- Kazak, J. The Use of a Decision Support System for Sustainable Urbanization and Thermal Comfort in Adaptation to Climate Change Actions-The Case of the Wrocław Larger Urban Zone (Poland). Sustainability 2018, 10, 1083. [Google Scholar] [CrossRef] [Green Version]
- Peng, J.; Dan, Y.Z.; Qiao, R.L.; Liu, Y.X.; Dong, J.Q.; Wu, J.S. How to quantify the cooling effect of urban parks? linking maximum and accumulation perspectives. Remote Sens. Environ. 2021, 252, 112135. [Google Scholar] [CrossRef]
- Zhang, L.Y.; Zhang, Z.; Ye, T.; Zhou, M.G.; Wang, C.Z.; Yin, P.; Hou, B. Mortality effects of heat waves vary by age and area: A multi-area study in China. Environ. Health 2018, 17, 54. [Google Scholar] [CrossRef] [Green Version]
- Mcgeehin, M.A.; Mirabelli, M. The potential impacts of climate variability and change on temperature-related morbidity and mortality in the United States. Environ. Health Perspect. 2001, 109, 185–189. [Google Scholar]
- Jones, B.; O’Neill, B.C.; McDaniel, L.; McGinnis, S.; Mearns, L.O.; Tebaldi, C. Future population exposure to US heat extremes. Nat. Clim. Chang. 2015, 5, 652–655. [Google Scholar] [CrossRef]
- Zhang, L.; Huang, D.P.; Yang, B.Y. Future population exposure to high temperature in China under RCP4.5 scenario. Geogr. Res. 2016, 35, 2238–2248. [Google Scholar]
- Hu, L.; Wilhelmi, O.V.; Uejio, C. Heat exposure in cities: Combining the dynamics of temperature and population. Sci. Total Environ. 2019, 655, 1–12. [Google Scholar] [CrossRef]
- Li, L.; Zha, Y. Population exposure to extreme heat in China: Frequency, intensity, duration and temporal trends. Sustain. Cities Soc. 2020, 60, 102282. [Google Scholar] [CrossRef]
- Jones, B.; Tebaldi, C.; O’Neill, B.C.; Oleson, K.; Gao, J. Avoiding population exposure to heat-related extremes: Demographic change vs climate change. Clim. Chang. 2018, 146, 423–437. [Google Scholar] [CrossRef]
- Xie, C.; Huang, B.; Liu, X.Q.; Zhou, T.; Wang, Y. Population exposure to heatwaves in Shenzhen based on mobile phone location data. Prog. Geogr. Sci. 2020, 39, 231–242. [Google Scholar] [CrossRef]
- The Lowest Temperature in Zhuhai’s History. Available online: https://www.lishixinzhi.com/miwen/1217303.html (accessed on 5 January 2022).
- Chen, B.; Song, Y.M.; Jiang, T.T.; Chen, Z.Y.; Huang, B.; Xu, B. Real-Time Estimation of Population Exposure to PM2.5 Using Mobile- and Station-Based Big Data. Int. J. Environ. Res. Public Health 2018, 15, 573. [Google Scholar] [CrossRef] [Green Version]
- Loughnan, M.; Carroll, M.; Tapper, N.J. The relationship between housing and heat wave resilience in older people. Int. J. Biometeorol. 2015, 59, 1291–1298. [Google Scholar] [CrossRef]
- Zuurbier, M.; van Loenhout, J.A.F.; le Grand, A.; Greven, F.; Duijm, F.; Hoek, G. Street temperature and building characteristics as determinants of indoor heat exposure. Sci. Total Environ. 2020, 766, 144376. [Google Scholar] [CrossRef]
- White-Newsome, J.L.; Sanchez, B.N.; Jolliet, O.; Zhang, Z.Z.; Parker, E.A.; Dvonch, J.T.; O’Neill, M.S. Climate change and health: Indoor heat exposure in vulnerable populations. Environ. Res. 2012, 112, 20–27. [Google Scholar] [CrossRef] [Green Version]
- Al-Bouwarthan, M.; Quinn, M.M.; Kriebel, D.; Wegman, D.H. Assessment of Heat Stress Exposure among Construction Workers in the Hot Desert Climate of Saudi Arabia. Ann. Work. Expo. Health 2019, 63, 505–520. [Google Scholar] [CrossRef] [PubMed]
- Calkins, M.M.; Bonauto, D.; Hajat, A.; Lieblich, M.; Seixas, N.; Sheppard, L.; Spector, J.T. A Case-Crossover Study of Heat Exposure and Injury Risk among Outdoor Construction Workers in Washington State. Scand. J. Work. Environ. Health. 2019, 45, 588–599. [Google Scholar] [CrossRef] [PubMed]
- Robinea, J.M.; Cheung, S.L.K.; Roy, S.L.; Van Oyen, H.; Griffiths, C.; Michel, J.P.; Herrmannd, F.R. Death toll exceeded 70,000 in Europe during the summer of 2003. Comptes Rendus Biol. 2008, 331, 171–178. [Google Scholar] [CrossRef] [PubMed]
| Publisher’s Note: MDPI stays neutral with regard to jurisdictional claims in published maps and institutional affiliations. |
© 2022 by the authors. Licensee MDPI, Basel, Switzerland. This article is an open access article distributed under the terms and conditions of the Creative Commons Attribution (CC BY) license (https://creativecommons.org/licenses/by/4.0/).


