
Climate Change and Sustainability in ASEAN Countries


1
Lee Kong Chian School of Business, Singapore Management University, Singapore 178899, Singapore
2
School of Economics, Singapore Management University, Singapore 178903, Singapore
*
Author to whom correspondence should be addressed.
Sustainability 2022, 14(2), 999; https://0-doi-org.brum.beds.ac.uk/10.3390/su14020999
Submission received: 14 December 2021
/
Revised: 9 January 2022
/
Accepted: 11 January 2022
/
Published: 17 January 2022
(This article belongs to the Special Issue Business Strategies concerning the Sustainable Development Goals and the SDG Compass)
Abstract
:The ASEAN region is one of the most susceptible regions to climate change, with three of its countries—Myanmar, the Philippines, and Thailand—among those that have suffered the greatest fatalities and economic losses because of climate-related disasters. This paper reveals that the ASEAN’s environmental performance is sorely lagging other regions despite evidence of its cohesive and comprehensive efforts to mitigate emissions and build up adaptive capacity to climate-related disasters. Within the ASEAN, there exist gaps in environmental performance between each country. This suggests that increased cooperation between individual ASEAN countries is pertinent for the region to collectively combat climate change. In addition, we show that government effectiveness has a positive influence on a country’s climate performance, signifying that a government’s strong commitment to governance is necessary in the fight against climate change.
1. Introduction
Southeast Asia is among the regions that are most susceptible to climate change. The region has already seen its ramifications in the form of extreme weather events and heat waves, with anthropogenic causes being the main driver of climate change. In fact, Germanwatch has ranked three ASEAN countries among those that have suffered the greatest economic damage and number of fatalities from climate change [1]. Despite that, research has shown that the mitigation efforts of the Association of Southeast Asian Nations (ASEAN) have been insufficient to combat climate change [2]. This is worrying as estimates by the International Monetary Fund predict that climate change could decrease Southeast Asia’s overall GDP by over 11% [3].
However, ASEAN countries are committed to combating climate change, with all ten member states having ratified the 2015 Paris (Climate) Agreement. At the same time, ASEAN has set up multiple bodies and frameworks to adapt to climate change across multiple sectors, including the energy, transport, and agriculture sector. As such, this paper investigates the effectiveness of ASEAN’s strategies to mitigate climate change and whether ASEAN is doing enough, specifically with relation to the United Nations’ 13th sustainable development goal to combat climate change. This is done using data from the environmental performance index from years 1996 to 2018, as a proxy to measure progress in achieving the 13th sustainable goal.
Climate change is a global concern and is the direct collective result of rapid industrialization and economic expansion over the last few decades. This has resulted in the global temperature increasing by approximately one degree Celsius over pre-industrial levels. The significant increase in accumulated heat is driving temperatures up, melting sea ice, and causing the natural environment to rapidly deteriorate. The impact of climate change additionally poses a danger to people’s lives through food insecurity, adverse health impacts, and population displacement. In the ASEAN region specifically, disasters such as the 2009 tropical storm Ondoy in the Philippines, which resulted in over US$1 billion in damages, cements the importance of adaptation and mitigation efforts in the region [4].
The global community acknowledges this risk, and the hallmark 2015 Paris Agreement signified the strengthening of international cooperation and multilateral action against climate change. The Paris Agreement is an international treaty on climate change with the goal of garnering the support of countries to limit global warming to 1.5 degrees over pre-industrial levels, while simultaneously adapting infrastructure and measures to defend against the ramifications of climate change. The Paris Agreement was signed by 196 parties at COP21 in Paris in 2015 where countries are legally bound to the agreement. Participating countries must formulate long term plans and strategies to build the capacity to safeguard their country against climate change, while collectively working towards a climate neutral world on a sustainable growth trajectory. Yet, the Intergovernmental Panel on Climate Change (IPCC) estimates that existing national plans on mitigation and adaptation strategies will fall short of meeting the Paris Agreement’s objectives. Globally, more extensive transformative systemic change, sustainable development, adaptation, and mitigation efforts are required to prevent temperatures from rising to 1.5 degrees above pre-industrial levels [5].
In the ASEAN context, mitigation efforts in key sectors, including agricultural and energy sectors, are particularly important. This stems from the high carbon footprint of such sectors, where the agriculture sector is the greatest driver of deforestation [6], which is exacerbated by the methods used, such as slash-and-burn in Indonesia, that consequently increases the amount of greenhouse gases released. In addition, this method of clearing has also led to cross-boundary haze, with economic losses extending beyond borders [7]. In addition, the growing demand for energy in the ASEAN, and the country’s reliance on fossil fuels, equates to ASEAN’s carbon-intensive growth. This indicates that mitigation efforts are crucial to the ASEAN’s efforts towards tackling climate change.
There is currently no known study that empirically examines the ASEAN’s environmental performance in comparison with other regions and non-ASEAN countries and the differences in environmental performance within ASEAN. There is also no known study that utilizes the climate change index of the EPI to study a country’s progress in achieving the SDG 13 that we are aware of. We believe that this paper provides a metric for crucial parties, such as ASEAN government bodies and working climate groups, to understand their standing in terms of environmental performance, and the crucial areas that require further efforts on the mitigation front. This can also serve as a checkpoint to study the ASEAN’s progress in meeting the United Nation’s Sustainable Development Goals since 2015, considering the limited data availability of a country’s progress in the 13th goal of climate change.
The remainder of this paper is organized as follows. Section 2 provides a brief review of the pertinent related literature. Section 3 discusses the data and methodology of the research. Section 4 presents our empirical findings, Section 5 examines the influence a government’s effectiveness exerts on climate performance, and Section 6 concludes.
2. Literature Review
This section examines the current literature on the ASEAN’s progress towards meeting the United Nation’s 13th sustainable development goal on climate action [8]. The existing literature largely focuses on examining the ASEAN’s progress on achieving the 13th goal of climate action through a focus on the various ASEAN frameworks to adapt specific sectors to climate change. Sectoral adaptation efforts range from those in transport, agriculture, food security, energy, to the adaptation of infrastructure to deal with sea-level rise [4,9,10,11,12]. Though they provide an in-depth understanding of the ASEAN’s progress in achieving sustainability in that specific sector, they do not really provide a cohesive view of the ASEAN’s regional efforts across multiple sectors to adapt to, and combat, climate change. In addition, there are reports that evaluate the ASEAN’s progress on all the sustainable development goals (SDG), but goal 13 of climate action is often only briefly elaborated on due to a lack of data availability [13]. Other than that, there are also compilations of all the policies that the individual ASEAN countries have taken to integrate climate measures into policy, but there is not much evaluation of the overall effectiveness of these individual policies, or of regional ones [14]. Overall, the consensus is that, both collectively and individually, the ASEAN is doing a lot across multiple sectors, but that it is not sufficient to adequately mitigate the ASEAN’s contribution to climate change and safeguard the ASEAN against climate-related stressors.
Eckstein, Künzel, and Schäfer [1] have provided evidence that three ASEAN countries—Myanmar, the Philippines, and Thailand—are among those that have suffered the greatest fatalities and economic losses because of climate-related disasters. In many cases, such worrisome evidence heightens environmental sensitivity and corresponding measures. Evidence from past research corroborates the positive relationship between concern about climate change and occurrence of disasters and note its role in effective communication of climate risks by the authorities to the public [15]. In addition, climate perceptions are also found to influence the likelihood of individuals supporting national and international policies for mitigation efforts [16,17]. As climate perception plays an important role in public support for the mitigation of climate risks, it is imperative that we take stock of the progress on the 13th goal within the ASEAN region.
Past empirical studies have compared the environmental performance of Asia, including ASEAN countries, to other regions. These studies utilize the environmental performance index due to its ability to provide a somewhat comprehensive assessment of national environmental performance [18,19]. Chang, Dong and Liu [19] study the difference in environmental governance performance between European countries and Asian countries on environmental performance outcomes and used the country’s expenditure on environmental protection to measure the extent of environmental governance. They find that governments’ environmental expenditure significantly reduces carbon dioxide emissions for Asian countries, but that the same effect did not carry over to improvements in the environmental performance index. In addition, Basrija and Handoyo [20] find a strong relationship between a country’s government effectiveness and environmental performance. In their work, the government effectiveness indicator from the Worldwide Governance Indicator is used to measure the effectiveness of a country’s government. Likewise, Duit [21] reports that the effectiveness of a country’s government is a significant influence on a country’s ability to successfully tackle climate change.
Another crucial perspective to consider is the relationship between climate policies and the pace of a country’s economic development. Previous research found a bi-directional causality between carbon dioxide emissions and GDP and concluded that it is hard to decouple carbon dioxide emissions from economic growth and decreasing one might mean sacrificing another [22]. At the same time, a positive link between economic growth and leveraging renewable energy sources has also been found [23], along with evidence that highlights the importance of investing in adaptive capital, defined as capital that reduces climate damage, in improving welfare. Considered alongside evidence that proves the necessity of mitigation and adaptation policies for sustainable economic growth [24], this collectively highlights the importance of integrating climate-friendly policies for long-term economic health.
In addition, past research by Gripenberg [25] has shown that the environmental performance index (EPI) relates to SDG 13—Climate Action, where the EPI contained metrics that measured indicators related to SDG 13. They are related in the sense that EPI provides quantitative measures to track the reduction of greenhouse gas emissions, which is related to the overall goal of taking climate action, despite SDG 13 not having an indicator which deals with the reduction of greenhouse gas emissions. This is because the indicators used to measure progress of SDG 13 are mostly focused on policy efforts to adapt to, and mitigate, the emissions of pollutants, instead of quantitative indicators to measure a decrease in emissions [25]. While we acknowledge that the EPI does not provide a perfect proxy for measuring a country’s progress in achieving SDG 13, it is adequate for the purposes of this study.
3. Data and Methodology
This paper examines the effectiveness of the ASEAN’s regional policies to fight against climate change, specifically with relation to SDG 13. The climate change index of the environmental performance index (EPI) is used as a proxy to measure the ASEAN’s progress in achieving SDG 13, in contrast to the rest of the world. This is done to provide a quantitative view of the progress in achieving SDG 13, due to the qualitative nature of SDG 13 indicators. We employ pooled ordinary least squares regressions to understand the ASEAN’s environmental performance in comparison to other countries and regions, while controlling for each country’s wealth through its per capita gross domestic product.
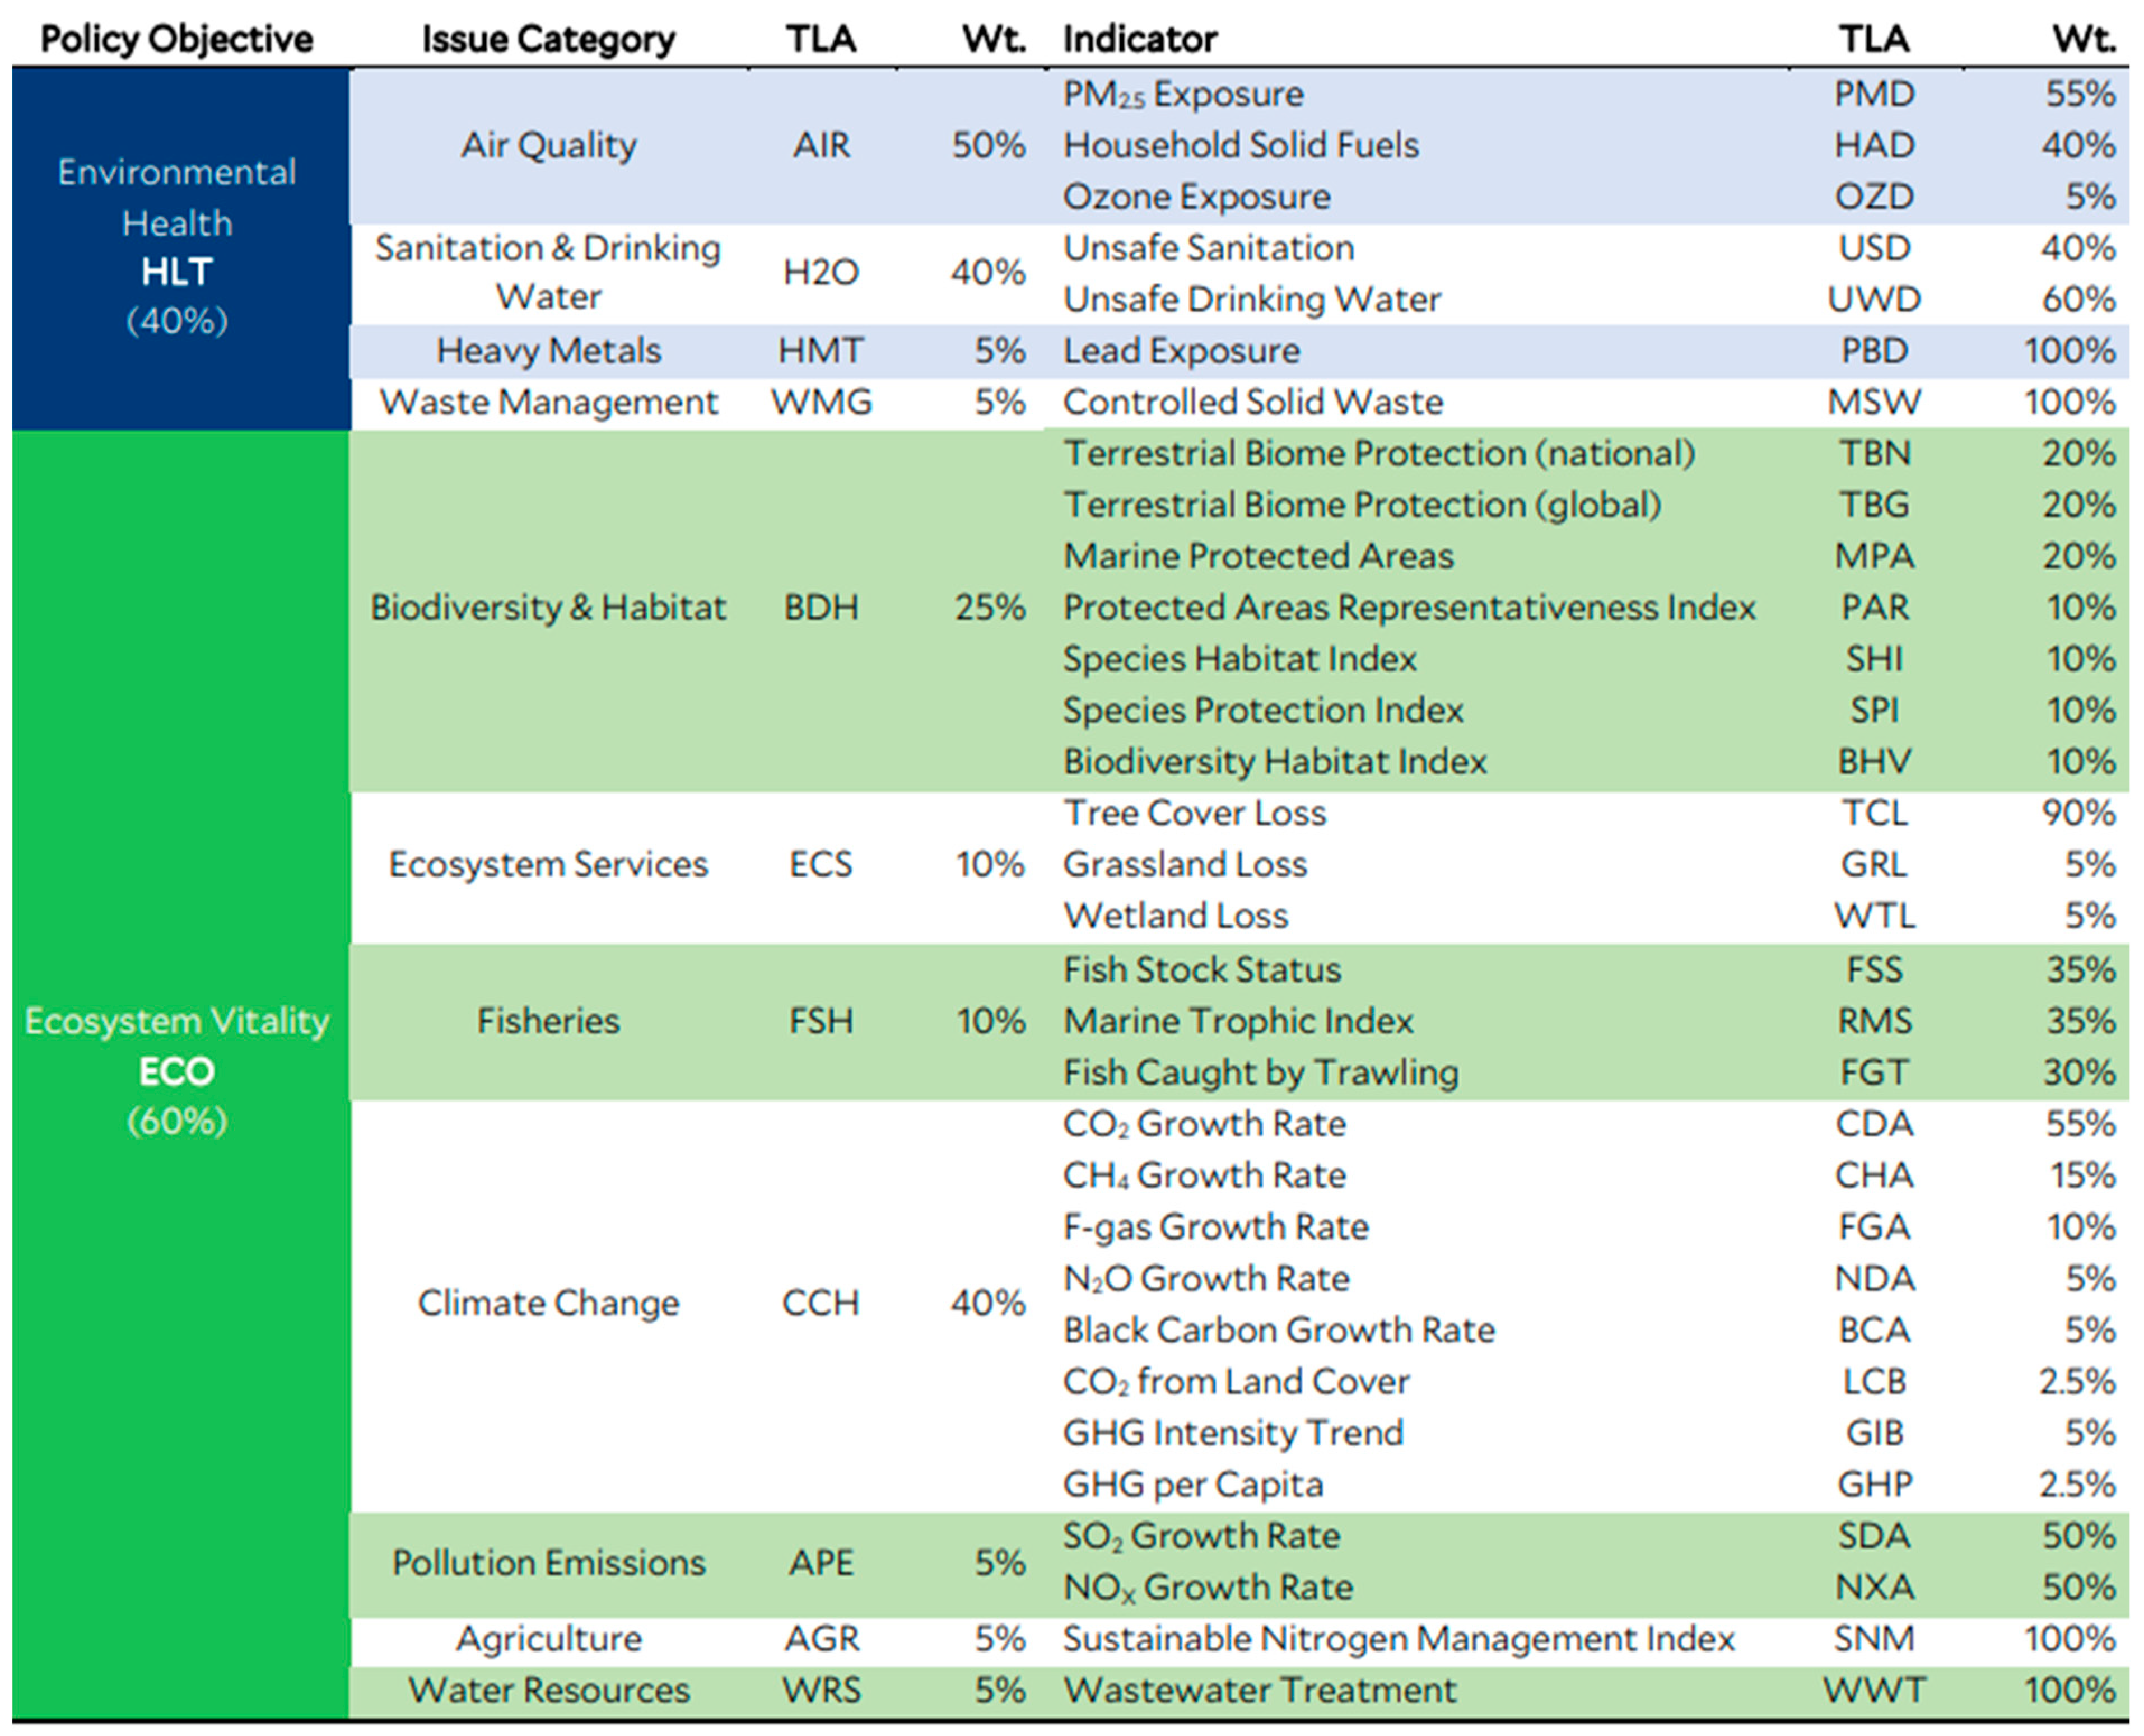
The EPI, in essence, gives an assessment of the state of environmental health and ecosystem vitality in 180 nations worldwide. The EPI index calculates an overall score out of 100 by looking at 11 areas, including air quality, sanitation and drinking water, heavy metals, waste management, biodiversity and habitat, ecosystem services, fisheries, climate change, pollution emissions, agriculture, and water resources. The higher the score, the better the country’s environmental performance is. In addition, the EPI’s proximity-to-target methodology allows the EPI scores of different countries and regions to be compared, providing a broad overview of the disparities in environmental performance [26].
Figure 1 illustrates the components of the EPI, breaking it down into 11 issue categories, the indicators within each issue category, and the relative weights assigned to each indicator. We focus on the Climate Change issue category of the Ecosystem Vitality component of the EPI to investigate how the ASEAN compares to the rest of the world in terms of climate change, which is most relevant to SDG 13. The climate change index (CCH) is calculated through utilizing the weights of each index within the Climate Change subset. In addition, the EPI contains the scores of the respective indices of countries from years 1995 to 2020, allowing us to incorporate each country’s environmental performance within each specific index over time. However, we only use data from 1996 to 2018 in our analysis. With this, the EPI provides an avenue to investigate the reason behind a country’s weak, or strong, climate score, to gain an understanding of the specific issue that needs to be tackled.
The indices from the EPI are used to compute the CCH score, with the relevant information being referenced from the EPI’s 2020 technical appendix as follows:
- (1)
- Carbon Dioxide Growth Rate (CDA). The CDA index accounts for 55% of the climate change index (CCH). It is computed as the average yearly rate of change of raw carbon dioxide emissions from 2008 to 2017, corrected for economic trends to identify CDA changes caused by policy rather than economic fluctuations.
- (2)
- Methane Growth Rate (CHA). The CHA index accounts for 15% of the climate change index (CCH). It is estimated as the average yearly rate of change of raw methane emissions from 2008 to 2017, corrected for economic trends to identify CHA changes caused by policy rather than economic variations.
- (3)
- F-gas Growth Rate (FGA). The FGA index accounts for 10% of the climate change index (CCH). It is computed as the average annual rate of change in raw fluorinated gas emissions from 2008 to 2017, corrected for economic trends to isolate changes in FGA caused by policy rather than economic variations.
- (4)
- Nitrogen Dioxide Growth Rate (NDA). The NDA index accounts for 5% of the climate change index (CCH). It is computed as the average annual rate of change of raw nitrous oxide emissions from 2008 to 2017, corrected for economic trends so as to isolate changes in NDA caused by policy rather than economic variations.
- (5)
- Black Carbon Growth Rate (BCA). The BCA index accounts for 5% of the climate change index (CCH). It is estimated as the average annual rate of change in black carbon emissions from 2005 to 2014, adjusted for economic trends so as to identify changes in BCA caused by policy rather than economic variations
- (6)
- CO2 from Land Cover (LCB). The LCB index accounts for 2.5% of the overall climate change index (CCH). This indicator measures CO2 emissions caused by changes in land cover and is computed from 2001 to 2015.
- (7)
- Green House Gas Intensity Trend (GIB). The GIB index accounts for 5% of the climate change index (CCH). This measures the rate of increase in greenhouse gas intensity—greenhouse gas emissions per unit of GDP—and shows the country’s capacity to decouple economic growth from emissions growth.
- (8)
- Green House Gas per Capita (GHP). The GHP index comprises 2.5% of the climate change index (CCH). It measures the greenhouse gas emissions per capita for each country.
Each index is scored out of 100, where a higher score reflects a better performance in that aspect. A score of 100 indicates that a target related to that index has been achieved, while a score of 0 reflects the worst possible performance in relation to that target. To understand how the CCH score has changed over time, the CCH score was calculated from years 1995 to 2020, utilizing the time series data available for each of the indexes from past releases of the EPI report. The overall weighted average CCH score using the weights from the 2020 EPI release is computed as:
In the study, gross domestic product (GDP) per capita is used to control for the country’s state of development. Stern (2018) employs the environmental Kuznets curve to propose a link between environmental quality and economic development as measured by GDP per capita. He posits that the early stages of an economy’s growth are usually coupled with a decrease in environmental quality as emissions increase. However, once a country has achieved a certain level of GDP per capita, there tends to be an improvement in emissions as the economy experiences growth. In addition, previous empirical studies have shown that GDP has one of the greatest influences on a country’s carbon dioxide emissions [28]. The unit of the GDP per capita is a constant 2011 US dollars per person. To calculate the GDP per capita, each country’s GDP and population over the years is obtained from the environmental performance index (EPI) database, where the data for these metrics were originally sourced from the World Bank.
To understand the ASEAN’s overall environmental performance compared with other countries, a pooled ordinary least squares regression is conducted to investigate a country’s environmental performance based on its region, while controlling for the country’s wealth through its GDP per capita. We investigate the ASEAN’s performance (a) in contrast to other regions of the world, (b) against all non-ASEAN countries, and (c) within each country in the ASEAN. Each model is run by regressing the computed CCH score against dummy variable(s) that represent a country’s geographic region. The models control for each country’s wealth measured by the natural logarithm of its per capita GDP (GDP). Equation (2) examines the strength of ASEAN’s environmental performance relative to non-ASEAN countries:
where CCHit refers to the climate change index of the relevant country in year t, ASEANit is an independent dummy variable which takes on a value of 1 if it is an ASEAN country, and 0 otherwise, GDPit, which serves as a control variable, refers to the natural logarithm of the relevant country’s per capita GDP in year t, βi’s are the regression coefficients, and εit is an error term ~N[0, 1].
Equation (3) models how a country’s environmental performance changes if it belongs to the ASEAN region, relative to other individual geographic regions of the world, while controlling for the country’s GDP:
where CCHit refers to the climate change index of the relevant country in year t, Regionjt are dummy variables representing the regions of the ASEAN, Eastern Europe, Former Soviet States, the Global West, Greater Middle East, Latin America & Caribbean, Southern Asia, and Sub-Saharan Africa. They take on a value of 1 if a country belongs to that region. The Asia-Pacific region is left out to avoid having a model that is less than full ranked. GDPit refers to the natural logarithm of each individual country’s GDP per capita over time. βi’s are the regression coefficients, and εit is an error term ~N[0, 1].
Equation (4) studies how environmental performance differs among the various countries within the ASEAN region, while controlling for the country’s GDP:
where CCHit refers to the climate change index of the relevant country in year t, Countrykt are dummy variables representing the ASEAN countries of Singapore, Indonesia, Malaysia, the Philippines, and Thailand. The dummies take on a value of 1 if the observation belongs to that country. Only six out of the 10 countries within the ASEAN have climate change data available. Brunei Darussalam is left out to avoid having a model that is less than full ranked. GDPit refers to the natural logarithm of each individual country’s GDP per capita over time. βi’s are the regression coefficients, and εit is an error term ~N[0, 1].
4. Empirical Results
Table 1 shows the results of the pooled ordinary least squares regression of Equation (2) for the environmental performance of ASEAN countries, relative to non-ASEAN countries, while controlling for each country’s per capita GDP. The independent variables are singularly and jointly significant at the 1% level. As expected, countries with a higher GDP per capita display better environmental performance, as seen by the positive coefficient of the GDP variable. This corroborates with the expectations of Stern’s environmental Kuznets curve [29], which emphasizes an improvement in environmental standards once a country has achieved a certain level of development. However, the impact is small where a 1% increase in GDP per capita leads to the overall environmental performance increasing by 0.0535, holding all other variables constant. Lastly, the results show that ASEAN countries perform worse in terms of their environmental performance, on average, where a country’s environmental performance is estimated to fall by 11.02 points if the country is an ASEAN country.
Table 2 documents the results of Equation (3) for the environmental performance of countries within the ASEAN region, relative to countries within the other seven non-ASEAN regions, while controlling for each country’s per capita GDP. All independent variables are jointly significant at the 1% level. Once again, wealthier countries tend to have better environmental performance as evidenced by the positive and significant coefficient of GDP. However, the effect is less pronounced than in Equation (2), where now a 1% increase in GDP per capita results in the environmental performance falling by 0.0261, holding other factors constant. Overall, a country tends to perform worse in terms of its environmental score if it belongs to the region of ASEAN, Greater Middle East, or Sub-Saharan Africa.
In Table 3, we show the results of the pooled ordinary least squares regression of Equation (4) for the environmental performance of individual ASEAN countries, while controlling for each country’s per capita GDP. The model is statistically significant at the 1% level. Considering the six ASEAN countries (The remaining four ASEAN countries—Cambodia, Vietnam, Laos and Myanmar—were not included as data for at least one of the indexes used in the CCH score was missing) in the study, GDP per capita has a positive impact on environmental scores where, holding other factors constant, a 1% increase in GDP per capita tends to result in environmental scores increasing by 0.03. In addition, after controlling for each country’s GDP, only Singapore is significantly associated, at the 95% level, to CCH, highlighting that Singapore performs better in terms of CCH scores, on average, however not necessarily due to their higher wealth as per capita GDP is not significantly associated with CCH at the 95% level. The results of Equation (4) signifies that a country’s individual wealth does not play the most significant role when it comes to influencing CCH scores, while the results of Equations (2) and (3) provide evidence that regional wealth plays an influential part in affecting CCH scores as seen from the statistical significance of per capita GDP, at a 99% level.
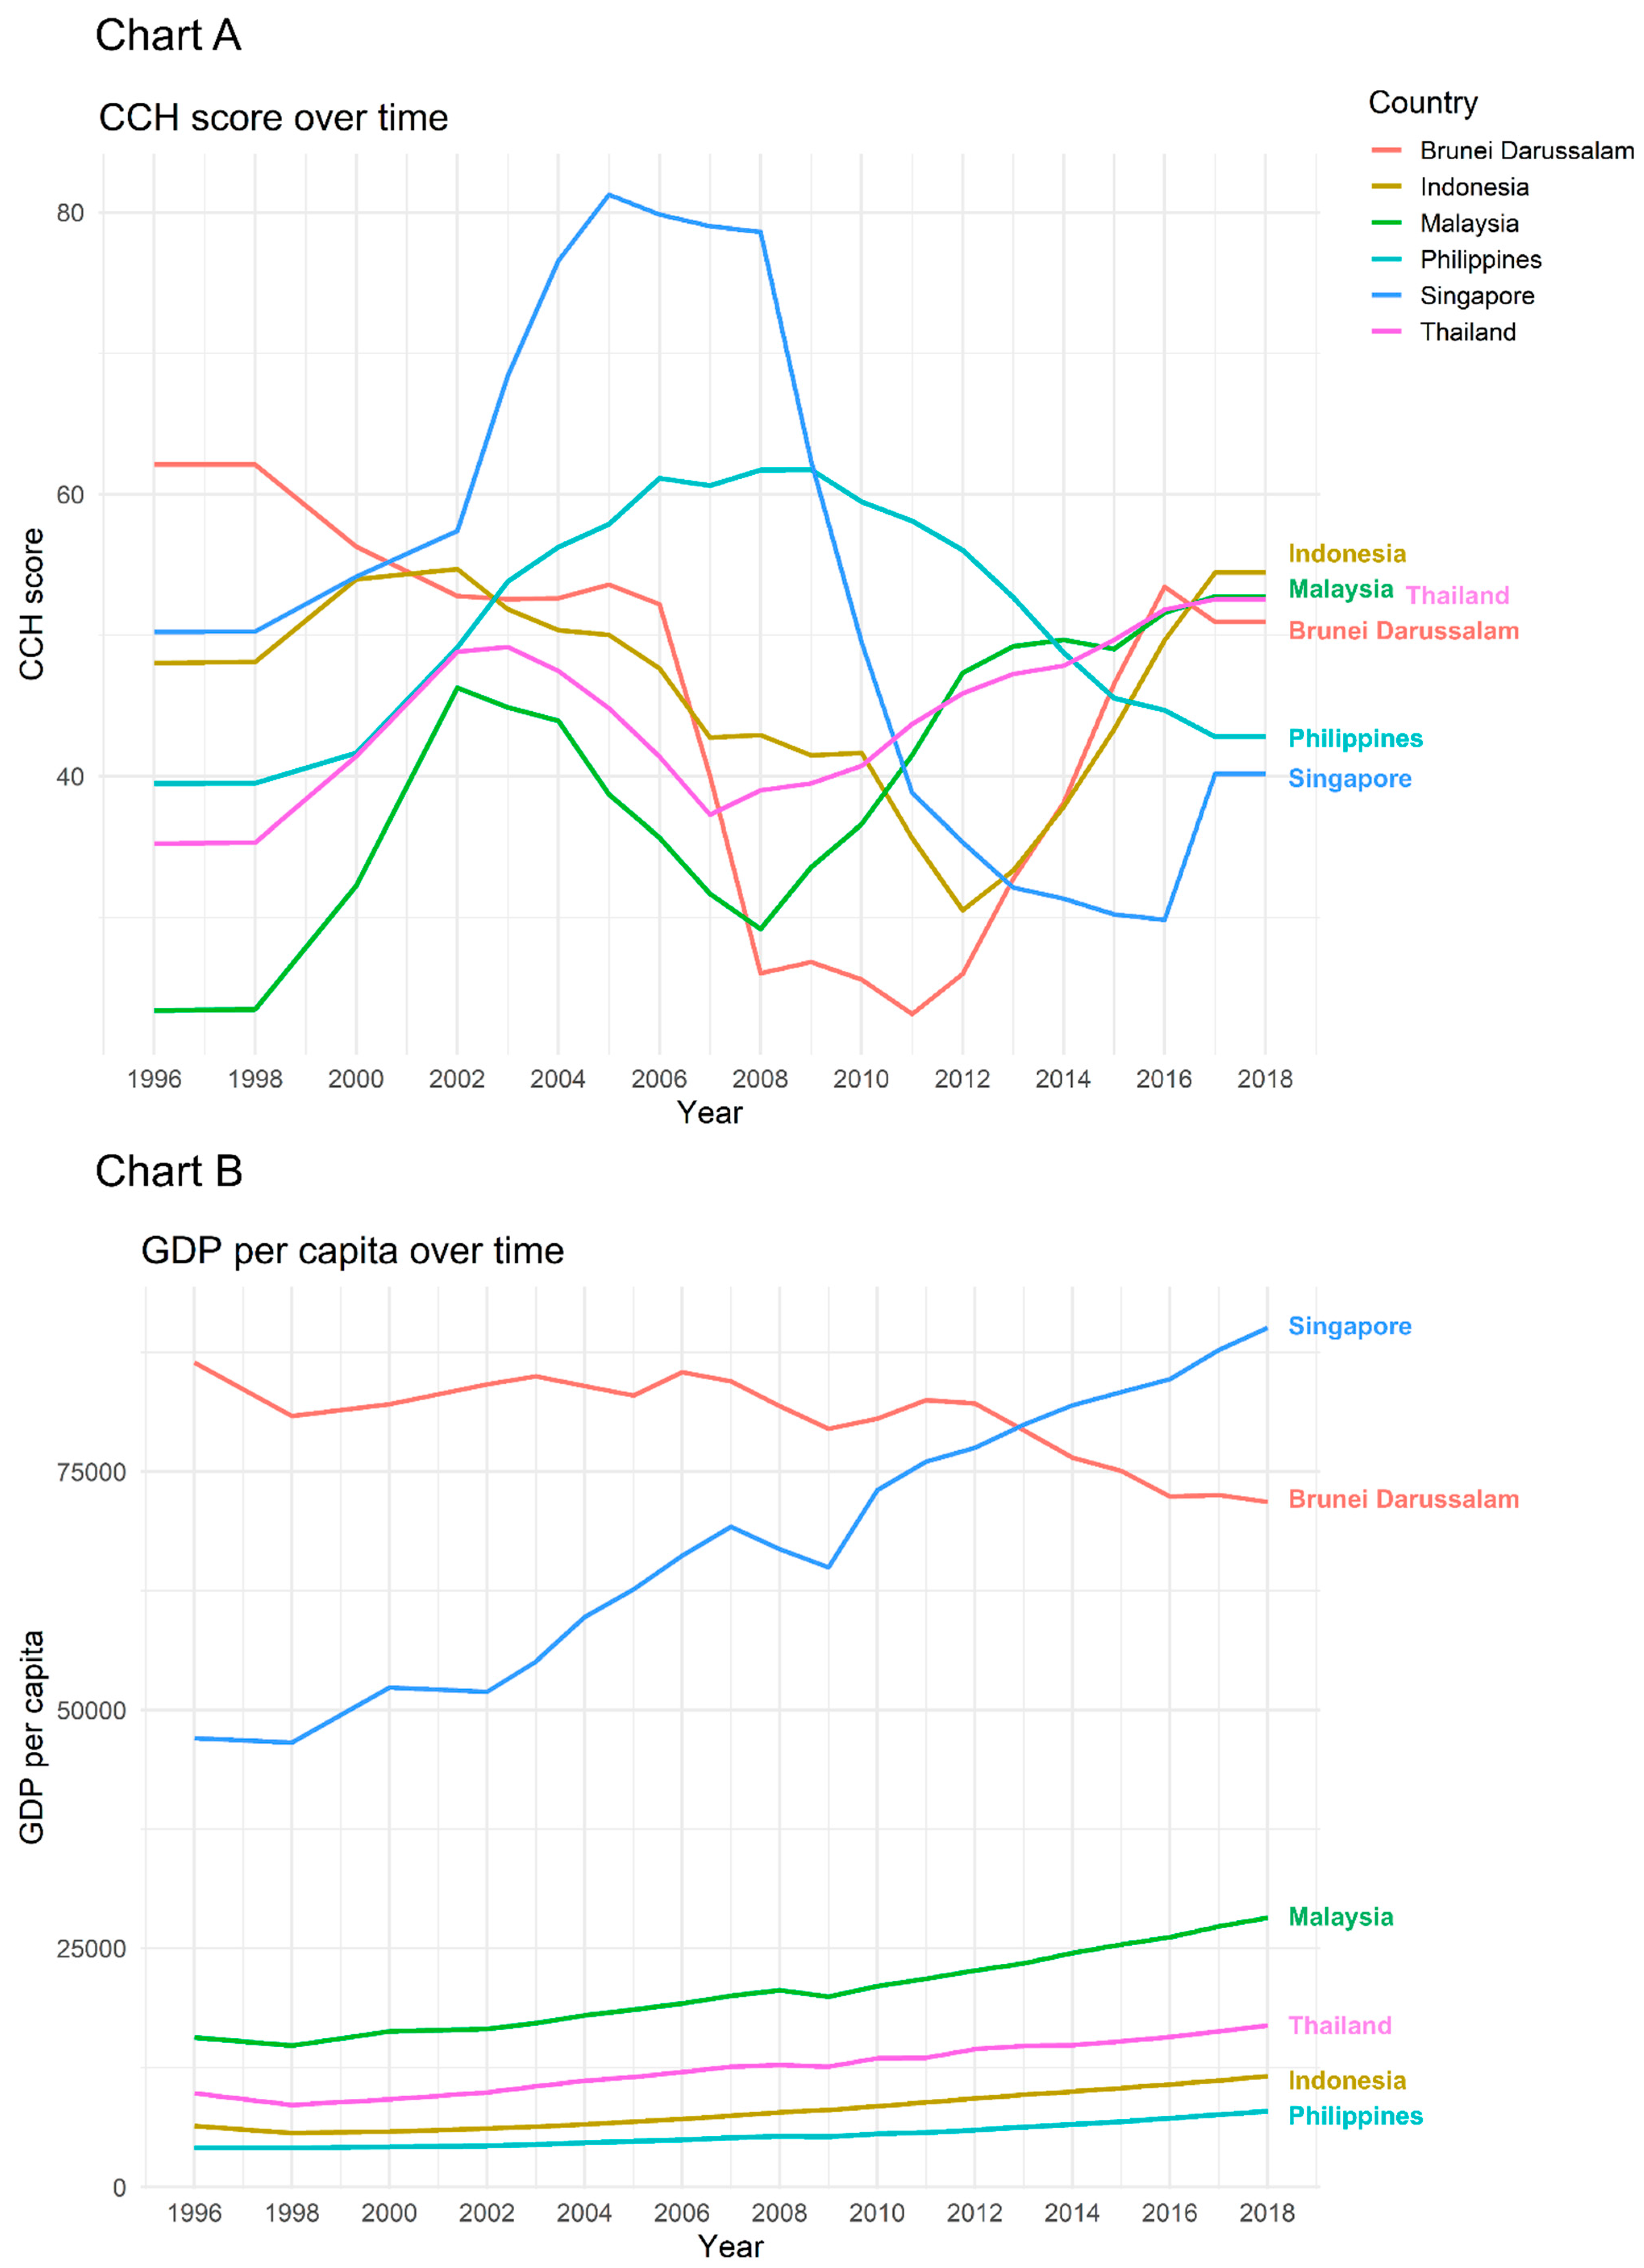
The results of Table 3 reflect that, holding all other factors constant, Singapore tends to perform better in terms of its CCH score, which is positive and statistically significant at the 95% level. However, Figure 2, Chart A, which depicts each ASEAN country’s CCH score from 1995 to 2018, indicates that Singapore’s and the Philippines’ CCH score started to decline in 2008. While Singapore’s climate performance may be somewhat concerning despite having a higher per capita GDP (Figure 2, Chart B), it is observed that the CCH scores of all countries, including Singapore and the Philippines, have started increasing in the years shortly after the 2015 Paris Agreement.
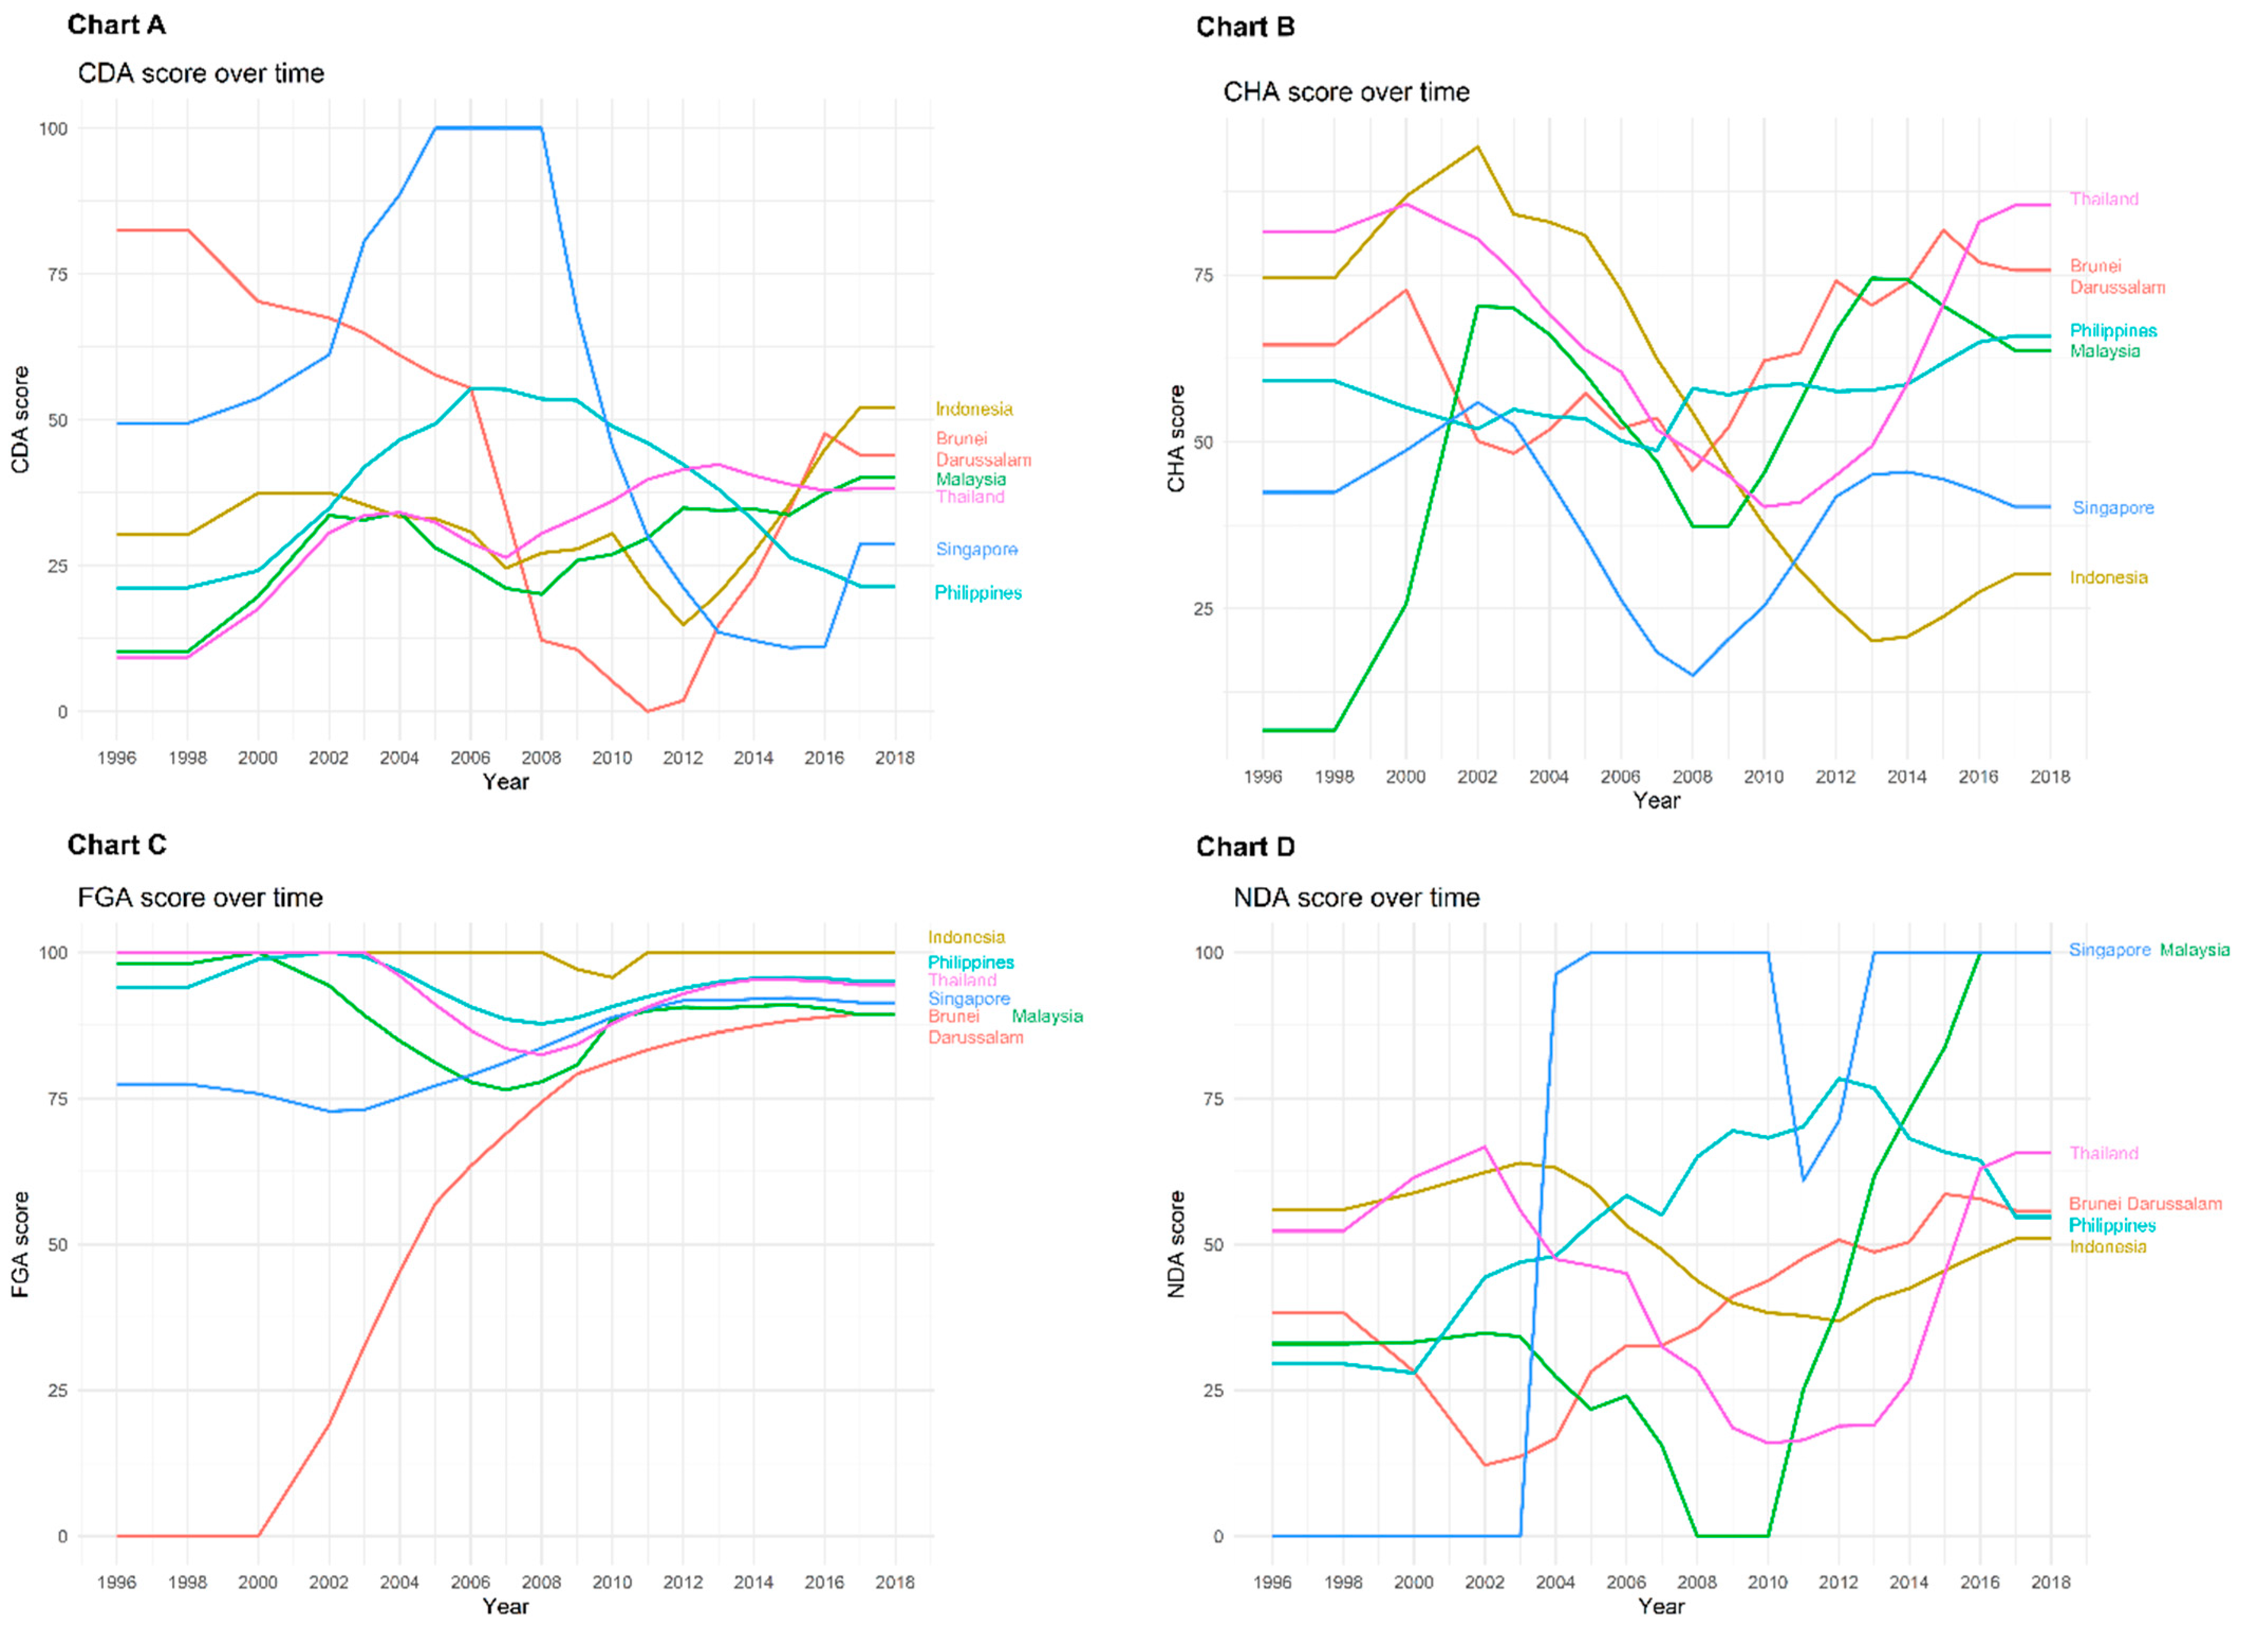
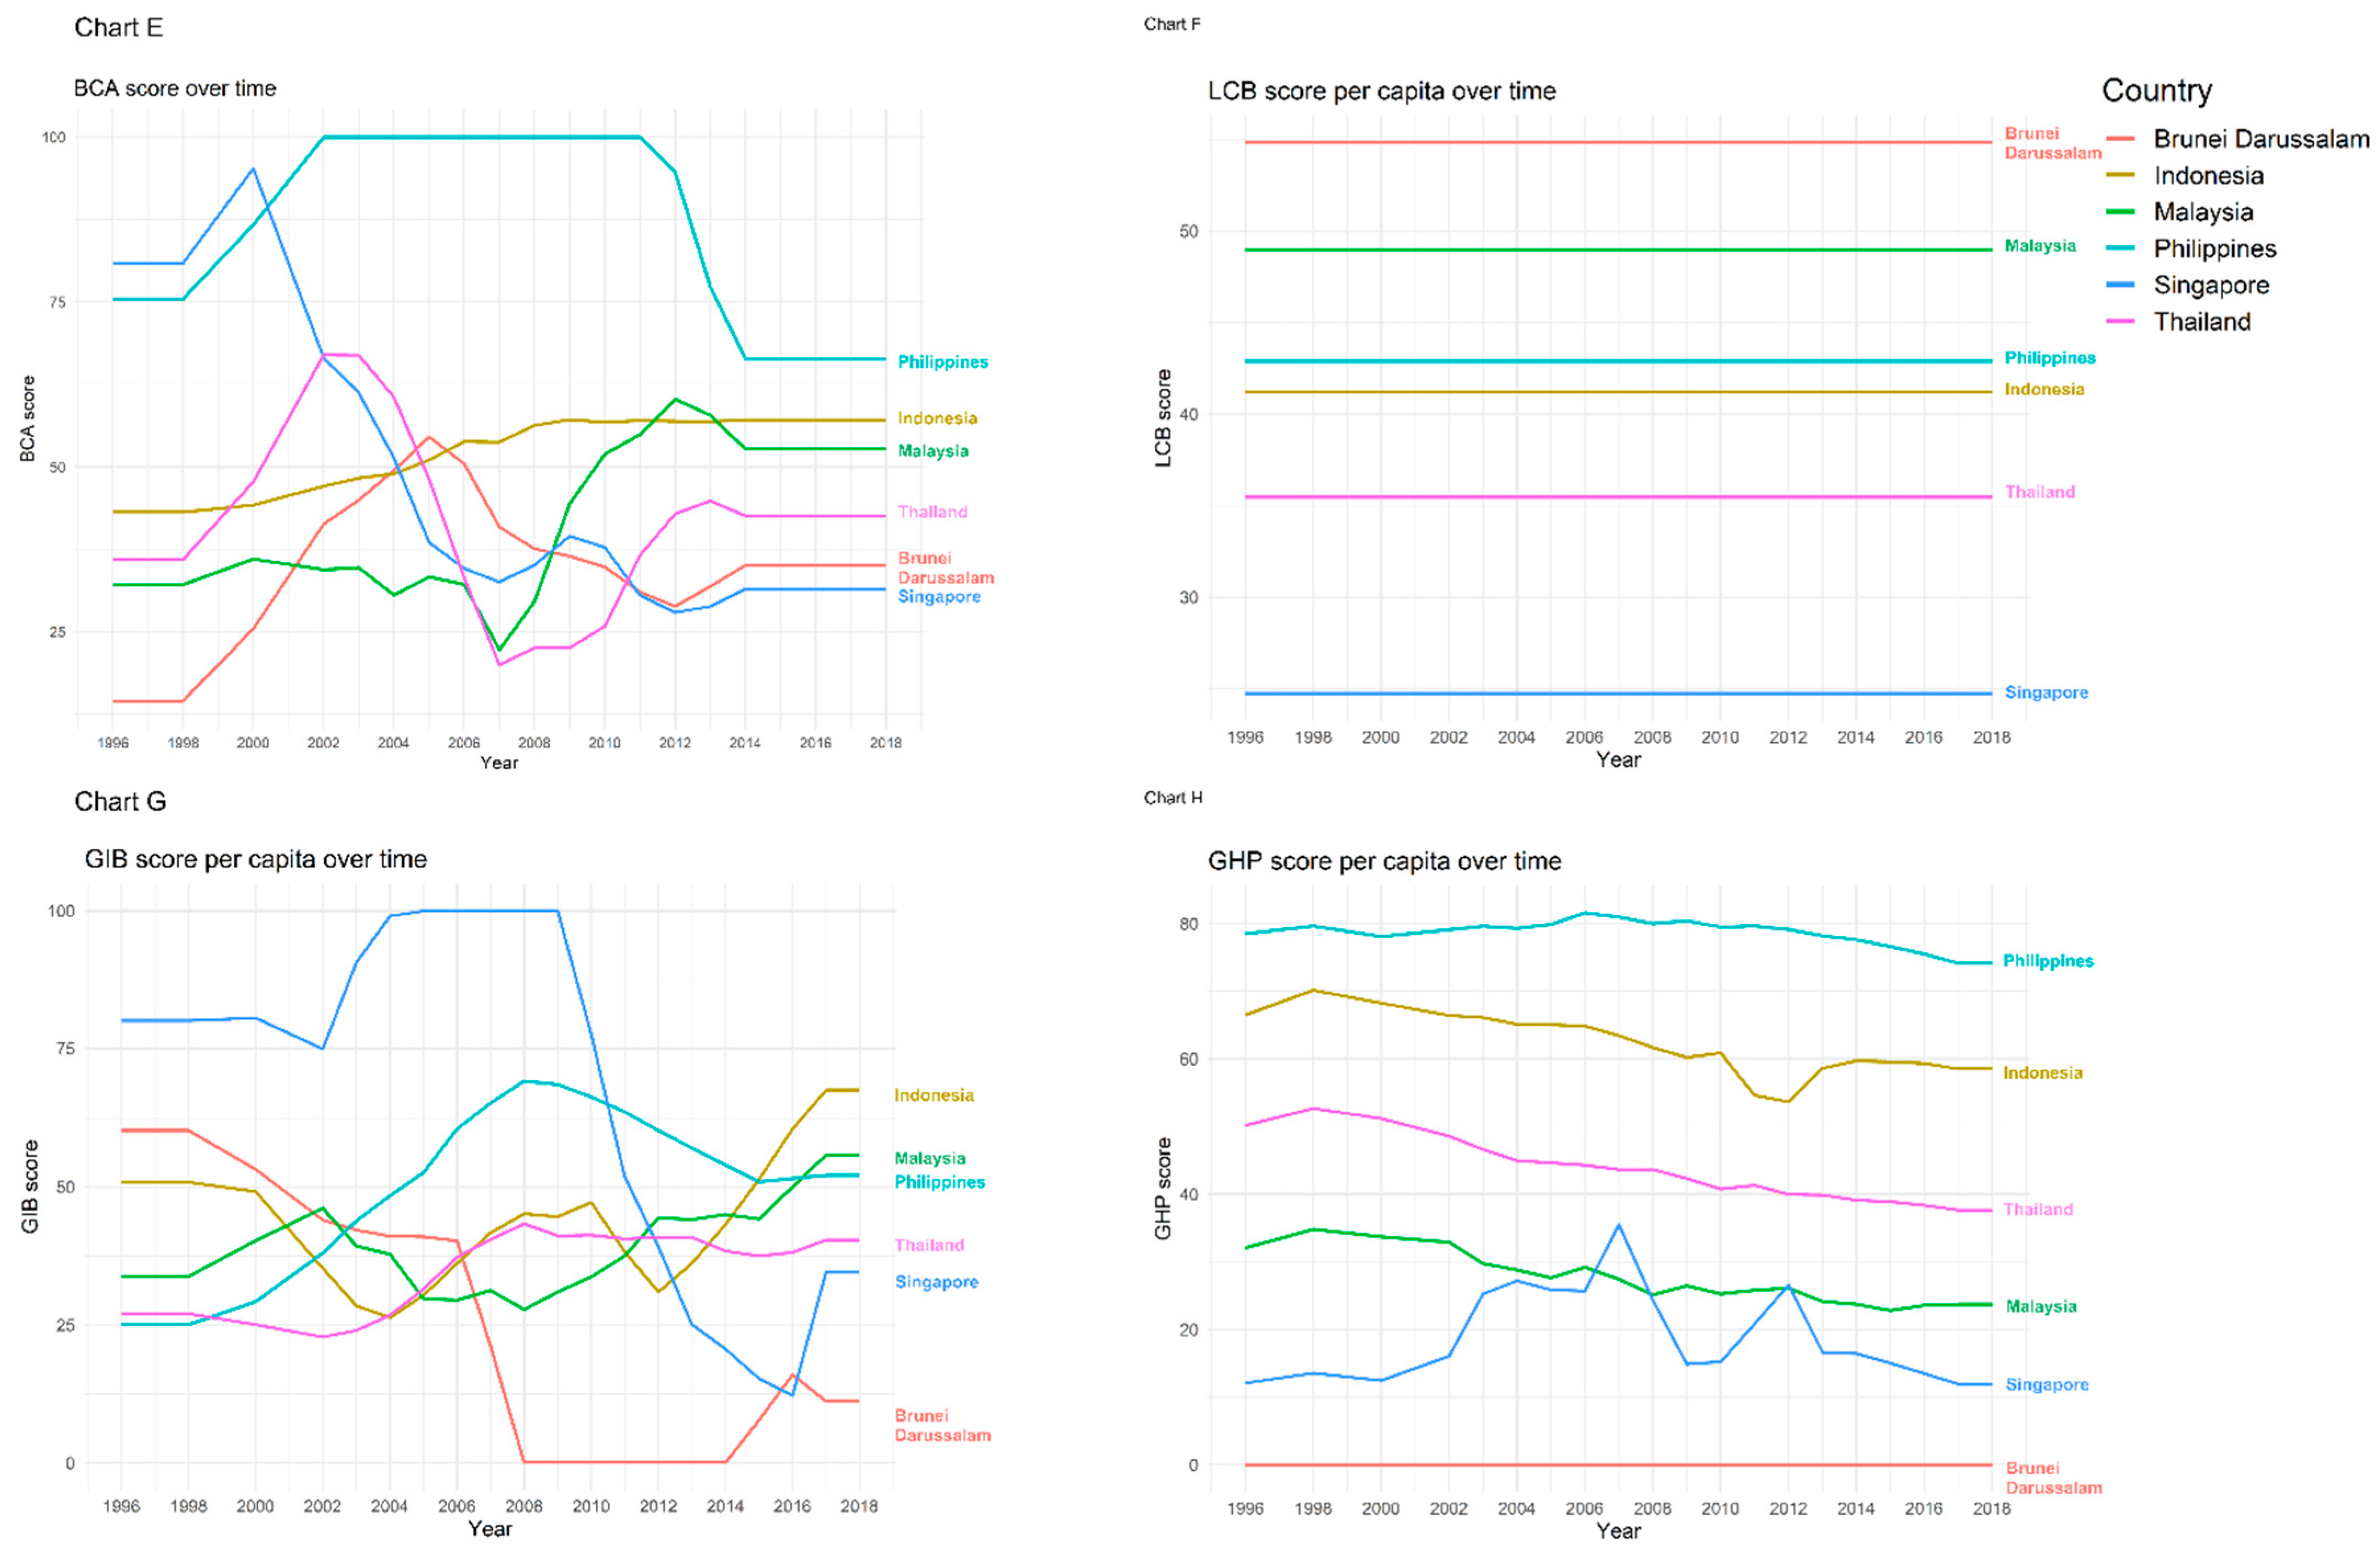
Each country’s climate change (CCH) score comprises several individual metrics shown in Figure 3, and explained below, that reveal their performance in relation to a specific type of greenhouse gas emission. Investigating individual metrics reflects areas of concern for greenhouse gases where, on average, most metrics perform moderately well. This could reflect that greater mitigation policies to reduce greenhouse gas emissions are vital for the ASEAN. Overall, emphasis on environmental action is vital for the ASEAN, as environmental disruptions can thwart the region’s progress in economic development.
- Carbon Dioxide Growth Rate (CDA) of ASEAN countries over time. Chart A reveals that, from 2007, the CDA scores of Singapore, Brunei Darussalam, and the Philippines were on a downward trend which implies a higher carbon dioxide growth rate, while Indonesia, Malaysia, and Thailand saw their CDA scores generally improving. Singapore’s CDA score was on target from years 2005 to 2009; thereafter, it dropped drastically. As the CDA constitutes 55% of the climate change index, a country’s weak or strong performance in climate scores is likely attributed to its CDA score.
- Methane Growth Rate (CHA) of ASEAN countries over time. Chart B shows that all countries other than Indonesia have increasing CHA scores in recent years. This reflects an improvement in methane emissions over time, and that Indonesia has room for improvement.
- F-gas Growth Rate (FGA) of ASEAN countries over time. In Chart C, we observe that all countries but Indonesia have an increasing FGA score in recent years. This reflects improvement in fluorine gas emissions over time.
- Nitrogen Dioxide Growth Rate (NDA) of ASEAN countries over time. Chart D shows that all countries’ NDA scores have risen in recent years. This reflects improvement in nitrous oxide emissions over time. In addition, for years 2013 to 2019, Singapore has been performing rather well in this aspect and, from 2010, Malaysia saw a marked improvement in its NDA score.
- Black Carbon Growth Rate (BCA) of ASEAN countries over time. In Chart E, we see that Singapore and the Philippines have a declining BCA score over the years with Singapore’s decreasing at a much greater rate than the Philippines, indicating a potential area of concern for Singapore.
- Carbon Dioxide from Land Cover Trend (LCB) of ASEAN countries over time. In Chart F, we observe that Singapore has the lowest LCB index among all ASEAN countries, while Brunei Darussalam performs the best. This indicates Singapore’s high change in proportion of land cover over the years.
- Greenhouse Gas Intensity Trend (GIB) of ASEAN countries over time. Singapore and Brunei Darussalam’s GIB scores, according to Chart G, have largely been on a downward trend up to 2016, while the remaining countries’ GIB scores have generally trended upwards. Singapore’s decreasing GIB score is consistent with its strong economic growth, which is often coupled with a corresponding emissions increase. All countries’ GIB scores have improved, starting from 2016, in line with the 2015 Paris Agreement that resulted in government intervention against climate change.
- Greenhouse Gas per Capita (GHP) of ASEAN countries over time. Chart H highlights that Singapore consistently performs poorly in its GHP scores in all years except 2007 and 2012, while the Philippines consistently performs the best. This indicates that Singapore’s overall greenhouse gas emissions are significant, especially when compared against her comparatively small population.
5. Robustness Checks: The Role of a Country’s Governance
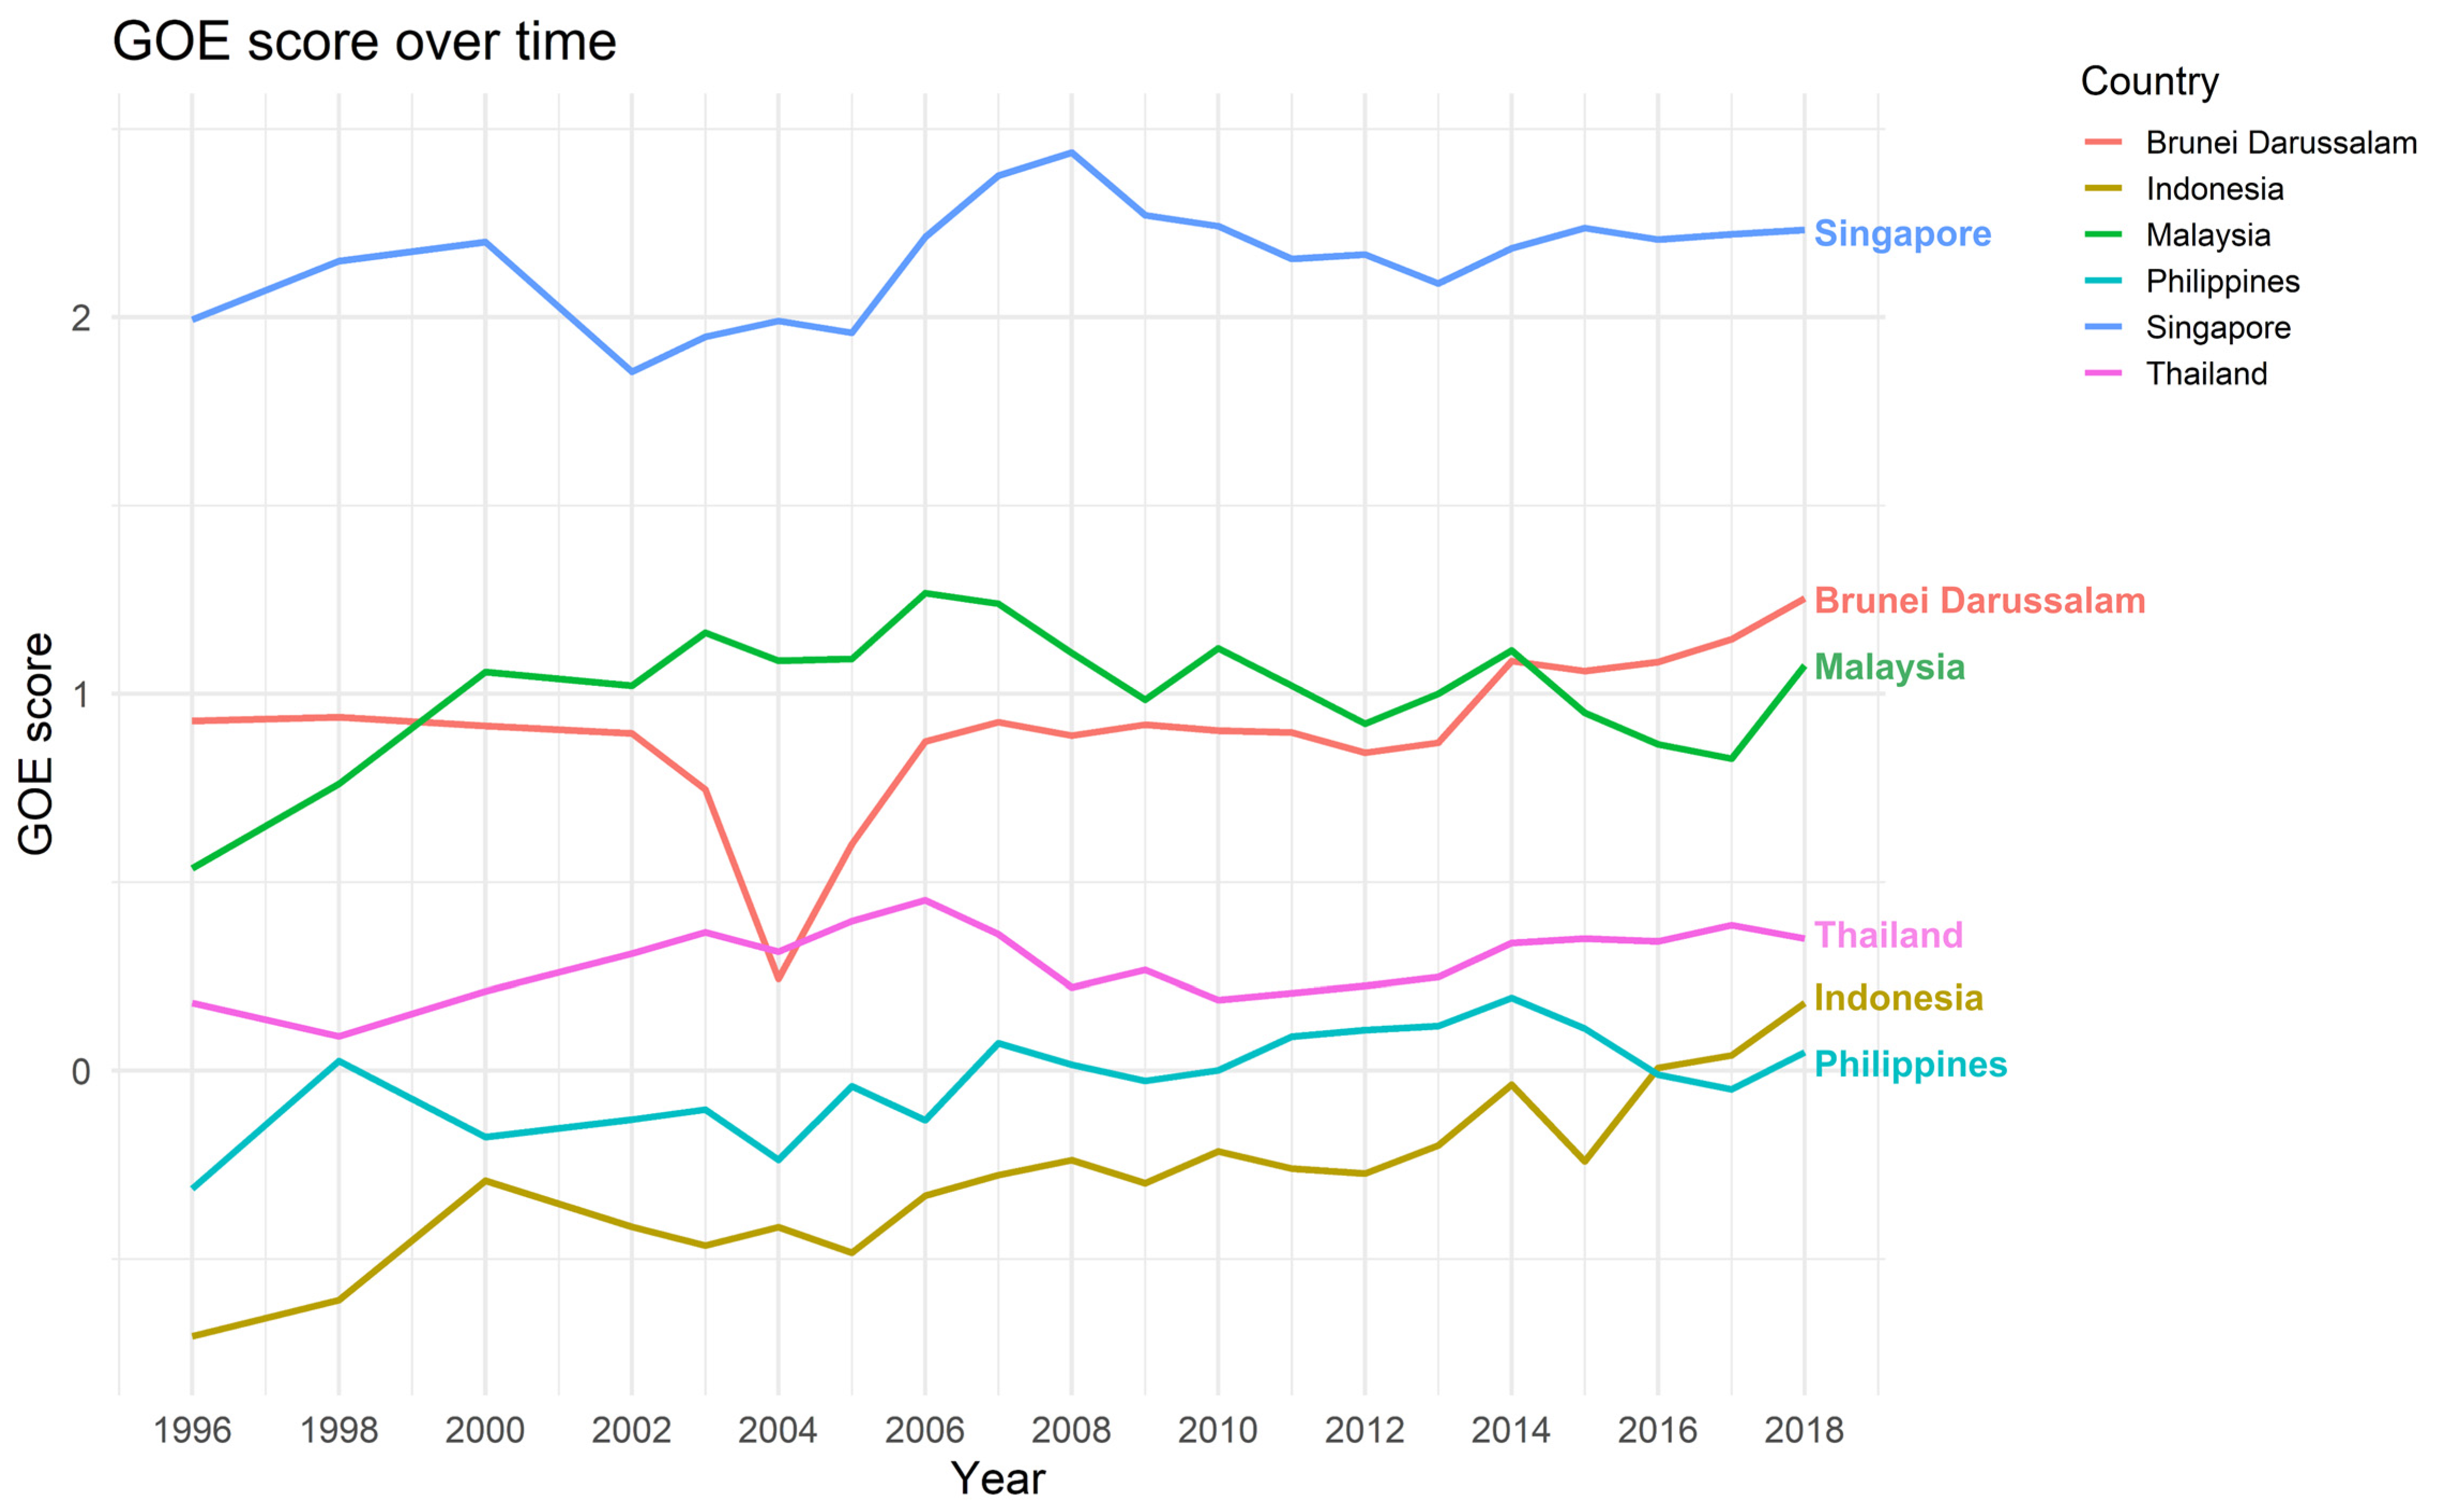
To add credence to our findings, we conduct robustness checks by exploring whether a country’s governance has any impact on the results. According to the Organization for Economic Co-operation and Development (OECD), effective governance across all levels of the government is vital for coordinated action against climate change [30]. In addition, Meadowcroft (2010) highlights that an effective government is necessary to successfully implement mitigation actions to mitigate the country’s contribution to climate change, and adaptation actions to safeguard against the ramifications of climate change [31]. Likewise, previous studies have shown that the government effectiveness indicator has a positive influence on a country’s EPI performance [20]. In addition, developed countries would require more intricate institutional mechanisms for mitigation policies, while the less developed nations would tend to focus more on adaptation efforts, or focus on mitigating one sector at a time [31]. Hence, an indicator representing a country’s government effectiveness, the World Bank’s Government Effectiveness (GOE) index is introduced.
The GOE provides a metric for understanding the quality of a country’s public and civil service, and the extent to which these services are free from political pressures. In addition, it studies the quality of policies that are formulated and implemented, as well as the government’s commitment to the policies. The indicator can be compared across countries and across time and has a score which ranges from −2.5 to 2.5. The higher the score, the better the government effectiveness of a particular country [32]. Figure 4 provides visual representation of the GOE index for the six ASEAN countries over time.
We perform a pooled ordinary least squares regression to study the ASEAN countries’ environmental performance relative to non-ASEAN countries while controlling for each country’s wealth using their per capita GDP and government effectiveness using their GOE index. The model is shown in Equation (5):
where CCHit refers to the climate change index of the relevant country in year t, ASEANit is a dummy variable which takes on 1 if it is an ASEAN country, and 0 otherwise. GDPit refers to the natural logarithm of each individual country’s per capita GDP over time and GOEit refers to the government effectiveness of the relevant country in year t. βi’s are the regression coefficients, and εit is an error term ~N[0,1].
Equation (6) models how a country’s environmental performance changes if it belongs to the ASEAN region, relative to other individual geographic regions of the world, while controlling for each country’s wealth using their per capita GDP and government effectiveness using their GOE index:
where CCHit refers to the climate change index of the relevant country in year t. As in Equation (3), Regionjt are dummy variables representing the regions of the ASEAN, Eastern Europe, Former Soviet States, the Global West, Greater Middle East, Latin America & Caribbean, Southern Asia, and Sub-Saharan Africa. GDPit refers to the natural logarithm of each individual country’s per capita GDP over time and GOEit refers to the government effectiveness in year t. βi’s are the regression coefficients, and εit is an error term ~N[0, 1].
Equation (7) investigates how environmental performance differs among the various countries within the ASEAN region while controlling for each country’s wealth using their per capita GDP and government effectiveness using their GOE index:
where CCHit refers to the climate change index of the relevant country in year t. As in Equation (4), Countrykt are dummy variables representing the ASEAN countries of Singapore, Indonesia, Malaysia, Philippines, and Thailand. GDPit refers to the natural logarithm of each individual country’s per capita GDP over time and GOEit refers to the government effectiveness in year t. βi’s are the regression coefficients, and εit is an error term ~N[0, 1].
Table 4 reports the findings of Equation (5), which shows the relation between a country’s climate performance and whether it belongs to the ASEAN region, controlling for its GDP and government effectiveness. All variables are found to be individually and jointly significant. Non-ASEAN countries have better environmental performance than their ASEAN counterparts as evidenced by the negatively significant coefficient of the ASEAN. As expected, wealthier nations perform better than less wealthy ones as shown by the positive GDP coefficient. In addition, we find that GOE is positively and significantly associated with climate scores at the 1% level. This indicates that government effectiveness likely influences the strength of a country’s climate governance, as well as its ability to implement policies that are environmentally friendly.
Table 5 documents the results of Equation (6), which models how a country’s environmental performance changes if it belongs to the ASEAN region, relative to other individual geographic regions of the world, while controlling for each country’s wealth and government effectiveness. All variables are jointly significant at the 1% level. Overall, a more effective government and more wealth are associated with higher environmental scores. The measure of government effectiveness, GOE, has a positive but insignificant coefficient. Countries from the regions of Eastern Europe, Former Soviet States, and the Global West tend to perform better in terms of their environmental scores, while those that belong to the ASEAN and the Greater Middle East tend to perform worse.
Table 6 provides the results of Equation (7) on how environmental performance differs among the various countries of the ASEAN, while controlling for each country’s wealth and government effectiveness. All variables in the model are jointly significant at the 5% level. Though a country’s wealth and its government’s effectiveness have a positive impact on climate change scores, they are not statistically significant. However, Singapore’s positive coefficient in the regression reveals that it is the best performer among ASEAN countries in terms of their climate scores, followed by the Philippines and Indonesia. These findings are consistent with those of Table 3, which did not control for government effectiveness. Singapore’s comparatively better performance can be attributed to its higher GOE scores, relative to those of her ASEAN neighbors.
6. Conclusions
This paper evaluates the effectiveness of the ASEAN’s regional efforts to achieve the United Nation’s sustainable development goals regarding climate change. We show that a country’s wealth and governance have a positive impact on its climate change index score, mutual collaboration, the sharing of policies and leveraging on climate funds could provide a means for the ASEAN to progress. Rapid development and urbanization around the world have exacerbated the rate of global warming and increased the incidence of climate-related disasters. Each country has a role to play in mitigating the adverse impact of climate change and to adapt their efforts that are so pertinent to improving the state of the environment.
ASEAN countries have made considerable efforts to safeguard against climate change, while reducing their emissions. This is evident from the multiple regional frameworks and bodies set up to tackle climate change from sector-specific fronts. Examples include the ASEAN Climate Resilience Network which adapts the ASEAN’s agriculture sector to climate risks, the ASEAN Center for Energy, which seeks to propel sustainability in the energy sector, and the Kuala Lumpur Transport Strategic Plan to increase the uptake of sustainable transport. Though each framework focuses on a different sector, they have the common goal of emissions reduction and promoting more sustainable industry methods.
Despite the initiatives taken by ASEAN countries in emissions reduction, they underperform against those in other regions in their environmental performance. This finding remains even after we control for a country’s economic wealth and government effectiveness. More aggressive adaptation and mitigation efforts must be taken for the ASEAN to play a pivotal role towards limiting the rise in temperatures to below 1.5 degrees over pre-industrial levels.
The current work is limited by its data availability for several indicators of SDG 13, which meant that we had to use a proxy for measuring the progress in the goal. Should new data for the rest of the indicators become available, further work can be done to better understand how ASEAN countries fare in achieving these indicators compared with those in other regions. In addition, it is important to note that this study takes stock of the mitigation efforts done and does not consider the adaptation efforts taken by a country.
An avenue for future research is to incorporate the perception of environmental risks as an additional control variable, due to its positive influence on the public’s support of climate policies. Understanding the link between perception of climate risk, governance effectiveness, and the eventual climate score could provide support in understanding another key piece of the climate puzzle.
As past research has shown that wealthier countries are more likely to undergo mitigation efforts than their less-wealthy counterparts, it is important to note that a poorer environmental performance in this study does not necessarily mean that the country is not doing its part in tackling climate change—it might simply be doing more on the adaptation, than on the mitigation front.
Author Contributions
Conceptualization, D.K.D.; methodology, D.K.D. and S.E.B.; software, D.K.D. and S.E.B.; validation, D.K.D. and S.E.B.; formal analysis, D.K.D. and S.E.B.; investigation, D.K.D. and S.E.B.; resources, D.K.D. and S.E.B.; data curation, D.K.D. and S.E.B.; writing—original draft preparation, S.E.B.; writing—review and editing, D.K.D. and S.E.B.; visualization, D.K.D. and S.E.B.; supervision, D.K.D.; project administration, D.K.D. All authors have read and agreed to the published version of the manuscript.
Funding
This research received no external funding.
Institutional Review Board Statement
Not applicable.
Informed Consent Statement
Not applicable.
Data Availability Statement
The data presented in this study are openly available at https://epi.yale.edu/downloads (accessed on 12 September 2021).
Conflicts of Interest
The authors declare no conflict of interest.
References
- Eckstein, D.; Künzel, V.; Schäfer, L. Global Climate Risk Index 2021; Germanwatch e.V.: Berlin, Germany, 2021. [Google Scholar]
- Overland, I.; Sagbakken, H.F.; Chan, H.-Y.; Merdekawati, M.; Suryadi, B.; Utama, N.A.; Vakulchuk, R. The ASEAN climate and energy paradox. Energy Clim. Chang. 2020, 2, 100019. [Google Scholar] [CrossRef]
- Prakash, A. The Impact of Climate Change in Southeast Asia, IMF Finance & Development. Retrieved from International Monetary Fund. September. Available online: https://www.imf.org/external/pubs/ft/fandd/2018/09/southeast-asia-climate-change-and-greenhouse-gas-emissions-prakash.htm (accessed on 12 November 2021).
- Causevic, A.; LoCastro, M.; Dharish, D.; Selvakkumaran, S.; Gren, Å. Financing resilience efforts to confront future urban and sea-level rise flooding: Are coastal megacities in Association of Southeast Asian Nations doing enough? Environ. Plan. B Urban Anal. City Sci. 2021, 989–1010. [Google Scholar] [CrossRef]
- IPCC; Masson-Delmotte, V.; Zhai, P.; Pörtner, H.-O.; Roberts, D.; Skea, J.; Shukla, P.; Pirani, A.; Moufouma-Okia, W.; Péan, C.; et al. Global Warming of 1.5 °C: An IPCC Special Report on the Impacts of Global Warming of 1.5 °C Above Pre-Industrial Levels and Related Global Greenhouse Gas Emission Pathways, in the Context of Strengthening the Global Response to the Threat of Climate Change, Sustainable Development, and Efforts to Eradicate Poverty. 2018; in press. [Google Scholar]
- The ASEAN Secretariat. Fifth ASEAN State of the Environment Report; The ASEAN Secretariat: Jakarta, Indonesia, 2017. [Google Scholar]
- Murulitharan, J.; Ashfold, M. Depoliticising Southeast Asia’s Forest Fire Pollution. Retrieved from East Asia Forum. 17 August 2021. Available online: https://www.eastasiaforum.org/2021/08/17/depoliticising-southeast-asias-forest-fire-pollution/ (accessed on 23 September 2021).
- Ritchie, Roser, Mispy, Ortiz-Ospina. Measuring Progress towards the Sustainable Development Goals. Retrieved from SDG Tracker. 2018. Available online: https://sdg-tracker.org (accessed on 20 September 2021).
- Bakker, S.; Contreras, K.D.; Kappiantari, M.; Tuan, N.A.; Guillen, M.D.; Gunthawong, G.; Zuidgeest, M.; Liefferink, D.; Van Maarseveen, M. Low-Carbon Transport Policy in Four ASEAN Countries: Developments in Indonesia, the Philippines, Thailand and Vietnam. Sustainability 2017, 9, 1217. [Google Scholar] [CrossRef] [Green Version]
- Saidul, I.; Kieu, E. Tackling regional climate change impacts and food security issues: A critical analysis across ASEAN, PIF, and SAARC. Sustainability 2020, 12, 883. [Google Scholar]
- McKinsey & Company. Agriculture and Climate Change. Retrieved from McKinsey & Company. April 2020. Available online: https://www.mckinsey.com/~/media/mckinsey/industries/agriculture/our%20insights/reducing%20agriculture%20emissions%20through%20improved%20farming%20practices/agriculture-and-climate-change.pdf (accessed on 23 September 2021).
- IRENA & ACE. Renewable Energy Outlook for ASEAN: A Remap Analysis; Abu Dhabi and ASEAN Centre for Energy (ACE): Jakarta, Indonesia, 2016. [Google Scholar]
- ASEAN Secretariat. ASEAN Sustainable Development Goals Indicators Baseline Report; ASEAN: Jakarta, Indonesia, 2020. [Google Scholar]
- Elder, M. Assessment of ASEAN Countries’ Concrete SDG Implementation Efforts: Policies and Budgets Reported in Their 2016–2020 Voluntary National Reviews (VNRs); Institute for Global Environmental Strategies: Kamiyamaguchi, Japan, 2020. [Google Scholar]
- Diakakis, M.; Skordoulis, M.; Savvidou, E. The Relationships between Public Risk Perceptions of Climate Change, Environmental Sensitivity and Experience of Extreme Weather-Related Disasters: Evidence from Greece. Water 2021, 13, 2842. [Google Scholar] [CrossRef]
- Leiserowitz, A. Climate Change Risk Perception and Policy Preferences: The Role of Affect, Imagery, and Values. Clim. Chang. 2006, 77, 45–72. [Google Scholar] [CrossRef] [Green Version]
- O’Connor, R.E.; Bard, R.J.; Fisher, A. Risk Perceptions, General Environmental Beliefs, and Willingness to Address Climate Change. Risk Anal. 1999, 19, 461–471. [Google Scholar] [CrossRef]
- Huang, B.; Xu, Y. Environmental Performance in Asia: Overview, Drivers, and Policy; Asian Development Bank Institute: Tokyo, Japan, 2019. [Google Scholar]
- Chang, C.-P.; Dong, M.; Liu, J. Environmental Governance and Environmental Performance; Asian Development Bank Institute: Tokyo, Japan, 2020. [Google Scholar]
- Basrija, A.; Handoyo, S. The Relevance of Public Governance to National Environmental Performance. J. Account. Audit. Bus. 2019, 2, 1–13. [Google Scholar] [CrossRef]
- Duit, A. Understanding Environmental Performance of Nationals: An Institution Centered Approach and Some Difficulties; Working Paper Series; Göteborg University: Gothenburg, Sweden, 2005. [Google Scholar]
- Menyah, K.; Wolde-Rufael, Y. CO2 emissions, nuclear energy, renewable energy and economic growth in the US. Energy Policy 2010, 38, 2911–2915. [Google Scholar] [CrossRef]
- Ntanos, S.; Skordoulis, M.; Kyriakopoulos, G.; Arabatzis, G.; Chalikias, M.; Galatsidas, S.; Batzios, A.; Katsarou, A. Renewable Energy and Economic Growth: Evidence from European Countries. Sustainability 2018, 10, 2626. [Google Scholar] [CrossRef] [Green Version]
- Roson, R.; Van der Mensbrugghe, D. Climate change and economic growth: Impacts and interactions. Int. J. Sustain. Econ. 2012, 4, 270–285. [Google Scholar] [CrossRef]
- Gripenberg, S. Measuring Sustainable Development Goals—A Social-Ecological Perspective; Stockholm Resilience Centre: Stockholm, Sweden, 2016. [Google Scholar]
- Yale Center for Environmental Law & Policy. Welcome|Environmental Performance Index. Retrieved from Environmental Performance Index. 2020. Available online: https://epi.yale.edu/ (accessed on 12 September 2021).
- Wendling, Z.; Emerson, J.; de Sherbinin, A.; Etsy, D. 2020 Environmental Performance Index; Yale Center for Environmental Law & Policy: New Haven, CT, USA, 2020. [Google Scholar]
- Putra, P.T.N.; Yuliati, L.; Lestari, E.K. An Empirical Study of Climate Change on Carbon Dioxide Emission in ASEAN 4: Vector Autoregression Exogenous (VARX) Approach. Eko-Reg. J. Pembang. Ekon. Wil. 2019, 14. [Google Scholar] [CrossRef]
- Stern, D.I. The Environmental Kuznets Curve. Retrieved from Science Direct. 2018. Available online: https://0-www-sciencedirect-com.brum.beds.ac.uk/topics/earth-and-planetary-sciences/environmental-kuznets-curve (accessed on 20 September 2021).
- Organization for Economic Co-Operation and Development. COP21 and Public Governance. Retrieved from OECD. 2021. Available online: https://www.oecd.org/gov/cop21-and-public-governance.htm (accessed on 30 October 2021).
- Meadowcroft, J. Climate Change Governance; The World Bank: Washington, WA, USA, 2010. [Google Scholar]
- Worldwide Governance Indicators. Government Effectiveness. Retrieved from Worldwide Governance Indicators. 2021. Available online: https://info.worldbank.org/governance/wgi/Home/Documents (accessed on 30 October 2021).
Figure 1.
Environmental performance index technical appendix. Note: This figure outlines the breakdown of the policy objectives, issue categories, and the three letter abbreviations (TLA) measured by the environmental performance index, as well as their respective weights (Wt.) within each issue category. We focus on the issue category of climate change and utilize the indicators and weights within the issue category to estimate the climate change score (CCH). Source: Environmental Performance Index Technical Appendix [27].

Figure 2.
Climate change performance and GDP per capita among ASEAN countries. Note: This figure graphically presents the climate change performance (CCH score) of the six ASEAN countries from 1995 to 2018 (Chart A) and their GDP per capita (Chart B).
Figure 2.
Climate change performance and GDP per capita among ASEAN countries. Note: This figure graphically presents the climate change performance (CCH score) of the six ASEAN countries from 1995 to 2018 (Chart A) and their GDP per capita (Chart B).

Figure 3.
Climate change performance by type of greenhouse gas emission among ASEAN countries. Note: This figure contains eight charts, which show the trends from 1995 to 2018 for each of the climate change components in the environmental performance index: (Chart A)—the carbon dioxide growth rate (CDA score); (Chart B)—the methane growth rate (CHA score); (Chart C)—the fluorine gas growth rate (FGA score): (Chart D)—the nitrogen dioxide growth rate (NDA score); (Chart E)—the black carbon growth rate (BCA score); (Chart F)—the land cover gas growth rate (LCB score); (Chart G)—the greenhouse gas intensity trend (GIB score); and (Chart H)—the greenhouse gas per capita (GHP score). Note that in Chart F, the computation of the LCB metric makes use of information from 2001 to 2015, to arrive at one reading in 2020, according to the EPI’s technical appendix. We represent this as a straight line over the years.


Figure 4.
Government effectiveness index among ASEAN countries. Note: This figure shows the trend of the government effectiveness (GOE) score among the six ASEAN countries in the study from 1995 to 2018.
Figure 4.
Government effectiveness index among ASEAN countries. Note: This figure shows the trend of the government effectiveness (GOE) score among the six ASEAN countries in the study from 1995 to 2018.


Table 1.
Environmental performance in ASEAN relative to non-ASEAN countries.
| Variable | Coefficient | p-Value | t-Statistic |
|---|---|---|---|
| Constant term | 4.67 ** | 0.0692 | 1.82 |
| ASEAN | −11.02 *** | 0.0000 | 19.70 |
| GDP | 5.35 *** | 0.0000 | −8.53 |
| Number of observations | 2725 | ||
| R-squared | 0.1370 | ||
| F-statistic | 216.19 *** | ||
Note: This table contains the results of a pooled ordinary least squares regression, which examines the ASEAN’s environmental performance relative to non-ASEAN countries, while controlling for the country’s wealth: , where CCHit refers to the climate change index of the relevant country in year t, ASEANit is an independent dummy variable which takes on a value of 1 if it is an ASEAN country, and 0 otherwise, GDPit, which serves as a control variable, refers to the natural logarithm of the relevant country’s per capita GDP in year t, βi’s are the regression coefficients, and εit is an error term ~N[0, 1]. ***, ** show statistical significance at the 1% and 5% levels, respectively.
Table 2.
Environmental performance of countries within ASEAN relative to countries within other regions.
Table 2.
Environmental performance of countries within ASEAN relative to countries within other regions.
| Variable | Coefficient | p-Value | t-Statistic |
|---|---|---|---|
| Constant term | 24.74 *** | 0.0000 | 6.41 |
| ASEAN | −4.15 *** | 0.0091 | −2.60 |
| Eastern Europe | 13.85 *** | 0.0000 | 10.76 |
| Former Soviet States | 10.92 *** | 0.0000 | 7.81 |
| Global West | 13.62 *** | 0.0000 | 10.12 |
| Greater Middle East | −6.94 *** | 0.0000 | −4.84 |
| Latin America & Caribbean | 1.40 | 0.2724 | 1.10 |
| Southern Asia | −2.17 | 0.3427 | −0.949 |
| Sub-Saharan Africa | −1.72 | 0.2246 | −1.21 |
| GDP | 2.61 *** | 0.0000 | 6.68 |
| Number of observations | 2725 | ||
| R-squared | 0.312 | ||
| F-statistic | 136.80 *** | ||
Note: This table contains the results of a pooled ordinary least squares regression model of how a country’s environmental performance changes if it belongs to the ASEAN region, relative to other geographic regions of the world, while controlling for the country’s wealth: , where CCHit refers to the climate change index of the relevant country in year t, Regionit are dummy variables representing the regions of the ASEAN, Eastern Europe, Former Soviet States, the Global West, Greater Middle East, Latin America & Caribbean, Southern Asia, and Sub-Saharan Africa. They take on a value of 1 if a country belongs to that region. GDPit refers to the natural logarithm of each individual country’s GDP per capita over time. βi’s are the regression coefficients, and εit is an error term ~ N[0, 1]. *** shows statistical significance at the 1% level.
Table 3.
Environmental performance among individual ASEAN countries.
| Variable | Coefficient | p-Value | t-Statistic |
|---|---|---|---|
| Constant term | 12.81 | 0.8084 | 0.24 |
| Singapore | 6.88 ** | 0.0435 | 2.04 |
| Indonesia | 6.64 | 0.5627 | 0.58 |
| Malaysia | −4.08 | 0.5789 | −0.56 |
| Philippines | 11.36 | 0.3907 | 0.86 |
| Thailand | 2.38 | 0.8016 | 0.25 |
| GDP | 3.00 | 0.8084 | 0.25 |
| Number of observations | 2725 | ||
| R-squared | 0.157 | ||
| F-statistic | 4.24 *** | ||
Note: This table contains the results of a pooled ordinary least squares regression of how environmental performance differs among the various countries within the ASEAN region, while controlling for the country’s wealth: , where CCHit refers to the climate change index of the relevant country in year t, Countrykt are dummy variables representing the ASEAN countries of Singapore, Indonesia, Malaysia, the Philippines and Thailand. The dummies take on a value of 1 if the observation belongs to that country. GDPit refers to the natural logarithm of each individual country’s GDP per capita over time. βi’s are the regression coefficients, and εit is an error term ~N[0, 1]. *** and ** show statistical significance at the 1% and 5% levels, respectively.
Table 4.
Environmental performance and government effectiveness in ASEAN relative to non-ASEAN countries.
Table 4.
Environmental performance and government effectiveness in ASEAN relative to non-ASEAN countries.
| Variable | Coefficient | p-Value | t-Statistic |
|---|---|---|---|
| Constant term | 24.36 ** | 0.0000 | 5.86 |
| ASEAN | −11.47 *** | 0.0000 | −8.41 |
| GDP | 3.16 *** | 0.0000 | 7.06 |
| GOE | 3.81 *** | 0.0000 | 7.93 |
| Number of observations | 2268 | ||
| R-squared | 0.1840 | ||
| F-statistic | 170.12 *** | ||
Note: This table contains the results of a pooled ordinary least squares regression of the environmental performance of ASEAN countries, relative to non-ASEAN countries while controlling for the country’s wealth and government effectiveness: , where CCHit refers to the climate change index of the relevant country in year t, ASEANit is a dummy variable which takes on 1 if it is an ASEAN country, and 0 otherwise. GDPit refers to the natural logarithm of each individual country’s per capita GDP over time and GOEit refers to the government effectiveness of the relevant country in year t. βi’s are the regression coefficients, and εit is an error term ~N[0, 1]. *** and ** show statistical significance at the 1% and 5% levels, respectively.
Table 5.
Environmental performance and government effectiveness of countries within the ASEAN region relative to countries within other regions.
Table 5.
Environmental performance and government effectiveness of countries within the ASEAN region relative to countries within other regions.
| Variable | Coefficient | p-Value | t-Statistic |
|---|---|---|---|
| Constant term | 24.83 *** | 0.0000 | 5.06 |
| ASEAN | −3.58 ** | 0.0359 | −2.10 |
| Eastern Europe | 13.98 *** | 0.0000 | 10.08 |
| Former Soviet States | 9.57 *** | 0.0000 | 6.17 |
| Global West | 14.07 *** | 0.0000 | 9.49 |
| Greater Middle East | −6.44 *** | 0.0001 | −4.03 |
| Latin America & Caribbean | 3.45 ** | 0.0130 | 2.49 |
| Southern Asia | −1.29 | 0.6005 | −0.52 |
| Sub-Saharan Africa | −1.14 | 0.4585 | −0.74 |
| GDP | 2.53 *** | 0.0000 | 4.93 |
| GOE | 0.61 | 0.2740 | 1.09 |
| Number of observations | 2268 | ||
| R-squared | 0.3256 | ||
| F-statistic | 108.97 *** | ||
Note: This table contains the results of a pooled ordinary least squares regression model of how a country’s environmental performance changes if it belongs to the ASEAN region, relative to other geographic regions of the world, while controlling for the country’s wealth and government effectiveness: , where CCHit refers to the climate change index of the relevant country in year t, Regionjt are dummy variables representing the regions of the ASEAN, Eastern Europe, Former Soviet States, the Global West, Greater Middle East, Latin America & Caribbean, Southern Asia, and Sub-Saharan Africa. GDPit refers to the natural logarithm of each individual country’s per capita GDP over time and GOEit refers to the government effectiveness in year t. βi’s are the regression coefficients, and εit is an error term ~N[0, 1]. *** and ** show statistical significance at the 1% and 5% levels, respectively.
Table 6.
Environmental performance and government effectiveness among individual ASEAN countries.
| Variable | Coefficient | p-Value | t-Statistic |
|---|---|---|---|
| Constant term | 90.82 | 0.1723 | 1.37 |
| Singapore | 2.73 | 0.7826 | 0.28 |
| Indonesia | −3.73 | 0.7830 | −0.28 |
| Malaysia | −10.16 | 0.2778 | −1.09 |
| Philippines | −0.53 | 0.9723 | − 0.03 |
| Thailand | −5.28 | 0.6289 | − 0.48 |
| GDP | 3.00 | 0.4609 | 0.25 |
| GOE | 4.41 | 0.5279 | 0.633 |
| Number of observations | 2268 | ||
| R-squared | 0.1444 | ||
| F-statistic | 2.70 ** | ||
Note: This table contains the results of the pooled ordinary least squares regression on how environmental performance differs among the various countries within the ASEAN region while controlling for the country’s wealth and government effectiveness: , where CCHit refers to the climate change index of the relevant country in year t, Countrykt are dummy variables representing the ASEAN countries of Singapore, Indonesia, Malaysia, Philippines, and Thailand. GDPit refers to the natural logarithm of each individual country’s per capita GDP over time and GOEit refers to the government effectiveness in year t. βi’s are the regression coefficients, and εit is an error term ~N[0, 1]. ** shows statistical significance at the 5% levels.
Publisher’s Note: MDPI stays neutral with regard to jurisdictional claims in published maps and institutional affiliations. |
© 2022 by the authors. Licensee MDPI, Basel, Switzerland. This article is an open access article distributed under the terms and conditions of the Creative Commons Attribution (CC BY) license (https://creativecommons.org/licenses/by/4.0/).
Share and Cite
MDPI and ACS Style
Ding, D.K.; Beh, S.E. Climate Change and Sustainability in ASEAN Countries. Sustainability 2022, 14, 999. https://0-doi-org.brum.beds.ac.uk/10.3390/su14020999
AMA Style
Ding DK, Beh SE. Climate Change and Sustainability in ASEAN Countries. Sustainability. 2022; 14(2):999. https://0-doi-org.brum.beds.ac.uk/10.3390/su14020999
Chicago/Turabian StyleDing, David K., and Sarah E. Beh. 2022. "Climate Change and Sustainability in ASEAN Countries" Sustainability 14, no. 2: 999. https://0-doi-org.brum.beds.ac.uk/10.3390/su14020999
Note that from the first issue of 2016, this journal uses article numbers instead of page numbers. See further details here.