
Comparison of Individual Tree Height Estimated from LiDAR and Digital Aerial Photogrammetry in Young Forests


Abstract
:1. Introduction
2. Materials and Methods
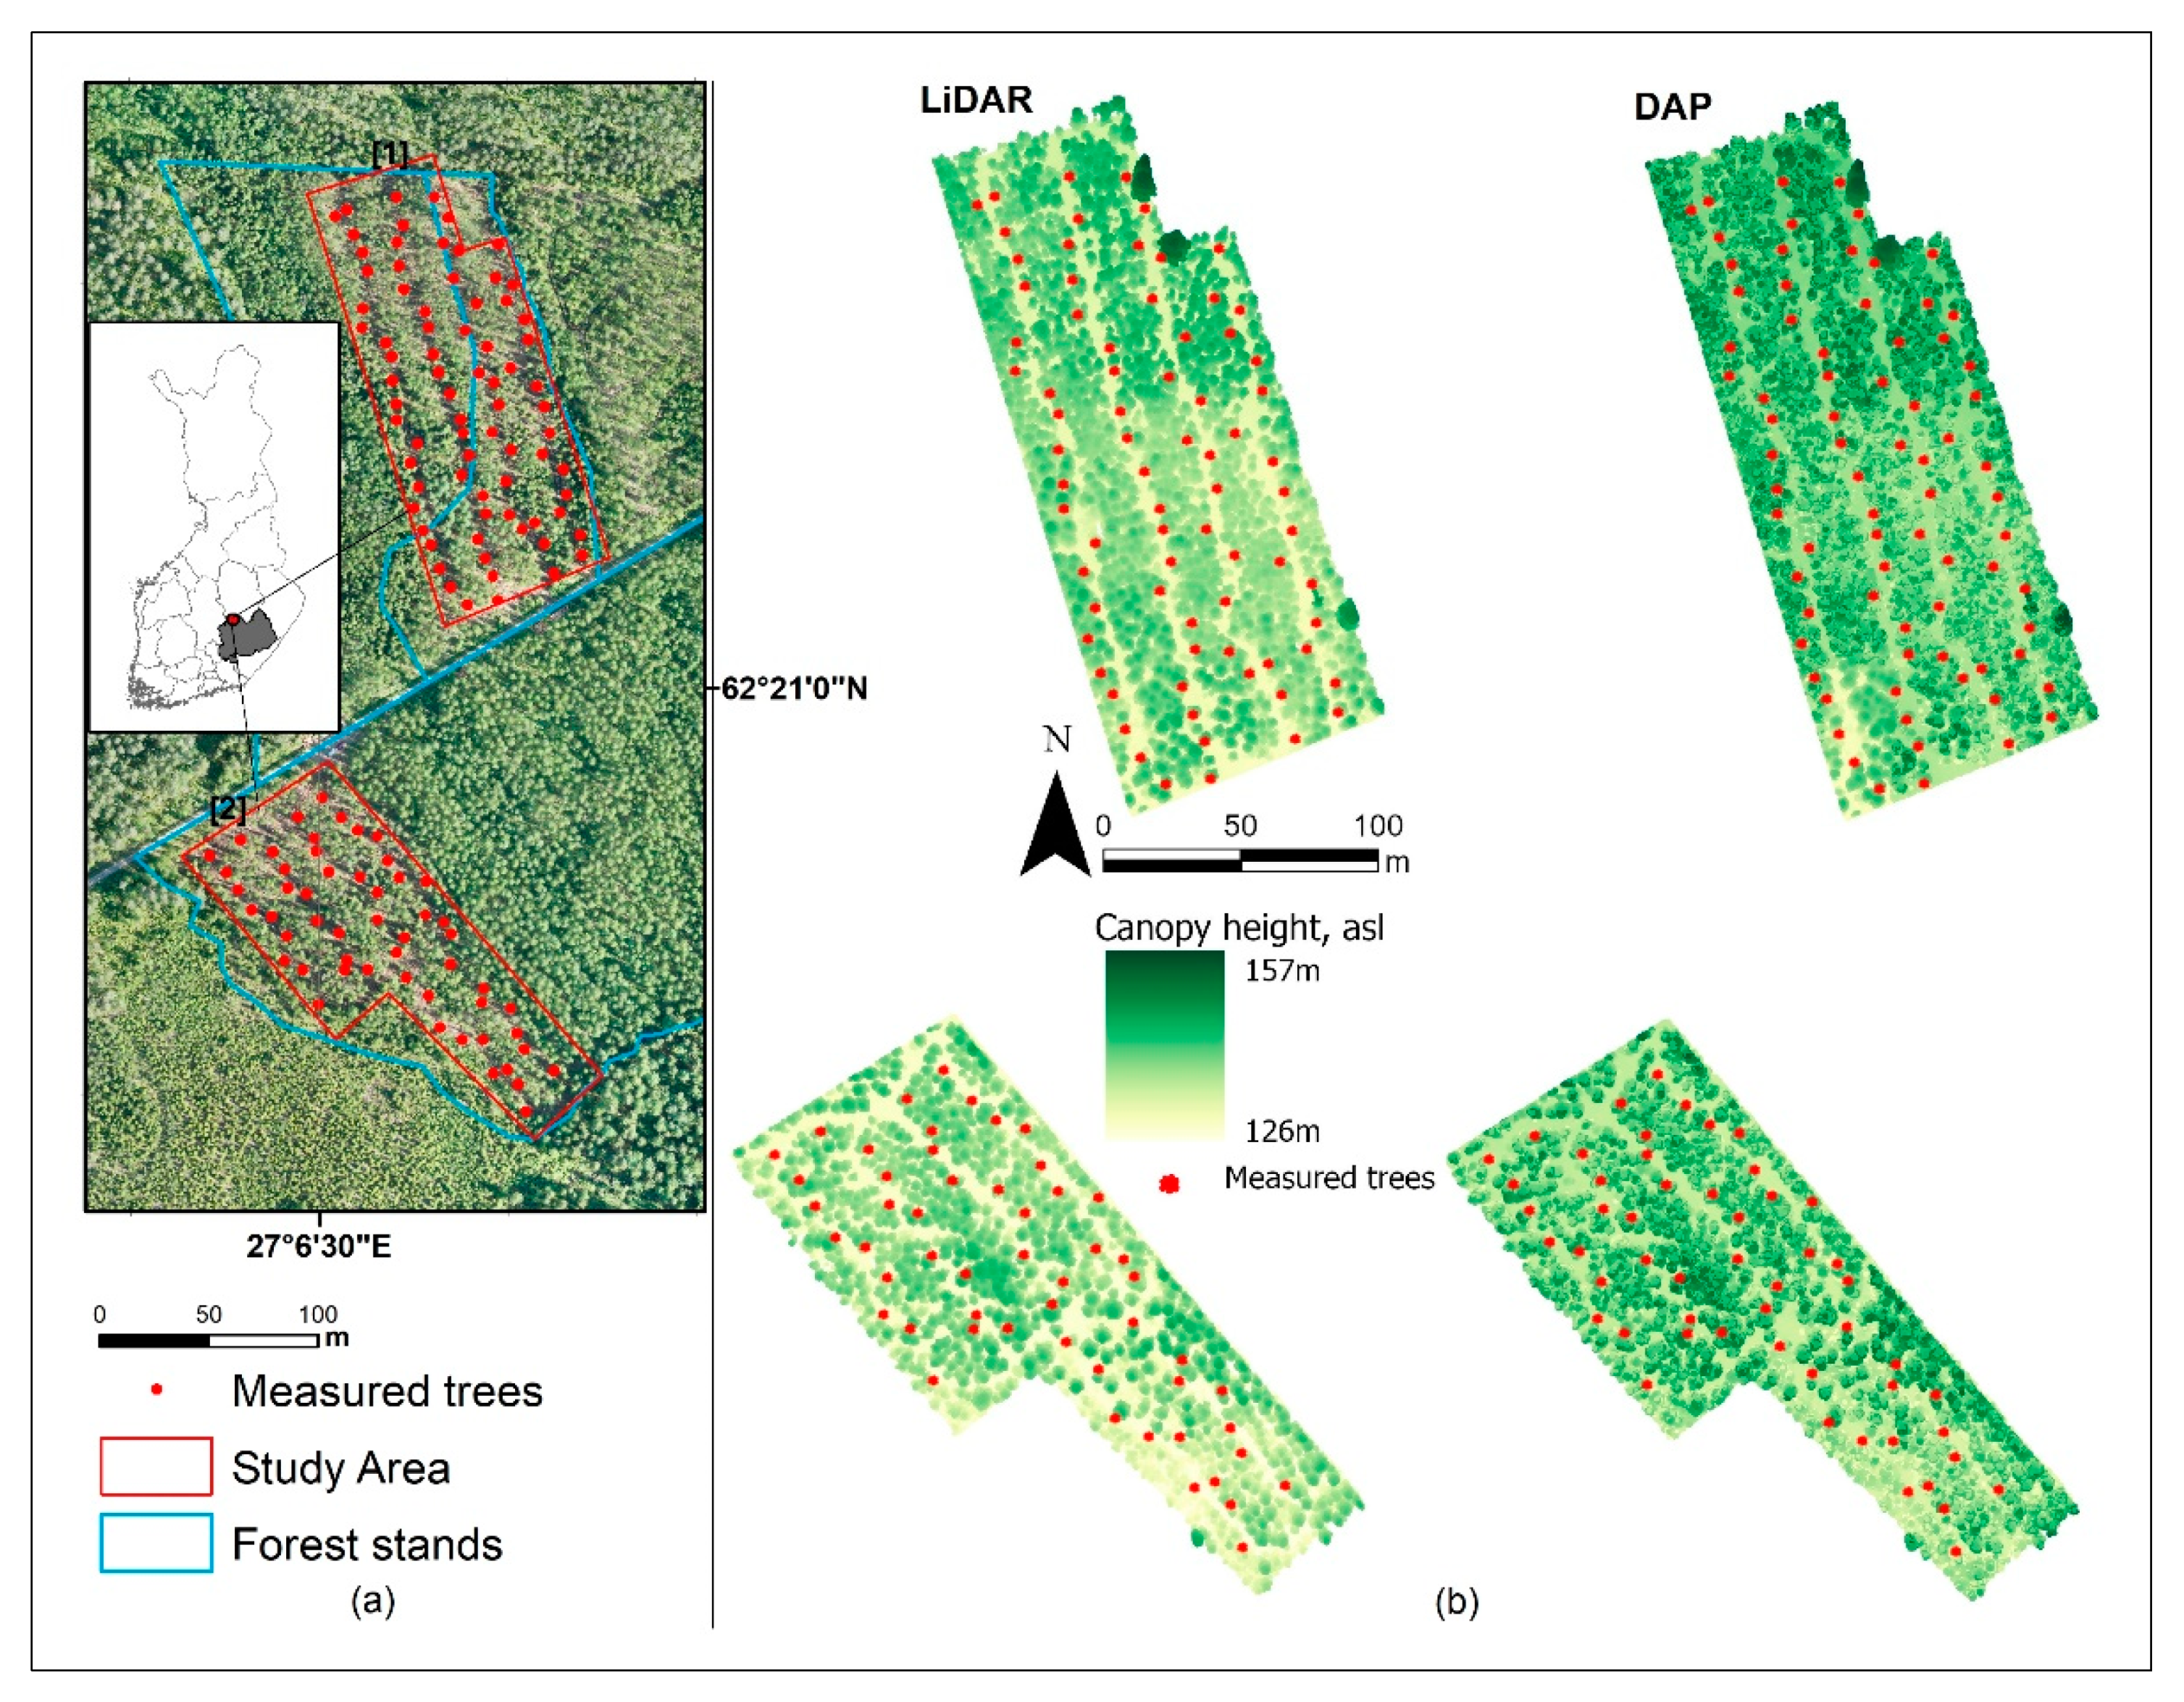
2.1. Study Area
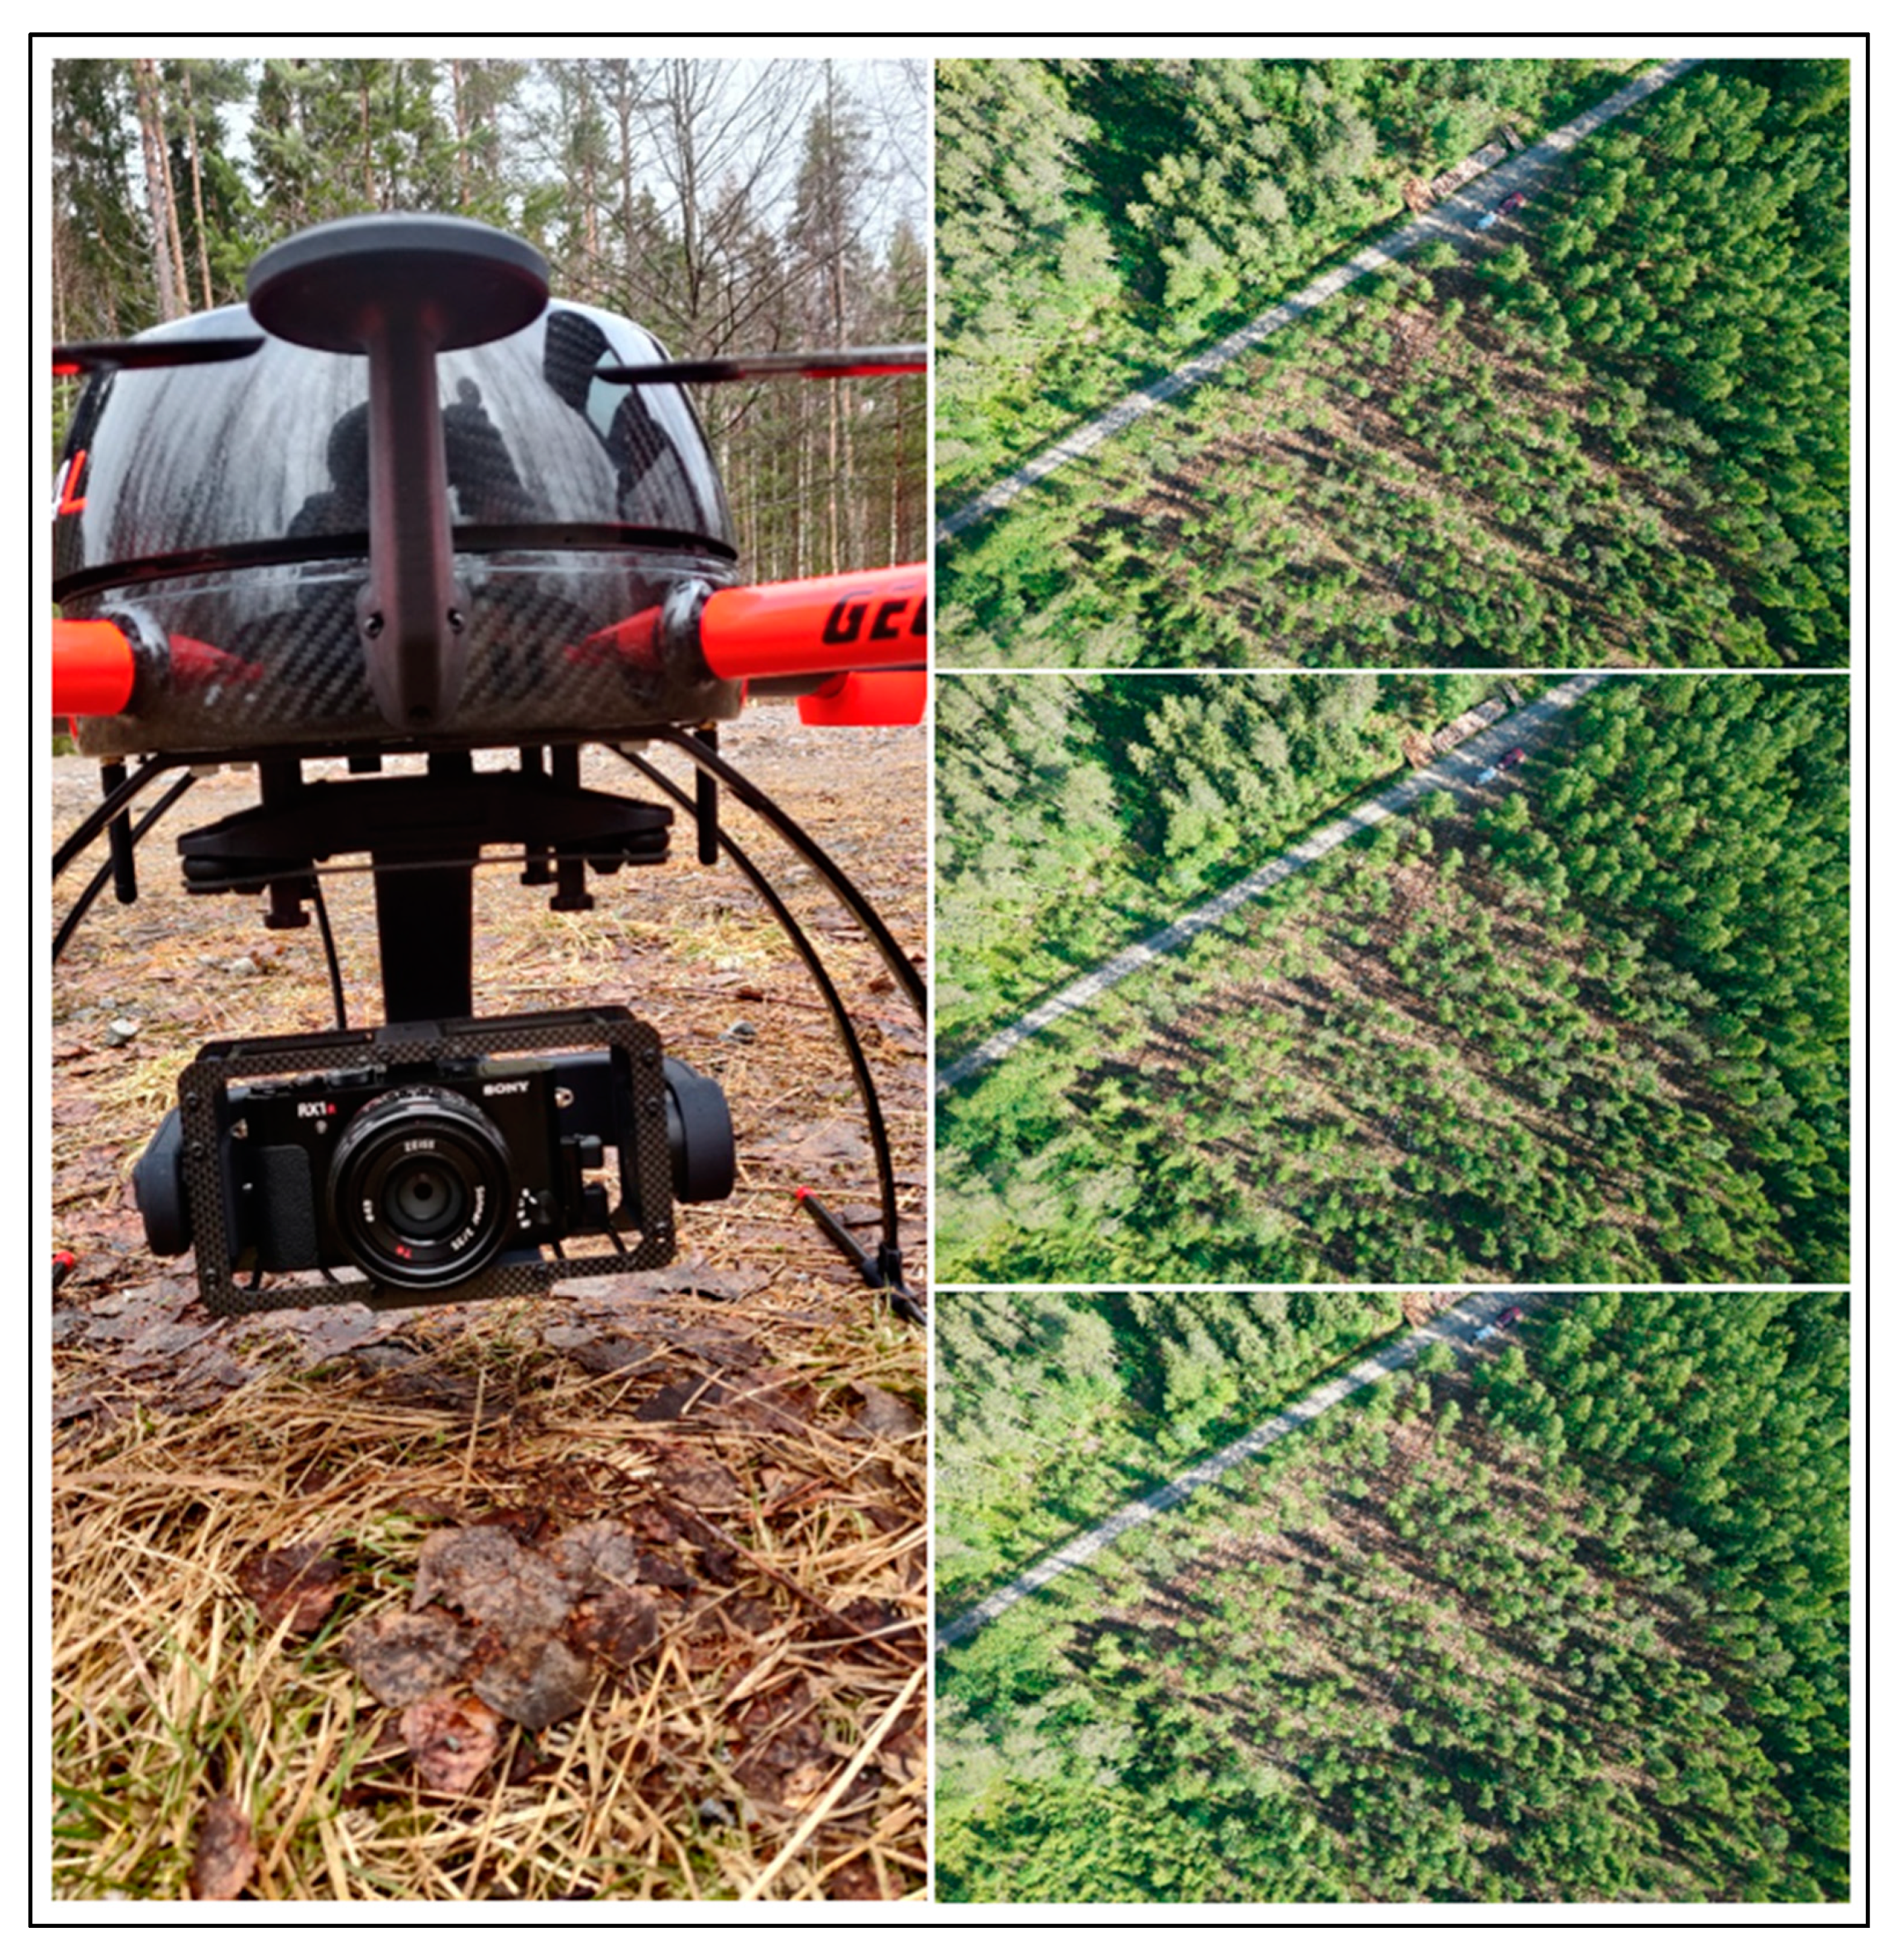
2.2. DAP Data
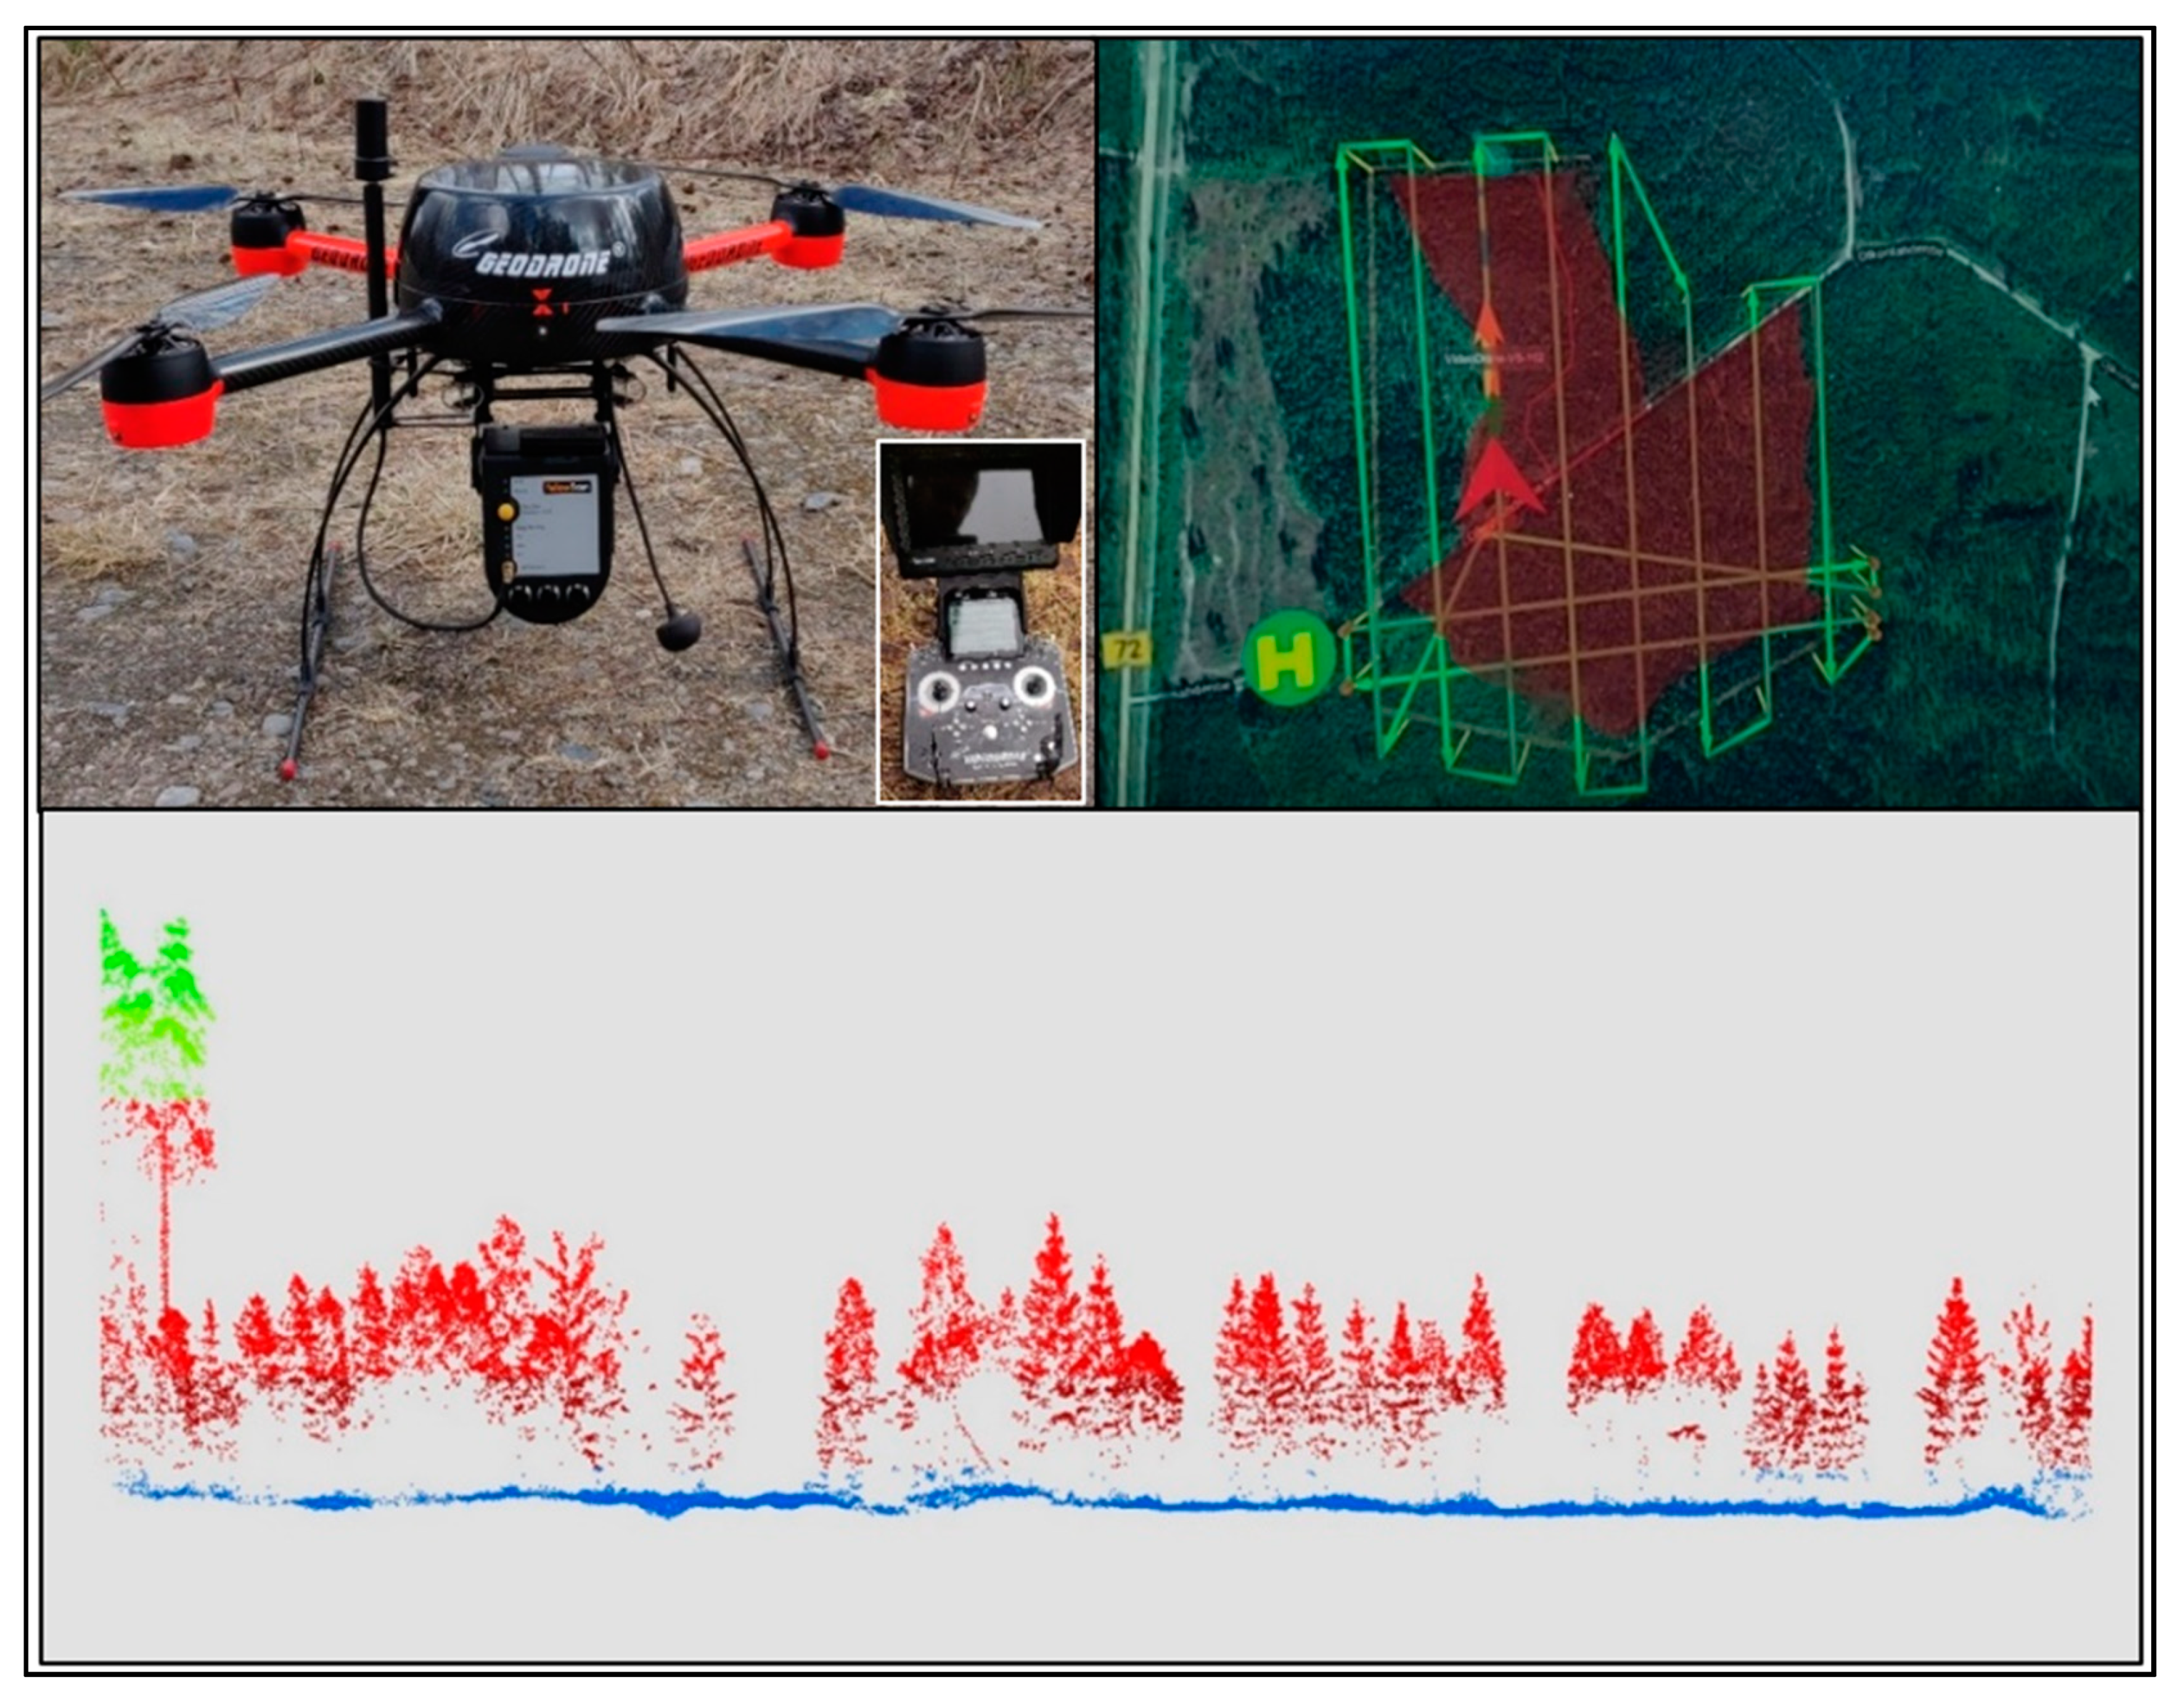
2.3. LiDAR Data
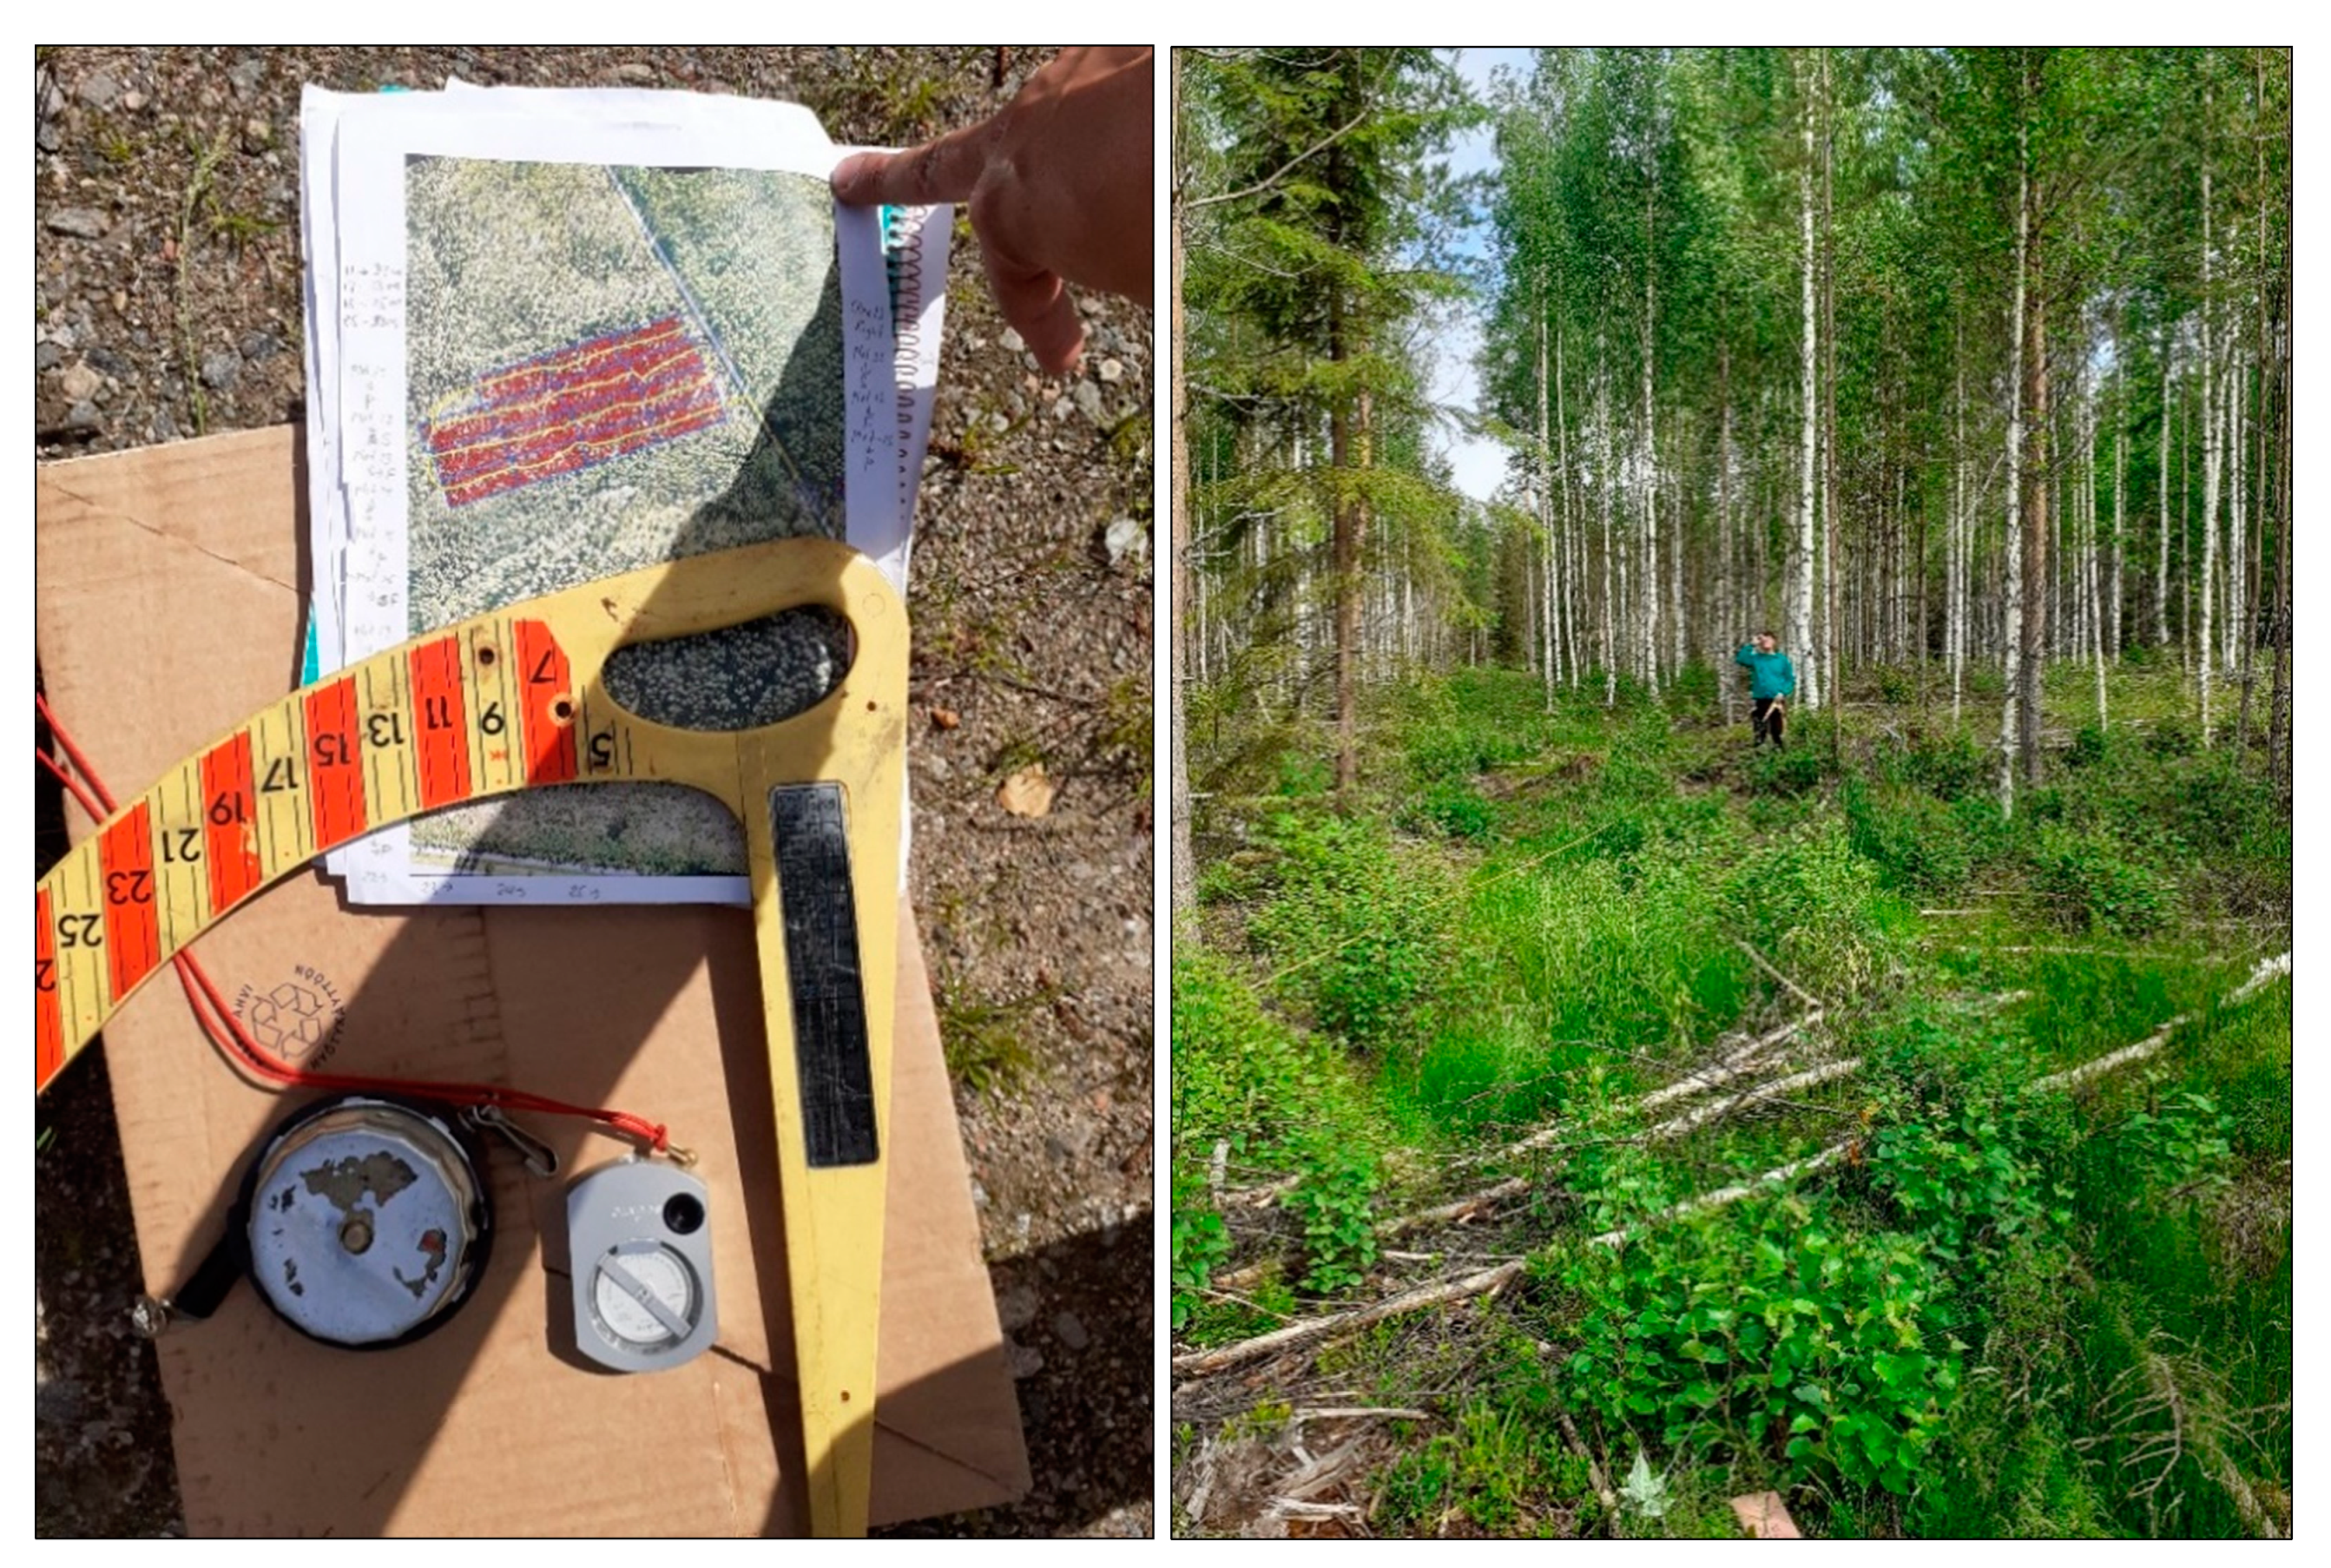
2.4. Validation Field Data Collection
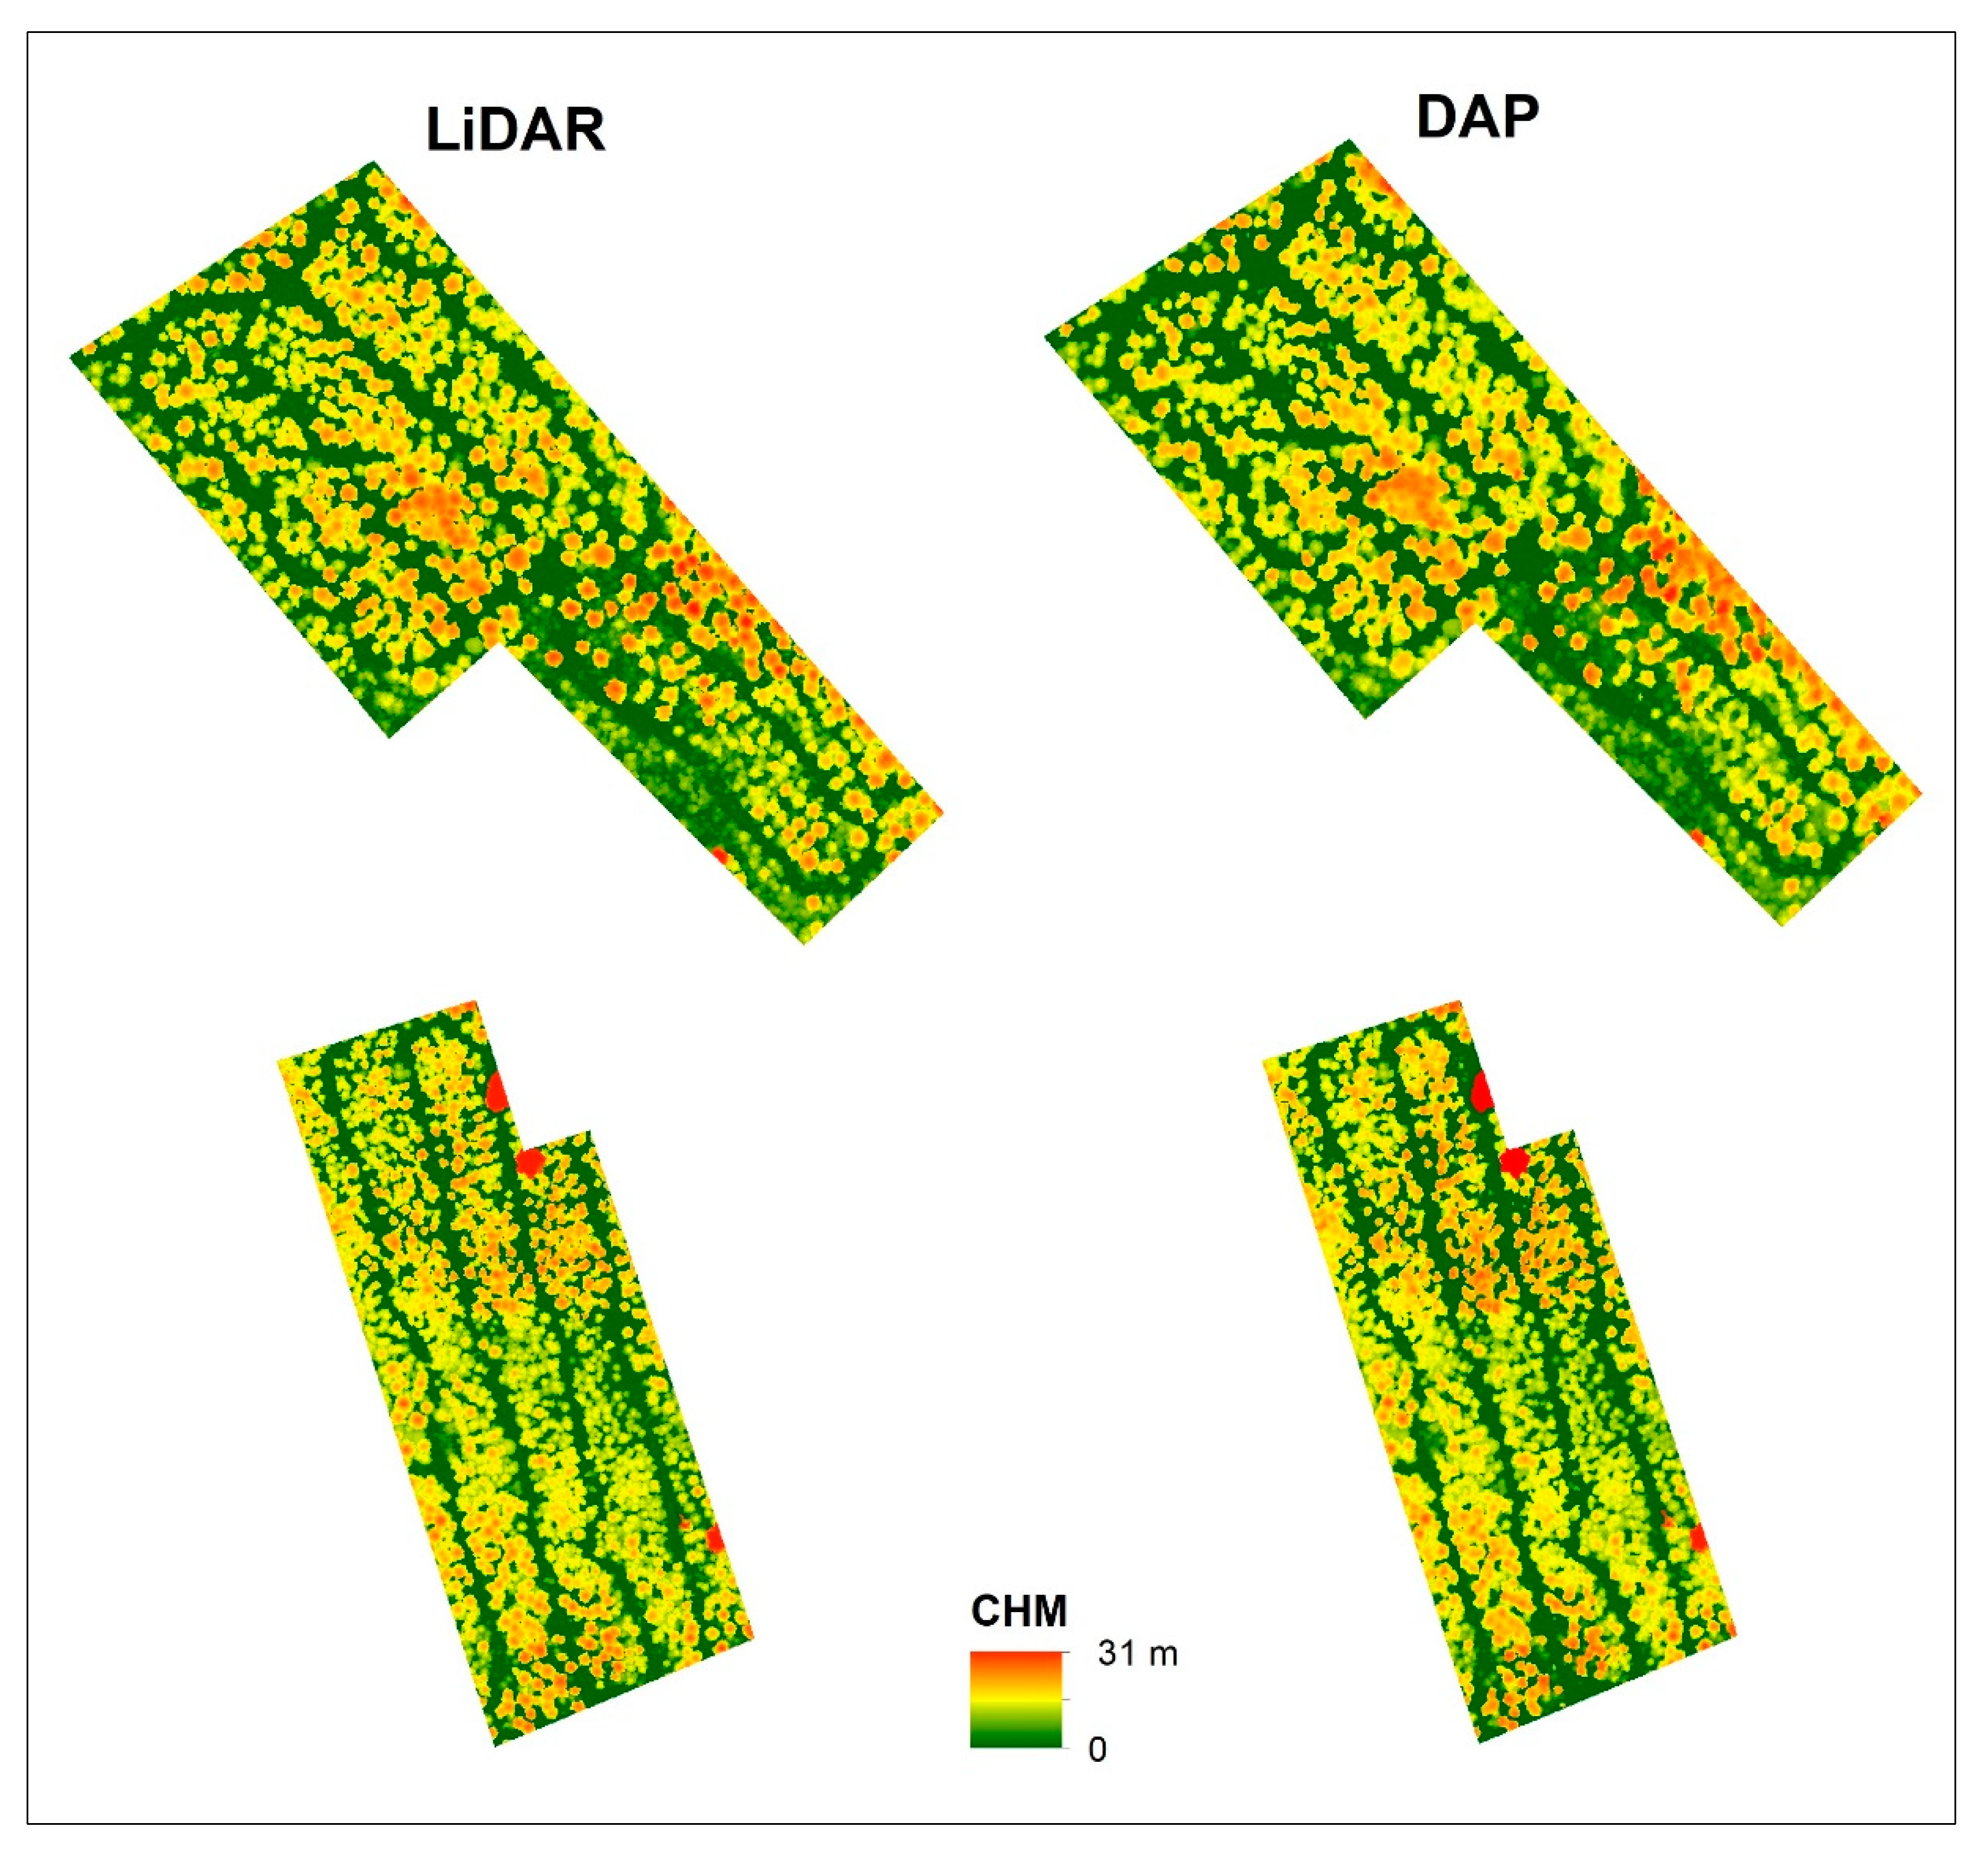
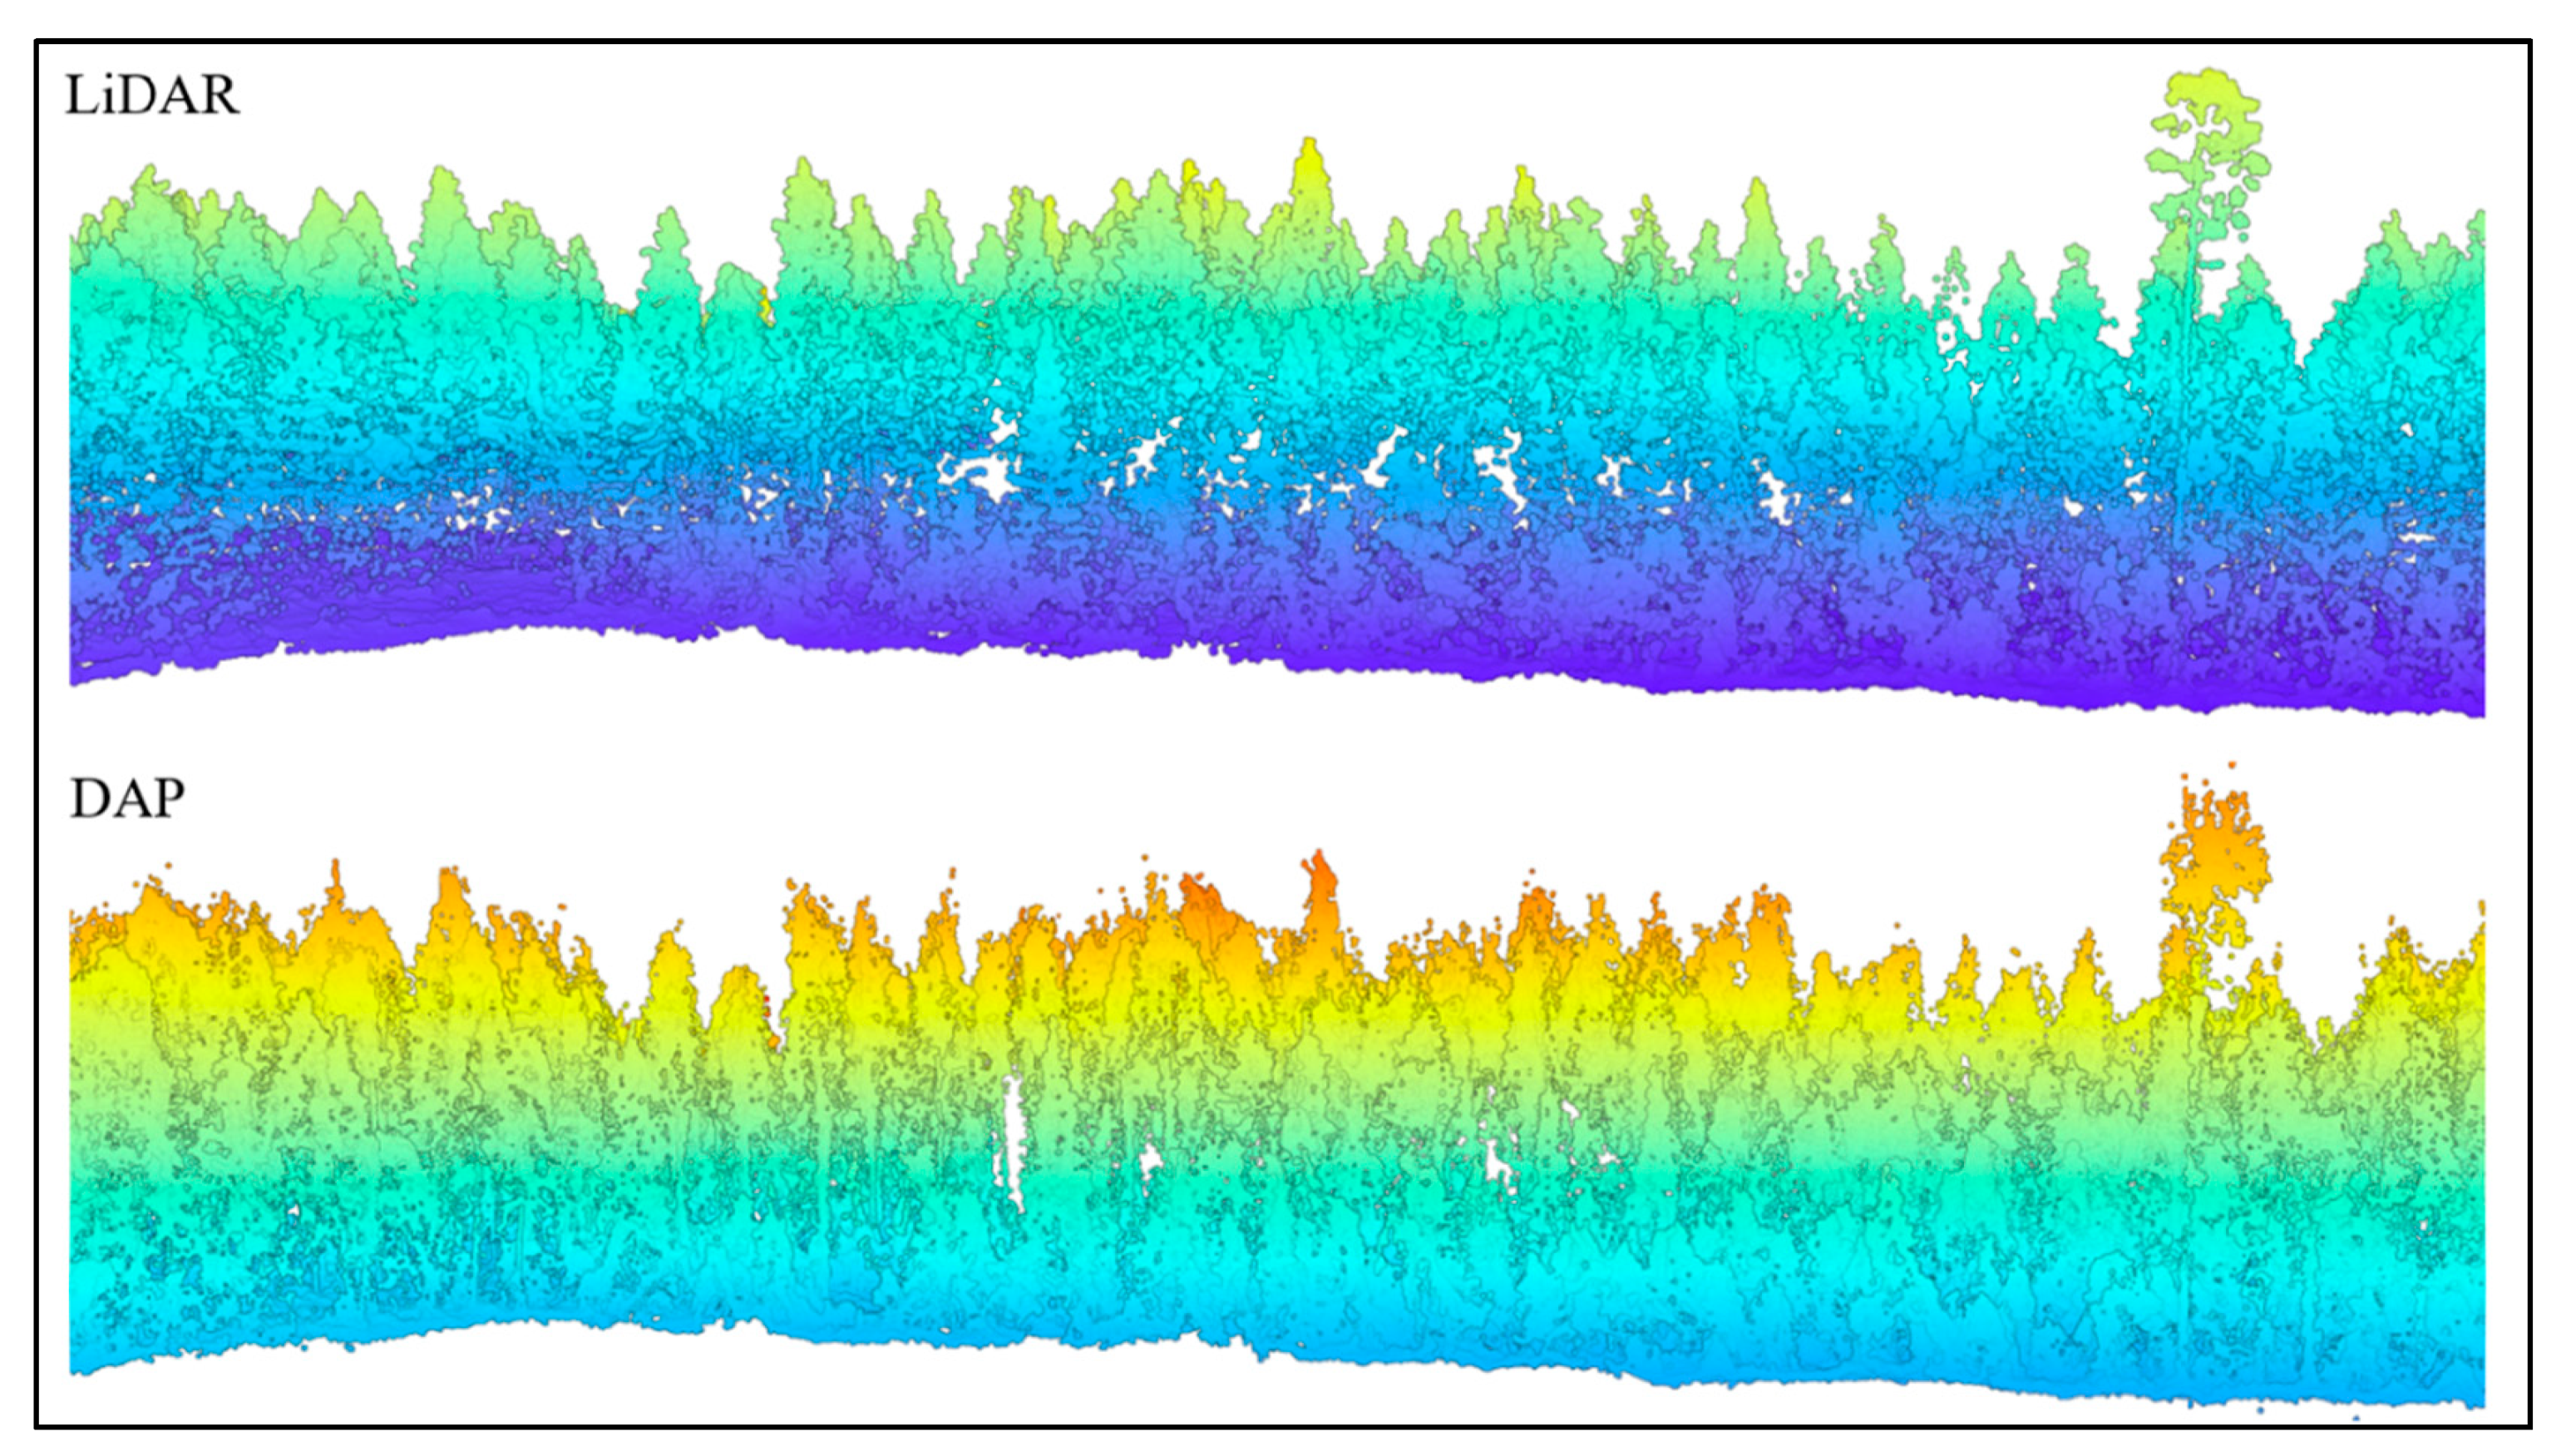
2.5. DAP and LiDAR Processing for CHM
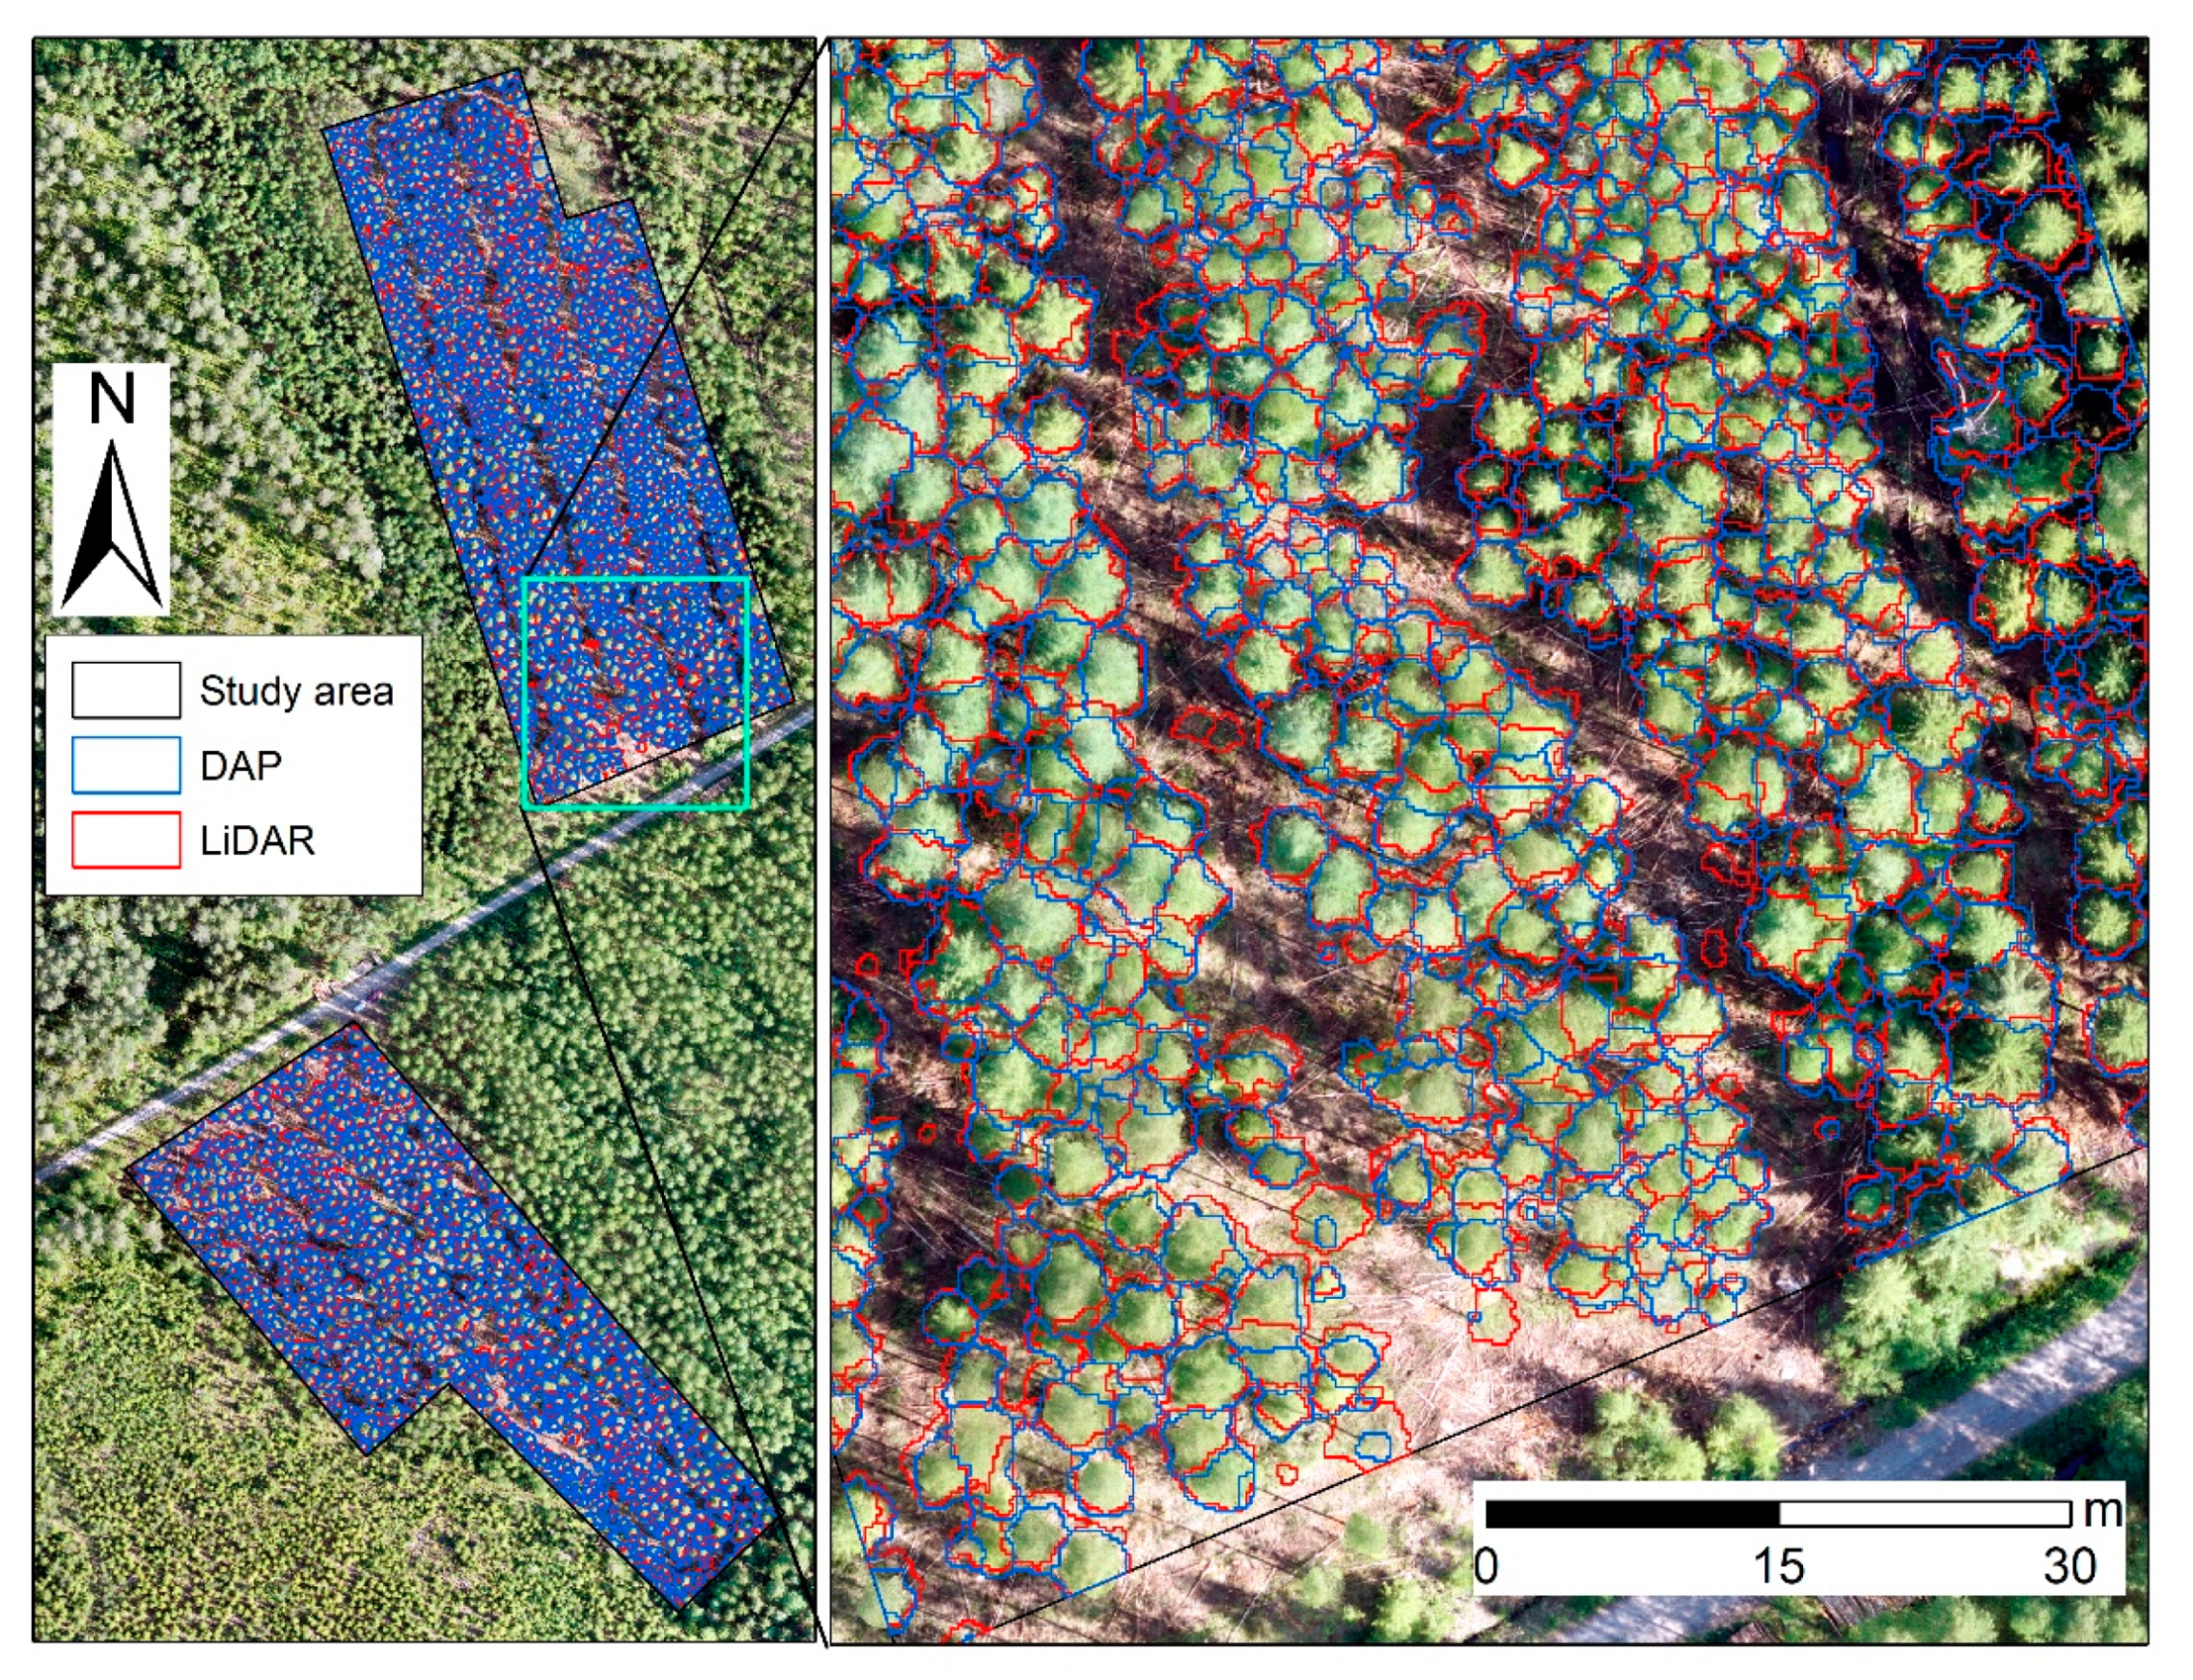
2.6. Estimation of Height from DAP and LiDAR
2.7. Data Analysis
3. Results
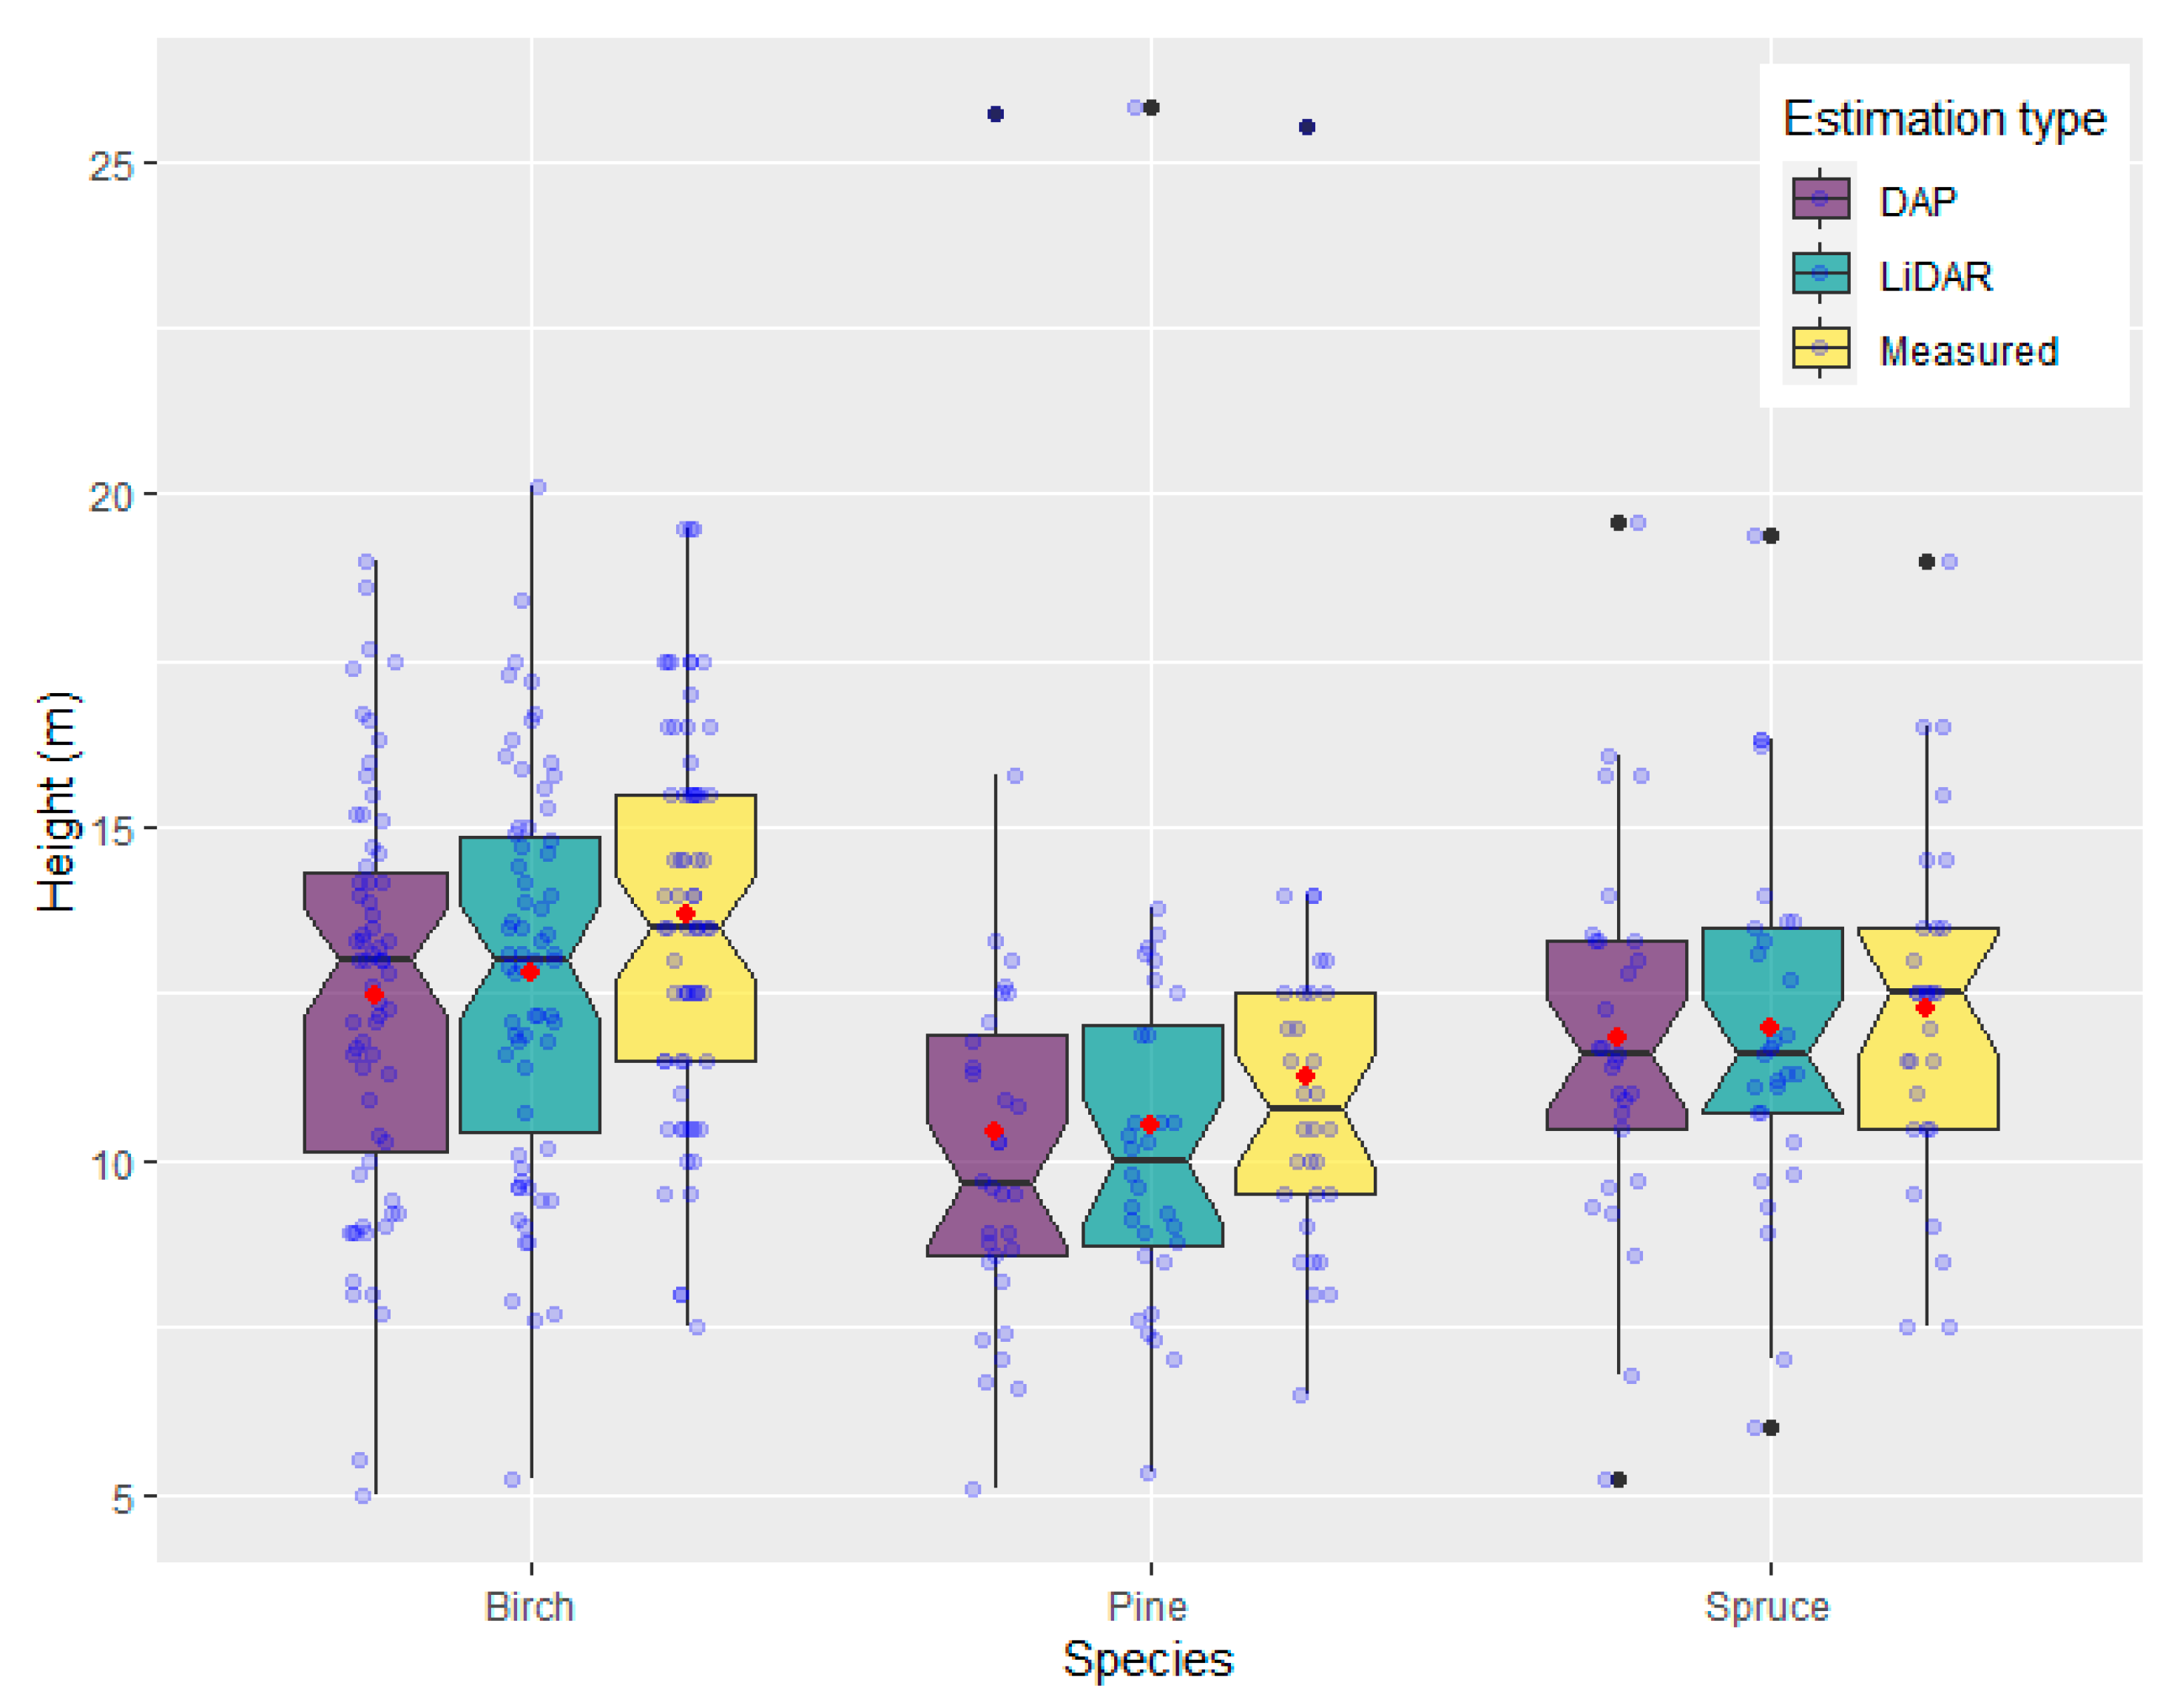
3.1. Descriptive Results
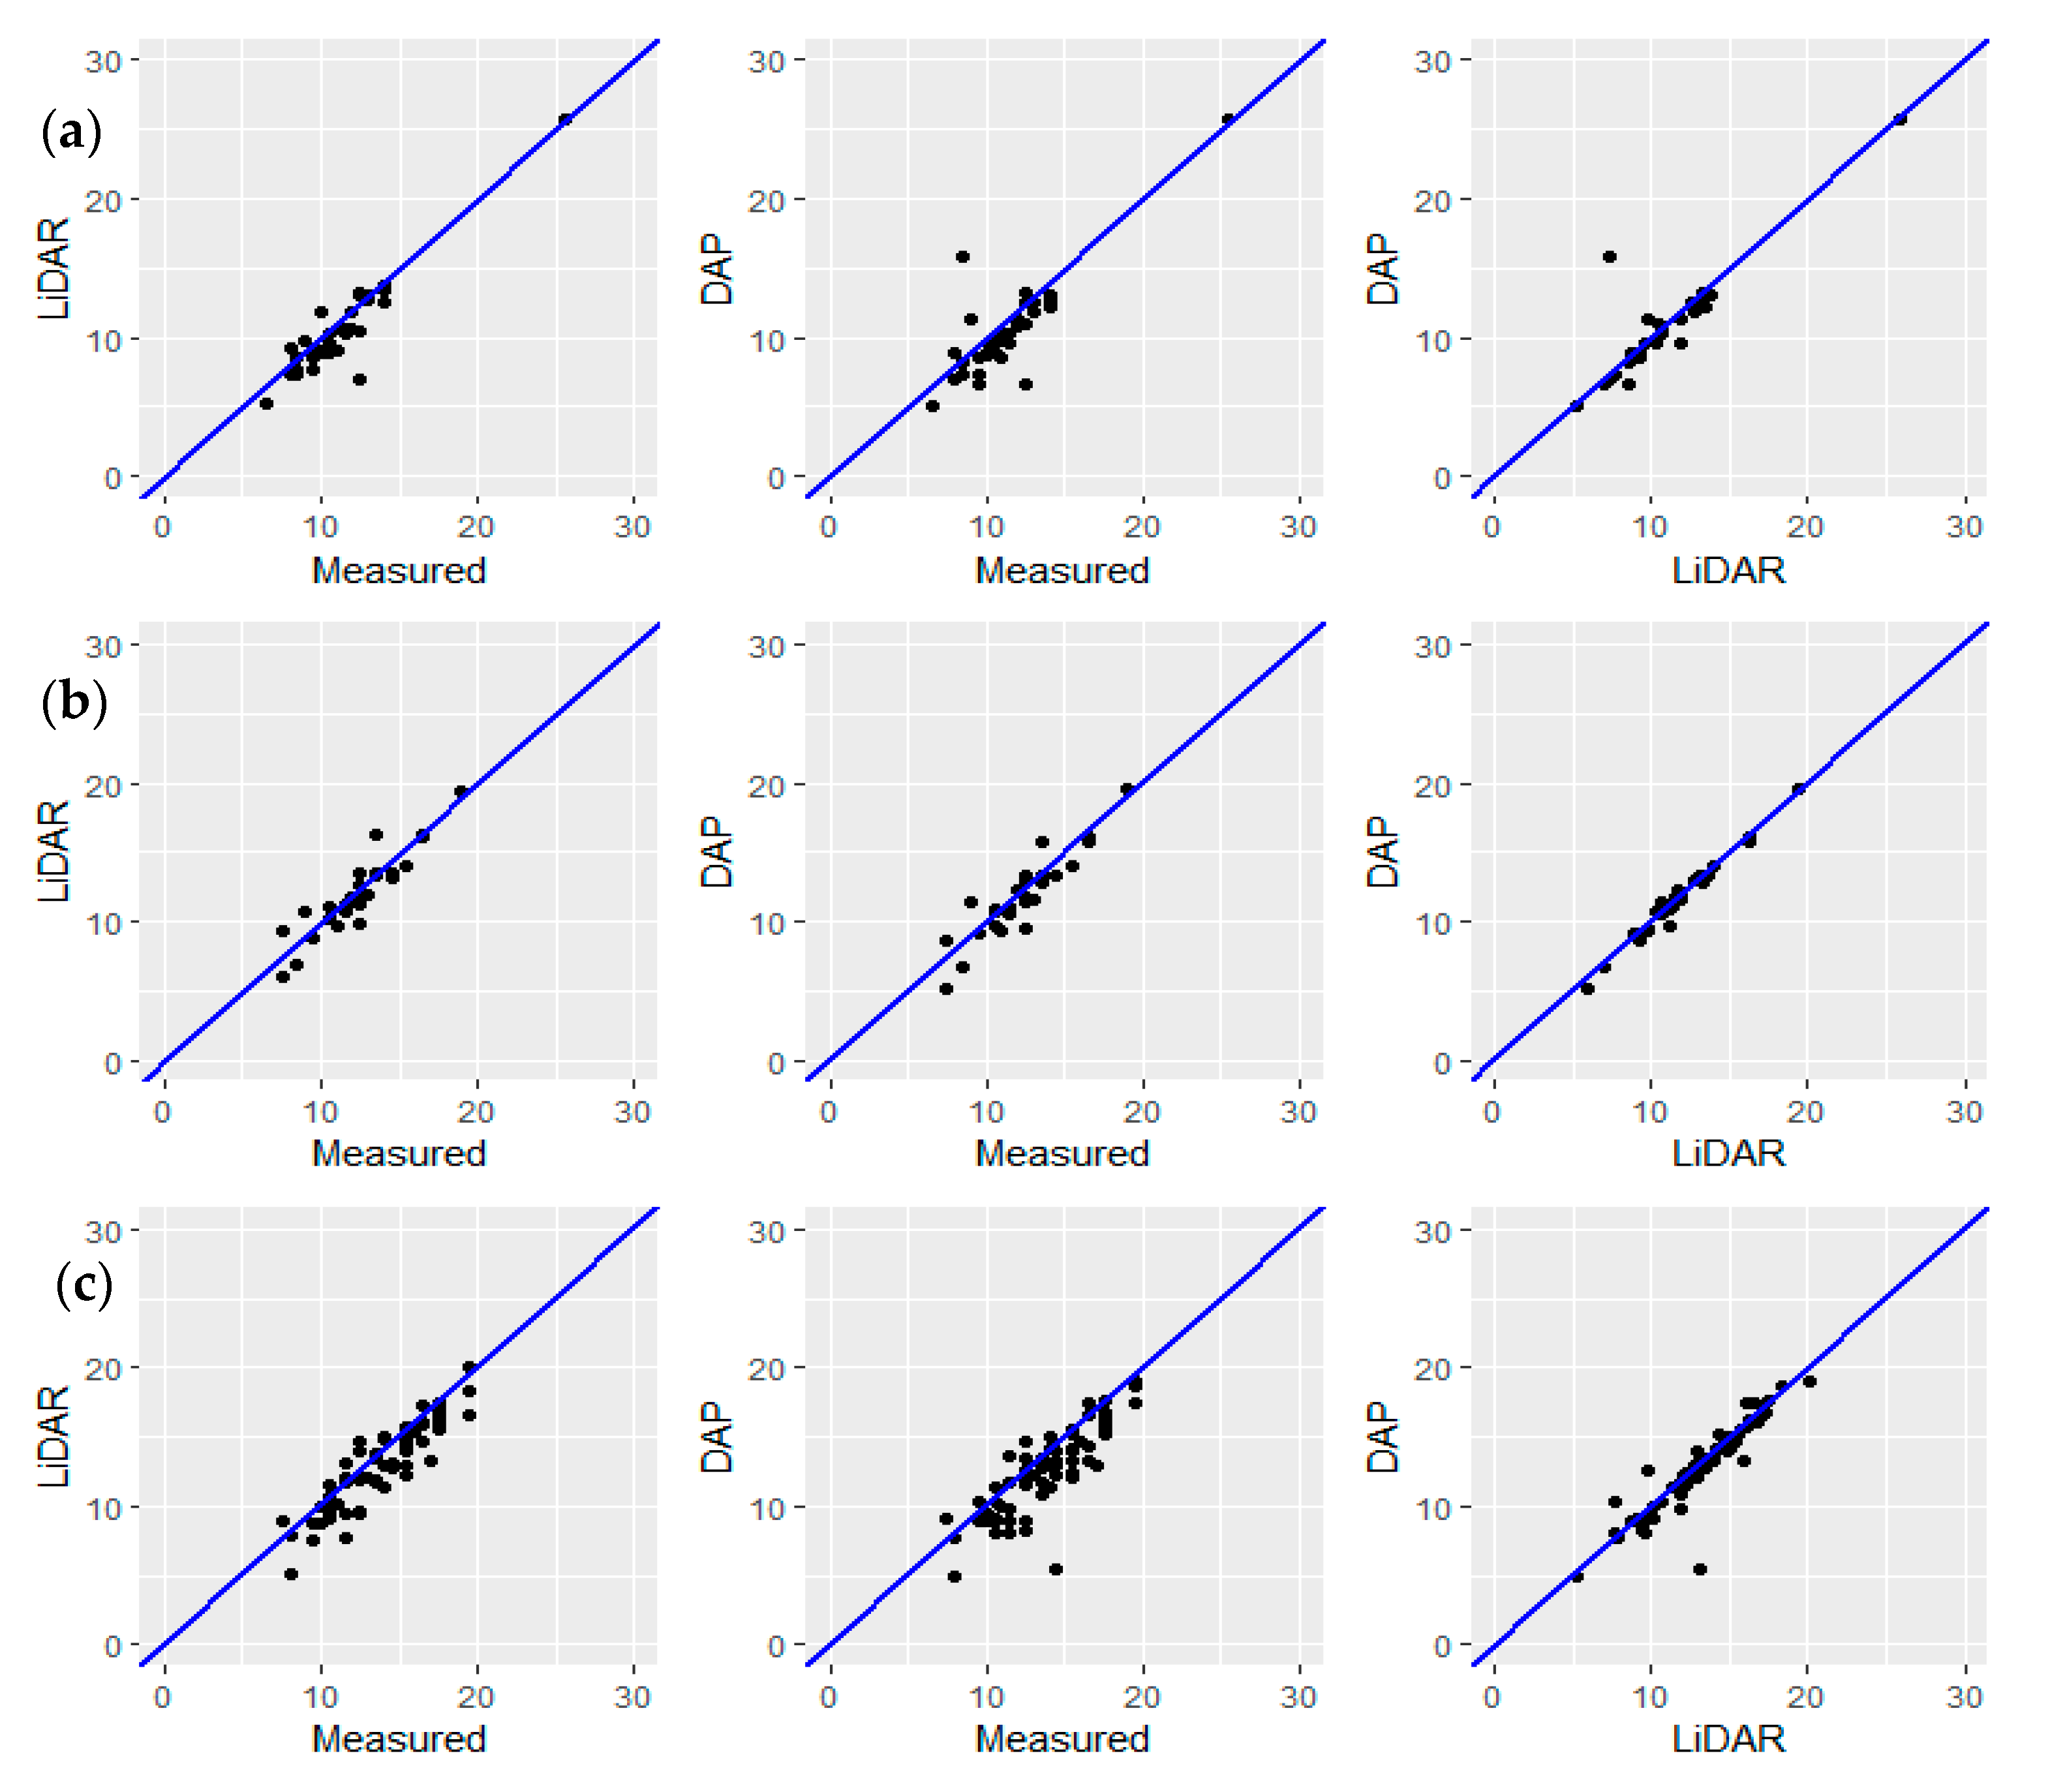
3.2. Correlation Analysis
3.3. Height Differences
3.3.1. Descriptive Results
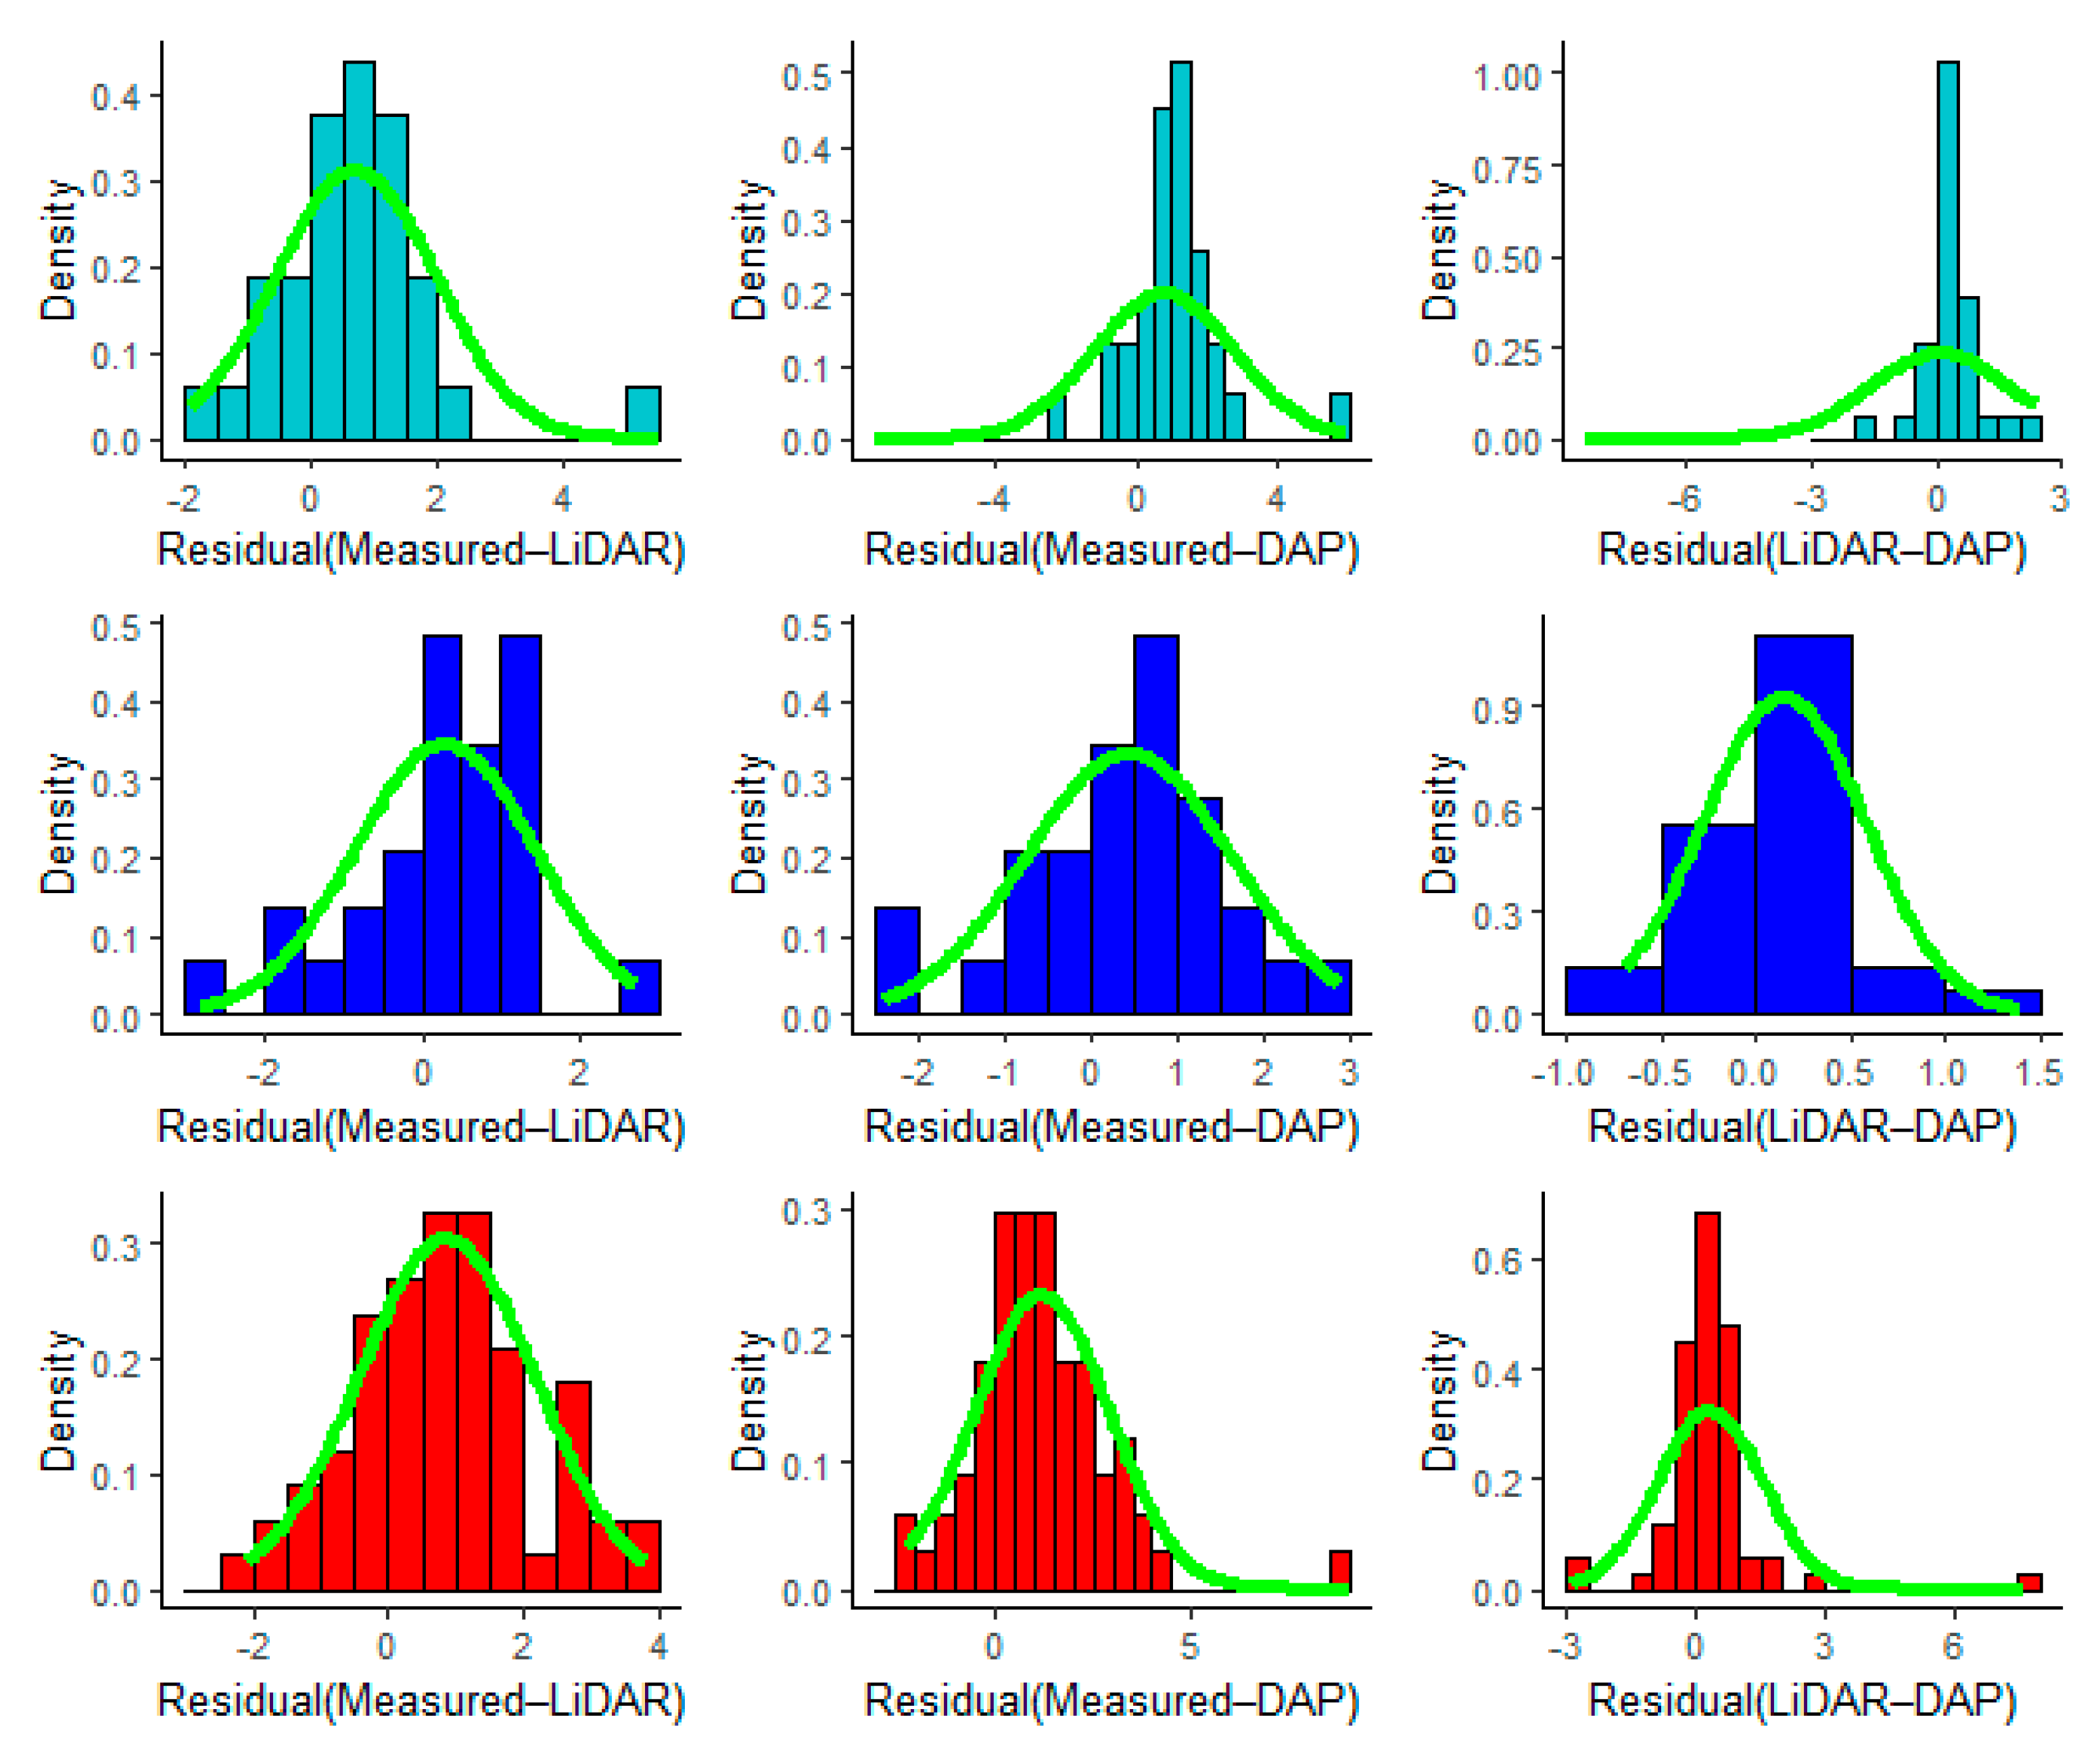
3.3.2. Normality of Residuals
3.3.3. Comparative Analysis
4. Discussion
5. Conclusions
Author Contributions
Funding
Institutional Review Board Statement
Informed Consent Statement
Data Availability Statement
Conflicts of Interest
Appendix A


References
- Official Statistics of Finland (OSF): Energy Supply and Consumption. Available online: https://www.stat.fi/til/ehk/2021/02/ehk_2021_02_2021-09-30_tie_001_en.html (accessed on 26 October 2021).
- Anttila, P.; Nivala, V.; Salminen, O.; Hurskainen, M.; Kärki, J.; Lindroos, T.J.; Asikainen, A. Regional balance of forest chip supply and demand in Finland in 2030. Silva Fenn. 2018, 52, 9902. [Google Scholar] [CrossRef] [Green Version]
- Ministry of Agriculture and Forestry. Metsätalouden Kannustejärjestelmä 2020-Luvulla Työryhmän Muistio; Ministry of Agriculture and Forestry: Helsinki, Finland, 2021; ISBN 9789523663978.
- Petty, A.; Kärhä, K. Effects of subsidies on the profitability of energy wood production of wood chips from early thinnings in Finland. For. Policy Econ. 2011, 13, 575–581. [Google Scholar] [CrossRef]
- Huttunen, R. Government Report on the National Energy and Climate Strategy for 2030; Ministry of Economic Affairs and Employment: Helsinki, Finland, 2017; ISBN 9789523271999. Available online: http://julkaisut.valtioneuvosto.fi/bitstream/handle/10024/79247/TEMjul_12_2017_verkkojulkaisu.pdf?sequence=1&isAllowed=y (accessed on 25 October 2021).
- Finnish Forest Centre: Collection of Forest Resource Information. Available online: https://www.metsakeskus.fi/en/open-forest-and-nature-information/collection-of-forest-resource-information (accessed on 9 November 2021).
- Kangas, A.; Astrup, R.; Breidenbach, J.; Fridman, J.; Gobakken, T.; Korhonen, K.T.; Maltamo, M.; Nilsson, M.; Nord-Larsen, T.; Næsset, E.; et al. Remote sensing and forest inventories in Nordic countries–roadmap for the future. Scand. J. For. Res. 2018, 33, 397–412. [Google Scholar] [CrossRef] [Green Version]
- Vaglio Laurin, G.; Ding, J.; Disney, M.; Bartholomeus, H.; Herold, M.; Papale, D.; Valentini, R. Tree height in tropical forest as measured by different ground, proximal, and remote sensing instruments, and impacts on above ground biomass estimates. Int. J. Appl. Earth Obs. Geoinf. 2019, 82, 101899. [Google Scholar] [CrossRef]
- Luoma, V.; Saarinen, N.; Wulder, M.A.; White, J.C.; Vastaranta, M.; Holopainen, M.; Hyyppä, J. Assessing precision in conventional field measurements of individual tree attributes. Forests 2017, 8, 38. [Google Scholar] [CrossRef] [Green Version]
- Sibona, E.; Vitali, A.; Meloni, F.; Caffo, L.; Dotta, A.; Lingua, E.; Motta, R.; Garbarino, M. Direct measurement of tree height provides different results on the assessment of LiDAR accuracy. Forests 2017, 8, 7. [Google Scholar] [CrossRef]
- Stereńczak, K.; Mielcarek, M.; Wertz, B.; Bronisz, K.; Zajączkowski, G.; Jagodziński, A.M.; Ochał, W.; Skorupski, M. Factors influencing the accuracy of ground-based tree-height measurements for major European tree species. J. Environ. Manag. 2019, 231, 1284–1292. [Google Scholar] [CrossRef]
- Vatandaşlar, C.; Zeybek, M. Extraction of forest inventory parameters using handheld mobile laser scanning: A case study from Trabzon, Turkey. Meas. J. Int. Meas. Confed. 2021, 177, 109328. [Google Scholar] [CrossRef]
- Hyyppä, J.; Yu, X.; Hyyppä, H.; Vastaranta, M.; Holopainen, M.; Kukko, A.; Kaartinen, H.; Jaakkola, A.; Vaaja, M.; Koskinen, J.; et al. Remote Sensing Advances in Forest Inventory Using Airborne Laser Scanning. Remote Sens. 2012, 4, 1190–1207. [Google Scholar] [CrossRef] [Green Version]
- Bienert, A.; Georgi, L.; Kunz, M.; Maas, H.-G.; von Oheimb, G. Comparison and Combination of Mobile and Terrestrial Laser Scanning for Natural Forest Inventories. Forest 2018, 9, 395. [Google Scholar] [CrossRef] [Green Version]
- Hyyppä, E.; Kukko, A.; Kaijaluoto, R.; White, J.C.; Wulder, M.A.; Pyörälä, J.; Liang, X.; Yu, X.; Wang, Y.; Kaartinen, H.; et al. Accurate derivation of stem curve and volume using backpack mobile laser scanning. ISPRS J. Photogramm. Remote Sens. 2020, 161, 246–262. [Google Scholar] [CrossRef]
- Liang, X.; Hyyppä, J.; Kaartinen, H.; Lehtomäki, M.; Pyörälä, J.; Pfeifer, N.; Holopainen, M.; Brolly, G.; Francesco, P.; Hackenberg, J.; et al. International benchmarking of terrestrial laser scanning approaches for forest inventories. ISPRS J. Photogramm. Remote Sens. 2018, 144, 137–179. [Google Scholar] [CrossRef]
- Korpela, I.; Dahlin, B.; Schäfer, H.; Bruun, E.; Haapaniemi, F.; Honkasalo, J.; Ilvesniemi, S.; Kuutti, V.; Linkosalmi, M.; Mustonen, J.; et al. Single-tree forest inventory using lidar and aerial images for 3D treetop positioning, species recognition, height and crown width estimation. In Proceedings of the International Archives of the Photogrammetry, Remote Sensing and Spatial Information Sciences, Espoo, Finland, 12–14 September 2007; Volume XXXVI, part 3/W52. pp. 227–233. [Google Scholar]
- Carr, J.C.; Slyder, J.B. Individual tree segmentation from a leaf-off photogrammetric point cloud. Int. J. Remote Sens. 2018, 39, 5195–5210. [Google Scholar] [CrossRef]
- Mot, L.; Hong, S.; Charoenjit, K.; Zhang, H. Tree Height Estimation Using Field Measurement and Low-Cost Unmanned Aerial Vehicle (UAV) at Phnom Kulen National Park of Cambodia. In Proceedings of the 2021 9th International Conference on Agro-Geoinformatics (Agro-Geoinformatics 2021), Shenzhen, China, 26–29 July 2021; pp. 1–4. [Google Scholar]
- Picos, J.; Bastos, G.; Míguez, D.; Alonso, L.; Armesto, J. Individual tree detection in a eucalyptus plantation using unmanned aerial vehicle (UAV)-LiDAR. Remote Sens. 2020, 12, 885. [Google Scholar] [CrossRef] [Green Version]
- Xu, D.; Wang, H.; Xu, W.; Luan, Z.; Xu, X. LiDAR applications to estimate forest biomass at individual tree scale: Opportunities, challenges and future perspectives. Forests 2021, 12, 550. [Google Scholar] [CrossRef]
- Peng, X.; Zhao, A.; Chen, Y.; Chen, Q.; Liu, H. Tree height measurements in degraded tropical forests based on UAV-LiDAR data of different point cloud densities: A case study on Dacrydium pierrei in China. Forests 2021, 12, 328. [Google Scholar] [CrossRef]
- de Oliveira, L.F.R.; Lassiter, H.A.; Wilkinson, B.; Whitley, T.; Ifju, P.; Logan, S.R.; Peter, G.F.; Vogel, J.G.; Martin, T.A. Moving to automated tree inventory: Comparison of uas-derived lidar and photogrammetric data with manual ground estimates. Remote Sens. 2021, 13, 72. [Google Scholar] [CrossRef]
- Dainelli, R.; Toscano, P.; Di Gennaro, S.F.; Matese, A. Recent advances in unmanned aerial vehicle forest remote sensing—A systematic review. Part i: A general framework. Forests 2021, 12, 327. [Google Scholar] [CrossRef]
- Dainelli, R.; Toscano, P.; Di Gennaro, S.F.; Matese, A. Recent advances in unmanned aerial vehicles forest remote sensing—A systematic review. Part ii: Research applications. Forests 2021, 12, 397. [Google Scholar] [CrossRef]
- Chisholm, R.A.; Rodríguez-Ronderos, M.E.; Lin, F. Estimating tree diameters from an autonomous below-canopy uav with mounted lidar. Remote Sens. 2021, 13, 2576. [Google Scholar] [CrossRef]
- Næsset, E. Predicting forest stand characteristics with airborne scanning laser using a practical two-stage procedure and field data. Remote Sens. Environ. 2002, 80, 88–99. [Google Scholar] [CrossRef]
- Goodwin, N.R.; Coops, N.C.; Culvenor, D.S. Assessment of forest structure with airborne LiDAR and the effects of platform altitude. Remote Sens. Environ. 2006, 103, 140–152. [Google Scholar] [CrossRef]
- Wang, Y.; Koch, B. A Lidar Point Cloud Based Procedure for Vertical Canopy Structure Analysis and 3D Single Tree Modelling in Forest. Sensors 2008, 8, 3938–3951. [Google Scholar] [CrossRef] [PubMed] [Green Version]
- Toth, C.; Jóźków, G. Remote sensing platforms and sensors: A survey. ISPRS J. Photogramm. Remote Sens. 2016, 115, 22–36. [Google Scholar] [CrossRef]
- Wulder, M.A.; Bater, C.W.; Coops, N.C.; Hilker, T.; White, J.C. The role of LiDAR in sustainable forest management. For. Chron. 2008, 84, 807–826. [Google Scholar] [CrossRef] [Green Version]
- Mielcarek, M.; Kamińska, A.; Stereńczak, K. Digital aerial photogrammetry (DAP) and airborne laser scanning (ALS) as sources of information about tree height: Comparisons of the accuracy of remote sensing methods for tree height estimation. Remote Sens. 2020, 12, 1808. [Google Scholar] [CrossRef]
- Ganz, S.; Käber, Y.; Adler, P. Measuring Tree Height with Remote Sensing—A Comparison of Photogrammetric and LiDAR Data with Different Field Measurements. Forest 2019, 10, 694. [Google Scholar] [CrossRef] [Green Version]
- Wang, Y.; Lehtomäki, M.; Liang, X.; Pyörälä, J.; Kukko, A.; Jaakkola, A.; Liu, J.; Feng, Z.; Chen, R.; Hyyppä, J. Is field-measured tree height as reliable as believed—A comparison study of tree height estimates from field measurement, airborne laser scanning and terrestrial laser scanning in a boreal forest. ISPRS J. Photogramm. Remote Sens. 2019, 147, 132–145. [Google Scholar] [CrossRef]
- Goodbody, T.R.H.; Coops, N.C.; White, J.C. Digital Aerial Photogrammetry for Updating Area-Based Forest Inventories: A Review of Opportunities, Challenges, and Future Directions. Curr. For. Rep. 2019, 5, 55–75. [Google Scholar] [CrossRef] [Green Version]
- Tuominen, S.; Pitkänen, T.; Balázs, A.; Kangas, A. Improving finnish multi-source national forest inventory by 3D aerial imaging. Silva Fenn. 2017, 51, 7743. [Google Scholar] [CrossRef] [Green Version]
- Bohlin, J.; Wallerman, J.; Fransson, J.E.S. Forest variable estimation using photogrammetric matching of digital aerial images in combination with a high-resolution DEM. Scand. J. For. Res. 2012, 27, 692–699. [Google Scholar] [CrossRef]
- Cao, L.; Liu, H.; Fu, X.; Zhang, Z.; Shen, X.; Ruan, H. Comparison of UAV LiDAR and Digital Aerial Photogrammetry Point Clouds for Estimating Forest Structural Attributes in Subtropical Planted Forests. Forest 2019, 10, 145. [Google Scholar] [CrossRef] [Green Version]
- Mlambo, R.; Woodhouse, I.H.; Gerard, F.; Anderson, K. Structure from Motion (SfM) Photogrammetry with Drone Data: A Low Cost Method for Monitoring Greenhouse Gas Emissions from Forests in Developing Countries. Forest 2017, 8, 68. [Google Scholar] [CrossRef] [Green Version]
- Tao, W.; Lei, Y.; Mooney, P. Dense point cloud extraction from UAV captured images in forest area. In Proceedings of the ICSDM 2011—2011 IEEE International Conference on Spatial Data Mining and Geographical Knowledge Services, Fuzhou, China, 29 June—1 July 2011; pp. 389–392. [Google Scholar]
- Hao, Z.; Lin, L.; Post, C.J.; Mikhailova, E.A.; Li, M.; Chen, Y.; Yu, K.; Liu, J. Automated tree-crown and height detection in a young forest plantation using mask region-based convolutional neural network (Mask R-CNN). ISPRS J. Photogramm. Remote Sens. 2021, 178, 112–123. [Google Scholar] [CrossRef]
- Hao, Z.; Lin, L.; Post, C.J.; Jiang, Y.; Li, M.; Wei, N.; Yu, K.; Liu, J. Assessing tree height and density of a young forest using a consumer unmanned aerial vehicle (UAV). New For. 2020, 52, 843–862. [Google Scholar] [CrossRef]
- Panagiotidis, D.; Abdollahnejad, A.; Surový, P.; Chiteculo, V. Determining tree height and crown diameter from high-resolution UAV imagery. Int. J. Remote Sens. 2017, 38, 2392–2410. [Google Scholar] [CrossRef]
- Kameyama, S.; Sugiura, K. Effects of differences in structure from motion software on image processing of unmanned aerial vehicle photography and estimation of crown area and tree height in forests. Remote Sens. 2021, 13, 626. [Google Scholar] [CrossRef]
- Wallace, L.; Lucieer, A.; Malenovskỳ, Z.; Turner, D.; Vopěnka, P. Assessment of forest structure using two UAV techniques: A comparison of airborne laser scanning and structure from motion (SfM) point clouds. Forests 2016, 7, 62. [Google Scholar] [CrossRef] [Green Version]
- Alonzo, M.; Andersen, H.E.; Morton, D.C.; Cook, B.D. Quantifying boreal forest structure and composition using UAV structure from motion. Forests 2018, 9, 119. [Google Scholar] [CrossRef] [Green Version]
- Kotivuori, E.; Kukkonen, M.; Mehtätalo, L.; Maltamo, M.; Korhonen, L.; Packalen, P. Forest inventories for small areas using drone imagery without in-situ field measurements. Remote Sens. Environ. 2020, 237, 111404. [Google Scholar] [CrossRef]
- Ullah, S.; Dees, M.; Datta, P.; Adler, P.; Schardt, M.; Koch, B. Potential of modern photogrammetry versus airborne laser scanning for estimating forest variables in a mountain environment. Remote Sens. 2019, 11, 661. [Google Scholar] [CrossRef] [Green Version]
- Straub, C.; Stepper, C.; Seitz, R.; Waser, L.T. Potential of UltraCamX stereo images for estimating timber volume and basal area at the plot level in mixed European forests. Can. J. For. Res. 2013, 43, 731–741. [Google Scholar] [CrossRef]
- Thiel, C.; Schmullius, C. Comparison of UAV photograph-based and airborne lidar-based point clouds over forest from a forestry application perspective. Int. J. Remote Sens. 2017, 38, 2411–2426. [Google Scholar] [CrossRef]
- Sankey, T.; Donager, J.; McVay, J.; Sankey, J.B. UAV lidar and hyperspectral fusion for forest monitoring in the southwestern USA. Remote Sens. Environ. 2017, 195, 30–43. [Google Scholar] [CrossRef]
- Moe, K.T.; Owari, T.; Furuya, N.; Hiroshima, T. Comparing individual tree height information derived from field surveys, LiDAR and UAV-DAP for high-value timber species in Northern Japan. Forests 2020, 11, 223. [Google Scholar] [CrossRef] [Green Version]
- Guerra-Hernández, J.; Cosenza, D.N.; Rodriguez, L.C.E.; Silva, M.; Tomé, M.; Díaz-Varela, R.A.; González-Ferreiro, E. Comparison of ALS-and UAV(SfM)-derived high-density point clouds for individual tree detection in Eucalyptus plantations. Int. J. Remote Sens. 2018, 39, 5211–5235. [Google Scholar] [CrossRef]
- Rodr, F.; Esteban, G.; Mart, S. UAV-Based LiDAR Scanning for Individual Tree Detection and Height Measurement in Young Forest Permanent Trials. Remote Sens. 2022, 14, 170. [Google Scholar] [CrossRef]
- Llorens, J.; Gil, E.; Llop, J.; Queraltó, M. Georeferenced LiDAR 3D vine plantation map generation. Sensors 2011, 11, 6237–6256. [Google Scholar] [CrossRef]
- Estornell, J.; Velázquez-Martí, B.; López-Cortés, I.; Salazar, D.; Fernández-Sarría, A. Estimation of wood volume and height of olive tree plantations using airborne discrete-return LiDAR data. GIScience Remote Sens. 2014, 51, 17–29. [Google Scholar] [CrossRef]
- Wallace, L.; Musk, R.; Lucieer, A. An assessment of the repeatability of automatic forest inventory metrics derived from UAV-borne laser scanning data. IEEE Trans. Geosci. Remote Sens. 2014, 52, 7160–7169. [Google Scholar] [CrossRef]
- Karpina, M.; Jarzabek-Rychard, M.; Tymków, P.; Borkowski, A. Uav-based automatic tree growth measurement for biomass estimation. In Proceedings of the International Archives of the Photogrammetry, Remote Sensing and Spatial Information Sciences—ISPRS Archives, Prague, Czech Republic, 12–19 July 2016; Volume XXIII ISPR, pp. 685–688. [Google Scholar]
- Hentz, Â.M.K.; Silva, C.A.; Dalla Corte, A.P.; Netto, S.P.; Strager, M.P.; Klauberg, C. Estimating forest uniformity in Eucalyptus spp. and Pinus taeda L. stands using field measurements and structure from motion point clouds generated from unmanned aerial vehicle (UAV) data collection. For. Syst. 2018, 27, 17. [Google Scholar] [CrossRef]
- Birdal, A.C.; Avdan, U.; Türk, T. Estimating tree heights with images from an unmanned aerial vehicle. Geomat., Nat. Hazards Risk 2017, 8, 1144–1156. [Google Scholar] [CrossRef] [Green Version]
- Wu, D.; Johansen, K.; Phinn, S.; Robson, A.; Tu, Y.-H. Inter-comparison of remote sensing platforms for height estimation of mango and avocado tree crowns. Int. J. Appl. Earth Obs. Geoinf. 2020, 89, 102091. [Google Scholar] [CrossRef]
- Hartley, R.J.L.; Leonardo, E.M.; Massam, P.; Watt, M.S.; Estarija, H.J.; Wright, L.; Melia, N.; Pearse, G.D. An assessment of high-density UAV point clouds for the measurement of young forestry trials. Remote Sens. 2020, 12, 4039. [Google Scholar] [CrossRef]
- Chao, Z.; Liu, N.; Zhang, P.; Ying, T.; Song, K. Estimation methods developing with remote sensing information for energy crop biomass: A comparative review. Biomass Bioenergy 2019, 122, 414–425. [Google Scholar] [CrossRef]
- Paikkatietoaineistot, Open Forest Information, Finnish Forest Center. Available online: https://www.metsakeskus.fi/fi/avoin-metsa-ja-luontotieto/aineistot-paikkatieto-ohjelmille/paikkatietoaineistot (accessed on 10 September 2021).
- Nuutinen, Y.; Miina, J.; Saksa, T.; Bergström, D.; Routa, J. Comparing the characteristics of boom-corridor and selectively thinned stands of scots pine and birch. Silva Fenn. 2021, 55, 10462. [Google Scholar] [CrossRef]
- King, D.A. Linking tree form, allocation and growth with an allometrically explicit model. Ecol. Modell. 2005, 185, 77–91. [Google Scholar] [CrossRef]
- Pix4D Drone Mapping Software. Swiss Fed Inst Technol Lausanne, Route Cantonale, Switzerland. 2014. Available online: http://pix4d.com (accessed on 25 May 2021).
- Khosravipour, A.; Skidmore, A.K.; Isenburg, M.; Wang, T.; Hussin, Y.A. Generating pit-free canopy height models from airborne lidar. Photogramm. Eng. Remote Sens. 2014, 80, 863–872. [Google Scholar] [CrossRef]
- Arbonaut Ltd. ArboLiDAR: Tools for Processing LiDAR and Satellite-Based Forest Inventory. Available online: https://www.arbonaut.com/en/products/arbolidar (accessed on 23 June 2021).
- Kaartinen, H.; Hyyppä, J.; Yu, X.; Vastaranta, M.; Hyyppä, H.; Kukko, A.; Holopainen, M.; Heipke, C.; Hirschmugl, M.; Morsdorf, F.; et al. An international comparison of individual tree detection and extraction using airborne laser scanning. Remote Sens. 2012, 4, 950–974. [Google Scholar] [CrossRef] [Green Version]
- Goldbergs, G.; Levick, S.R.; Lawes, M.; Edwards, A. Hierarchical integration of individual tree and area-based approaches for savanna biomass uncertainty estimation from airborne LiDAR. Remote Sens. Environ. 2018, 205, 141–150. [Google Scholar] [CrossRef]


| Stands | Area (ha) | Stand Age (year) | Developmental Class | Dominant Species | Mean DBH (cm) | Mean Height (m) |
|---|---|---|---|---|---|---|
| 1 | 3.12 | 25 | Young forest | Scots Pine | 10.30 | 9.50 |
| 2 | 6.18 | 27 | Young forest | Silver Birch | 13.68 | 13.16 |
| Parameters | LiDAR | DAP |
|---|---|---|
| Flying height (m) | 60 | 140 |
| Average Flying speed (m/s) | 5 | 7 |
| Point density (points/m2) | 105 | NA * |
| Pulse rate (kHz) | 300 | NA * |
| Overlap in flight direction (%) | NA * | 80 |
| Side overlap (%) | 50 | 65 |
| Distance between flight lines (m) | 50 | 27 |
| Species | Field Measurement | LiDAR | DAP | ||||||
|---|---|---|---|---|---|---|---|---|---|
| Mean (SD) | Min | Max | Mean (SD) | Min | Max | Mean (SD) | Min | Max | |
| Pine (n = 32) | 11.23 (3.25) | 6.50 | 25.50 | 10.53 (3.52) | 5.30 | 25.80 | 10.42 (3.64) | 5.10 | 25.70 |
| Spruce (n = 29) | 12.26 (2.66) | 7.50 | 19.00 | 11.98 (2.82) | 6.00 | 19.40 | 11.83 (2.89) | 5.20 | 19.60 |
| Birch (n = 67) | 13.68 (2.84) | 7.50 | 19.50 | 12.82 (2.94) | 5.20 | 20.10 | 12.49 (3.06) | 5.00 | 19.00 |
| Aspen (n = 2) | 17.00 (0.71) | 16.50 | 17.50 | 16.70 (1.27) | 15.80 | 17.60 | 16.45 (0.50) | 16.10 | 16.80 |
| All (N = 130) | 12.82 (3.10) | 6.50 | 25.50 | 12.13 (3.22) | 5.20 | 25.80 | 11.89 (3.30) | 5.00 | 25.70 |
| Species | Measured vs. LiDAR | Measured vs. DAP | LiDAR vs. DAP | ||||||
|---|---|---|---|---|---|---|---|---|---|
| R2 | Bias | RMSE | R2 | Bias | RMSE | R2 | MD | RMSD | |
| Pine | 0.86 | 0.70 | 1.44 | 0.71 | 0.82 | 2.13 | 0.79 | 0.12 | 1.67 |
| Spruce | 0.83 | 0.30 | 1.17 | 0.83 | 0.44 | 1.26 | 0.98 | 0.15 | 0.45 |
| Birch | 0.81 | 0.86 | 1.56 | 0.69 | 1.19 | 2.08 | 0.85 | 0.33 | 1.26 |
| All | 0.85 | 0.67 | 1.44 | 0.70 | 0.92 | 1.92 | 0.86 | 0.24 | 1.25 |
| Species | Measured–LiDAR | Measured–DAP | LiDAR–DAP | ||||||
|---|---|---|---|---|---|---|---|---|---|
| Mean (SD) | Min | Max | Mean (SD) | Min | Max | Mean (SD) | Min | Max | |
| Pine | 0.70 (1.28) | −1.90 | 5.50 | 0.82 (2.00) | −7.30 | 5.90 | 0.12 (1.69) | −8.40 | 2.40 |
| Spruce | 0.30 (1.15) | −2.80 | 2.70 | 0.44 (1.20) | −2.40 | 2.90 | 0.15 (0.43) | −0.70 | 1.40 |
| Birch | 0.86 (1.31) | −2.10 | 3.80 | 1.19 (1.71) | −2.20 | 9.00 | 0.33 (1.23) | −2.90 | 7.60 |
| Aspen | 0.30 (0.57) | −0.10 | 0.70 | 0.55 (0.21) | 0.40 | 0.70 | 0.25 (0.78) | −0.30 | 0.80 |
| All | 0.69 (1.27) | −2.80 | 5.50 | 0.92 (1.69) | −7.30 | 9.00 | 0.24 (1.23) | −8.40 | 7.60 |
Publisher’s Note: MDPI stays neutral with regard to jurisdictional claims in published maps and institutional affiliations. |
© 2022 by the authors. Licensee MDPI, Basel, Switzerland. This article is an open access article distributed under the terms and conditions of the Creative Commons Attribution (CC BY) license (https://creativecommons.org/licenses/by/4.0/).
Share and Cite
Gyawali, A.; Aalto, M.; Peuhkurinen, J.; Villikka, M.; Ranta, T. Comparison of Individual Tree Height Estimated from LiDAR and Digital Aerial Photogrammetry in Young Forests. Sustainability 2022, 14, 3720. https://0-doi-org.brum.beds.ac.uk/10.3390/su14073720
Gyawali A, Aalto M, Peuhkurinen J, Villikka M, Ranta T. Comparison of Individual Tree Height Estimated from LiDAR and Digital Aerial Photogrammetry in Young Forests. Sustainability. 2022; 14(7):3720. https://0-doi-org.brum.beds.ac.uk/10.3390/su14073720
Chicago/Turabian StyleGyawali, Arun, Mika Aalto, Jussi Peuhkurinen, Maria Villikka, and Tapio Ranta. 2022. "Comparison of Individual Tree Height Estimated from LiDAR and Digital Aerial Photogrammetry in Young Forests" Sustainability 14, no. 7: 3720. https://0-doi-org.brum.beds.ac.uk/10.3390/su14073720