
Assessment of Soil Quality Status and the Ecological Risk in the Baia Mare, Romania Area


Department of Environment Engineering and Entrepreneurship of Sustainable Development, Faculty of Materials and Environmental Engineering, Technical University of Cluj-Napoca, 103-105 Muncii Avenue, 400 641 Cluj-Napoca, Romania
*
Authors to whom correspondence should be addressed.
Sustainability 2022, 14(7), 3739; https://doi.org/10.3390/su14073739
Submission received: 11 March 2022
/
Revised: 17 March 2022
/
Accepted: 18 March 2022
/
Published: 23 March 2022
(This article belongs to the Special Issue Recent Advances in Soil Heavy Metals Remediation, Soil Fertility Management and Crops Productivity: Changing Climatic Conditions)
Abstract
:Industrial activities in the Baia Mare, Romania area have generated strong pollution, and the impact on soil quality in the neighboring areas of the city remains unclear. The aim of the research is to investigate samples of soil from Baia Mare in order to determine the quality of the soil and also the ecological risk of the soil. This study presents among the first studies using the ecological risk assessment methodology on the soil from the Baia Mare area and aims to serve as scientific support for future studies and research. Evaluation of the soil quality state was performed by determining the physical-chemical characteristics of the soil (pH, texture, structure, and concentration of metals). Evaluation of the anthropic activity from the studied areas was conducted by determining the pollution indices: Cf; Cd, PLI, Er, and PERI. The results of this study indicate that the surface soils have very high concentrations of metals (Cd: 3.5–14.4 mg kg−1; Cu: 9.4–361.5 mg kg−1; Pb: 29.7–1973 mg kg−1), with exceedances of the limit values established in the Romanian legislation. Results regarding the degree of contamination, the PLI pollution load index (1.3–14.9), and the PERI potential ecological risk index (733.9–4686) indicate that soils in the studied area have a very high degree of pollution.
1. Introduction
Romania is a major producer of non-ferrous metals. In the Baia Mare area, the first mining activities have been attested since the 2nd and 3rd centuries BC [1]. In the area, there were two companies whose activity profile was the processing of ores (especially copper, lead, gold, and silver). Since 1974, in addition to ore processing, metallurgical slag, telluric sludge, and blue powder (treatment plant sludge) have also been processed [1].
Even though the industrial activities with a negative impact on the environment in the Baia Mare area were stopped (2006—gold mines; 2008—copper production plant; 2012—lead production plant [1,2], inactive sites continue to represent an important source of pollution of environmental factors, being in the vicinity of residential areas.
Studies carried out before and after the cessation of industrial activities have shown that the two former plants, tailing ponds, and dumps block large areas of land and cause discomfort to neighboring areas through their polluting emissions. As a result of the mining activities in the vicinity of Baia Mare municipality, large areas remained occupied by tailing ponds and dumps, and in the underground environment, the waters that cross the existing mine galleries come to the surface unclean [3,4]. According to the national inventories, in Maramureș County there are 17 tailing ponds occupying 332.5 ha and 300 tailing dumps (93.5 ha). In the Baia Mare depression alone there are 55 tailing dumps (25.1 ha) [4,5].
Analyses of soil samples collected during 2008–2010 from the proximity of major sources of pollution (former plants) have shown that the soil has very high concentrations of metals [6]. In fact, it was shown that metals are present in all environmental factors in this area and significantly affect local ecosystems and human health [3,4].
Also, Damian et al. (2010) also pointed out that metals are found in high concentrations in the soil in the Baia Mare area: Pb: 32–165 mg kg−1; Cu: 22–118 mg kg−1, Zn: 89–308 mg kg−1; and that in the vicinity of the former plants their concentrations increase: Pb: 425–995 mg kg−1; Cu: 54–750 mg kg−1, Zn 252–1325 mg kg−1 [7], and Cd: 3.17–21.5 mg kg−1 [8].
Soil pollution in the area of the former plants is also demonstrated by studies conducted by Weindorf et al. (2015) and Coroian et al. (2017) [9,10], where the intervention threshold was exceeded 19–30 times in the case of Pb and Cu. In these areas, high concentrations were identified for: Pb: 982–6565 mg kg−1 and Zn: 4513.2–6122 mg kg−1, respectively Cu: 400–5823 mg kg−1 [11].
Increasing contamination with metals in environmental components leads to an increase in the overall risk to human and ecological health. This contamination of the soil with toxic and dangerous compounds results in the degradation or loss of some soil functions globally [12].
Adequate assessment of soil contamination with metals can be done by using pollution indices that highlight both the degree of contamination and the potential ecological risk [13,14]. These pollution indices can determine whether the accumulation of metals was due to natural processes or was the result of anthropogenic activities. In addition, pollution indices are of great importance for monitoring soil quality and ensuring future sustainability [15,16].
The influence of anthropogenic activities on soil quality can be found by determining the contamination factor Cf and the degree of contamination Cd, the pollution load index PLI, the ecological risk index Er, and the potential ecological risk index PERI [17,18]. Choosing the right pollution indices is essential, and both the soil use and the purpose of calculating the pollution indices must be taken into account [15].
The PLI index is used to fully assess the degree of soil contamination, an index that provides an easy way to demonstrate the deterioration of soil conditions due to the accumulation of metals [15]. The PERI index allows the identification of various effects on the environment (toxicology, environmental chemistry, and ecology) and can assess the ecological risks caused by metals [12,19].
The simultaneous use of several indices is used to assess metal pollution more accurately in the soil. Several studies have reported that the selection of the pollution index is related to different purposes: the level of contamination, the origin of metals, or the potential ecological risk [15,20,21].
This paper aims to highlight the degree of metal pollution of surface soils in the surrounding areas of the Baia Mare municipality, land with sensitive use (agricultural land, residential areas, etc.). The anthropic activity in the studied areas was evaluated using pollution indices: Cf; Cd, PLI, Er, and PERI.
The aim of the research is to investigate soil samples from Baia Mare to determine soil quality, soil ecological risk and to create scientific support for future studies and research in choosing the appropriate technology for soil depollution and remediation of the area affected by metal pollution.
2. Materials and Methods
2.1. Study Area and Soil Sampling
The city of Baia Mare is in the N-W of Romania (Figure 1). Within Baia Mare, there were four important companies that represented a source of pollution for the investigated area, as represented in Figure 2. The area around Baia Mare was subjected to an assessment of the soil environmental factor.
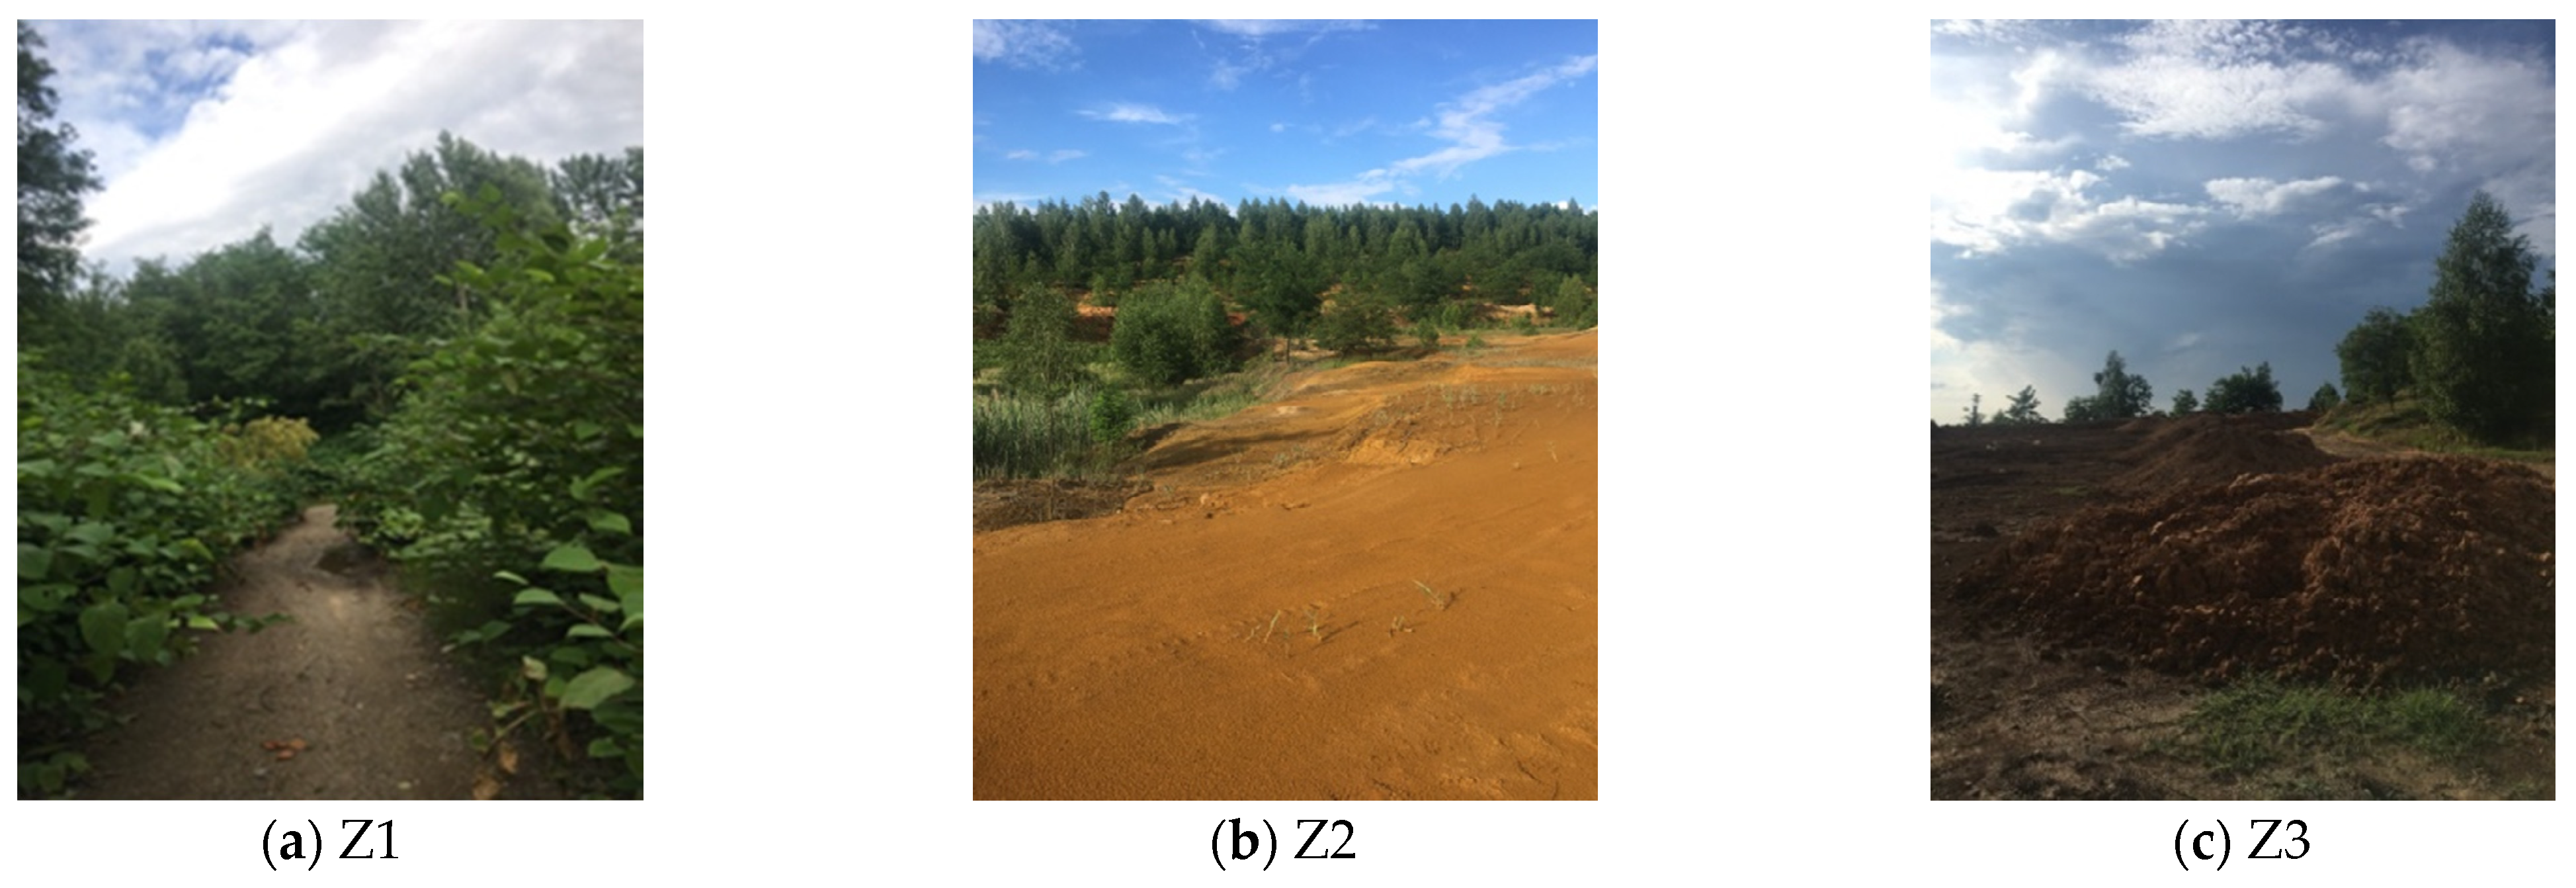
For evaluation of the soil quality around the city of Baia Mare, soil samples were taken from six zones of the studied area: Z1, Z2, Z3, Z4, Z5, and Z6 (Figure 1) according to STAS 7184/1–84 and were processed by SR ISO 11464:1998 [22,23]. These zones (Figure 2) are in the vicinity of dwellings or commercial areas, classified as land with sensitive use according to the Romanian legislation (Order 756/1997) [24].
A total of 16 soil samples were taken from different depths: 0–20 cm, 20–40 cm, and 40–60 cm to observe the migration of metals into the depth of the soil. The sampling depth differs in the case of samples taken from Z1 and Z5 because the soil did not allow the probe to advance to a depth of over 40 cm. To make it easier to identify soil samples, coding was carried out, which is shown in Table 1.
2.2. Soil Analyses
The taken soil samples were transported into the laboratory where the stones and roots were removed, and the soil was mixed to ensure homogeneity of the sample. The soil’s pH, texture, structure, and total concentration of metals were determined.
The soil pH was determined in 1/2.5 (w/v) soil/water extract using a HANNA pH meter.
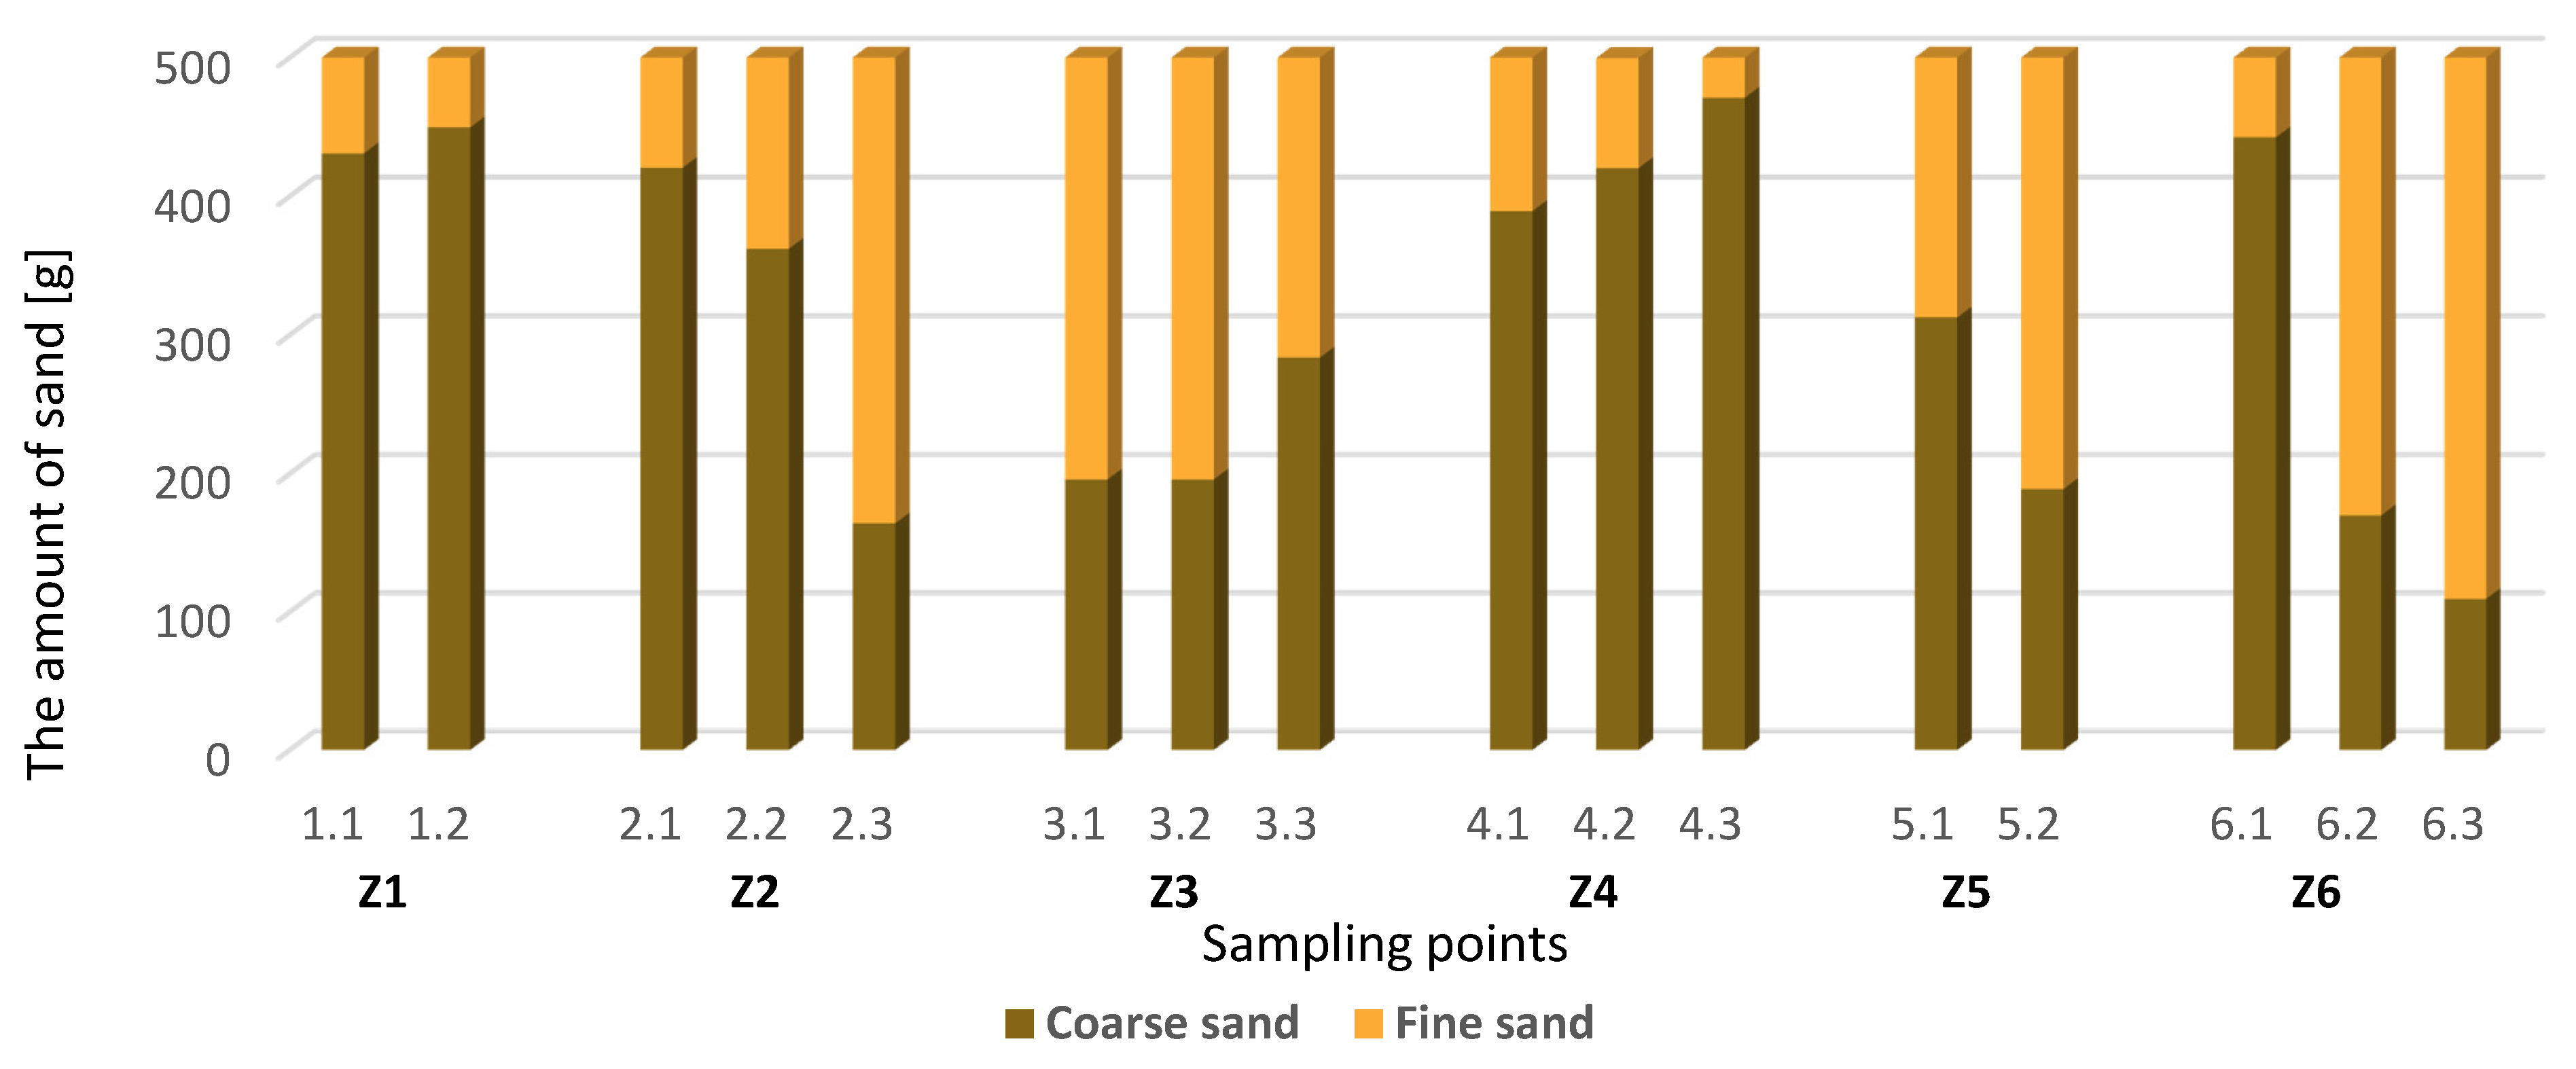
The soil’s texture was determined using a gravimetric method, using the RETSCH AS 200 sieves. For each sample, the particle size fraction (%) of coarse sand and fine sand were calculated using Equations (1) and (2) [25], and then the results were compared according to the USDA classification to determine the texture of the samples [26].
where: m—amount of dry soil [g], m = 500 g;
a—amount of coarse sand [g];
e—amount of fine sand [g];
100—factor for percentage reporting.
The structure of the soil was determined by the Sekera method—the dissolution of soil aggregates into smaller formations by the exit of air and soaking with water of the formations resulting from the mechanical action of water [25]. For determining the total content of metals (Cd, Cr, Cu, Ni, Zn, Pb) in the soil, the aqua regia digestion was used. The soil sample was air-dried and ground to a fine powder and sieved through the 100 μm sieve. Then, 3 g soil was measured, 7 mL of 12 M HCl and 21 mL of 15.8 M HNO3 were added, and the mixture was refluxed for 2 h. After cooling, the supernatant was filtered and diluted up to 100 mL with 2% (v/v) HNO3 [27]. The metal concentrations of the soils were determined through Atomic Absorption Spectrometry (AAS) using a SHIMADZU AA-6800 spectrometer. Following measurements, the concentrations of metals (Cd, Cr, Cu, Ni, Zn, and Pb) in the soil samples were compared with the allowed values from Order 756/1997 for soils with sensitive use [24].
2.3. Ecological Risk Assessment Methodology
To establish the influence of anthropogenic activities on soil quality, the following were calculated: contamination factor—Cf (Equation (3)) [28], degree of contamination—Cd (Equation (4)) [28], pollution load index—PLI (Equation (5)) [29], ecological risk index—Er (Equation (6)) [30] and the potential ecological risk index—PERI (Equation (7)) [30,31].
The calculation of the indices was performed using the background values: Cr: 35; Cd: 0.098; Cu: 25; Ni: 20; Pb: 20; Zn: 71 [30]. The degree of contamination Cd was calculated by summing the contamination indices.
where, CAi—analyte concentration;
CNi—background value (in the case of soil).
where, Er—ecological risk index of the metal i;
Cf—contamination factor of the metal i;
Tr—metal toxicity response coefficient, for each metal: Cd: 30, Cu: 5, Pb: 5, Ni: 5; Zn: 1; Cr: 2 [12,32].
Results obtained from calculations were interpreted according to the values of the indices presented in Table 2.
3. Results and Discussion
3.1. Soil Analyses
The results of pH determinations (Figure 3) indicate that all soil samples have an acidic pH, with different degrees of acidity. Samples Z2, Z3, and Z5 show a very acidic pH. Samples from Z1 have a low acid pH and those from Z4 have a moderate acid pH. The soil pH does not differ depending on depth, it is different depending on the place of sampling, the only exception is at the point of sampling Z2. At a depth of 40–60 cm, an acidic pH (4.58) can be observed compared to surface samples having a very acidic pH (2.3–2.6).
Values obtained from the pH soil analysis (2.3–6.1) are similar to those obtained from the studies carried out by Modoi et al. (2022) [37], which were between 3.9–6.6.
The analysis of soil samples regarding their texture allowed the determination of the ratio between fine and coarse sand (of the amount of fine sand and coarse sand) for each sample (Figure 4). Following calculations, the soil texture was established for each sample. The samples have a diversified texture, but with a weight towards sandy texture in the surface samples (depth 0–20 cm), except for zones 3 and 5.
The 16 analyzed samples have a different texture according to the USDA classification, the texture falls between sand (sample 4.3.) and clay (sample 2.3, 3.1, 3.2, 5.2, 6.2, 6.3). Samples 1.1, 1.2, and 6.1 show a loamy sand texture, and the sandy loam texture is found in samples 2.1 and 4.2. Analyzing Figure 4 we can observe that samples 3.3 and 5.1 have a sandy clay texture, and samples 2.2 and 4.1 have a sandy clay loam texture.
Results obtained after determining the soil structure indicate that the samples have a different structure for each sampling point and differ depending on the sampling depth, observing the same tendency to change structure depending on depth, the only exception is sample 2.3 (Figure 5). Samples from points Z1 and Z2 show a partially structured soil for the surface samples (1.1 and 2.1), and the sample from a depth of 10–20 cm is a poorly structured soil (1.2 and 2.2). Z5 shows the lack of aggregation structure in the surface sample (5.1), and in the depth sample (5.2) there is a texture of poorly structured soil. At the opposite pole are the samples were taken from Z3, Z4, and Z6, which have a very well-structured soil for surface samples (3.1, 4.1, 6.1, 6.2), and together with depth the soil becomes well-structured (3.2, 3.3, 6.3), or partially structured (4.2) in the case of Z4, and respectively poorly structured (4.3).
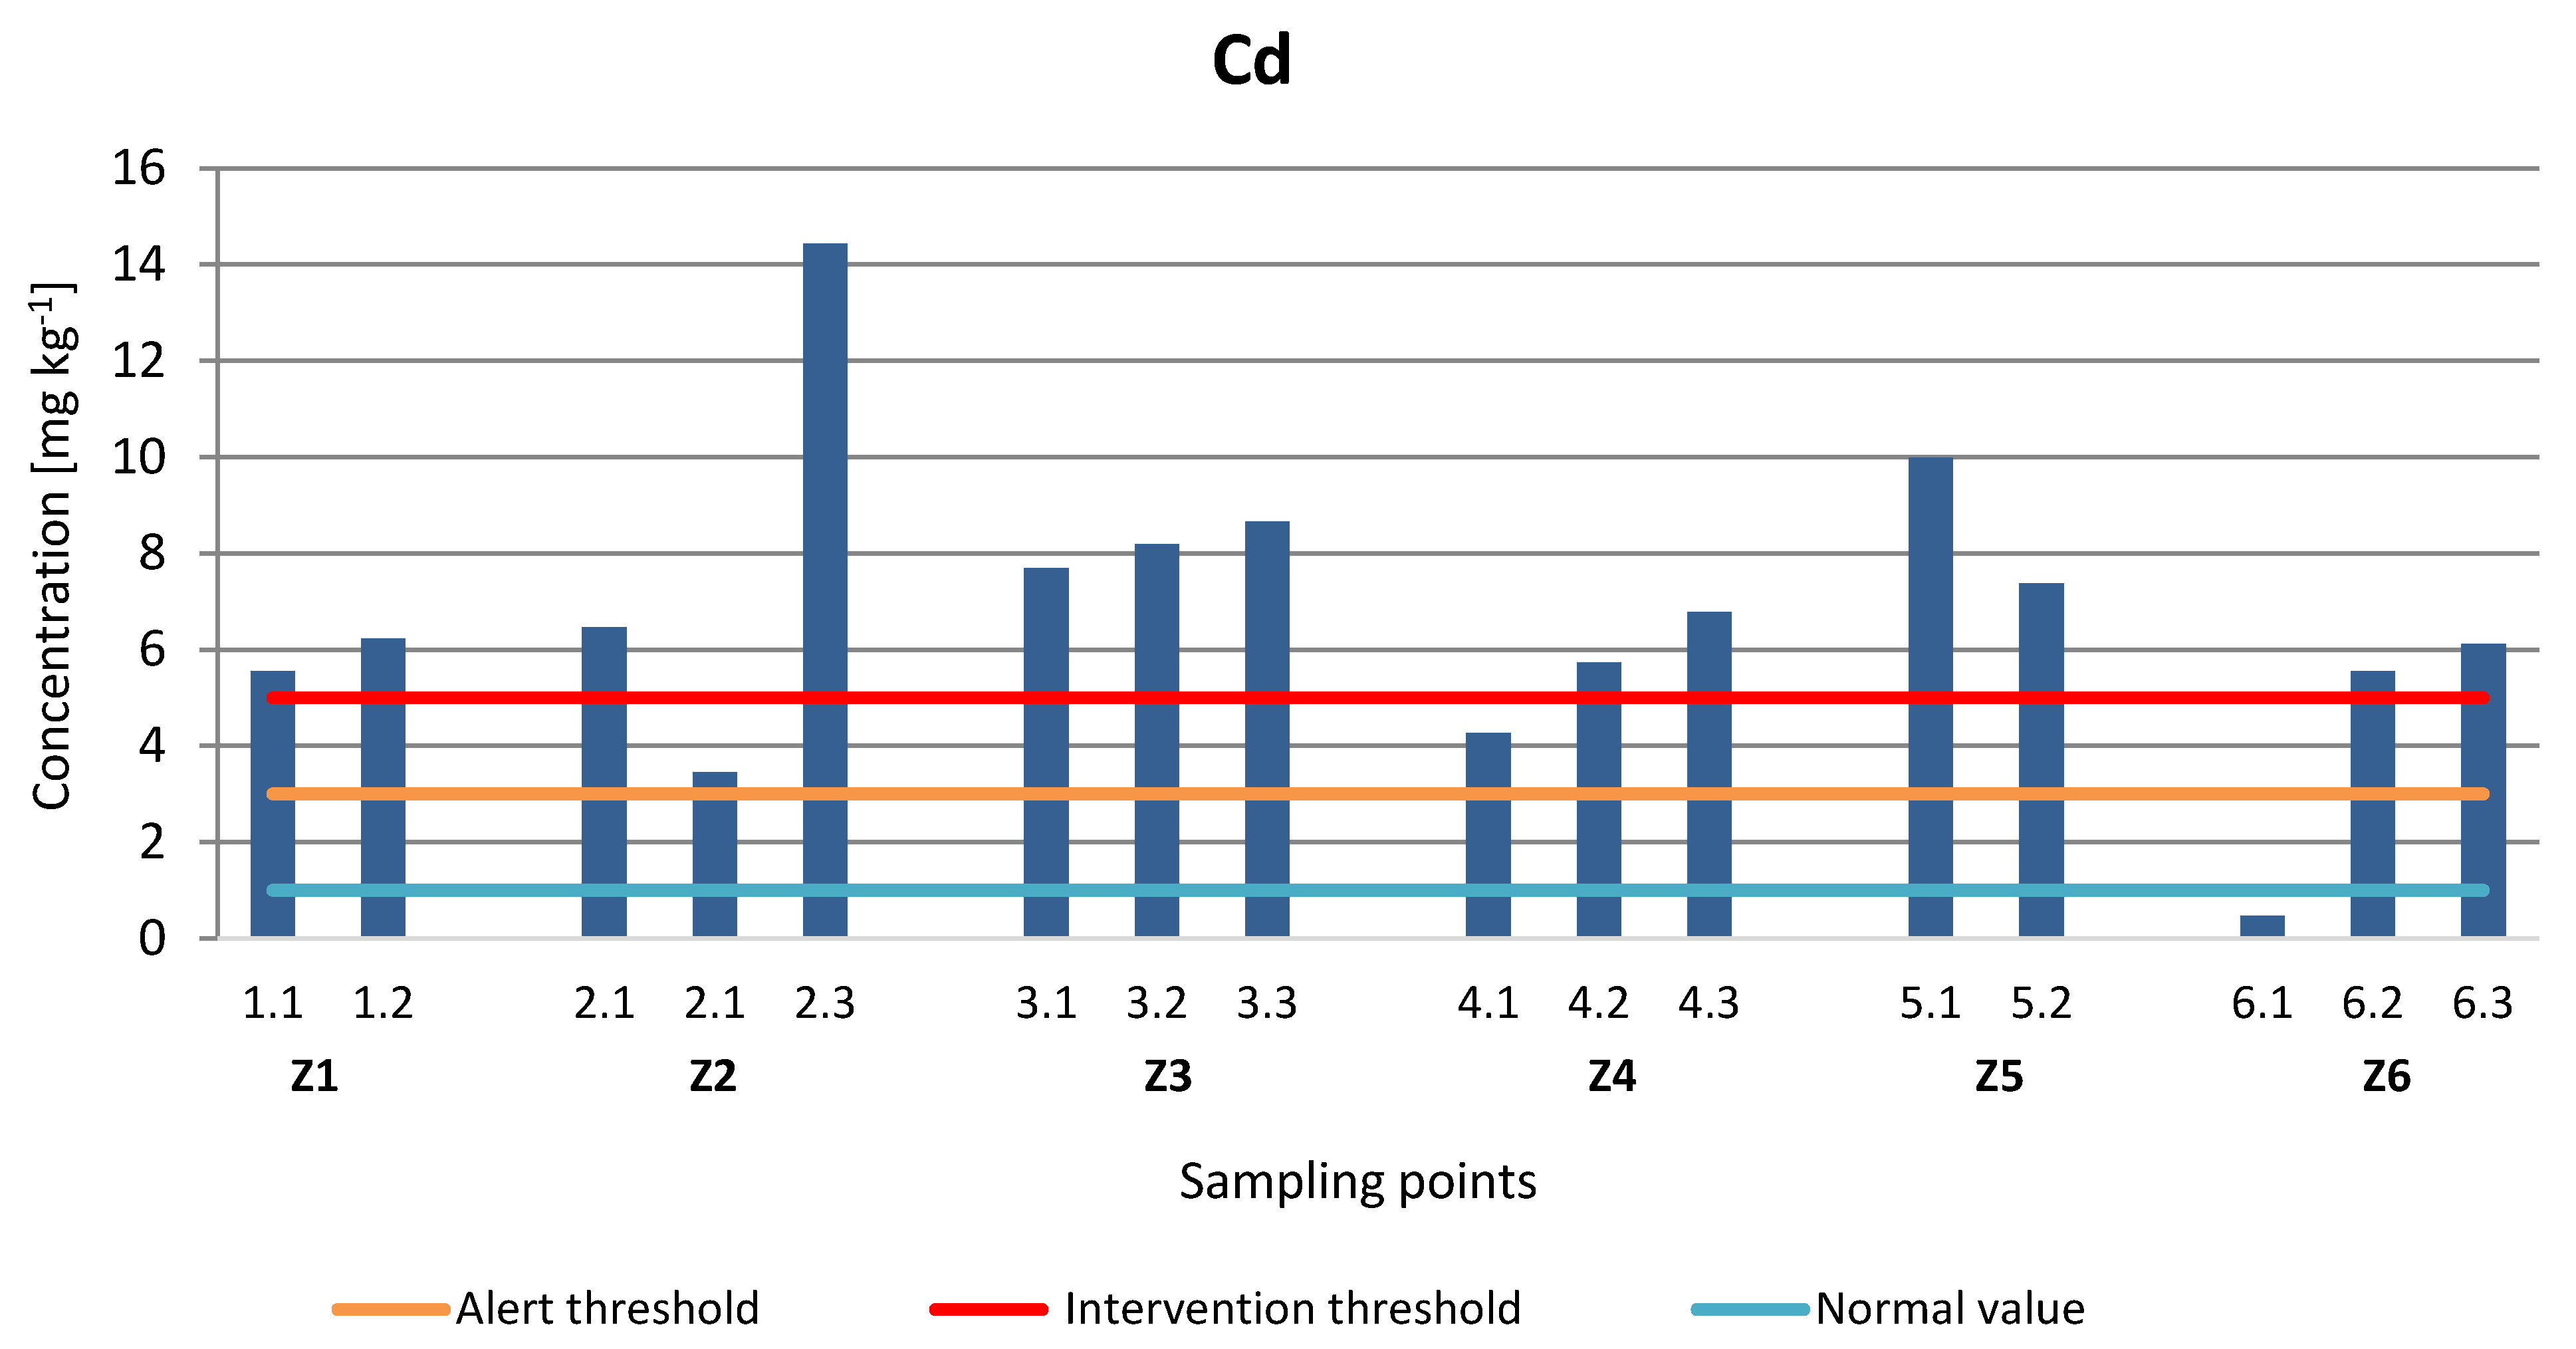
Results of the determinations of the concentration of metals in the studied areas show that the concentration of Cd, Cu, and Pb are high, exceeding the normal values, the alert and intervention threshold according to the Romanian legislation (Order 756/1997) (Figure 6, Figure 7 and Figure 8). Given the history of this area of mining, ore processing, and the use of less environmentally friendly technologies, the area under study has become heavily contaminated with metals. Higher concentrations of Cd, Cu, and Pb were highlighted in areas Z2, Z3, Z5. In these areas, the pH is very low, thus highlighting a high acidity in heavily polluted areas.
Cd is a metal found in soil, normal concentration being higher than 1 mg kg−1. It is not vital for life, having toxicity of 2–20 times higher than other metals [38].
Significant amounts of Cd are found in all sampling points (Figure 6), exceeding the normal value (1 mg kg−1) and the alert threshold (3 mg kg−1), except for sample 6.1. According to Order 756/1997, the samples exceed the intervention threshold (5 mg kg−1) except sample 2.1. The concentration of Cd increases with depth in zone 1, 3, and 6, while in zone 5 the concentration decreases in the sample from a depth of 20–40 cm.
Cu is the element with extremely high toxicity for most plants, in concentrations exceeding 20 mg kg−1. The toxic action of copper on plants depends on the absorption capacity of soil and its reaction. The growth of copper concentration in the soil causes the growth of the mobile humus, modifying the humus’s composition [38].
Cu concentrations (Figure 7) exceed the normal value (20 mg kg−1) in almost all points from which soil samples were taken, except for samples 4.2 and 4.3. The alert threshold (100 mg kg−1) is exceeded in Z2, Z3, Z6, and sample 5.2. These three areas (Z2, Z3, and Z6) have also exceeded the intervention threshold (250 mg kg−1), except for sample 2.1.
Pb is the metallic element with the fastest deposition and with the highest excess level of the maximum allowable concentration in almost every environment component. The concentration of Pb found in the soil naturally is about 50 mg kg−1 [39].
The accumulation of Pb in soil has toxic effects, producing the inhibition of the enzymatic processes, reducing the elimination intensity of the carbon dioxide, and reducing the number of microorganisms, all this with heavy consequences concerning the absorption of the nutrient elements by plants. In addition, it induces derangements in the metabolism of the microorganisms, affecting especially, the breathing and cell multiplication processes [38].
Analyzing Figure 8, we can observe very high concentrations of Pb in all soil sampling points. The concentrations of samples exceed the normal value (20 mg kg−1), but a particularity can be observed in the case of sample 4.2, which has a low concentration (9.4 mg kg−1). In almost all soil samples the alert threshold (50 mg kg−1) is exceeded, except for samples 4.2 and 4.3 (29.7 mg kg−1). The intervention threshold (100 mg kg−1) is exceeded in zones 1, 2, 3, 5, and 6. Pb shows exceedances even 18 times higher than the established values of Order 756/1997.
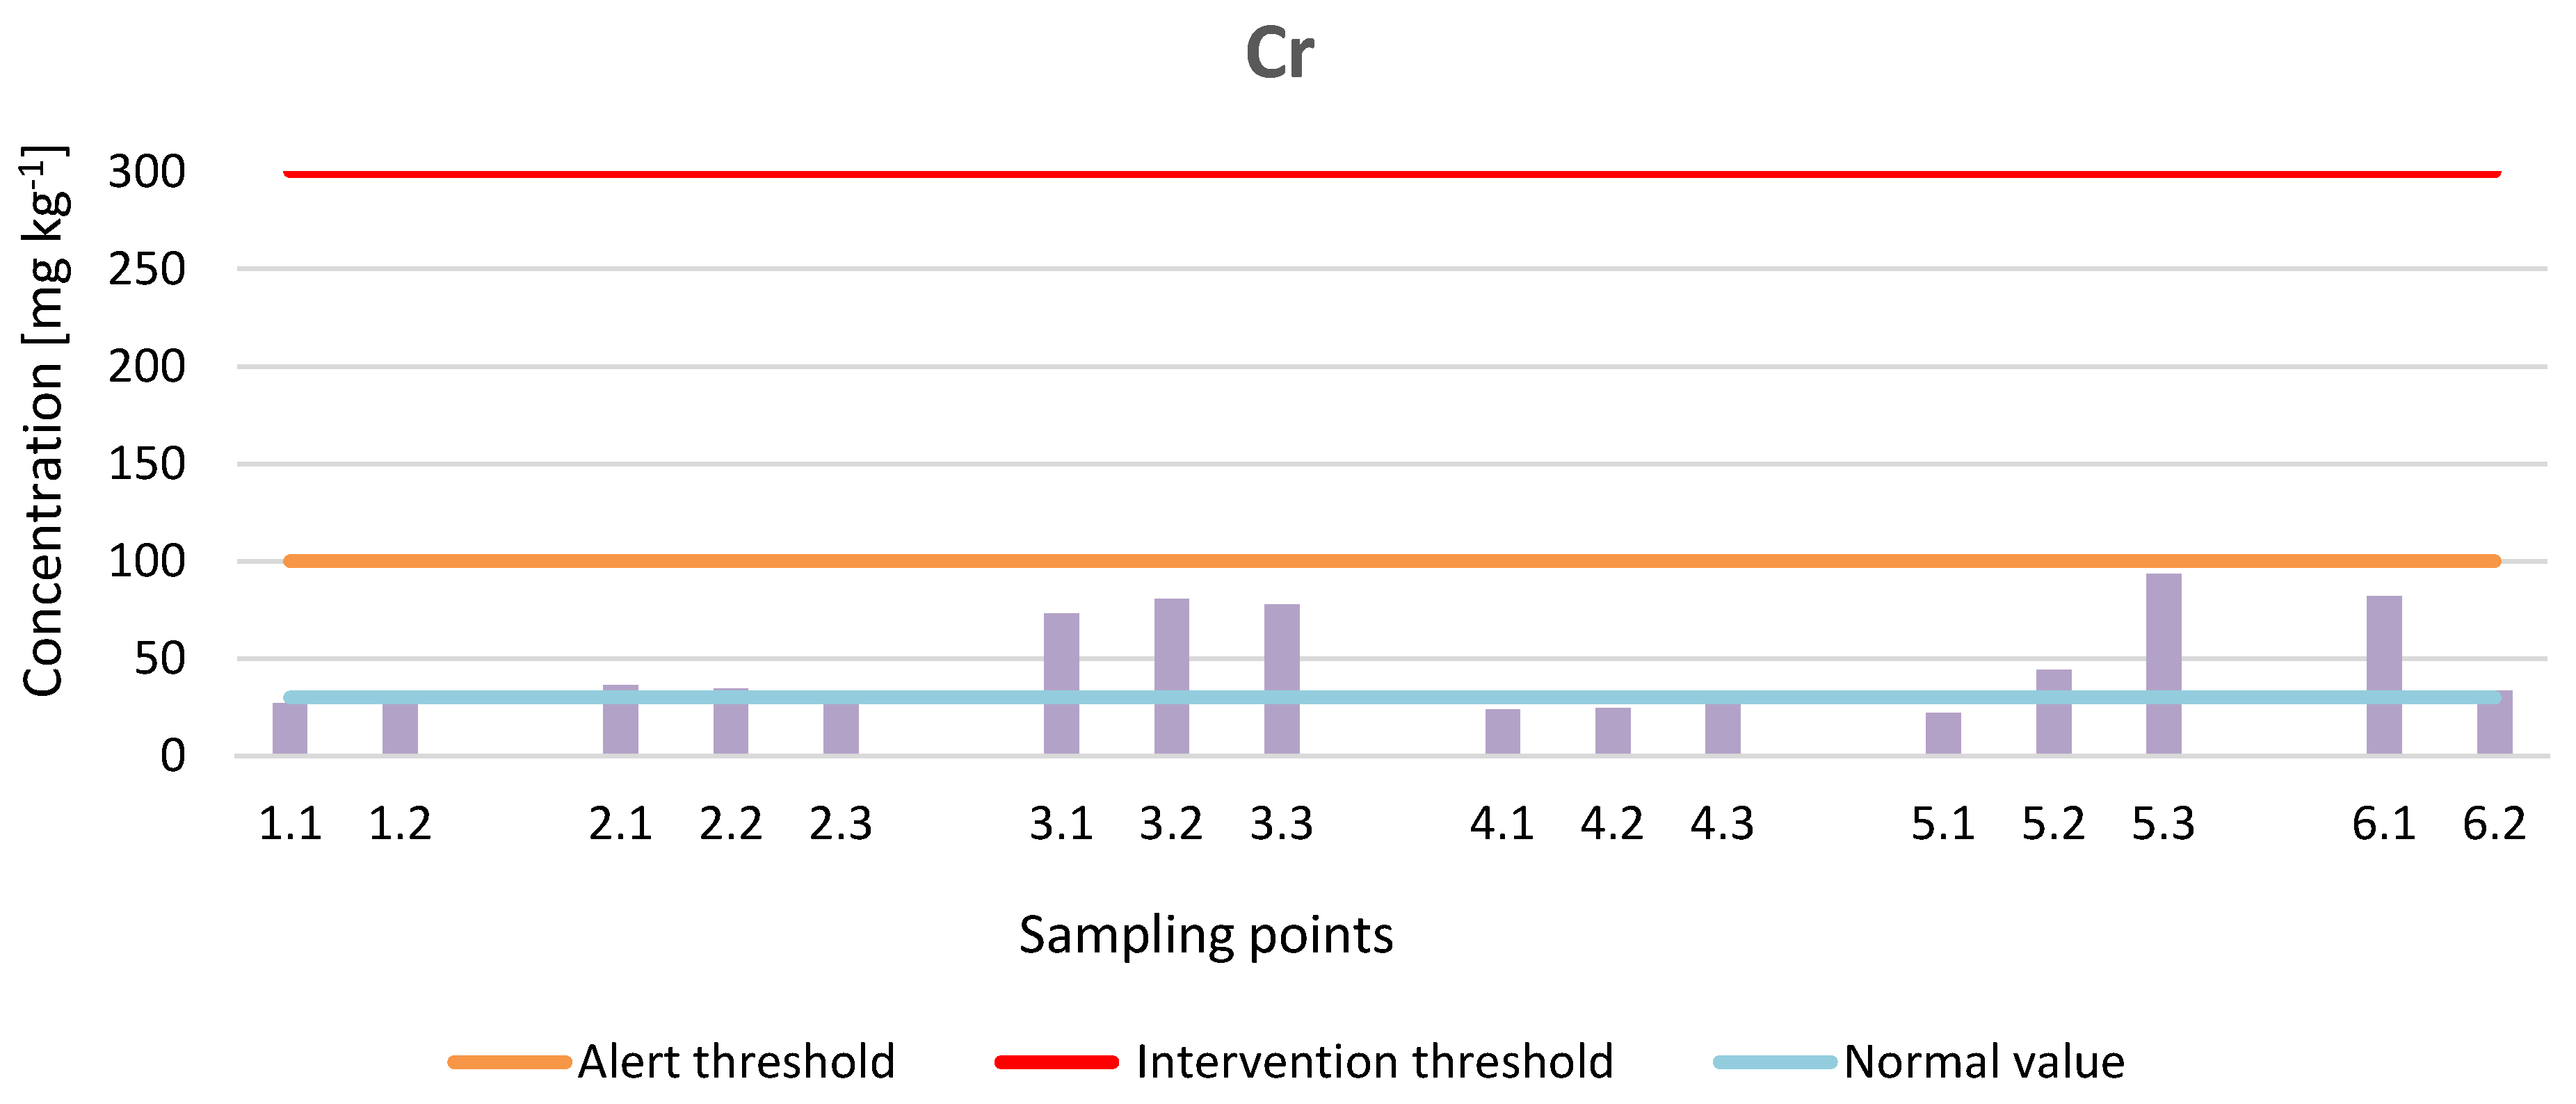
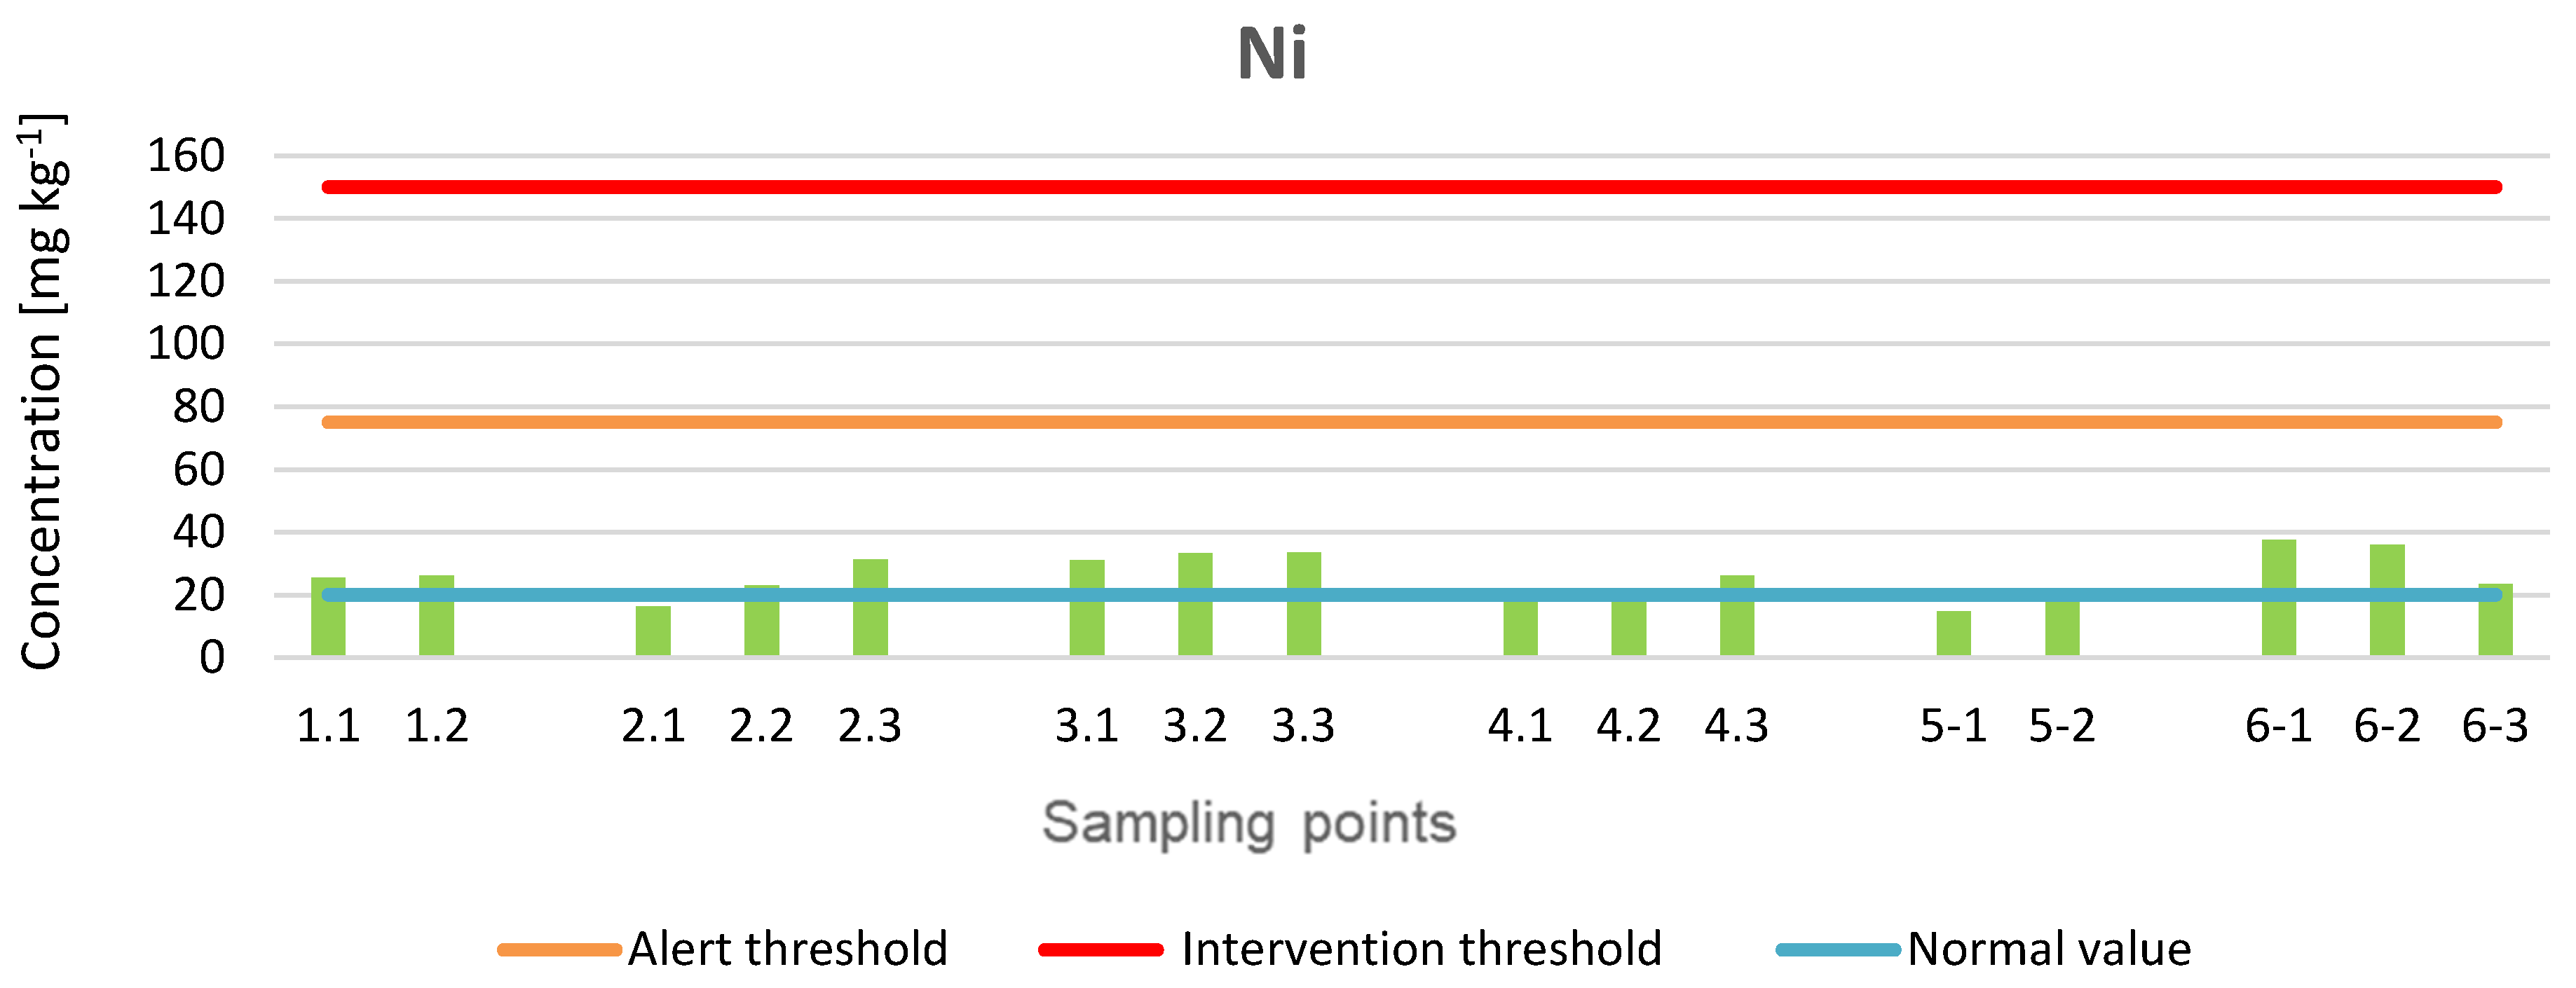
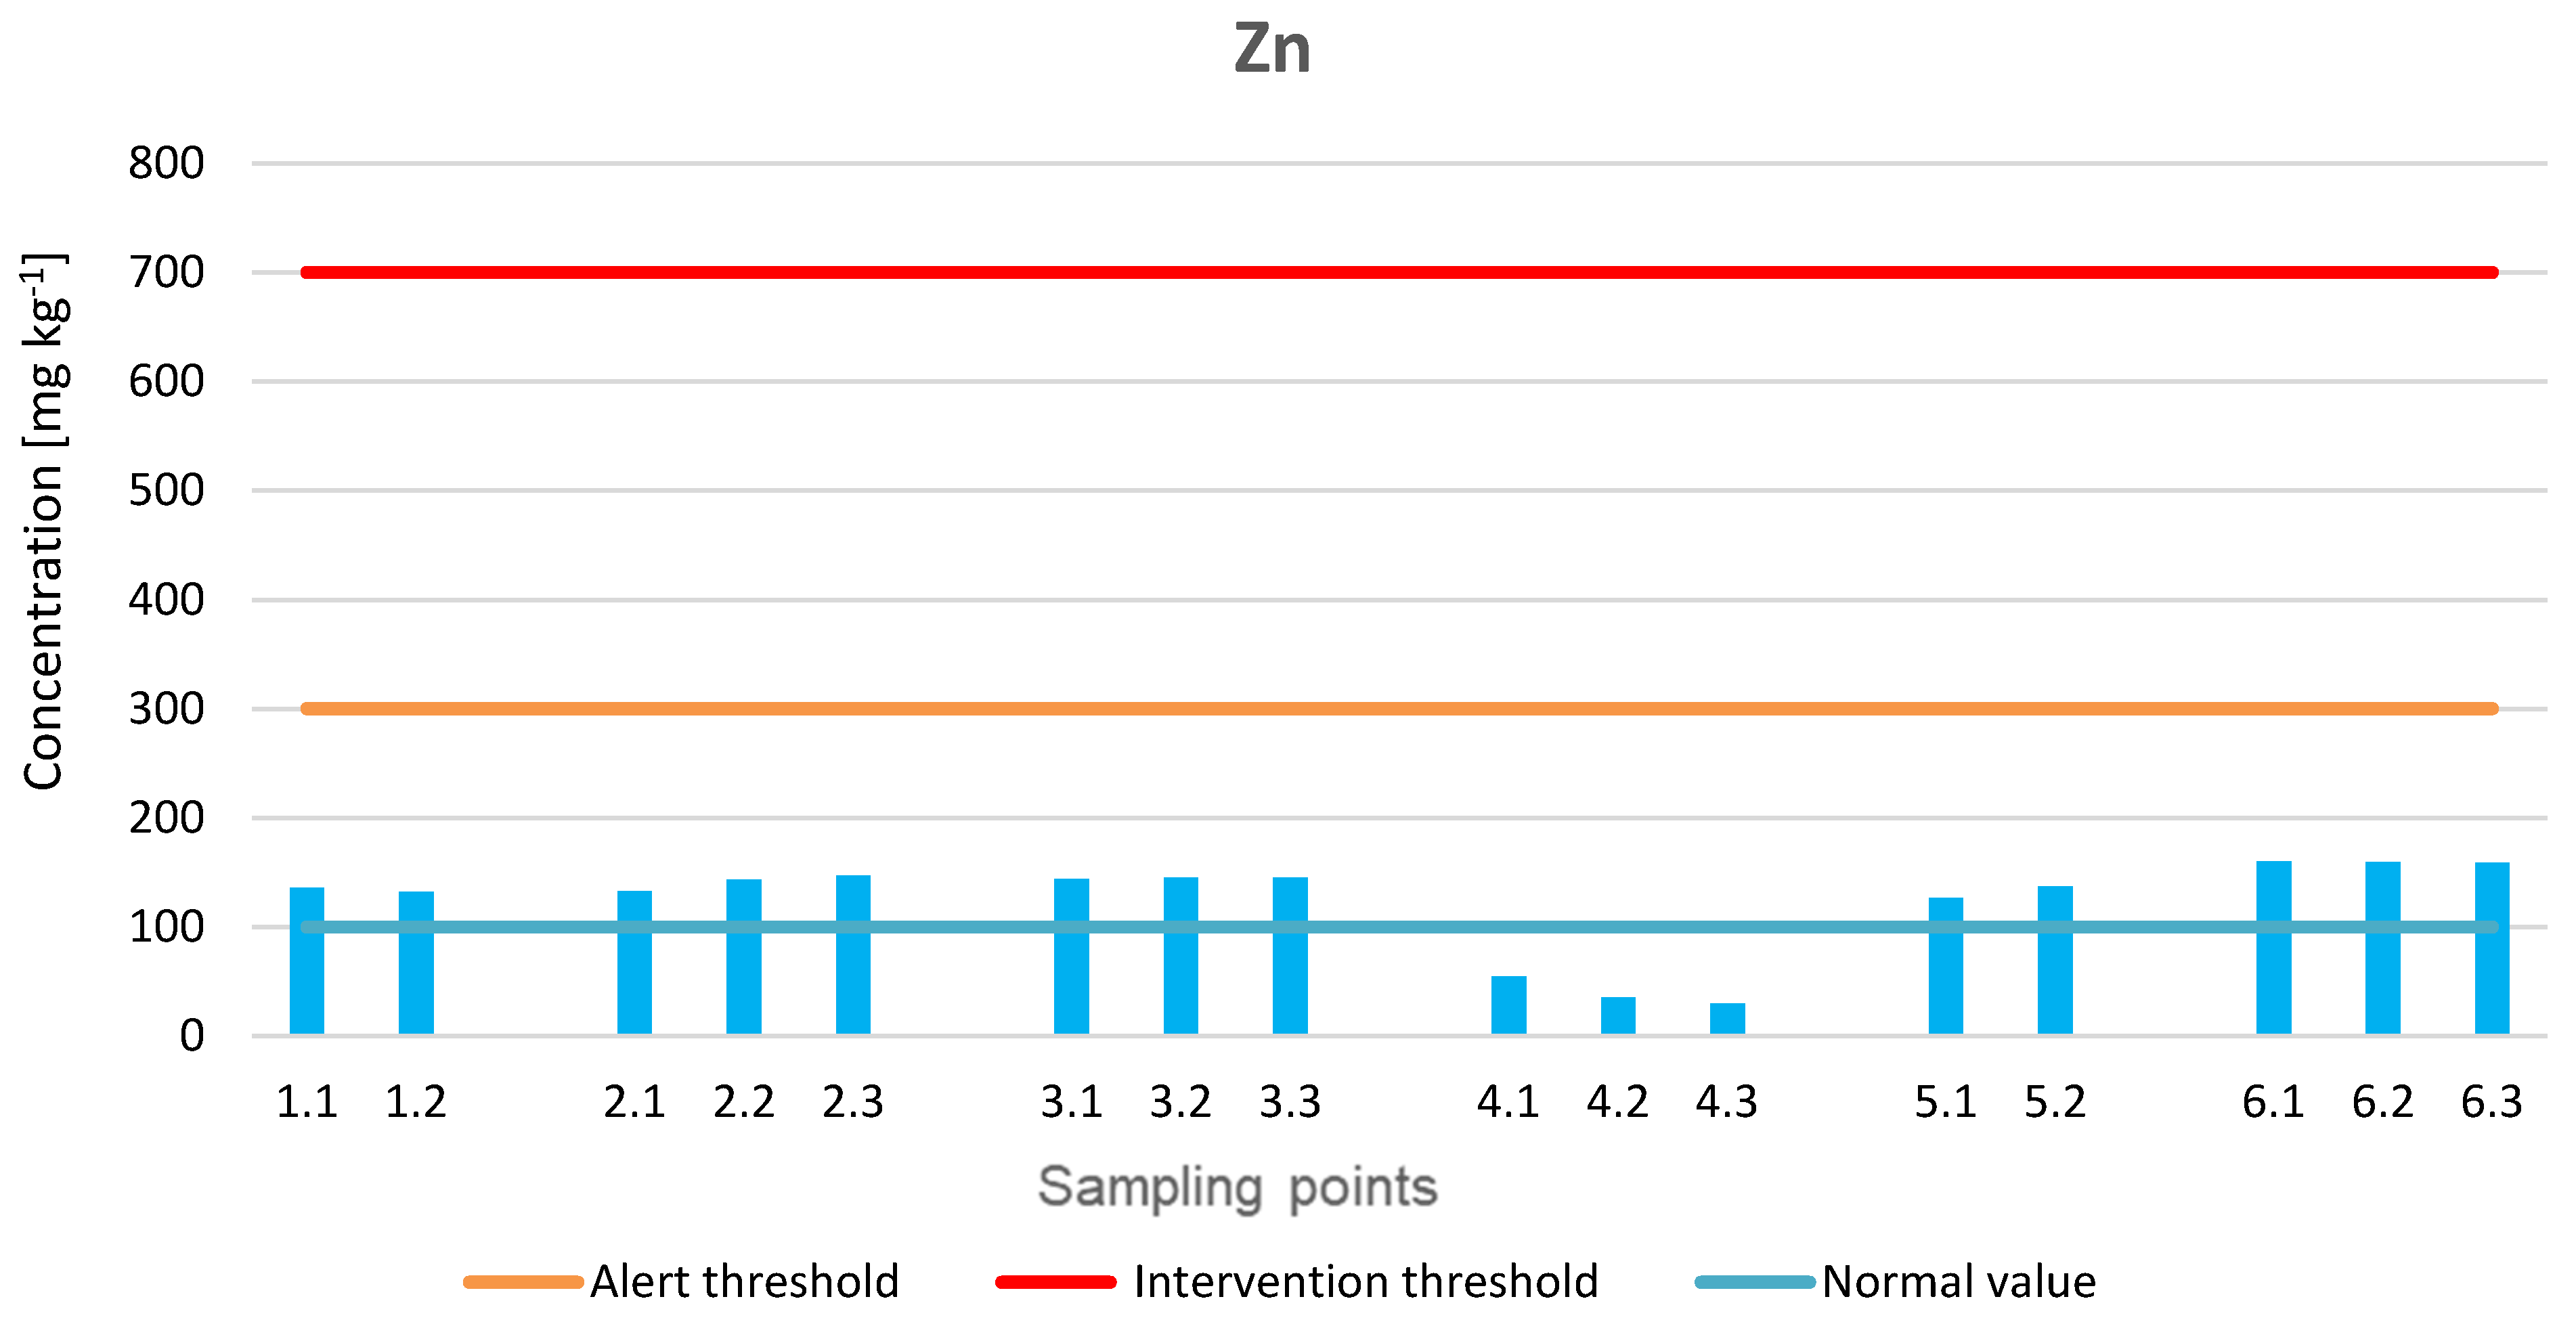
Results of determinations of the concentration of metals in the studied areas show that the concentration of Cr, Ni, and Zn are below the value of the alert and respectively the intervention threshold according to Romanian legislation (Order 756/1997). These metals are found in concentrations that exceed the normal value, for example in zone 3 they have the highest concentrations of Cr in the soil regardless of sampling depth. Nickel exceeds the normal value (20 mg kg−1) in most samples, except for Z5 and sample 2.1, and Zn concentrations exceed the normal value (100 mg kg−1) in all points except in the sample harvested from zone 4.
Cr is present usually in the soil in concentrations of 2–50 mg kg−1, having a tolerable limit of 100 mg kg−1. The chrome absorption of the plants from the soil is limited by the radicular system, rarely does it accumulate itself in the other organs of the plants [38].
Regarding Cr (Figure 9), it is below the alert (100 mg kg−1) and intervention (300 mg kg−1) thresholds, but it is found in a concentration that exceeds the normal value (30 mg kg−1), except for samples 1.1, 1.2, 4.1, 4.2 and 5.1. Zone 3 has the highest Cr concentrations in the soil regardless of sampling depth.
Ni is a heavy element, highly phytotoxic at a concentration greater than 50 mg kg−1 and causes changes in enzymatic activity. The most common symptoms of nickel plant toxicity are growth inhibition, chlorosis induction, necrosis, and wilting. Studies have shown that high levels of Ni have a negative effect on photosynthesis and respiration [38]. The concentrations of Ni (Figure 10) and Zn (Figure 11) are below the values of the alert and intervention thresholds. Ni exceeds the normal value (20 mg kg−1) in most samples, except Z5 and sample 2.1.
Excess zinc causes changes in the physical-chemical properties, reducing biological activity in the soil. In plants, zinc is toxic at concentrations higher than 400 mg kg−1 (dry substance), being accumulated in high proportion in the green organs of the plants, and has low toxicity for animals. Concerning humans, the allowable limit in food is 50 mg kg−1 [38].
Zn concentrations (Figure 11) show high values, exceeding the normal value (100 mg kg−1) in all points, except in the sample collected from zone 4.
Following determinations regarding the concentration of metals (Cd, Cr, Cu, Ni, Zn, and Pb), it results that each studied area represents a risk for human health. The order of soil pollution can be achieved: Pb > Cd > Cu > Zn > Cr > Ni.
Zn, Cr, Ni show similar concentrations for all areas investigated regardless of sampling depth, except for Z6 for Cr and Ni concentrations which decrease with sampling depth. In Z1 and Z3 there is a tendency to increase the concentration of pollutants in the depth samples for Cu, Cd, and Pb. Pb has higher concentrations in the surface samples, which indicates that it migrates with more difficulty in the soil profile. By making a connection between the concentration of metals in the soil, the depth of sampling, and the texture of the soil, a certain correlation was observed between them. The samples that had a high amount of coarse sand also had higher concentrations of metals, except in the case of Cd (Z6); Cu (Z2, Z4, Z5); Pb (Z4, Z6).
Zones 1 and 4 have lower concentrations compared to the other zones, but still exceed the normal value, which is a risk. Zone 1 shows high concentrations of Cd, the alert threshold (3 mg kg−1) being exceeded 5 times and the intervention threshold (5 mg kg−1) being exceeded 3 times, in the case of Pb only the alert threshold is exceeded (50 mg kg−1), and the concentrations of Cr, Cu, Ni and Zn exceed the normal value. Zones 2 and 3 have high concentrations of Cd, Cu, and Pb, both the alert and the intervention thresholds being exceeded. The biggest danger of Zone 4 is Cd, which exceeds the alert and intervention thresholds and Pb, which exceeds the value of the alert threshold. Zones 5 and 6 show concentrations of Cd, Cu, and Pb above the alert threshold and the intervention threshold, respectively.
Zone Z4, which is at a certain distance from the former plants and tailing ponds, has lower concentrations of Pb and Cu, but instead, Cd is at quite high values (4.2–6.7 mg kg−1), which are comparable to concentrations determined in 2020 by Farkas A. (3.2–21.5 mg kg−1) [8].
Pb concentrations (1379–1973 mg kg−1) determined in samples taken from zones Z5 and Z6 (zone of former plants) are higher than the values obtained by Damian G. (425–995) [7] and 3 times lower than those obtained by Damian F. (6565 mg kg−1) [11] in the area of the former lead processing plant. Results obtained in the present study for Pb indicate exceedances of 18 times the alert threshold, being similar to those obtained by Weindorf D.C. and Coroian A. who report exceedances of 19–30 times [9,10].
In the case of copper, determined concentrations (9.38–361 mg kg−1) are lower than those presented in the studies of Damian G. (22–750 mg kg−1) [7], Modoi O.C. (<1000 mg kg−1) [37], and Damian F. (400–5823 mg kg−1) [11]. The same can be said about the concentration of Cd (0.5–14.4 mg kg−1), which compared to the research of Modoi O.C. (1.2–32.2 mg kg−1) are 2 times lower [37].
3.2. Ecological Risk Assessment Methodology
Table 3 shows the values obtained for the Cf contamination factor, the Cd contamination degree, and the soil pollution load index PLI, calculated for each soil sampling point.
The largest number of soil samples had Cf values ≥ 6 resulting in a very high degree of pollution (Table 3). A relatively small number of samples (4 samples) were classified with Cf: 3–6, which indicates considerable contamination (Cu > Cd = Pb) The Cf contamination factor in the case of Cr, Ni, and Zn has a low degree of contamination (Cf < 1) to a moderate degree (Cf: 1–3) for all investigated samples, the order being Ni = Zn > Cr. Cf has the following order: Cd > Pb > Cu > Ni = Zn > Cr. The degree of contamination is higher than 32 and the PLI pollution load index is higher than 1, which means that the soil in the studied area has a high degree of contamination.
The values of the ecological risk index Er for the studied area were between 1.5 and 4420.4 (Table 4) showing very high values in the case of Cd (143.9–4420.4) and slightly lower values in the case of Pb (2.4–493.4) and Cu (1.9–72.3). The largest number of soil samples (55 samples) had values of Er < 40, resulting in a low ecological risk in the case of Cr, Ni, Zn, and Cu. Twenty-one samples present an extremely high degree of ecological risk (Er > 320), especially in the case of Cd and Pb. Analyzing the degree of ecological risk for the studied samples, the following order can be established: Cd > Pb > Cr = Ni = Zn > Cu.
The values obtained for the potential ecological risk index PERI for all the analyzed samples are between 733.9–4686, these far exceeding the PERI value = 600, which indicates a very high degree.
The degree of contamination Cd, the PLI pollution load index, and the PERI potential ecological risk index have very high values for all 16 investigated samples, which means that the area has a high level of soil pollution and indicates a strong anthropogenic influence on the soil in the studied area. This demonstrates that soil contamination in the studied areas is a case of complex, multi-element contamination, typical of areas with a long history of industrial activity, comparable to other cases studied by other researchers [28,40,41].
4. Conclusions
Although activities specific to mining in the Baia Mare area, Romania, have been stopped for several years, this study indicates that there are exceedances of metal concentrations: Cd: 3.5–14.4 mg kg−1; Cu: 9.4–361.5 mg kg−1; Pb: 29.7–1973 mg kg−1, some areas exceeding normal values or even exceeding the alert and intervention thresholds according to Romanian legislation.
The physico-chemical properties of the soil proved to be influenced by anthropological activity in the area, this fact is indicated by the analysis of the samples in the study area: the pH values being variable, in case of solutions with different degrees of acidity; diversified texture and structure.
Determination of the soil pollution indices for the studied area allowed the evaluation of the potential soil quality danger of anthropic activities carried out in the Baia Mare area. The largest number of soil samples had Cf values ≥6 resulting in a very high degree of pollution (Cd > Pb > Cu > Ni = Zn > Cr). The soil in the studied area has a high degree of contamination because the degree of contamination is higher than 32 and the PLI pollution load index is higher than 1. The conducted determinations indicate that Cd and Pb have very high concentrations (Er > 320) indicating an extremely high degree of ecological risk (Cd > Pb > Cr = Ni = Zn > Cu).
Analyzing the potential ecological risk index PERI, we can conclude that the area under study has a very high degree of pollution because all 16 samples investigated have values well above the value of PERI ≥ 600 (PERI = 733.9–4686).
Thus, after analyzing the results regarding the degree contamination—Cd, the pollution load index—PLI, and the potential ecological risk index—PERI, which have very high values for all analyzed samples, it can be stated that the soils in the studied area have a very high degree of pollution caused by anthropogenic activity in the area.
Results obtained from this study may provide support for future studies and research on the choice of appropriate technology for soil depollution and remediation of the area affected by metal pollution.
Author Contributions
Conceptualization: V.M., I.M.S. and E.T.P.; investigation: I.M.S., E.T.P. and T.G.; methodology: V.M., I.M.S. and E.T.P.; project administration: I.M.S.; resources: V.M. and I.M.S.; validation: V.M. and I.M.S.; visualization: I.M.S.; writing—original draft preparation I.M.S.; writing—review and editing: I.M.S. and T.G. All authors have read and agreed to the published version of the manuscript.
Funding
This research received no external funding.
Institutional Review Board Statement
Not applicable.
Informed Consent Statement
Not applicable.
Data Availability Statement
Not applicable.
Conflicts of Interest
The authors declare no conflict of interest.
References
- Banabic, D. History of Romanian Technique and Industry; Mechanics, Processing Techniques and Constructions, ed.; Romanian Academy Publishing House: Bucharest, Romania, 2019; Volume 1. (In Romanian) [Google Scholar]
- Pencea, R.; Brădățan, T.; Simion, Ș. Baia Mare—Preview of the Disaster Caused by the Mining Industry, Mining Watch Romania. 2013. Available online: http://www.miningwatch.ro (accessed on 15 February 2022). (In Romanian).
- Coman, M.; Oros, V.; Fălăuş, B.; Pop, R. Soil pollution with heavy metals—Specific issues for Baia Mare area. ProEnvironment 2010, 3, 29–32. [Google Scholar]
- Coman, M.; Oros, V.; Miloiu, E.; Taro, G.; Pop, R. Phytoremediation possibilities for contaminated mining areas from Romania. ProEnvironment 2009, 2, 203–207. [Google Scholar]
- Romanian National Environmental Protection Agency. Annual Report on the State of the Environment in Romania for 2017; Environment Ministry: Bucuresti, Romania, 2018; pp. 254–276. (In Romanian) [Google Scholar]
- Baia Mare-Touristy/Active/Attractive. Integrated Urban Development Strategy Baia Mare, Baia Mare, Romania. 2020. Available online: http://www.baiamare.ro (accessed on 15 February 2022). (In Romanian).
- Damian, G.; Damian, F.; Năsui, D.; Pop, C.; Pricop, C. The soils quality from the southern–eastern part of Baia Mare zone affected by metallurgical industry. Carpathian J. Earth Environ. Sci. 2010, 5, 139–147. [Google Scholar]
- Farkas, A.; Mereuti, F.; Butiuc-Keul, A.; Podar, D.; Roba, C.; Balc, R. 4 Effects of long-term exposure to heavy metals upon Rhizosphere bacteria from Baia Mare area (Maramures County, Romania). Geomicrobiol. J. 2020, 37, 867–876. [Google Scholar] [CrossRef]
- Weindorf, D.C.; Man, T.; Paulette, L.; Person, T. Soil heavy metal contamination in Baia Mare, Romania: An exploratory study. Int. J. Bioresour. Sci. 2015, 2, 1–5. [Google Scholar]
- Coroian, A.; Miresan, V.; Cocan, D.; Raducu, C.; Longodor, A.L.; Pop, A.; Feher, G.; Andronie, L.; Marchis, Z.; Mihali, C.; et al. Heavy metals and as content in soil and in plants in the Baia Mare mining and metallurgical area (NW of Roumania). Rev. Roum. Chim. 2017, 62, 373–379. [Google Scholar]
- Damian, F.; Damian, G.; Lacatusu, R.; Macovei, G.; Iepure, G.; Napradean, I.; Chira, R.; Kollar, L.; Rata, L.; Zaharia, D.C. Soils from the Baia Mare zone and the heavy metals pollution. Carpathian J. Earth Environ. Sci. 2008, 3, 85–98. [Google Scholar]
- Weissmannová, H.D.; Pavlovský, J. Indices of soil contamination by heavy metals—Methodology of calculation for pollution assessment (minireview). Environ. Monit. Assess. 2017, 189, 616. [Google Scholar] [CrossRef]
- Muller, G. Index of geoaccumulation in sediments of the Rhine River. GeoJournal 1969, 2, 108–118. [Google Scholar]
- Hakanson, L. An ecological risk index for aquatic pollution control.a sedimentological approach. Water Res. 1980, 14, 975–1001. [Google Scholar] [CrossRef]
- Kowalska, J.B.; Mazurek, R.; Gąsiorek, M.; Zaleski, T. Pollution indices as useful tools for the comprehensive evaluation of the degree of soil contamination—A review. Environ. Geochem. Health 2018, 40, 2395–2420. [Google Scholar] [CrossRef] [PubMed] [Green Version]
- Golia, E.E.; Papadimou, S.G.; Cavalaris, C.; Tsiropoulos, N.G. Level of Contamination Assessment of Potentially Toxic Elements in the Urban Soils of Volos City (Central Greece). Sustainability 2021, 13, 2029. [Google Scholar] [CrossRef]
- Islam, M.S.; Ahmed, M.K.; Al-Mamun, M.H. Metal speciation in soil and health risk due to vegetables consumption in Bangladesh. Environ. Monit. Assess. 2015, 187, 288–303. [Google Scholar] [CrossRef]
- Shaheen, S.M.; Shams, M.S.; Khalifa, M.R.; El-Daly, M.A.; Rinklebe, J. Various soil amendments and wastes affect the (im)mobilization and phytoavailability of potentially toxic elements in a sewage effluent irrigated sandy soil. Ecotoxicol. Environ. Saf. 2017, 142, 375–387. [Google Scholar] [CrossRef] [PubMed]
- Ke, X.; Gui, S.; Huang, H.; Zhang, H.; Wang, C.; Guo, W. Ecological risk assessment and source identification for heavy metals in surface sediment from the Liaohe River protected area, China. Chemosphere 2017, 175, 473–481. [Google Scholar] [CrossRef]
- Al-Anbari, R.; Abdul Hameed, M.J.; Obaidy, A.; Fatima, H.A.A. Pollution loads and ecological risk assessment of heavy metals in the urban soil affected by various anthropogenic activities. Int. J. Adv. Res. 2015, 2, 104–110. [Google Scholar]
- Baran, A.; Wieczorek, J.; Mazurek, R.; Urbański, K.; Klimkowicz-Pawlas, A. Potential ecological risk assessment and predicting zinc accumulation in soils. Environ. Geochem. Health 2018, 40, 435–450. [Google Scholar] [CrossRef] [Green Version]
- STAS 7184/1-84; Soils. Sampling for Pedological and Agrochemical Studies. ASRO: Bucuresti, Romania, 1984. (In Romanian)
- SR ISO 11464:1998; Soil Quality. Pretreatment of Samples for Physico-Chemical Analysis. ASRO: Bucuresti, Romania, 1998. (In Romanian)
- Order No. 756 of 3 November 1997 for the Approval of the Regulation on Environmental Pollution Assessment. Eminent: Ministry of Waters, Forests and Environmental Protection. (Published in: Official Gazette No 303 bis of 6 November 1997). Available online: http://legislatie.just.ro/Public/DetaliiDocumentAfis/151788 (accessed on 15 February 2022). (In Romanian).
- Micle, V.; Sur, I.M. Soil Science; Laboratory Guide, ed.; UT Press: Cluj-Napoca, Romania, 2012. (In Romanian) [Google Scholar]
- USDA. Natural Resources Conservation Service Soils. Available online: https://www.nrcs.usda.gov/wps/portal/nrcs/detail/soils/survey/?cid=nrcs142p2_054167 (accessed on 15 February 2022).
- Senila, M.; Levei, E.A.; Senila, L.R.; Oprea, G.M.; Roman, C.M. Mercury in soil and perennial plants in a miningaffected urban area from Northwestern Romania. J. Environ. Sci. Health Part A 2012, 47, 614–621. [Google Scholar] [CrossRef]
- Rinklebe, J.; Antoniadis, V.; Shaheen, S.M.; Rosche, O.; Altermann, M. Health risk assessment of potentially toxic elements in soils along the Central Elbe River, Germany. Environ. Int. 2019, 126, 76–88. [Google Scholar] [CrossRef]
- Tomlinson, D.L.; Wilson, J.G.; Harris, R.; Jeffrey, W. Problems in Assessment of Heavy Metals in Estuaries and the Formation of Pollution Index. Helgoländer Meeresunters. 1980, 33, 566–575. [Google Scholar] [CrossRef] [Green Version]
- Gong, Q.; Deng, J.; Xiang, Y.; Wang, Q.; Yang, L. Calculating Pollution Indices by Heavy Metals in Ecological Geochemistry Assessment and a Case Study in Parks of Beijing. J. China Univ. Geosci. 2008, 19, 230–241. [Google Scholar] [CrossRef]
- Kowalska, J.; Mazurek, R.; Gąsiorek, M.; Setlak, M.; Zaleski, T.; Waroszewski, J. Soil pollution indices conditioned by medieval metallurgical activity—A case study from Krakow (Poland). Environ. Pollut. 2016, 218, 1023–1036. [Google Scholar] [CrossRef]
- Yan, T.; Zhao, W.; Yu, X.; Li, H.; Gao, Z.; Ding, M.; Yue, J. Evaluating heavy metal pollution and potential risk of soil around a coal mining region of Tai’an City, China. Alex. Eng. J. 2022, 61, 2156–2165. [Google Scholar] [CrossRef]
- Levei, E.; Frentiu, T.; Ponta, M.; Tanaselia, C.; Borodi, G. Characterization and assessment of potential environmental risk of tailings stored in seven impoundments in the Aries river basin, Western Romania. Chem Cent J. 2013, 7, 5. [Google Scholar] [CrossRef] [PubMed] [Green Version]
- Saha, S.; Hazra, G.C.; Saha, B.; Mandal, B. Assessment of heavy metals contamination in different crops grown in long-term sewage-irrigated areas of Kolkata, West Bengal. India Environ. Monit. Assess. 2015, 187, 4087. [Google Scholar] [CrossRef] [PubMed]
- Kabata-Pendias, A. Trace Elements in Soils and Plants, 4th ed.; CRC Press: Boca Raton, FL, USA, 2010. [Google Scholar] [CrossRef]
- Kükrer, S.; Şeker, S.S.; Murathan, Z.T.; Kutlu, B. Ecological risk assessment of heavy metals in surface sediments of northern littoral zone of Lake Cildir, Ardahan, Turkey. Environ. Monit. Assess. 2014, 186, 3847–3857. [Google Scholar] [CrossRef]
- Modoi, O.C.; Ozunu, A.; Stezar, I.C. Risks Associated with Soil Pollution in the vicinity of Tailings Ponds Located in the West of Baia Mare Municipality. ProEnvironment 2010, 3, 534–540. (In Romanian) [Google Scholar]
- Luduşan, N. The effects of heavy metal accumulation in soils on the biotic component of the Zlatna Depression. Cadastre Rev. 2007, 7, 189–194. (In Romanian) [Google Scholar]
- Ona, L.F.; Alberto, A.P.; Prudente, J.A.; Sigua, G.C. Levels of lead in urban soils from selected cities in the rice-based region of the Philippines. Environ. Sci. Pollut. Res. 2006, 13, 177–183. [Google Scholar] [CrossRef]
- Gabersek, M.; Gosar, M. Geochemistry of urban soil in the industrial town of Maribor, Slovenia. J. Geochem. Explor. 2018, 187, 141–154. [Google Scholar] [CrossRef]
- Antoniadis, V.; Golia, E.E.; Liu, Y.; Wang, S.; Shaheen, S.M.; Rinklebe, J. Soil and maize contamination by trace elements and associated health risk assessment in the industrial area of Volos, Greece. Environ. Int. 2019, 124, 79–88. [Google Scholar] [CrossRef] [PubMed]
Figure 1.
Study area and sampling location.

Figure 2.
Soil sampling areas.


Figure 3.
pH values in soil samples.

Figure 4.
Quantities of fine coarse sand in soil samples.

Figure 5.
Images with soil sample structure.

Figure 6.
The variation of Cd concentration in the soil samples compared to the normal values, the alert threshold, and the intervention threshold according to Order 756/1977.
Figure 6.
The variation of Cd concentration in the soil samples compared to the normal values, the alert threshold, and the intervention threshold according to Order 756/1977.

Figure 7.
The variation of Cu concentration in the soil samples compared to the normal values, the alert threshold, and the intervention threshold according to Order 756/1977.
Figure 7.
The variation of Cu concentration in the soil samples compared to the normal values, the alert threshold, and the intervention threshold according to Order 756/1977.

Figure 8.
The variation of Pb concentration in the soil samples compared to the normal values, the alert threshold, and the intervention threshold according to Order 756/1977.
Figure 8.
The variation of Pb concentration in the soil samples compared to the normal values, the alert threshold, and the intervention threshold according to Order 756/1977.

Figure 9.
The variation of Cr concentration in the soil samples compared to the normal values, the alert threshold, and the intervention threshold according to Order 756/1977.
Figure 9.
The variation of Cr concentration in the soil samples compared to the normal values, the alert threshold, and the intervention threshold according to Order 756/1977.

Figure 10.
The variation of Ni concentration in the soil samples compared to the normal values, the alert threshold, and the intervention threshold according to Order 756/1977.
Figure 10.
The variation of Ni concentration in the soil samples compared to the normal values, the alert threshold, and the intervention threshold according to Order 756/1977.

Figure 11.
The variation of Zn concentration in the soil samples compared to the normal values, the alert threshold, and the intervention threshold according to Order 756/1977.
Figure 11.
The variation of Zn concentration in the soil samples compared to the normal values, the alert threshold, and the intervention threshold according to Order 756/1977.


Table 1.
Encoding of soil samples.
| Sampling Area | Sampling Depth | Sample Code |
|---|---|---|
| Z1 | 0–20 cm | 1.1 |
| 20–40 cm | 1.2 | |
| Z2 | 0–20 cm | 2.1 |
| 20–40 cm | 2.2 | |
| 40–60 cm | 2.3 | |
| Z3 | 0–20 cm | 3.1 |
| 20–40 cm | 3.2 | |
| 40–60 cm | 3.3 | |
| Z4 | 0–20 cm | 4.1 |
| 20–40 cm | 4.2 | |
| 40–60 cm | 4.3 | |
| Z5 | 0–20 cm | 5.1 |
| 20–40 cm | 5.2 | |
| Z6 | 0–20 cm | 6.1 |
| 20–40 cm | 6.2 | |
| 40–60 cm | 6.3 |
Table 2.
Metal pollution indices are used to assess soil quality.
| Indices | Value and the Quality of Soil | References |
|---|---|---|
| Cf—Contamination factor | Cf < 1 ⇨ Low contamination factor 1 ≤ Cf < 3 ⇨ Moderate contamination factor 3 ≤ Cf < 6 ⇨ Considerable contamination factor Cf ≥ 6 ⇨ Very high contamination factor | Weissmannová, 2017 Islam et al., 2015 Shaheen et al., 2017 [12,17,18] |
| Cd—Degree of Contamination | Cd < 8 ⇨ Low degree of contamination 8 ≤ Cd ≤ 16 ⇨ Moderate degree of contamination 16 ≤ Cd ≤ 32 ⇨ Considerable degree of contamination Cd > 32 ⇨ Very high degree of contamination | Weissmannová, 2017 Levei, et.al., 2013 [12,33] |
| PLI—Pollution Load Index | PLI < 1 ⇨ Not polluted soil PLI = 1 ⇨ Soil with normal background level PLI > 1 ⇨ Polluted soil | Islam et al., 2015 Saha et al., 2015 Shaheen et al., 2019 [17,18,34] |
| Er—Ecological risk index | Er < 40 ⇨ Low ecological risk 40 < Er ≤ 80 ⇨ Moderate ecological risk 80 < Er ≤ 160 ⇨ Considerable ecological risk 160 < Er ≤ 320 ⇨ High ecological risk Er > 320 ⇨ Serious ecological risk | Weissmannová, 2017 Kabata-Pendias, 2011 [12,35] |
| PERI—Potential Ecological Risk Index | PERI < 150 ⇨ Low ecological risk 150 ≤ PERI < 300 ⇨ Moderate ecological risk 300 ≤ PERI < 600 ⇨ High potential ecological risk PERI ≥ 600 ⇨ Significantly high ecological risk | Weissmannová, 2017 Kükrer, S., et.al., 2014 [12,36] |
Table 3.
Calculated values for the Cf contamination factor, Cd contamination degree, and PLI pollution load index.
Table 3.
Calculated values for the Cf contamination factor, Cd contamination degree, and PLI pollution load index.
| Sample Code | Cf | Cd | PLI | |||||
|---|---|---|---|---|---|---|---|---|
| Cr | Cd | Cu | Ni | Pb | Zn | |||
| 1.1 | 0.773 | 56.633 | 3.558 | 1.273 | 7.668 | 1.911 | 71.81 | 4.927 |
| 1.2 | 0.752 | 63.571 | 4.202 | 1.309 | 8.986 | 1.863 | 80.68 | 5.355 |
| 2.1 | 1.033 | 65.918 | 9.269 | 0.820 | 51.717 | 1.867 | 130.62 | 8.703 |
| 2.1 | 0.986 | 35.204 | 11.963 | 1.159 | 46.279 | 2.021 | 97.61 | 8.524 |
| 2.3 | 0.917 | 147.347 | 11.996 | 1.570 | 36.922 | 2.070 | 200.82 | 11.422 |
| 3.1 | 2.088 | 78.571 | 10.413 | 1.557 | 57.617 | 2.032 | 152.28 | 12.550 |
| 3.2 | 2.305 | 83.571 | 11.094 | 1.671 | 64.993 | 2.048 | 165.68 | 13.658 |
| 3.3 | 2.217 | 88.367 | 11.516 | 1.676 | 62.763 | 2.045 | 168.58 | 13.715 |
| 4.1 | 0.679 | 43.571 | 0.896 | 1.029 | 4.043 | 0.769 | 50.99 | 2.431 |
| 4.2 | 0.700 | 58.571 | 0.506 | 1.086 | 0.473 | 0.497 | 61.83 | 1.396 |
| 4.3 | 0.868 | 69.184 | 0.375 | 1.309 | 1.486 | 0.421 | 73.64 | 1.792 |
| 5.1 | 0.629 | 101.837 | 3.291 | 0.745 | 73.483 | 1.779 | 181.76 | 7.285 |
| 5.2 | 1.261 | 75.306 | 6.415 | 0.890 | 68.979 | 1.936 | 154.79 | 9.374 |
| 6.1 | 2.672 | 4.796 | 14.462 | 1.885 | 98.682 | 2.256 | 124.75 | 9.510 |
| 6.2 | 2.339 | 56.633 | 14.366 | 1.797 | 97.196 | 2.250 | 174.58 | 14.954 |
| 6.3 | 0.958 | 62.449 | 11.794 | 1.174 | 88.819 | 2.242 | 167.44 | 11.053 |
| Legend: |  Cf < 1—Low contamination factor Cf < 1—Low contamination factor Cf: 1–3—Moderate contamination factor Cf: 1–3—Moderate contamination factor Cf: 3–6—Considerable contamination factor Cf: 3–6—Considerable contamination factor Cf ≥ 6—Very high contamination factor Cd > 32—Very high degree of contamination PLI > 1—Polluted soil Cf ≥ 6—Very high contamination factor Cd > 32—Very high degree of contamination PLI > 1—Polluted soil | |||||||
Table 4.
Ecological risk index Er and PERI potential ecological risk index.
| Sample Code | Er | PERI | |||||
|---|---|---|---|---|---|---|---|
| Cr | Cd | Cu | Ni | Pb | Zn | ||
| 1.1 | 1.546 | 1699.0 | 17.79 | 6.36 | 38.34 | 4.927 | 1767.9 |
| 1.2 | 1.505 | 1907.1 | 21.01 | 6.54 | 44.93 | 5.355 | 1986.5 |
| 2.1 | 2.066 | 1977.6 | 46.35 | 4.10 | 258.59 | 8.703 | 2297.3 |
| 2.1 | 1.973 | 1056.1 | 59.82 | 5.79 | 231.39 | 8.524 | 1363.6 |
| 2.3 | 1.834 | 4420.4 | 59.98 | 7.85 | 184.61 | 11.422 | 4686.1 |
| 3.1 | 4.177 | 2357.1 | 52.06 | 7.78 | 288.09 | 12.550 | 2721.8 |
| 3.2 | 4.611 | 2507.1 | 55.47 | 8.35 | 324.96 | 13.658 | 2914.2 |
| 3.3 | 4.435 | 2651.0 | 57.58 | 8.38 | 313.82 | 13.715 | 3048.9 |
| 4.1 | 1.359 | 1307.1 | 4.48 | 5.15 | 20.21 | 2.431 | 1340.8 |
| 4.2 | 1.400 | 1757.1 | 2.53 | 5.43 | 2.37 | 1.396 | 1770.3 |
| 4.3 | 1.737 | 2075.5 | 1.88 | 6.54 | 7.43 | 1.792 | 2094.9 |
| 5.1 | 1.258 | 3055.1 | 16.45 | 3.72 | 367.41 | 7.285 | 3451.2 |
| 5.2 | 2.522 | 2259.2 | 32.08 | 4.45 | 344.89 | 9.374 | 2652.5 |
| 6.1 | 5.345 | 143.9 | 72.31 | 9.43 | 493.41 | 9.510 | 733.9 |
| 6.2 | 4.678 | 1699.0 | 71.83 | 8.99 | 485.98 | 14.954 | 2285.4 |
| 6.3 | 1.916 | 1873.5 | 58.97 | 5.87 | 444.09 | 11.053 | 2395.4 |
| Legend: | Er < 40—Low ecological risk Er: 40–80—Moderate ecological risk Er: 80–160—Considerable ecological risk Er: 160–320—High ecological risk Er > 320—Serious ecological risk Er > 320—Serious ecological risk PERI ≥ 600—Significantly high ecological risk PERI ≥ 600—Significantly high ecological risk | ||||||
Publisher’s Note: MDPI stays neutral with regard to jurisdictional claims in published maps and institutional affiliations. |
© 2022 by the authors. Licensee MDPI, Basel, Switzerland. This article is an open access article distributed under the terms and conditions of the Creative Commons Attribution (CC BY) license (https://creativecommons.org/licenses/by/4.0/).
Share and Cite
MDPI and ACS Style
Sur, I.M.; Micle, V.; Polyak, E.T.; Gabor, T. Assessment of Soil Quality Status and the Ecological Risk in the Baia Mare, Romania Area. Sustainability 2022, 14, 3739. https://0-doi-org.brum.beds.ac.uk/10.3390/su14073739
AMA Style
Sur IM, Micle V, Polyak ET, Gabor T. Assessment of Soil Quality Status and the Ecological Risk in the Baia Mare, Romania Area. Sustainability. 2022; 14(7):3739. https://0-doi-org.brum.beds.ac.uk/10.3390/su14073739
Chicago/Turabian StyleSur, Ioana Monica, Valer Micle, Evelyn Terez Polyak, and Timea Gabor. 2022. "Assessment of Soil Quality Status and the Ecological Risk in the Baia Mare, Romania Area" Sustainability 14, no. 7: 3739. https://0-doi-org.brum.beds.ac.uk/10.3390/su14073739
Note that from the first issue of 2016, this journal uses article numbers instead of page numbers. See further details here.