
A GIS-Based Multi-Criteria Analysis Framework to Evaluate Urban Physical Resilience against Earthquakes


1
Spatial Decision Making & Smart Cities Lab, Faculty of Geodesy and Geomatics Engineering, K. N. Toosi University of Technology, 470 Mirdamad, Tehran 1631714191, Iran
2
Civil Engineering Department, Sirjan University of Technology, Sirjan 7813733385, Iran
3
School of Built Environment, Faculty of the Arts, Design & Architecture, University of New South Wales (UNSW), Sydney, NSW 2052, Australia
4
Graduate School of Humanities and Social Science, Hiroshima University, Higashi-Hiroshima 739-8529, Japan
5
Center for Peaceful and Sustainable Futures (CePEAS), IDEC Institute, Hiroshima University, Higashi-Hiroshima 739-8529, Japan
6
Network for Education and Research on Peace and Sustainability (NERPS), Hiroshima University, Higashi-Hiroshima 739-8529, Japan
*
Author to whom correspondence should be addressed.
Sustainability 2022, 14(9), 5034; https://0-doi-org.brum.beds.ac.uk/10.3390/su14095034
Submission received: 15 March 2022
/
Revised: 12 April 2022
/
Accepted: 20 April 2022
/
Published: 22 April 2022
(This article belongs to the Collection Indicators, Assessment Tools, and Rating Systems for Mainstreaming Sustainability in Urban Planning and Development)
Abstract
:As complex man-made systems that are home to the majority of the world population, cities have always faced a wide range of risks such as earthquakes. As the backbone of urban systems, physical components, including buildings, transportation networks, communication networks, and open and green spaces, are also vulnerable to disasters. To enhance the capacity to deal with disaster risks, enhancing urban resilience has recently become an essential priority for cities. This study aims to develop and pilot test a framework to evaluate urban physical resilience based on resilience characteristics and associated physical indicators. Interpretive Structural Modelling (ISM) was used to determine the relationships between physical indicators, and Multi-Criteria Decision-Making methods were applied to determine the relative importance of the characteristics. The results showed that the ‘Robustness of Building’, ‘Building Density’, ‘Aspect Ratio’, and ‘Street Width’ are the most important among the twenty physical indicators considered in the proposed framework. Subsequently, the proposed framework was applied to one of the districts of Kerman, a major city located in the southwest, earthquake-prone part of Iran. Overall results indicate low levels of physical resilience. The findings of this study can provide urban planners and decision-makers with more transparent and practical insights into the physical resilience of cities. Results can also be used to design and implement policies and programs to improve the current conditions.
1. Introduction
Currently, more than half of the world’s population and most physical assets are located in cities that are exposed to a wide range of natural and environmental hazards, such as earthquakes, severe droughts, floods, hurricanes, tornadoes, landslides, etc. [1]. Factors such as rapid population growth in dense urban areas, rapid urbanization, and increased concentration of financial and physical capital in cities, together with poor urban management and disaster risk reduction mechanisms, have increased the damage and losses caused by earthquakes in the past few decades [2,3].
Vulnerability to earthquake hazards is a particularly big issue in cities in developing countries that experience rapid population growth rates but fail to appropriately plan and prepare for, absorb, and recover from adverse natural hazards, such as earthquakes [4]. Urban population growth is expected to continue to increase in the coming decades [5,6], leading to an increase in the development of the urban physical structure, and additional construction in cities [7,8]. Accordingly, the damage caused by natural disasters in cities could become even more severe in the future [9,10]. This damage could result in social, economic, and physical outcomes that grow exponentially [11].
Earthquakes are among the most frequent and catastrophic natural hazards [12]. Every year, more than 1.4 million earthquakes occur on Earth, resulting in significant human and economic losses [13]. According to the United Nations Office for Disaster Risk Reduction (UNISDR), earthquakes accounted for 7.8% of natural hazards after floods and storms from 1998–2017. Earthquakes also accounted for the highest rate of human casualties (56%), equal to 747,234 people in the same period. The economic damages caused by earthquakes are also significant and estimated at 23% of the total damage caused by natural disasters. Furthermore, 125 million cases of injury, homelessness, or mortality due to earthquakes were reported between 1998 and 2017 [1]. The five countries with the highest earthquake casualties are China, Indonesia, Iran, Turkey, and Japan [14]. Iran, which ranks third, has 31.7% of its total area located in earthquake-prone zones, and 70% of the country’s population lives in earthquake-prone areas [15].
In recent decades, there has been increasing consensus in science and policy circles that the best way to deal with hazards is to enhance resilience capacity [16]. Resilience improvement can save considerable amounts of human, economic, social, and physical resources by reducing the effects of disasters on cities [17]. Hence, there has been a paradigm shift from focusing on vulnerability reduction to emphasizing resilience building [18,19]. In cities where complex systems consist of interconnected and interacting subsystems, resilience as a dynamic process focuses on both the cities’ inherent robustness and adaptive capacity [20]. This approach has been presented as an undeniable necessity and a challenge for the scientific community, considering its effects on the lives of millions of people [21,22].
Given the vulnerability of Iranian cities to earthquakes, this research focuses on earthquake resilience. Evaluating the state of urban resilience is a necessary step toward risk reduction and better preparedness to deal with and adapt to risks [23]. The development and implementation of resilience measurement tools allow the identification of weaknesses that need to be addressed and areas that need to be prioritized in resilience-building activities. This, in turn, can facilitate evidence-based decision-making toward better disaster resilience [24,25].
Among the four main dimensions of resilience—namely, social, economic, physical, and institutional [26,27]—less attention has been paid to the physical dimension and structural robustness of cities. Similarly, urban physical characteristics that have significant implications for the potential to cope with various natural hazards have received relatively less attention in the urban resilience literature [28,29,30,31]. This is despite the fact that physical components play a significant role in absorbing the initial disaster shocks and are also essential to maintaining urban functionality after an earthquake [32]. Properly designed urban form can strengthen urban resilience during emergency conditions [7]. In this research, several indicators are used to examine urban physical resilience. Additionally, to understand and measure the concept of resilience, it is separated into its determinant and underlying characteristics.
Different studies have evaluated urban physical resilience. To examine earthquake resilience, Karatani and Hayashi [33], Beniya [34], and Chang [35] have considered indicators related to the design of parcels along with the density and size of open and green spaces. Jones and Dempsey [36] investigated the elements of the urban physical structure according to the five categories of density, type of building, transportation infrastructure, communication networks, and land use, concentrating on the effects of these elements on resilience against earthquakes. Allan and Bryant [37] proposed a model to evaluate the role of open spaces in urban resilience against earthquakes. They also examined different plans for the reconstruction and recovery of urban elements, emphasizing the role of open spaces. Chapagain [38] raised the question of whether the damage caused by earthquakes in cities would increase due to weak urban physical structures. He examined the blockage of street networks caused by the collapse and damage to buildings during an earthquake and stated that having a proper network of passages in dense urban areas is very effective in saving people’s lives. Allan and Bryant [39] studied the influence of urban morphology on urban resilience. The authors examined the interrelationships of community adaptive behaviors and the urban space after the Concepción 2010 earthquake. In their assessment of the role of urban spatial characteristics, they only focused on the recovery phase. Shrestha and Sliuzas [40] studied the role of open spaces in earthquake resilience and risk absorption. They examined land use, access to essential services, ownership, and the size and density of the environment around open spaces.
Davis and Uffer [41] examined the relationship between resilience and urban form by proposing environmental, physical, economic, and social indicators. Marcus and Colding [42] attempted to illustrate the general characteristics of urban form resilience through space syntax theory. León and March [43] examined the role of urban morphology in resilience against tsunami hazards. They developed an agent-based computer model to determine and quantify resilience. Brand and Nicholson [44] assessed the recovery phase of urban spaces after the 2010 and 2011 earthquakes in New Zealand. In their study, the potential of urban public spaces, which can improve resilience, was analyzed and evaluated based on five resilience characteristics: resourcefulness, flexibility, fail-safe, rapid restoration, and learning. Sharifi [32] investigated the relationship between urban form and resilience. He examined urban form hierarchically in three macro-, meso-, and micro-scales. The indicators of urban size, type of development, population and occupation distribution pattern, degree of clustering, and landscape connectivity were considered at the macro-scale to examine the relationship between urban form and resilience. The author also considered meso-scale indicators, such as the design of neighborhoods, blocks, parcels, and open spaces. In addition, Sharifi [7] examined the micro-scale urban form by focusing on streets and street networks. He divided the characteristics of urban streets into the two general categories of network topology and network design.
Despite extensive studies on resilience, there is still no single definition for it. UNISDR has provided a definition that is widely used in the field of urban resilience and is also considered the basis of this study. According to this definition, resilience is “the capability of a city system subject to hazards to resist, absorb, accommodate, adapt to, and recover from the impacts of hazards efficiently through the preservation and restoration of its essential basic structures and functions” [45]. Accordingly, resilience is a combination of preparedness, absorption of disturbances, and timely recovery, along with enhanced learning capacities and adaptation [46]. One of the advantages of this definition is that it clarifies the distinction between the concept of resilience and vulnerability, which mainly emphasizes pre-crisis preparedness.
As this brief review of the literature shows, while the urban spatial system is a complex combination of components with interdependent and variable interactions, previous studies have only considered some specific aspects and a limited number of physical indicators. In addition, existing research does not elaborate on the linkages between these indicators and the determinant and underlying characteristics of resilience. Since the concept of resilience is relatively new, there is a lack of systematic methodology to examine the relationship between multiple elements of urban form and resilience and measure/estimate urban physical resilience to earthquakes. Moreover, research on urban physical resilience is subject to different limitations such as general disagreement over the influencing indicators, failure to consider all important indicators, failure to account for interrelationships and trade-offs between indicators and underlying characteristics of urban physical resilience, and ultimately, challenges regarding integrating all of these in a coherent evaluation framework. Therefore, this research seeks to develop a comprehensive framework that includes the underlying characteristics of urban physical resilience and a comprehensive list of urban physical indicators. To the best of our knowledge, these have not been studied together in previous studies.
Against this background, the objectives of this research are:
- Clarifying the concept of urban physical resilience by explaining its influencing characteristics and indicators;
- Determining and analyzing the relationship between indicators of the urban physical structure to measure their effects on urban physical resilience;
- Determining the importance of urban physical characteristics and indicators to measure their effects on resilience; and
- Developing a conceptual framework for assessing urban physical resilience and pilot testing it in an earthquake-prone city.
2. Case Study
Frequent earthquakes in Iran have always caused many casualties and economic losses [47,48,49,50]. According to the United Nations, in 2003, Iran was ranked first globally in terms of the number of earthquakes and the associated number of people killed. The main reason for this is the high vulnerability of most cities in Iran. Statistics show that 80% of the country’s cities are vulnerable to a 5 moment magnitude (MW) earthquake [15]. Kerman province, which constitutes about 11% of the country’s area, is the most earthquake-prone province in Iran. Kerman city, the capital of this province, is also an earthquake-prone and vulnerable area due to various factors such as its geographical location and geological setting, the existence of numerous active faults around it, and the occurrence of several destructive historical earthquakes in its vicinity over the past few decades [51].
Kerman is located in the southeast of Iran, with a longitude of 30°14′ to 30°19′ E and a latitude of 57°07′ to 57° N. The city is situated on a plain between the two central ranges of the Zagros Mountains. The average altitude of the city is about 1760 m above sea level. As the most important and largest city in the southeast of Iran, Kerman has a trans-regional function in such a way that it provides many economic and functional services to the neighboring provinces. Due to the location of this city on the Alpine-Himalayan seismic belt and its siege by several active faults, the most important of which is 13 km to the North of Kerman, the city is prone to earthquakes. In the past, many earthquakes have hit the city, leading to many casualties [51]. This has made it essential to pay attention to crisis management and enhance the resilience of this city. In this paper, district 1 of Kerman, which has a high population density and diverse land uses, has been studied (Figure 1).
To evaluate the degree of physical resilience and map physical resilience in district 1 of Kerman, the required base maps related to urban land use, urban road map, location of critical and hazardous facilities, proportion of urban green spaces, and the robustness of the buildings were obtained from various sources, including Kerman Municipality and Kerman Crisis Management Organization.
3. Methodology
A mixed-methods approach was adopted to develop a conceptual framework for the assessment of urban physical resilience (Figure 2):
- Determining the characteristics of urban physical resilience and related indicators through a literature review and interviews with experts;
- Utilizing Interpretive Structural Modeling (ISM) to determine the interrelationships between urban physical indicators. In this qualitative-quantitative method, experts can better express their views on the interlinkages between factors (i.e., how they mutually affect each other);
- Determining the relative weight/importance of indicators with regard to the urban physical resilience using the Analytic Network Process (ANP);
- Determining the relative weight/importance of characteristics with regard to the urban physical resilience using the Analytical Hierarchy Process (AHP);
- Presenting characteristics and indicators in an overall evaluation framework; and
- Implementing the proposed framework in a district in Kerman using GIS software at the last stage.
The opinions of 15 experts were used in this study. Additionally, the ISM method was applied because it is a well-established methodology used to study complex systems and identify relationships between different elements of a system. This technique analyzes the relationship between factors at different levels [52]. Then, the results of the ISM analysis form the input model for the next steps of the proposed approach.
3.1. Interpretive Structural Model (ISM)
ISM is a methodology for understanding the relationships between the components of a complex system. It is used to structure and configure the relationships between the elements of a system and establish the order between them. As a structural analysis method, ISM is based on an interpretive paradigm. It can be used to find out how different underpinning variables of a complex and multidimensional phenomenon are interrelated and to examine the effects of each variable on other variables [53]. Variables may have several types of relationships, including definitive, comparative, temporal, spatial, and mathematical. This method, which is a subset of the Multi-Criteria techniques, seeks to clarify these relationships through experts’ opinions and based on graph theory [52]. The steps of this method are described below.
Step 1. Structural Self-Interaction Matrix (SSIM)
A square matrix with the dimensions of the number of indicators is first formed and provided to the experts. They are supposed to indicate the paired relationships of the indicators, using symbols in the matrix according to the type of relationship between them. These symbols and their meanings are given below.
V: When element i affects element j, but element j does not affect element i.
A: When element i does not affect element j, but element j affects element i.
X: When both elements affect each other.
O: When the two elements do not affect each other.
Different management techniques such as Brainstorming and Nominal Group are suggested to determine the type of relationship.
Step 2. Initial Reachability Matrix (IRM)
The Initial Reachability Matrix is obtained using the Structural Self-Interaction Matrix and by substituting the symbols with zeros and one. The rules to substitute zero and one in the SSIM matrix are as follows, assuming that Ꞩ(i, j) equals the component (i, j) of the SSIM Matrix while (i, j) equals the component (i, j) of the Reachability Matrix:
If Ꞩ(i, j) = V, then (i, j) = 1 and (i, j) = 0
If Ꞩ(i, j) = A, then (i, j) = 0 and (i, j) = 1
If Ꞩ(i, j) = X, then (i, j) = 1 and (i, j) = 1
If Ꞩ(i, j) = O, then (i, j) = 0 and (i, j) = 0
Step 3. Final Reachability Matrix (FRM)
The final reachability matrix is obtained by checking for the consistency of the initial reachability matrix, using transitivity and Euler’s theorem according to Equation (1):
The exponentiation should be according to the Boolean rule.
Step 4. Determining the level and priority of indicators
Two sets of Reachability Set and Antecedent Set are determined in this step, using the final reachability matrix as follows:
The Reachability Set for each variable contains the variables that the element affects, plus the element itself. Therefore, the members of this set are variables equal to 1 in the row corresponding to variable .
The Antecedent Set for each variable contains the variables that affect the element , plus the element itself. Therefore, the members of this set are variables equal to 1 in the column corresponding to variable .
After determining these two sets, the Intersection Set, which is the set of all variables of both sets, must be determined. In the next step, this information can be used to identify the importance level of variables. Accordingly, the variable whose Reachability Set and Intersection Set are equal will be at the highest level. Then, this variable is removed from the table, and the following table is formed with the other variables. This table determines the second level variables. This operation continues until the level of all variables is determined. Partitioning of indicators to different levels and determining their level helps to clarify the role of each indicator and their interactions.
Step 5. Model Evaluation and development of the digraph of Interpretive Structure Model
At this step, the relationships between the variables at different levels that are extracted from the final reachability matrix and the previous step are evaluated through a panel of experts. In this way, they are asked to rate the relationship obtained on an impact scale from one to five, in order from minimum to maximum.
3.2. ANP Method
The ANP method is one of the Multi-Criteria Decision-Making methods (MCDM) and a generalization of the AHP method. In fact, criteria and sub-criteria are interdependent in the ANP method, while the AHP method does not support these dependencies [54,55,56,57]. In problems with criteria or sub-criteria internally related, the problem is not hierarchical but rather has a network state. In this case, the problem is solved through the ANP method [58]. The analytic network process provides a comprehensive and powerful method to make accurate decisions using each decision-maker’s empirical information or personal judgments. In ANP, factors and indicators form a network of criteria and sub-criteria are grouped in clusters [59]. Given the dependencies between the clusters and sub-criteria, it is important to determine the relationships between different components of the system. In this case, one positive point of ISM is identifying these relationships [18,60]. The paired comparison matrices and the weights of the criteria are obtained after structuring the ANP and determining the relationships between the elements. In the following, the steps of this method are described.
Step 1. Construction of Model and Network Diagram
In ANP, elements and indicators are a network of criteria and sub-criteria that are grouped together in the clusters. Because these criteria and sub-criteria are related to each other, an important step in this method is to determine the relationships between the various criteria and sub-criteria of the system. These relationships can be identified through methods such as ISM.
Step 2. Paired Comparison Matrices and Estimation of Relative Importance
The members of each cluster are compared pairwise based on their importance against the control criteria. Moreover, it is necessary to perform paired comparisons of the interdependencies among the members of each cluster. Saaty suggested importance values in paired comparisons [61]. Experts apply their opinions in paired comparison matrices.
This study has used the group ANP model, which means that more than one decision maker is involved. In this case, the response matrices are combined, and the ANP model is implemented based on the combined matrix. Before combining, the consistency ratio should be acceptable (<0.1) for each paired comparison matrix provided by each expert. As a result, the combined paired comparison matrix will also have a consistency ratio of <0.1. However, if the consistency ratio exceeds 0.1, the experts are asked to answer the questions again and more carefully. High levels of inconsistency show contradictions in the experts’ opinions with the previous ones.
Equation (2) is used to calculate the consistency ratio.
where CR is the consistency ratio; CI is the consistency index; RI is the random index; is the largest Eigenvalue of the matrix; and n is the number of factors compared in the matrix (matrix dimensions).
Paired comparison matrices were then merged by the geometric mean method. Next, the weight vectors are calculated using the Eigenvector method proposed by Saaty (Equation (3)):
where is the largest Eigenvalue of the matrix, A indicates the paired comparison matrix, and W is the normalized weight vector, which
Step 3. Unweighted and Weighted Super Matrices
In the third step of the ANP model, the weights obtained from the previous step are all placed in a matrix based on the problem structure, known as the unweighted supermatrix. The supermatrix can limit the coefficients for calculating all the priorities and the cumulative effect of each component on the other components with which it interacts. The supermatrix is used to represent the effects of clusters or the elements within clusters on each other. The columns of the unweighted supermatrix are composed of several special vectors, and the sum of each vector is equal to one. Therefore, the sum of each primary or unweighted supermatrix column can be more than one (corresponding to the specific vectors in each column). Each matrix column must be standardized to factor out the column elements in proportion to their relative weights, the sum of which should be one. As a result, a new matrix is obtained, in which the sum of each column is equal to one. This matrix is called the weighted supermatrix.
Step 4. Limit Supermatrix
In the next step, the supermatrix is weighted until the matrix elements converge, and its linear values are equal. According to Equation (4):
3.3. AHP Method
AHP is a Decision-Making method that unpacks complex decision problems in a hierarchical manner. For this, it relies on the judgements made by a group of experts. The AHP method is a specific case of networking technique in which the criteria are independent, and paired comparisons determine the weights of the criteria without considering their internal relationships. In the following, the steps of this method are described.
Step 1. Construction of the Hierarchical Diagram
According to the criteria of the research, a hierarchical structure is formed.
Step 2. Creation of Paired Comparison Matrices and Calculation of the Consistency Ratio
In this step, the criteria are compared by experts in pairs and paired comparison matrices are formed. Additionally, the consistency ratio is checked for each paired comparison matrix using Equation (2).
Step 3. Calculation of the weight of the criteria
4. Results
4.1. Characteristics of Urban Physical Resilience and Urban Physical Indicators
The conceptual framework of this study (Figure 2) allows the description and analysis of urban physical resilience using several key characteristics that are connected and related to the complex system of the urban physical form [65]. In complex systems, the higher or lower levels of resilience are achieved by coordination and connectivity between all elements that make up the system and connect to other systems. These elements form the characteristics of urban physical resilience. The characteristics agreed upon by other researchers and frequently mentioned in the literature are diversity, connectivity, redundancy, robustness, modularity, adaptability, multifunctionality, and efficiency [29,42,46,66,67,68,69,70,71,72,73,74,75,76,77].
Here, a brief and adapted definition is provided for each of these characteristics.
Diversity: means the inclusion of different forms and functions of physical components. For example, diversity in urban land use, communication networks, and open and green spaces can help the urban physical structure to deal with earthquake hazards.
Connectivity: refers to the ease of access to different urban spaces and the appropriate hierarchy between them. Connectivity is also important for urban permeability. In earthquake and post-earthquake events, proper access and connectivity are necessary to escape and provide relief services.
Redundancy: refers to the availability of various additional physical components with similar or supportive functions. Redundancy ensures that when the earthquake and its effects disrupt several urban physical components, disruptions in the whole system are minimal.
Robustness: Robustness is one of the critical characteristics of urban physical resilience. When buildings and other urban physical components are robust, the ability of the urban physical structure to withstand earthquake stresses increases significantly.
Modularity: In the urban physical system, modularity means that the individual components of the urban physical structure support each other to make up larger structures. Therefore, if the function of the individual components is lost or disrupted, the whole urban system will continue to function.
Adaptability: enables the physical system to cope with disruptions and subsequent changes more flexibly. Furthermore, the capacity to learn from experiences is a characteristic of an adaptable urban physical system.
Multi-functionality: The multi-functionality of the urban system indicates that some of the urban physical components can be used for multiple purposes. For example, open and green spaces could be used to establish temporary shelters during adverse events.
Efficiency: means that the physical elements and the urban physical structure are responsive to earthquake stresses effectively and with acceptable speed.
Objective indicators are required to make these subjective characteristics more tangible. As the use of indicators in risk management has grown considerably over the past decade, they can be used to measure and operationalize complex systems [78]. Indicators are valuable because they can make values and concepts practical and comprehensible while combining large amounts of information into a straightforward form [79].
This research first divided the complex system of the urban physical structure into several subsystems, including the built environment, the street network, and urban open and green spaces. The built environment mainly includes buildings and their arrangement next to each other, land uses and their adaptability and distribution, etc. Some buildings, such as administrative buildings, hospitals, fire stations, etc., are significant due to their role in the post-earthquake crisis response stages. These buildings must continue their operations after an earthquake [80].
The network of streets and related indicators refer to the number, width, and availability of routes that facilitate access to the affected areas. There are also indicators related to the structure and topology of the routes and their ability to transport people effectively and quickly to safe locations [38]. When the network of streets is not damaged significantly in the face of an earthquake, it can accelerate the evacuation process and provide timely relief. If street networks are not designed properly, they may fail to efficiently facilitate rescue and evacuation efforts during and after an earthquake. The width of urban networks and the robustness of the structures are significant factors in determining the potential extent of blockage of the street networks during earthquakes [81,82].
Green and open spaces are also very important in establishing a resilient city. Such spaces can provide evacuation space and temporary shelter for residents [11,40,83,84,85]. Yousuf Reja [86] emphasizes the importance of open spaces around buildings for social support and mutual assistance during crises.
Table 1 shows the indicators of urban physical resilience and related characteristics obtained by literature review and interviews with experts.
4.2. ISM Implementation and Results
This technique of structuring the problem begins with identifying the problem-related indicators. Then, the contextual relationships between the indicators are determined using the experience and theoretical background as well as practical knowledge of experts. Finally, a multi-level structural model is provided. In this study, 15 university professors and experts in the fields of crisis management, urban planning, and earthquake engineering cooperated and completed a questionnaire related to this technique. The implementation steps were as follows:
Step 1. Structural Self-Interaction Matrix (SSIM) formation
The relevant questionnaire was provided to the experts in a square matrix whose rows and columns are the same as the urban physical indicators. After collecting all the completed opinions and matrices, the final structural self-interaction matrix is obtained from the results of paired comparisons. Thus, if the majority of the expert group (N/2 + 1 votes) confirm a relationship between the two components, it is taken into account; otherwise, there is no relationship between the two components. Table 2 shows this matrix.
Step 2. Initial Reachability Matrix (IRM) formation
Initial Reachability Matrix is obtained using the Structural Self-Interaction Matrix (SSIM) and by substituting the symbols with zeros and one.
Step 3. Final Reachability Matrix (FRM) formation
The final reachability matrix is obtained by checking for the consistency of the initial reachability matrix using Equation (1).
Step 4. Partitioning and prioritization of indicators
Two sets of Reachability Set and Antecedent Set are determined in this step, using the final reachability matrix. Table 3 indicates the level partitioning of indicators in the present research.
Step 5. Model Evaluation and development of the digraph of Interpretive Structure Model
A team of 7 experts evaluated the model, using the relationships extracted from the final reachability matrix and the previous step.
Then, the final model is drawn according to the results obtained from the fourth step and the model evaluation results. If an indicator affects others, it will be at a lower level in the ISM model. However, if an indicator is significantly affected by other indicators, it will be at a higher level. In the ISM model, the effect is from bottom to top. The final model obtained in this research consists of five levels (Figure 3). This model shows the most significant relationships. Arrows and their directions show the effect of each factor on the other.
The indicators of building density (BD), robustness of building (ROB), and the slope ratio (SR) are at the lowest level. Therefore, these indicators have been determined to have the most significant impact compared to other indicators in terms of urban physical resilience against earthquakes. Granulation of parcels (GOP), aspect ratio (AR), and street width (SW) are located at the next level, with a significant effect on other indicators. The relationships obtained from this stage formed the input to establish necessary clusters to implement the ANP model and determine the weight of each indicator.
4.3. ANP Implementation
This model aims to determine the weight of each urban physical indicator in urban physical resilience. The calculations of this model were performed using Super Decision software and the MATLAB program. The implementation steps of the model are as follows:
Step 1. ANP model construction and Network Diagram
In this study, urban physical indicators are classified into three clusters. There are several related indicators inside each cluster. Internal and external relationships of these clusters are obtained from the ISM model (Figure 4)—for example, the internal relationships between built environment indicators such as Land Use Diversity (LUD) and Location status of Hazardous Uses (LHU), and relationships between indicators of clusters, such as Granulation of Parcels (GOP) and Connectivity (CO), and so on.
Step 2. Paired Comparison Matrices formation
In this step, paired comparisons between clusters as well as the elements of each cluster were performed by each expert. The consistency ratio was checked for each paired comparison matrix and the combined paired comparison matrix using Equation (2). Then, the weight vectors were calculated using Equation (3).
Step 3. Unweighted and Weighted Supersmatrices formation
In this step, using the weights obtained from the previous step, the unweighted supermatrix was formed. Then, by standardizing the columns of the unweighted supermatrix, the weighted supermatrix was developed (Table 4).
Step 4. Limit Supermatrix formation
In the last step, using Equation (4), the weighted supermatrix elements were converged and the weight of indicators was determined. Figure 5 indicates the weight of indicators in this research.
As shown in Figure 5, Robustness of Building (ROB) is the most important physical indicator in determining urban physical resilience. Buildings are basic urban components and in the case of damage or collapse during an earthquake, they can disrupt the overall function of the city due to high human casualties, blockage of urban networks, etc. The results of the ANP model also show the importance of this indicator. The next indicator is Building Density (BD). This is unsurprising as high density could increase the rate of casualties and damage during an earthquake and make it difficult to provide relief. Aspect Ratio (AR) is the next important indicator. As the degree of confinement increases (higher ratio of the building height to the width of the urban network), the probability of urban network blockage during an earthquake increases. Accordingly, the collapse of the buildings and blockage of the streets can hamper the evacuation process during an earthquake and post-earthquake evacuation and rescue operations.
Among the indicators of physical resilience, the street network and related indicators are also important. The street network contributes to reducing urban vulnerability and increasing resilience against earthquakes. The street network provides the necessary platform for rescue operations while it also increases the opportunity to escape dangerous situations and facilitates relief services to injured people. The most important indicator is Street Width (SW). The wider the network of streets is, the lower the possibility of urban network blockage and the higher the probability of escape and relief. An integrated and connected street network, presented as indicators of Accessibility (A), Centrality (CE), and Connectivity (CO) is another important factor in increasing urban physical resilience. Different Urban Network Type (UNT) indicators, including connectivity, centrality, and length of streets, can play a key role in urban physical resilience. These indicators are very effective in providing access to open spaces suitable for evacuation, access to safe places, and accelerating debris removal and clearing operations.
Granulation of parcels (GOP) has a high weight among the urban physical indicators. Segmentation of lands in small areas results in smaller urban spaces, including open spaces, and in practice, reduces the usefulness of open space for evacuation and sheltering.
Proper distribution and suitability of land use (DOU and LUS), which is determined based on the compatibility of the use of each building and urban space with adjacent buildings, as indicators of high importance, provide a good ground for the elimination of high risk land uses from residential land uses and medical centers. As a result, the urban structure becomes more robust and resilient in the face of earthquakes. In other words, the existence of completely incompatible uses (e.g., industrial and incendiary uses, explosive installations) can increase vulnerability, while uses such as vacant lots, green spaces, farmland, parks, and parking lots are fully compatible and help provide relief and reduce damage.
Another important factor in the post-earthquake phase is access to emergency service centers (AEC) such as medical centers and fire stations. Increasing the distance from settlements to these centers reduces the speed of relief and increases the magnitude of the danger.
Green and open urban spaces and related indicators are also significant in urban physical resilience. For example, in relation to the Size of Open and Green Spaces (SOGS), large urban parks can be used as relief bases for active forces, as well as large settlements and camps, if needed. Medium and small parks, in addition to the use of rescue workers, can be used as evacuation sites in the rescue phase, and for temporary accommodation. For example, Allan and Bryant [39] show how these spaces have been used to set up temporary shelters in the vicinity of affected neighborhoods and buildings in Concepcion. This can lead to the formation of small neighborhood communities, in which residents can receive social support in the aftermath of an earthquake. As a result, these communities can speed up the recovery process. On the other hand, residents are close to their homes and neighborhoods and can protect their property as well.
The location status of hazardous land use types such as gas stations (LHU) plays an important role too. Serious issues and chained effect may arise if the compatibility and safety standards are not observed.
Slope Ratio (SR) and the construction on unconventional slopes is also an important factor in reducing urban resilience. This is because the faults and cracks could lead to the destruction of the urban built environment and the urban networks, thereby increasing urban vulnerability.
4.4. Applying the Analytic Hierarchy Process (AHP)
The analytic hierarchy process was applied in this study to weigh the characteristics that affect and define urban physical resilience, based on the experts’ opinions. For this purpose, the same group of experts in the ANP model provided their opinions [61] and suggested importance values in paired comparisons (Table 5). According to Table 5, experts apply their opinions in paired comparison matrices.
After developing paired comparison matrices and calculating the consistency ratio, the weight of each characteristic is determined. Table 6 shows the relative importance of characteristics relative to each other based on the experts’ opinions.
As shown in Table 6, Robustness has the highest importance and impact on urban physical resilience against earthquakes. Other important characteristics are Adaptability, Redundancy, Modularity, Connectivity, Multifunctionality, Efficiency, and Diversity, respectively.
Adaptability is ranked second in terms of impact on urban physical resilience. An urban physical system with significant adaptability and flexibility shows the highest resilience in the face of many disruptions caused by earthquakes. Planned spatial arrangements, redundant construction capacities within the city, and flexible infrastructures are among the most important physical examples of an adaptable physical system. Redundancy provides sufficient spatial and physical elements to minimze the devastating consequences of the crisis and accelerate reconstruction after an earthquake. Therefore, it is among the most influential characteristics to increase urban physical resilience. Diversity has the lowest weight among different characteristics of urban physical resilience. This may be because other characteristics such as the multifunctionality of the urban system can partially affect diversity.
4.5. Development of the Proposed Framework and the Final Index for Urban Physical Resilience Evaluation
As stated, the purpose of this research is to evaluate urban physical resilience using a comprehensive framework including the characteristics of urban physical resilience and the urban form indicators. The subjective characteristics should become objective and applicable through urban physical indicators. Figure 6 shows the urban physical resilience characteristics and the indicators associated with each (extracted through Table 1). This is the main structure of the proposed framework in this research.
To determine the final index for urban physical resilience evaluation (according to the final weight of the indicators (Figure 5) and the final weight of characteristics (Table 6)), first, the weight of each of the indicators is normalized. In the next step, the weights of all indicators affecting the related characteristics are aggregated and finally multiplied by the weight of associated characteristics (Equation (5)).
where WOAC is the weight of associated characteristics; NWOI is the normalized weight of indicators; and n is the indicators affecting.
Figure 7 shows the absolute weights of characteristics. These characteristics and their total weights provide the final index of urban physical resilience in the framework introduced in this research.
Adaptability is the most significant characteristic for enhancing urban physical resilience. Adaptability and flexibility are among the fundamental components of the concept of physical resilience. This result confirms the accuracy of MCDM modeling. Modularity and Robustness are other important characteristics. A fundamental principle of urban physical resilience is to arrange physical elements so that the whole system can retain its function and robustness even with the disruption of each element.
4.6. Applying the Framework to the Case Study and Mapping the Physical Resilience
First, maps of 20 indicators studied in this research were prepared. Some of these maps are shown in Figure 8. The ArcGIS software was used to prepare the maps.
Figure 9 illustrates the final physical resilience map developed based on the proposed framework for resilience evaluation. To prepare this map, the maps of physical indicators were weighted and then overlayed in the ArcGIS software. This was conducted using the Spatial Analyst and Weighted Overlay function, determining physical resilience for each spatial unit. A comparative assessment of physical resilience in the study area is necessary for resilience classification, which is performed using the standard deviation from the mean and z-score, for classifying and determining the spatial pattern of physical resilience in the study area. Z-scores indicate whether a particular score is equal to, below, or above the mean. Hence, the physical resilience classification is as follows:
- Very low resilience (<−1.5 standard deviation)
- Low resilience (from −1.5 to −0.5 standard deviation)
- Medium resilience (from −0.5 to 0.5 standard deviation)
- High resilience (from 0.5 to 1.5 standard deviation), and
- Very high resilience (>1.5 standard deviation)
As Figure 9 shows, physical resilience in the study area is classified into 5 classes. About 60%, 25%, and 15% of the study area are in very low and low, medium, and high and very high resilience classes, respectively. So, large parts of the study area are categorized as having very low and low resilience. These parts are scattered almost all over the study area (except in parts of the northeast). The study area (district 1) is the oldest district of Kerman, which has an old, worn-out, and organic texture with an irregular spatial structure. In these parts, the robustness of buildings is very low. Since robustness of buildings is one of the most important indicators, it has a significant impact on physical resilience in these parts. The high aspect ratio is another influential indicator in reducing physical resilience in these parts, which is caused by the old and organic texture and narrow urban networks. In large parts of the study area (about 70%), the area of the parcels is less than 200 square meters. As mentioned before, this decreases physical resilience. The diversity of land use is also very low in more than 80% of the study area, further reducing physical resilience. The street network also plays a vital role in the urban physical resilience to earthquakes. To evaluate the role of the street network in this study, 6 indicators were used. The values of the street network indicators are low in these parts. The low length and width of the streets, along with improper levels of connectivity and centrality, make communication and access difficult in these parts. On the other hand, a lack of order and hierarchy in the urban street network could also affect resilience. Access to urban open and green spaces that provide shelters during, can be used to organize rescue and relief operations after an earthquake, and function as places to accommodate the injured is not uniform in the case study area. In these parts of the study area with an old and worn-out texture, the level of access is much lower than the other parts. Additionally, the compact texture has led to a lack of open and green urban spaces and their inappropriate distribution across the study area.
As mentioned, some parts of the study area have high and very high physical resilience. These are mainly scattered in the northeast and south. There have been recent reconstructions, renovations, and new urban plans and developments in these parts. The buildings have good robustness due to these renovations and reconstructions, and this has significantly increased physical resilience. The appropriate width of the urban networks in these parts has reduced the aspect ratio as an important indicator of resilience. Furthermore, the implementation of new urban plans has led to more diverse and suitable land uses in these parts compared to other parts of the study area. Access to emergency service centers is considered an important indicator in providing relief. Increasing the distance to fire stations reduces the speed of emergency service provision. Almost all parts of the study area are in good condition in terms of distance to fire stations and hospitals. In addition, except for the worn-out parts, the study area is in good condition in terms of the length and width of street networks, access, and other indicators of street networks. These items have increased the resilience of the study area.
In general, in the study area, factors such as the age of buildings, high density of fine-grained residential parcels, low width of streets and lack of regular street networks, lack of open and green spaces, and unsuitable and improper distribution of land have led to an improper level of physical resilience.
5. Discussion
This study investigated urban physical resilience, which is a relatively underexplored dimension of urban resilience. We identified indicators that play a significant role in the pattern of an urban structure and its functioning at the phases of pre-earthquake preparedness, absorption immediately after the earthquake, and self-organization and adaptation in longer periods post-earthquake. This study used a hybrid ISM–ANP model to determine the importance and weight of influencing indicators on urban physical resilience.
As major components of the built environment, buildings contribute significantly to determining physical resilience because they can disturb the overall urban functioning in the case of damage or collapse. However, if buildings are robust enough, urban physical resilience will be enhanced. Accordingly, damage could be minimized, and more efficient and robust urban reconstruction would be possible in the recovery phase. In the study area, many buildings have low robustness, which undermines physical resilience.
Furthermore, the high building density in the built environment increases the rate of causalities and damage during an earthquake while making disaster relief, which is among the main post-earthquake tasks, more difficult. Sharifi et al. [105] have examined this indicator in different urban textures, concluding that high building density can reduce urban physical resilience even in areas that are appropriately planned. However, adequate robustness of buildings, particularly those adjacent to the street network, could improve resilience even in high density areas.
The Aspect Ratio is another important indicator of urban physical resilience. A high aspect ratio means rescue and evacuation operations could be challenging because the buildings may collapse, resulting in the blockage of the urban networks. In such conditions, post-earthquake reconstruction operations are slow. This indicator is not in good condition in the study area due to the dominance of narrow streets and the old and organic texture.
Granulation of Parcels (GOP) is another important indicator in urban built environments. Previous studies have reported different and sometimes contradictory results concerning the effect of this indicator on urban physical resilience to earthquakes. Some studies generally argue that fine-grained parcels are more effective in urban resilience to earthquakes [32,105,106]. In general, smaller parcels provide better connectivity and accessibility, allowing for a wider range of uses and activities that help urban physical resilience. Other researchers believe that small parcels would make it challenging to provide adequate open spaces and decrease the practical functioning of open spaces for evacuation, sheltering, etc. Therefore, smaller parcels could lead to greater vulnerability to earthquakes [88,97]. In this study, according to the survey results, smaller parcels increase vulnerability to earthquakes and reduce urban physical resilience.
Land use and related indicators such as diversity, suitability, and distribution affect resilience directly and indirectly. Land use mix allows the provision of various facilities and services in the vicinity of buildings, leading to faster responses to adverse events such as earthquakes and increasing preparedness and absorption. On the other hand, research shows that diversity and mixed land use strengthen social interactions and social capital in neighborhoods, which can be effective in the enhancement of urban resilience [95,107]. Proper distribution of land use helps to provide adequate and fair access to vital land use during a crisis. Moreover, proper distribution of land use can prevent the possibility of post-earthquake cascading events, including fires.
Special attention should also be paid to some emergency service centers, such as health centers and fire stations, due to their important role in providing relief assistance in the event of an earthquake. The buildings associated with these centers need to be robust enough to continue providing services after an earthquake. An adequate and fair distance from health centers and fire stations accelerates rescue and relief services, increasing absorption and adaptation capacities of urban structures, while indirectly promoting recovery by assisting potential victims [108]. Inadequate access to fire stations severely decreases urban resilience due to reduced relief rates. The gas station is another important use, which can play a key role in reducing or increasing risks during an earthquake. If the suitability and safety standards are not considered in the establishment and allocation of this land use, it can immediately lead to irreparable damage in the nearby land use at the time of the crisis, while also putting the gas station itself at risk. It can also create cascading risks.
The street networks are also important elements of urban structures, which play a key role in increasing resilience to earthquakes. We considered indicators related to the design, orientation, and topology to investigate the role of street networks. The most important of these indicators is Street Width. On wider street networks, if adjacent buildings are destroyed, the networks are less likely to be blocked. This is very helpful both in the immediate aftermath of an earthquake, which requires escape and evacuation, and in the later phases. Moreover, it is easier to make geometric and infrastructural changes in wider streets. Additionally, a combination of different modes of transportation such as special bus and bicycle routes, sidewalks, etc., would be possible in wider streets. The integrated and connected urban networks are presented as indicators of Accessibility and Connectivity. Accessibility leads to greater permeability of the network, which greatly aids the recovery and self-organization phases of resilience. Centrality indicates the relative importance of nodes in the urban street network. If a node with high centrality is blocked, significant disruptions in access to the affected areas may occur. Such a situation is exacerbated when the values of the centrality have improper distribution. One such case of inappropriate distribution is when a node with high centrality is surrounded by nodes with low centrality. Different types of street network indicators, including connectivity, centrality, and length can play a key role in both the pre-earthquake and post-earthquake stages [7].
Size, distribution, and access to urban open and green spaces are other important indicators in urban physical resilience. Green and open spaces can meet the following objectives in the case of earthquakes: 1. a place for timely evacuation; 2. temporary shelter for residents until their safe return to home; 3. accommodation as a camp for a longer time; 4. adjustment of the density and establishment of safer environments; 5. an essential resource to strengthen the recovery phase, such as a space for improvement, restoration, and reconstruction of buildings; and 6. a place for the establishment of rescue teams and the provision of relief services. Diversity in the size and distribution of open and green spaces is important because it provides a range of options and opportunities for rescue and restoration.
In general, the various urban physical indicators and the complexities of their relationships indicated that the measurement and evaluation of urban physical resilience would require the development of a comprehensive indicator framework. In the absence of such a framework, there will be confusion about the application, implementation, and evaluation of the concept of urban physical resilience. One of the main objectives of this study was to achieve such a framework. In other words, it is possible to examine a complete list of urban physical resilience indicators in such a framework while also expressing the relationships among them and their impact on urban physical resilience. On the other hand, a link has been established between the urban physical resilience characteristics and indicators in this framework, which has not been addressed in previous studies. One of the main advantages of this framework is the possibility of connecting the resilience characteristics of the urban physical resilience, which are subjective and intangible, to the objective and tangible indicators. Taking these characteristics into account led to a better understanding of urban physical resilience. Thus, the results of this study can be used for resilience-based urban and spatial planning to eliminate the gap between the theoretical and practical approaches to physical resilience. However, few cities worldwide are currently implementing practical measures and strategies to improve physical resilience [28,109]. In other words, there is a large gap between the theory of urban physical resilience and its implementation.
A limitation of this study that needs to be mentioned is that the physical resilience framework was only applied to one urban district. More empirical work on larger scales, preferably multiple cities, is needed to understand better the impacts of different indicators and characteristics on urban earthquake resilience. Another limitation of this study is that in measuring the robustness of buildings, the building age instead of the quality construction materials was considered. This is due to the lack of data in the study area. In order to achieve more accurate results, it is better to also consider the quality of the construction materials.
6. Conclusions
This study provided further insights into the characteristics and indicators of urban physical resilience and their interactions. The inclusion of these characteristics and indicators in an evaluation framework was the ultimate objective of this study. To achieve this study’s goal, the ANP model’s structure was formed considering the relationships between the physical indicators obtained through the ISM model. Using the ISM model and its combination with the ANP model in the complex urban physical system can provide a more accurate view of the relationship between urban physical indicators. The weight and importance of each indicator were determined using the ANP model. Moreover, the importance of characteristics in assessing the physical dimensions of urban resilience was determined using the AHP model. The combination of these weights ultimately determined the absolute weight of the resilience characteristics as the main elements of physical resilience.
According to the results, robustness of buildings, building density, and aspect ratio have the highest impact on increasing urban physical resilience. The indicators of density of the built environment around open spaces, the size of open and green spaces, and slope ratio have the lowest impact on increasing urban physical resilience. Given the importance of the urban physical indicators, the robustness of new urban infrastructure and reinforcement of the existing structures and buildings and urban street networks should be at the center of all measures to increase urban physical resilience against earthquakes. Building density, aspect ratio, and street width are the next three important indicators. Ensuring optimal density levels, particularly in areas with narrow streets, is essential for improving physical resilience. Furthermore, extreme density should be avoided when the streets are narrow and could lead to the increased enclosure of buildings. Additionally, connecting streets with different widths through a well-designed hierarchy can be an effective solution to minimize the possibility of street closures during earthquakes. The total area of disaggregated parcels is one of the most important indicators with a high weight. In terms of the land use, small parcels could lead to higher vulnerability to earthquakes.
Based on the weight and importance of the indicators, some important measures that could be taken are as follows:
- Locating medical uses and crisis management support centers along the main and wide streets to speed up rescue operations and services;
- Allocating more space to open and green spaces in neighborhoods and dense areas;
- Removing/relocating buildings in the vicinity of gas and electricity facilities and stations;
- Ensuring adequate provision of open spaces around these land uses to prevent fire spread during earthquakes; and
- Taking measures to ensure that incompatible land uses are not situated next to each other.
Results showed that the major characteristics that determine urban physical resilience are Adaptability, Modularity, Robustness, and Efficiency. In other words, a city that has an adaptable and flexible physical structure and is capable of accommodating changes is able to maintain its overall functionality during adverse events such as earthquakes and can utilize existing resources for better absorption of shocks and rapid recovery to pre-disaster conditions.
The proposed evaluation framework includes the characteristics that make the urban physical resilience more understandable. Additionally, it facilitates a more tangible understanding of the urban physical indicators associated with these characteristics. It can be utilized to examine and improve cities’ urban physical resilience.
In general, the framework for evaluating urban physical resilience and the preparation of spatial maps for assessing urban physical resilience can be a practical guide for determining the strengths and weaknesses of a city against earthquakes. These results can help planners in their spatial planning and land use planning efforts. Moreover, authorities can use the results to develop plans and policies for disaster risk reduction. They can, for instance, use the framework introduced in this study to identify the vulnerable areas that need to be prioritized during resilience-building efforts.
Author Contributions
Conceptualization, S.M.P., M.T. and A.S.; methodology, S.M.P., M.T. and A.S.; software, S.M.P.; validation, S.M.P.; formal analysis, S.M.P.; data curation, S.M.P.; writing—original draft preparation, S.M.P.; writing—review and editing, M.T. and A.S.; visualization, S.M.P.; supervision, M.T. and A.S. All authors have read and agreed to the published version of the manuscript.
Funding
This research received no external funding.
Institutional Review Board Statement
Not applicable.
Informed Consent Statement
Not applicable.
Data Availability Statement
Not applicable.
Conflicts of Interest
The authors declare no conflict of interest.
References
- UNISDR. Global Assessment Report on Disaster Risk Reduction 2019; United Nations International Strategy for Disaster Reduction: Geneva, Switzerland, 2019. [Google Scholar]
- Wallemacq, P. Economic Losses, Poverty & Disasters: 1998–2017; Centre for Research on the Epidemiology of Disasters, CRED: Brussels, Belgium, 2018. [Google Scholar]
- Bozza, A.; Asprone, D.; Manfredi, G. Developing an integrated framework to quantify resilience of urban systems against disasters. Nat. Hazards 2015, 78, 1729–1748. [Google Scholar] [CrossRef]
- Heilig, G.K. World Urbanization Prospects: The 2011 Revision; United Nations, Department of Economic and Social Affairs (DESA), Population Division, Population Estimates and Projections Section: New York, NY, USA, 2012; Volume 14, p. 555. [Google Scholar]
- Chen, T.-L.; Lin, Z.-H. Impact of land use types on the spatial heterogeneity of extreme heat environments in a metropolitan area. Sustain. Cities Soc. 2021, 72, 103005. [Google Scholar] [CrossRef]
- Shao, Z.; Wu, W.; Li, D. Spatio-temporal-spectral observation model for urban remote sensing. Geo-Spat. Inf. Sci. 2021, 24, 372–386. [Google Scholar] [CrossRef]
- Sharifi, A. Resilient urban forms: A review of literature on streets and street networks. Build. Environ. 2019, 147, 171–187. [Google Scholar] [CrossRef]
- Rus, K.; Kilar, V.; Koren, D. Resilience assessment of complex urban systems to natural disasters: A new literature review. Int. J. Disaster Risk Reduct. 2018, 31, 311–330. [Google Scholar] [CrossRef]
- Li, G.; Zhao, J.; Murray, V.; Song, C.; Zhang, L. Gap analysis on open data interconnectivity for disaster risk research. Geo-Spat. Inf. Sci. 2019, 22, 45–58. [Google Scholar] [CrossRef] [Green Version]
- Ghasemzadeh, B.; Sharifi, A. Modeling and Analysis of Barriers to Climate Change Adaptation in Tehran. Climate 2020, 8, 104. [Google Scholar] [CrossRef]
- Koren, D.; Kilar, V.; Rus, K. A conceptual framework for the seismic resilience assessment of complex urban systems. In Proceedings of the 16th European Conference on Earthquake Engineering, Thessaloniki, Greece, 18–21 June 2018. [Google Scholar]
- Freddi, F.; Galasso, C.; Cremen, G.; Dall’Asta, A.; Di Sarno, L.; Giaralis, A.; Gutiérrez-Urzúa, F.; Málaga-Chuquitaype, C.; Mitoulis, S.A.; Petrone, C. INNOVATIONS in earthquake risk reduction for resilience: RECENT advances and challenges. Int. J. Disaster Risk Reduct. 2021, 60, 102267. [Google Scholar] [CrossRef]
- Guha-Sapir, D.; Vos, F. Earthquakes, an epidemiological perspective on patterns and trends. In Human Casualties in Earthquakes; Springer: Berlin/Heidelberg, Germany, 2011; pp. 13–24. [Google Scholar]
- Kamranzad, F.; Memarian, H.; Zare, M. Earthquake risk assessment for Tehran, Iran. ISPRS Int. J. Geo-Inf. 2020, 9, 430. [Google Scholar] [CrossRef]
- Twigg, J. Disaster Risk Reduction; Overseas Development Institute, Humanitarian Policy Group London: London, UK, 2015. [Google Scholar]
- Wu, X.; Zhang, J.; Geng, X.; Wang, T.; Wang, K.; Liu, S. Increasing green infrastructure-based ecological resilience in urban systems: A perspective from locating ecological and disturbance sources in a resource-based city. Sustain. Cities Soc. 2020, 61, 102354. [Google Scholar] [CrossRef]
- Huang, W.; Ling, M. System resilience assessment method of urban lifeline system for GIS. Comput. Environ. Urban Syst. 2018, 71, 67–80. [Google Scholar] [CrossRef]
- Xu, W.; Zhong, M.; Hong, Y.; Lin, K. Enhancing community resilience to urban floods with a network structuring model. Saf. Sci. 2020, 127, 104699. [Google Scholar] [CrossRef]
- Sajjad, M.; Chan, J.C.; Chopra, S.S. Rethinking disaster resilience in high-density cities: Towards an urban resilience knowledge system. Sustain. Cities Soc. 2021, 69, 102850. [Google Scholar] [CrossRef]
- Moghadas, M.; Asadzadeh, A.; Vafeidis, A.; Fekete, A.; Kötter, T. A multi-criteria approach for assessing urban flood resilience in Tehran, Iran. Int. J. Disaster Risk Reduct. 2019, 35, 101069. [Google Scholar] [CrossRef]
- Cavallaro, M.; Asprone, D.; Latora, V.; Manfredi, G.; Nicosia, V. Assessment of urban ecosystem resilience through hybrid social–physical complex networks. Comput.-Aided Civ. Infrastruct. Eng. 2014, 29, 608–625. [Google Scholar] [CrossRef]
- Cerè, G.; Rezgui, Y.; Zhao, W. Urban-scale framework for assessing the resilience of buildings informed by a delphi expert consultation. Int. J. Disaster Risk Reduct. 2019, 36, 101079. [Google Scholar] [CrossRef]
- Burton, C.G. A validation of metrics for community resilience to natural hazards and disasters using the recovery from Hurricane Katrina as a case study. Ann. Assoc. Am. Geogr. 2015, 105, 67–86. [Google Scholar] [CrossRef]
- Sellberg, M.M.; Wilkinson, C.; Peterson, G.D. Resilience assessment: A useful approach to navigate urban sustainability challenges. Ecol. Soc. 2015, 20, 43. [Google Scholar] [CrossRef]
- Yang, Y.; Ng, S.T.; Zhou, S.; Xu, F.J.; Li, H. A physics-based framework for analyzing the resilience of interdependent civil infrastructure systems: A climatic extreme event case in Hong Kong. Sustain. Cities Soc. 2019, 47, 101485. [Google Scholar] [CrossRef]
- Bruneau, M.; Chang, S.E.; Eguchi, R.T.; Lee, G.C.; O’Rourke, T.D.; Reinhorn, A.M.; Shinozuka, M.; Tierney, K.; Wallace, W.A.; Von Winterfeldt, D. A framework to quantitatively assess and enhance the seismic resilience of communities. Earthq. Spectra 2003, 19, 733–752. [Google Scholar] [CrossRef] [Green Version]
- Aydin, N.Y.; Duzgun, H.S.; Wenzel, F.; Heinimann, H.R. Integration of stress testing with graph theory to assess the resilience of urban road networks under seismic hazards. Nat. Hazards 2018, 91, 37–68. [Google Scholar] [CrossRef]
- Suárez, M.; Gómez-Baggethun, E.; Benayas, J.; Tilbury, D. Towards an urban resilience Index: A case study in 50 Spanish cities. Sustainability 2016, 8, 774. [Google Scholar] [CrossRef] [Green Version]
- Feliciotti, A.; Romice, O.; Porta, S. Design for change: Five proxies for resilience in the urban form. Open House Int. 2016, 41, 23–30. [Google Scholar] [CrossRef]
- Meerow, S.; Newell, J.P.; Stults, M. Defining urban resilience: A review. Landsc. Urban Plan. 2016, 147, 38–49. [Google Scholar] [CrossRef]
- Sharifi, A.; Yamagata, Y. Principles and criteria for assessing urban energy resilience: A literature review. Renew. Sustain. Energy Rev. 2016, 60, 1654–1677. [Google Scholar] [CrossRef] [Green Version]
- Sharifi, A. Resilient urban forms: A macro-scale analysis. Cities 2019, 85, 1–14. [Google Scholar] [CrossRef]
- Karatani, Y.; Hayashi, H. Verification of recovery process under the great Hanshin-Awaji earthquake disaster based on the recovery index. In Proceedings of the 13th World Conference on Earhquake Engineering, Vancouver, BC, Canada, 1–6 August 2004. [Google Scholar]
- Beniya, S. The Evaluation of the Status of Disaster Areas by using Recovery Indicators—In the case of the Great Hanshin-Awaji Earthquake. In Proceedings of the 2nd International Conference on Urban Disaster Reduction, Taipei, Taiwan, 27–29 November 2007. [Google Scholar]
- Chang, S.E. Urban disaster recovery: A measurement framework and its application to the 1995 Kobe earthquake. Disasters 2010, 34, 303–327. [Google Scholar] [CrossRef]
- Jones, C.A.; Dempsey, N.; Brown, C.; Porta, S.; Jenks, M.; Bramley, G. Elements of urban form. In Dimensions of the Sustainable City; Springer: Berlin/Heidelberg, Germany, 2010; pp. 21–51. [Google Scholar]
- Allan, P.; Bryant, M. The critical role of open space in earthquake recovery: A case study. In Proceedings of the 2010 NZSEE ConferenceNueva Zelandia, Wellington, New Zealand, 26–28 March 2010; pp. 1–10. [Google Scholar]
- Chapagain, N.K. Reflections on the Built Environment and Associated Practices; Master of Science in Energy for Sustainable Social Development (MSESSD) Programme: Kirtipur, Nepal, 2016; Volume 2. [Google Scholar]
- Allan, P.; Bryant, M.; Wirsching, C.; Garcia, D.; Teresa Rodriguez, M. The influence of urban morphology on the resilience of cities following an earthquake. J. Urban Des. 2013, 18, 242–262. [Google Scholar] [CrossRef]
- Shrestha, S.R.; Sliuzas, R.; Kuffer, M. Open spaces and risk perception in post-earthquake Kathmandu city. Appl. Geogr. 2018, 93, 81–91. [Google Scholar] [CrossRef]
- Davis, J.; Uffer, S. Evolving Cities: Exploring the Relations between Urban form ‘Resilience’and the Governance of Urban Form; London School of Economics: London, UK, 2013. [Google Scholar]
- Marcus, L.; Colding, J. Toward an integrated theory of spatial morphology and resilient urban systems. Ecol. Soc. 2014, 19, 55. [Google Scholar] [CrossRef] [Green Version]
- León, J.; March, A. Urban morphology as a tool for supporting tsunami rapid resilience: A case study of Talcahuano, Chile. Habitat Int. 2014, 43, 250–262. [Google Scholar] [CrossRef]
- Brand, D.; Nicholson, H. Public space and recovery: Learning from post-earthquake Christchurch. J. Urban Des. 2016, 21, 159–176. [Google Scholar] [CrossRef]
- Unisdr, U. Sendai framework for disaster risk reduction 2015–2030. In Proceedings of the 3rd United Nations World Conference on DRR, Sendai, Japan, 14–18 March 2015. [Google Scholar]
- Parizi, S.M.; Taleai, M.; Sharifi, A. Integrated methods to determine urban physical resilience characteristics and their interactions. Nat. Hazards 2021, 109, 725–754. [Google Scholar] [CrossRef]
- Zafarani, H.; Hajimohammadi, B.; Jalalalhosseini, S.M. Earthquake hazard in the Tehran region based on the characteristic earthquake model. J. Earthq. Eng. 2019, 23, 1485–1511. [Google Scholar] [CrossRef]
- Fekete, A.; Asadzadeh, A.; Ghafory-Ashtiany, M.; Amini-Hosseini, K.; Hetkämper, C.; Moghadas, M.; Ostadtaghizadeh, A.; Rohr, A.; Kötter, T. Pathways for advancing integrative disaster risk and resilience management in Iran: Needs, challenges and opportunities. Int. J. Disaster Risk Reduct. 2020, 49, 101635. [Google Scholar] [CrossRef]
- Taleai, M.; Rahnama, A.H. Demand and Supply Evaluation of Urban Facilities Needed for Management of Tehran after an Earthquake: A DEA Approach. Available online: https://www.researchgate.net/profile/Mohammad-Taleai/publication/281646824_Demand_and_Supply_Evaluation_of_Urban_Facilities_Needed_for_Management_of_Tehran_after_an_Earthquake_a_DEA_approach/links/55f2b36a08ae0960a389747d/Demand-and-Supply-Evaluation-of-Urban-Facilities-Needed-for-Management-of-Tehran-after-an-Earthquake-a-DEA-approach.pdf (accessed on 14 March 2022).
- Zoej, A.H.-M.J.V.; Mohammadzadeh, A.; Taleai, M. Détection de Dommages et Évaluation des Dégâts du Réseau Routier Après un Séisme, en Utilisant des Images Quick Bird Haute Résolution. Available online: https://www.academia.edu/22746686/D%C3%A9tection_de_dommages_et_%C3%A9valuation_des_d%C3%A9g%C3%A2ts_du_r%C3%A9seau_routier_apr%C3%A8s_un_s%C3%A9isme_en_utilisant_des_images_QuickBird_haute_r%C3%A9solution (accessed on 14 March 2022).
- Berberian, M.; Jackson, J.; Fielding, E.; Parsons, B.; Priestley, K.; Qorashi, M.; Talebian, M.; Walker, R.; Wright, T.; Baker, C. The 1998 March 14 Fandoqa earthquake (Mw 6.6) in Kerman province, southeast Iran: Re-rupture of the 1981 Sirch earthquake fault, triggering of slip on adjacent thrusts and the active tectonics of the Gowk fault zone. Geophys. J. Int. 2001, 146, 371–398. [Google Scholar] [CrossRef] [Green Version]
- Chauhan, A.; Singh, A.; Jharkharia, S. An interpretive structural modeling (ISM) and decision-making trail and evaluation laboratory (DEMATEL) method approach for the analysis of barriers of waste recycling in India. J. Air Waste Manag. Assoc. 2018, 68, 100–110. [Google Scholar] [CrossRef]
- Rajesh, R. Technological capabilities and supply chain resilience of firms: A relational analysis using Total Interpretive Structural Modeling (TISM). Technol. Forecast. Soc. Chang. 2017, 118, 161–169. [Google Scholar] [CrossRef]
- Taleai, M.; Sharifi, A.; Sliuzas, R.; Mesgari, M. Evaluating the compatibility of multi-functional and intensive urban land uses. Int. J. Appl. Earth Obs. Geoinf. 2007, 9, 375–391. [Google Scholar] [CrossRef]
- Rajabi, M.; Mansourian, A.; Talei, M. A comparing study between AHP, AHP-OWA and Fuzzy AHP-OWA multi-criteria decision making methods for site selection of residential complexes in Tabriz-Iran. J. Environ. Stud. 2011, 37, 77–92. [Google Scholar]
- Ujoh, F.; Igbawua, T.; Ogidi Paul, M. Suitability mapping for rice cultivation in Benue State, Nigeria using satellite data. Geo-Spat. Inf. Sci. 2019, 22, 332–344. [Google Scholar] [CrossRef] [Green Version]
- Malaperdas, G.; Zacharias, N. The habitation Model Trend Calculation (MTC): A new effective tool for predictive modeling in archaeology. Geo-Spat. Inf. Sci. 2019, 22, 314–331. [Google Scholar] [CrossRef]
- Taleai, M.; Mansourian, A.; Sharifi, A. Surveying general prospects and challenges of GIS implementation in developing countries: A SWOT–AHP approach. J. Geogr. Syst. 2009, 11, 291–310. [Google Scholar] [CrossRef]
- Saaty, T.L. Fundamentals of the analytic network process—multiple networks with benefits, costs, opportunities and risks. J. Syst. Sci. Syst. Eng. 2004, 13, 348–379. [Google Scholar] [CrossRef]
- Yin, S.-H.; Wang, C.-C.; Teng, L.-Y.; Hsing, Y.M. Application of DEMATEL, ISM, and ANP for key success factor (KSF) complexity analysis in RD alliance. Sci. Res. Essays 2012, 7, 1872–1890. [Google Scholar]
- Saaty, T.L. The analytical hierarchy process, planning, priority. In Resource Allocation; RWS Publications: Pittsburgh, PA, USA, 1980. [Google Scholar]
- Saaty, T.L. Decision Making with Dependence and Feedback: The Analytic Network Process; RWS publications: Pittsburgh, PA, USA, 1996; Volume 4922. [Google Scholar]
- Saaty, T.L.; Vargas, L.G. Decision Making with the Analytic Network Process; Springer: Berlin/Heidelberg, Germany, 2006; Volume 282. [Google Scholar]
- Taleai, M.; Mansourian, A. Using Delphi-AHP method to survey major factors causing urban plan implementation failure. J. Appl. Sci. 2008, 8, 2746–2751. [Google Scholar] [CrossRef] [Green Version]
- Coaffee, J.; Clarke, J. On securing the generational challenge of urban resilience. Town Plan. Rev. 2015, 86, 249–255. [Google Scholar] [CrossRef]
- Ahern, J. From fail-safe to safe-to-fail: Sustainability and resilience in the new urban world. Landsc. Urban Plan. 2011, 100, 341–343. [Google Scholar] [CrossRef] [Green Version]
- Walker, B.; Salt, D. Resilience Thinking: Sustaining Ecosystems and People in a Changing World; Island Press: Washington, DC, USA, 2012. [Google Scholar]
- Godschalk, D.R. Urban hazard mitigation: Creating resilient cities. Nat. Hazards Rev. 2003, 4, 136–143. [Google Scholar] [CrossRef]
- Sharifi, A.; Yamagata, Y. Urban resilience assessment: Multiple dimensions, criteria, and indicators. In Urban Resilience; Springer: Berlin/Heidelberg, Germany, 2016; pp. 259–276. [Google Scholar]
- Chelleri, L.; Olazabal, M. Multidisciplinary Perspectives on Urban Resilience: A Workshop Report; BC3, Basque Centre for Climate Change: Leioa, Spain, 2012. [Google Scholar]
- Eraydin, A. “Resilience Thinking” for Planning. In Resilience Thinking in Urban Planning; Springer: Berlin/Heidelberg, Germany, 2013; pp. 17–37. [Google Scholar]
- Eraydin, A.; Tuna, T.K. Resilience Thinking in Urban Planning Springer; Kok, T.T., Ed.; Springer: Berlin/Heidelberg, Germany, 2013. [Google Scholar]
- Grafakos, S.; Gianoli, A.; Tsatsou, A. Towards the development of an integrated sustainability and resilience benefits assessment framework of urban green growth interventions. Sustainability 2016, 8, 461. [Google Scholar] [CrossRef] [Green Version]
- Hassler, U.; Kohler, N. Resilience in the Built Environment; Taylor & Francis: Abingdon, UK, 2014. [Google Scholar]
- Meerow, S.; Stults, M. Comparing conceptualizations of urban climate resilience in theory and practice. Sustainability 2016, 8, 701. [Google Scholar] [CrossRef] [Green Version]
- Ribeiro, P.J.G.; Gonçalves, L.A.P.J. Urban resilience: A conceptual framework. Sustain. Cities Soc. 2019, 50, 101625. [Google Scholar] [CrossRef]
- Alizadeh, H.; Sharifi, A. Assessing resilience of urban critical infrastructure networks: A case study of Ahvaz, Iran. Sustainability 2020, 12, 3691. [Google Scholar] [CrossRef]
- Øien, K. Risk indicators as a tool for risk control. Reliab. Eng. Syst. Saf. 2001, 74, 129–145. [Google Scholar] [CrossRef]
- Freudenberg, M. Composite Indicators of Country Performance: A critical Assessment; OECD Publishing: Paris, France, 2003. [Google Scholar]
- Lu, P.; Stead, D. Understanding the notion of resilience in spatial planning: A case study of Rotterdam, The Netherlands. Cities 2013, 35, 200–212. [Google Scholar] [CrossRef]
- Zhao, X.; Cai, H.; Chen, Z.; Gong, H.; Feng, Q. Assessing urban lifeline systems immediately after seismic disaster based on emergency resilience. Struct. Infrastruct. Eng. 2016, 12, 1634–1649. [Google Scholar] [CrossRef]
- Zhang, X.; Miller-Hooks, E.; Denny, K. Assessing the role of network topology in transportation network resilience. J. Transp. Geogr. 2015, 46, 35–45. [Google Scholar] [CrossRef] [Green Version]
- Saxena, M.R. Role of Open Spaces in Disaster Management; AGORA: Baltimore, ML, USA, 2016. [Google Scholar]
- Anhorn, J.; Khazai, B. Open space suitability analysis for emergency shelter after an earthquake. Nat. Hazards Earth Syst. Sci. 2015, 15, 789–803. [Google Scholar] [CrossRef] [Green Version]
- Erten, S.; Torun, A.O.; Gurleyen, T.; Akbas, C.; Zunbiloglu, E. Resilience Abilities of Urban Squares: A Study in Istanbul’s Peripheral districts. 2016. Available online: https://www.semanticscholar.org/paper/Resilience-abilities-of-urban-squares%3A-A-study-in-Erten-Torun/70ca7b319ffab32a0ae93ad40699cd4240796df6 (accessed on 14 March 2022).
- Yousuf Reja, M. Investigating the Role of Open Spaces and Public Buildings for Earthquake Vulnerability Reduction in Old Dhaka. 2012. Available online: http://lib.buet.ac.bd:8080/xmlui/handle/123456789/3053 (accessed on 14 March 2022).
- Siavash, Y.S. Achieving Urban Resilience: Through Urban Design and Planning Principles; Oxford Brookes University: Oxford, UK, 2016. [Google Scholar]
- Silva, M.C.; Horta, I.M.; Leal, V.; Oliveira, V. A spatially-explicit methodological framework based on neural networks to assess the effect of urban form on energy demand. Appl. Energy 2017, 202, 386–398. [Google Scholar] [CrossRef]
- Zekry, M.; Al Hagla, K.; Saadallah, D.M. Urban Governance as a Tool for Enhancing Resilient Urban Form: Case Study Alexandria, Egypt. In Proceedings of the REAL CORP 2020, 25th International Conference on Urban Development, Vienna, Austria, 15–18 April 2020. [Google Scholar]
- Wamsler, C.; Brink, E.; Rivera, C. Planning for climate change in urban areas: From theory to practice. J. Clean. Prod. 2013, 50, 68–81. [Google Scholar] [CrossRef] [Green Version]
- Allan, P.; Bryant, M. Resilience as a framework for urbanism and recovery. J. Landsc. Archit. 2011, 6, 34–45. [Google Scholar] [CrossRef]
- Salat, S.; Vialan, D.; Nowacki, C. A Common Metrics and Set of Indicators for Assessing Buildings and Urban Fabric Sustainability Performance; CESB: Prague, Czech Republic, 2010; pp. 1–12.
- Stevens, M.R.; Berke, P.R.; Song, Y. Creating disaster-resilient communities: Evaluating the promise and performance of new urbanism. Landsc. Urban Plan. 2010, 94, 105–115. [Google Scholar] [CrossRef]
- Van Den Hoek, J.W. The MXI (Mixed-use Index) as tool for urban planning and analysis. In Corporations and Cities: Envisioning Corporate Real Estate in the Urban Future; TUDelft: Delft, The Netherlands, 2008; pp. 1–15. [Google Scholar]
- Downes, N.K.; Storch, H.; Schmidt, M.; Van Nguyen, T.C.; Tran, T.N. Understanding Ho Chi Minh City’s urban structures for urban land-use monitoring and risk-adapted land-use planning. In Sustainable Ho Chi Minh City: Climate Policies for Emerging Mega Cities; Springer: Berlin/Heidelberg, Germany, 2016; pp. 89–116. [Google Scholar]
- Meshkini, A.; Hajilou, M.; Jokar, S.; Esmaeili, A. The role of land use patterns in earthquake resilience: A case study of the Ahvaz Manba Ab neighborhood. Nat. Hazards 2021, 109, 2027–2051. [Google Scholar] [CrossRef]
- Salat, S. A systemic approach of urban resilience: Power laws and urban growth patterns. Int. J. Urban Sustain. Dev. 2017, 9, 107–135. [Google Scholar] [CrossRef]
- Bourdic, L.; Salat, S.; Nowacki, C. Assessing cities: A new system of cross-scale spatial indicators. Build. Res. Inf. 2012, 40, 592–605. [Google Scholar] [CrossRef]
- Verrucci, E.; Rossetto, T.; Twigg, J.; Adams, B. Multi-disciplinary indicators for evaluating the seismic resilience of urban areas. In Proceedings of the 15th World Conference Earthquake Engineering, Lisbon, Portugal, 24–28 September 2012. [Google Scholar]
- Ng, S.T.; Xu, F.J.; Yang, Y.; Lu, M.; Li, J. Necessities and challenges to strengthen the regional infrastructure resilience within city clusters. Procedia Eng. 2018, 212, 198–205. [Google Scholar] [CrossRef]
- Chen, S.; Claramunt, C.; Ray, C. A spatio-temporal modelling approach for the study of the connectivity and accessibility of the Guangzhou metropolitan network. J. Transp. Geogr. 2014, 36, 12–23. [Google Scholar] [CrossRef] [Green Version]
- Boeing, G. Measuring the complexity of urban form and design. Urban Des. Int. 2018, 23, 281–292. [Google Scholar] [CrossRef] [Green Version]
- Silva, C. Structural accessibility for mobility management. Prog. Plan. 2013, 81, 1–49. [Google Scholar] [CrossRef]
- Villagra, P.; Rojas, C.; Ohno, R.; Xue, M.; Gómez, K. A GIS-base exploration of the relationships between open space systems and urban form for the adaptive capacity of cities after an earthquake: The cases of two Chilean cities. Appl. Geogr. 2014, 48, 64–78. [Google Scholar] [CrossRef]
- Sharifi, A.; Roosta, M.; Javadpoor, M. Urban form resilience: A comparative analysis of traditional, semi-planned, and planned neighborhoods in Shiraz, Iran. Urban Sci. 2021, 5, 18. [Google Scholar] [CrossRef]
- Bruwier, M.; Mustafa, A.; Aliaga, D.G.; Archambeau, P.; Erpicum, S.; Nishida, G.; Zhang, X.; Pirotton, M.; Teller, J.; Dewals, B. Influence of urban pattern on inundation flow in floodplains of lowland rivers. Sci. Total Environ. 2018, 622, 446–458. [Google Scholar] [CrossRef] [PubMed] [Green Version]
- Irajifar, L.; Sipe, N.; Alizadeh, T. The impact of urban form on disaster resiliency: A case study of Brisbane and Ipswich, Australia. Int. J. Disaster Resil. Built Environ. 2016, 7, 259–275. [Google Scholar] [CrossRef]
- Lotfi Sedighe, N.A. Akbari Fatemeh. Assessment and evaluation of the physical dimensions of urban resilience against earthquakes. New Attitudes Hum. Geogr. 2020, 12, 19–37. [Google Scholar]
- Coaffee, J.; Therrien, M.C.; Chelleri, L.; Henstra, D.; Aldrich, D.P.; Mitchell, C.L.; Tsenkova, S.; Rigaud, É.; on behalf of the participants. Urban Resilience Implementation: A Policy Challenge and Research Agenda for the 21st Century; Wiley Online Library: Hoboken, NJ, USA, 2018; Volume 26, pp. 403–410. [Google Scholar]
Figure 1.
Location of the study area.

Figure 2.
Different methods used in this study and how they are linked to each other.

Figure 3.
The digraph of ISM-Based Model.

Figure 4.
Proposed structure for the ANP model.

Figure 5.
The weight of indicators.

Figure 6.
The structure of the proposed framework.

Figure 7.
The absolute weight of the characteristics.

Figure 8.
Selected maps showing the state of some physical indicators in the study area; (A) Building Density, (B) Land use Diversity, (C) Granulation of parcels, (D) Robustness of buildings, (E) The length of the main streets, (F) Street Width, (G) Connectivity, and (H) Density of the around open spaces.

Figure 9.
Final physical resilience map of the study area.


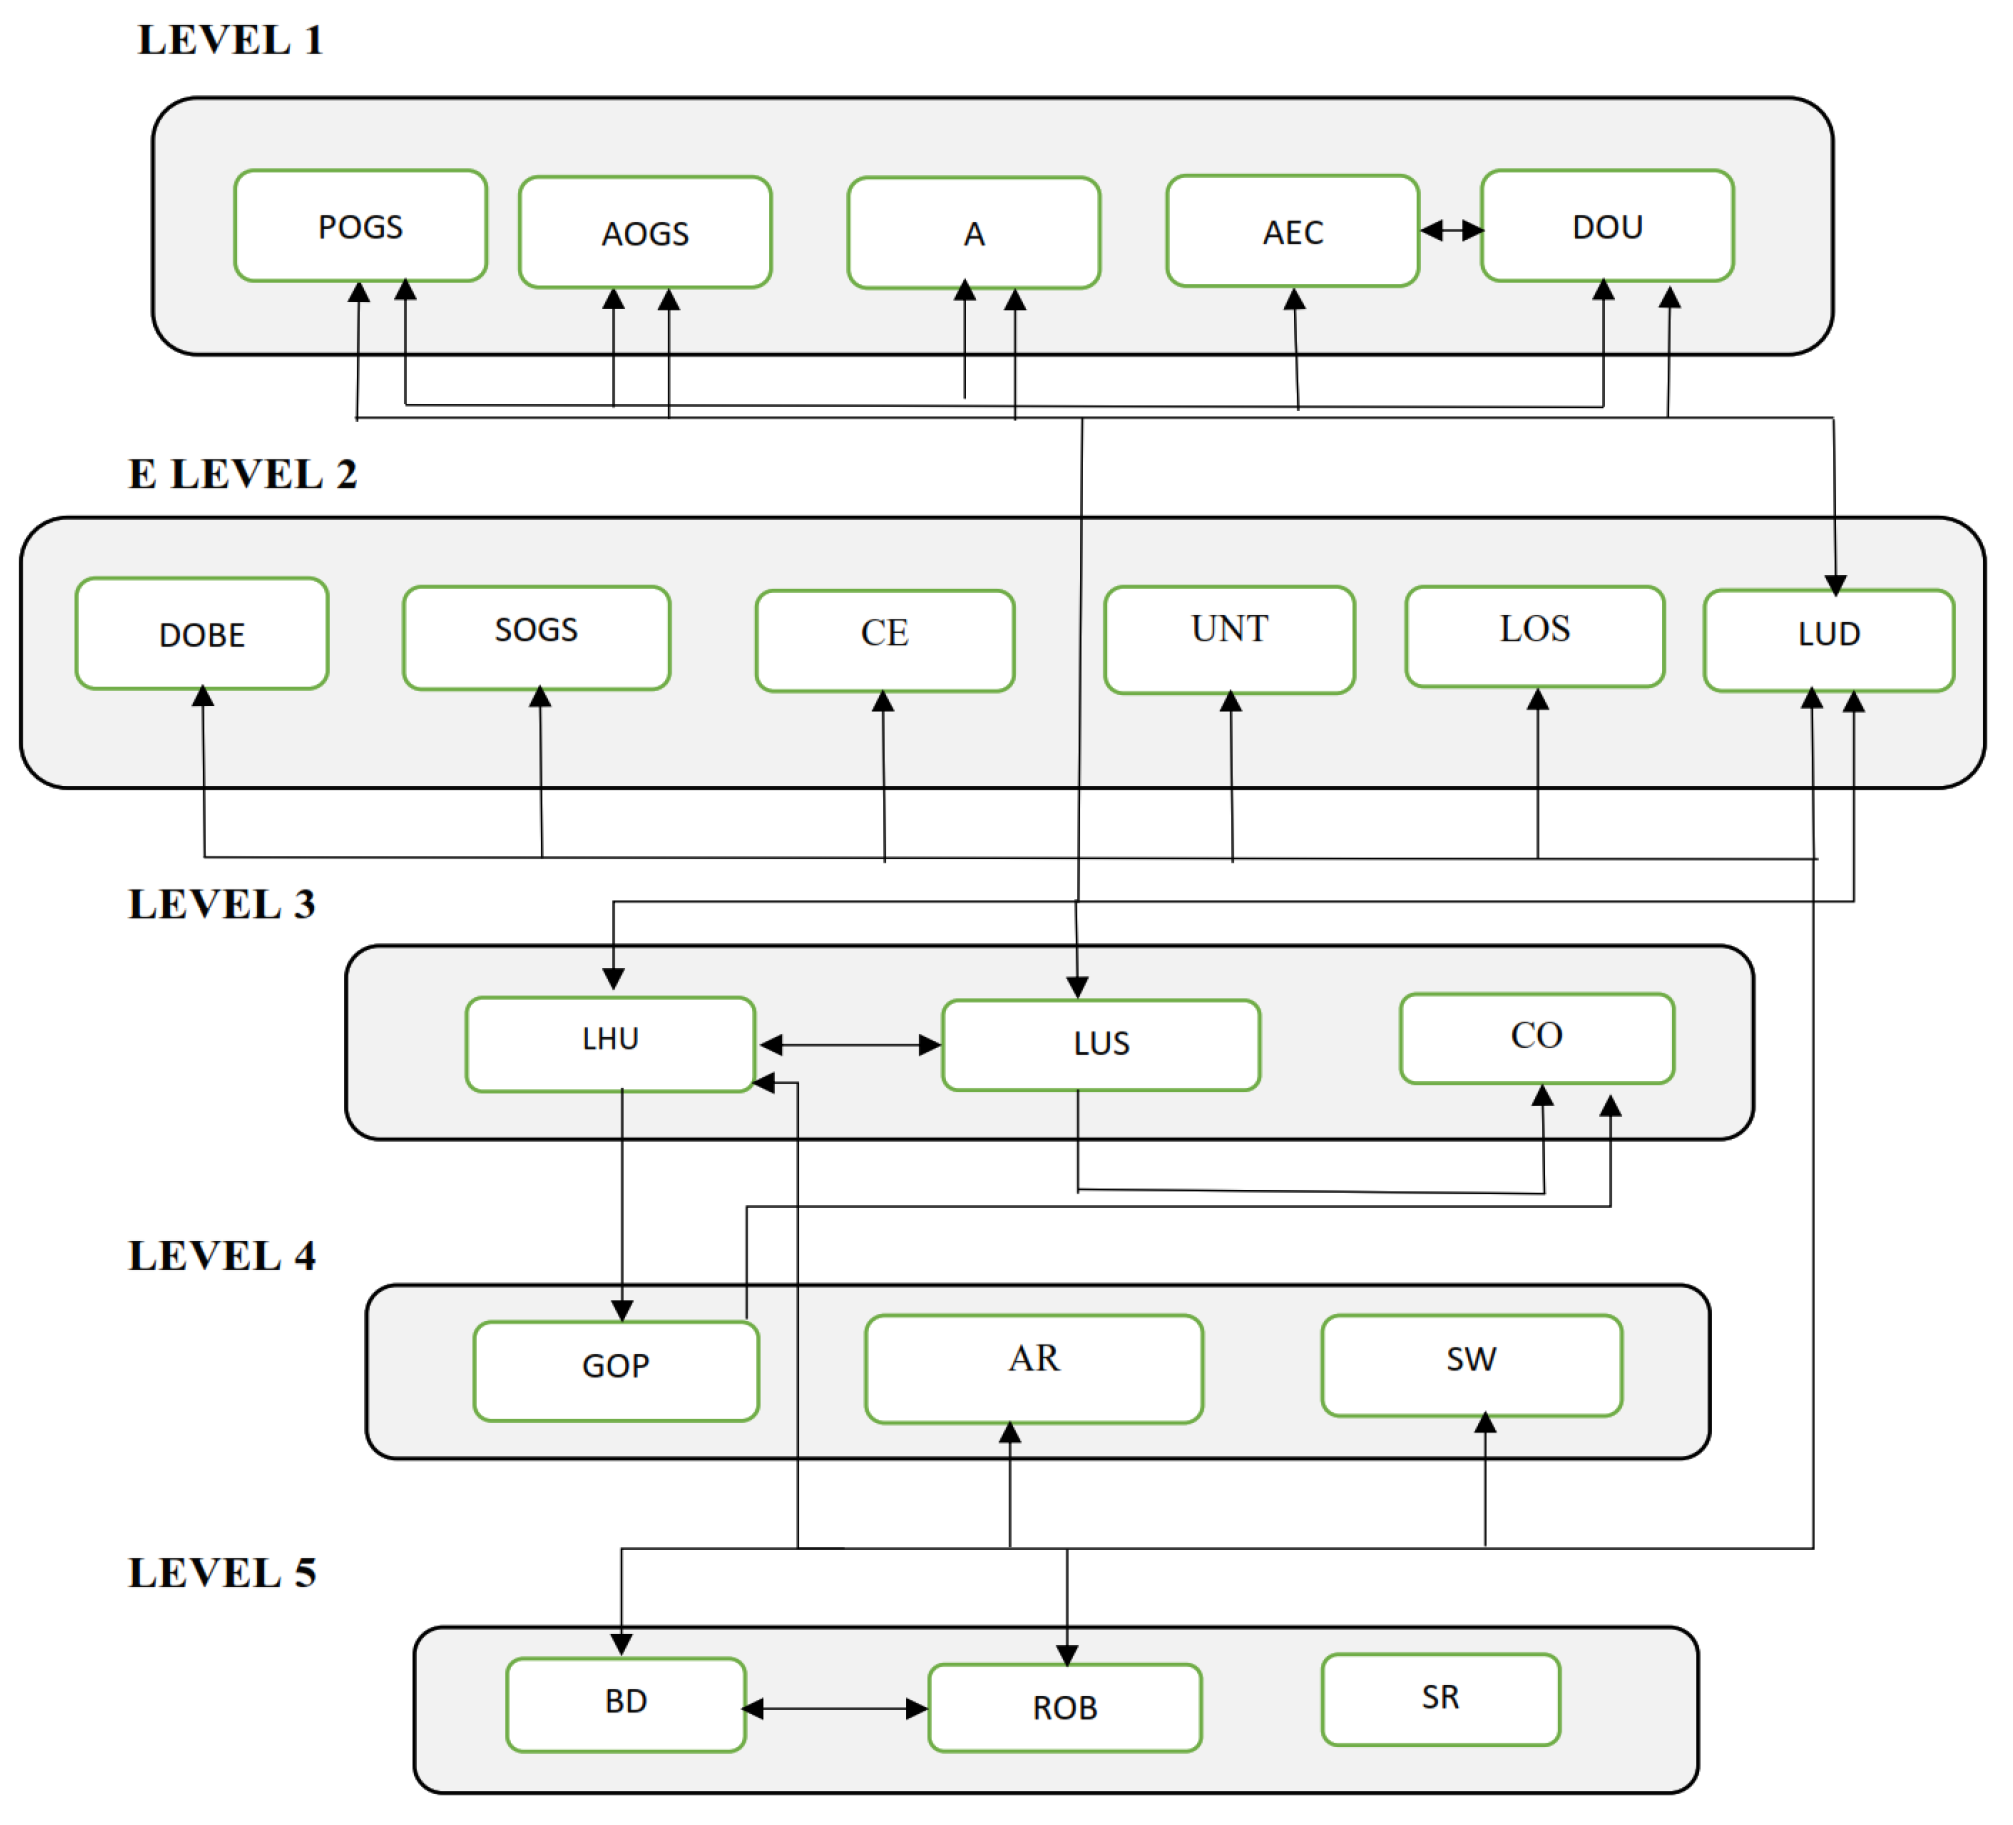
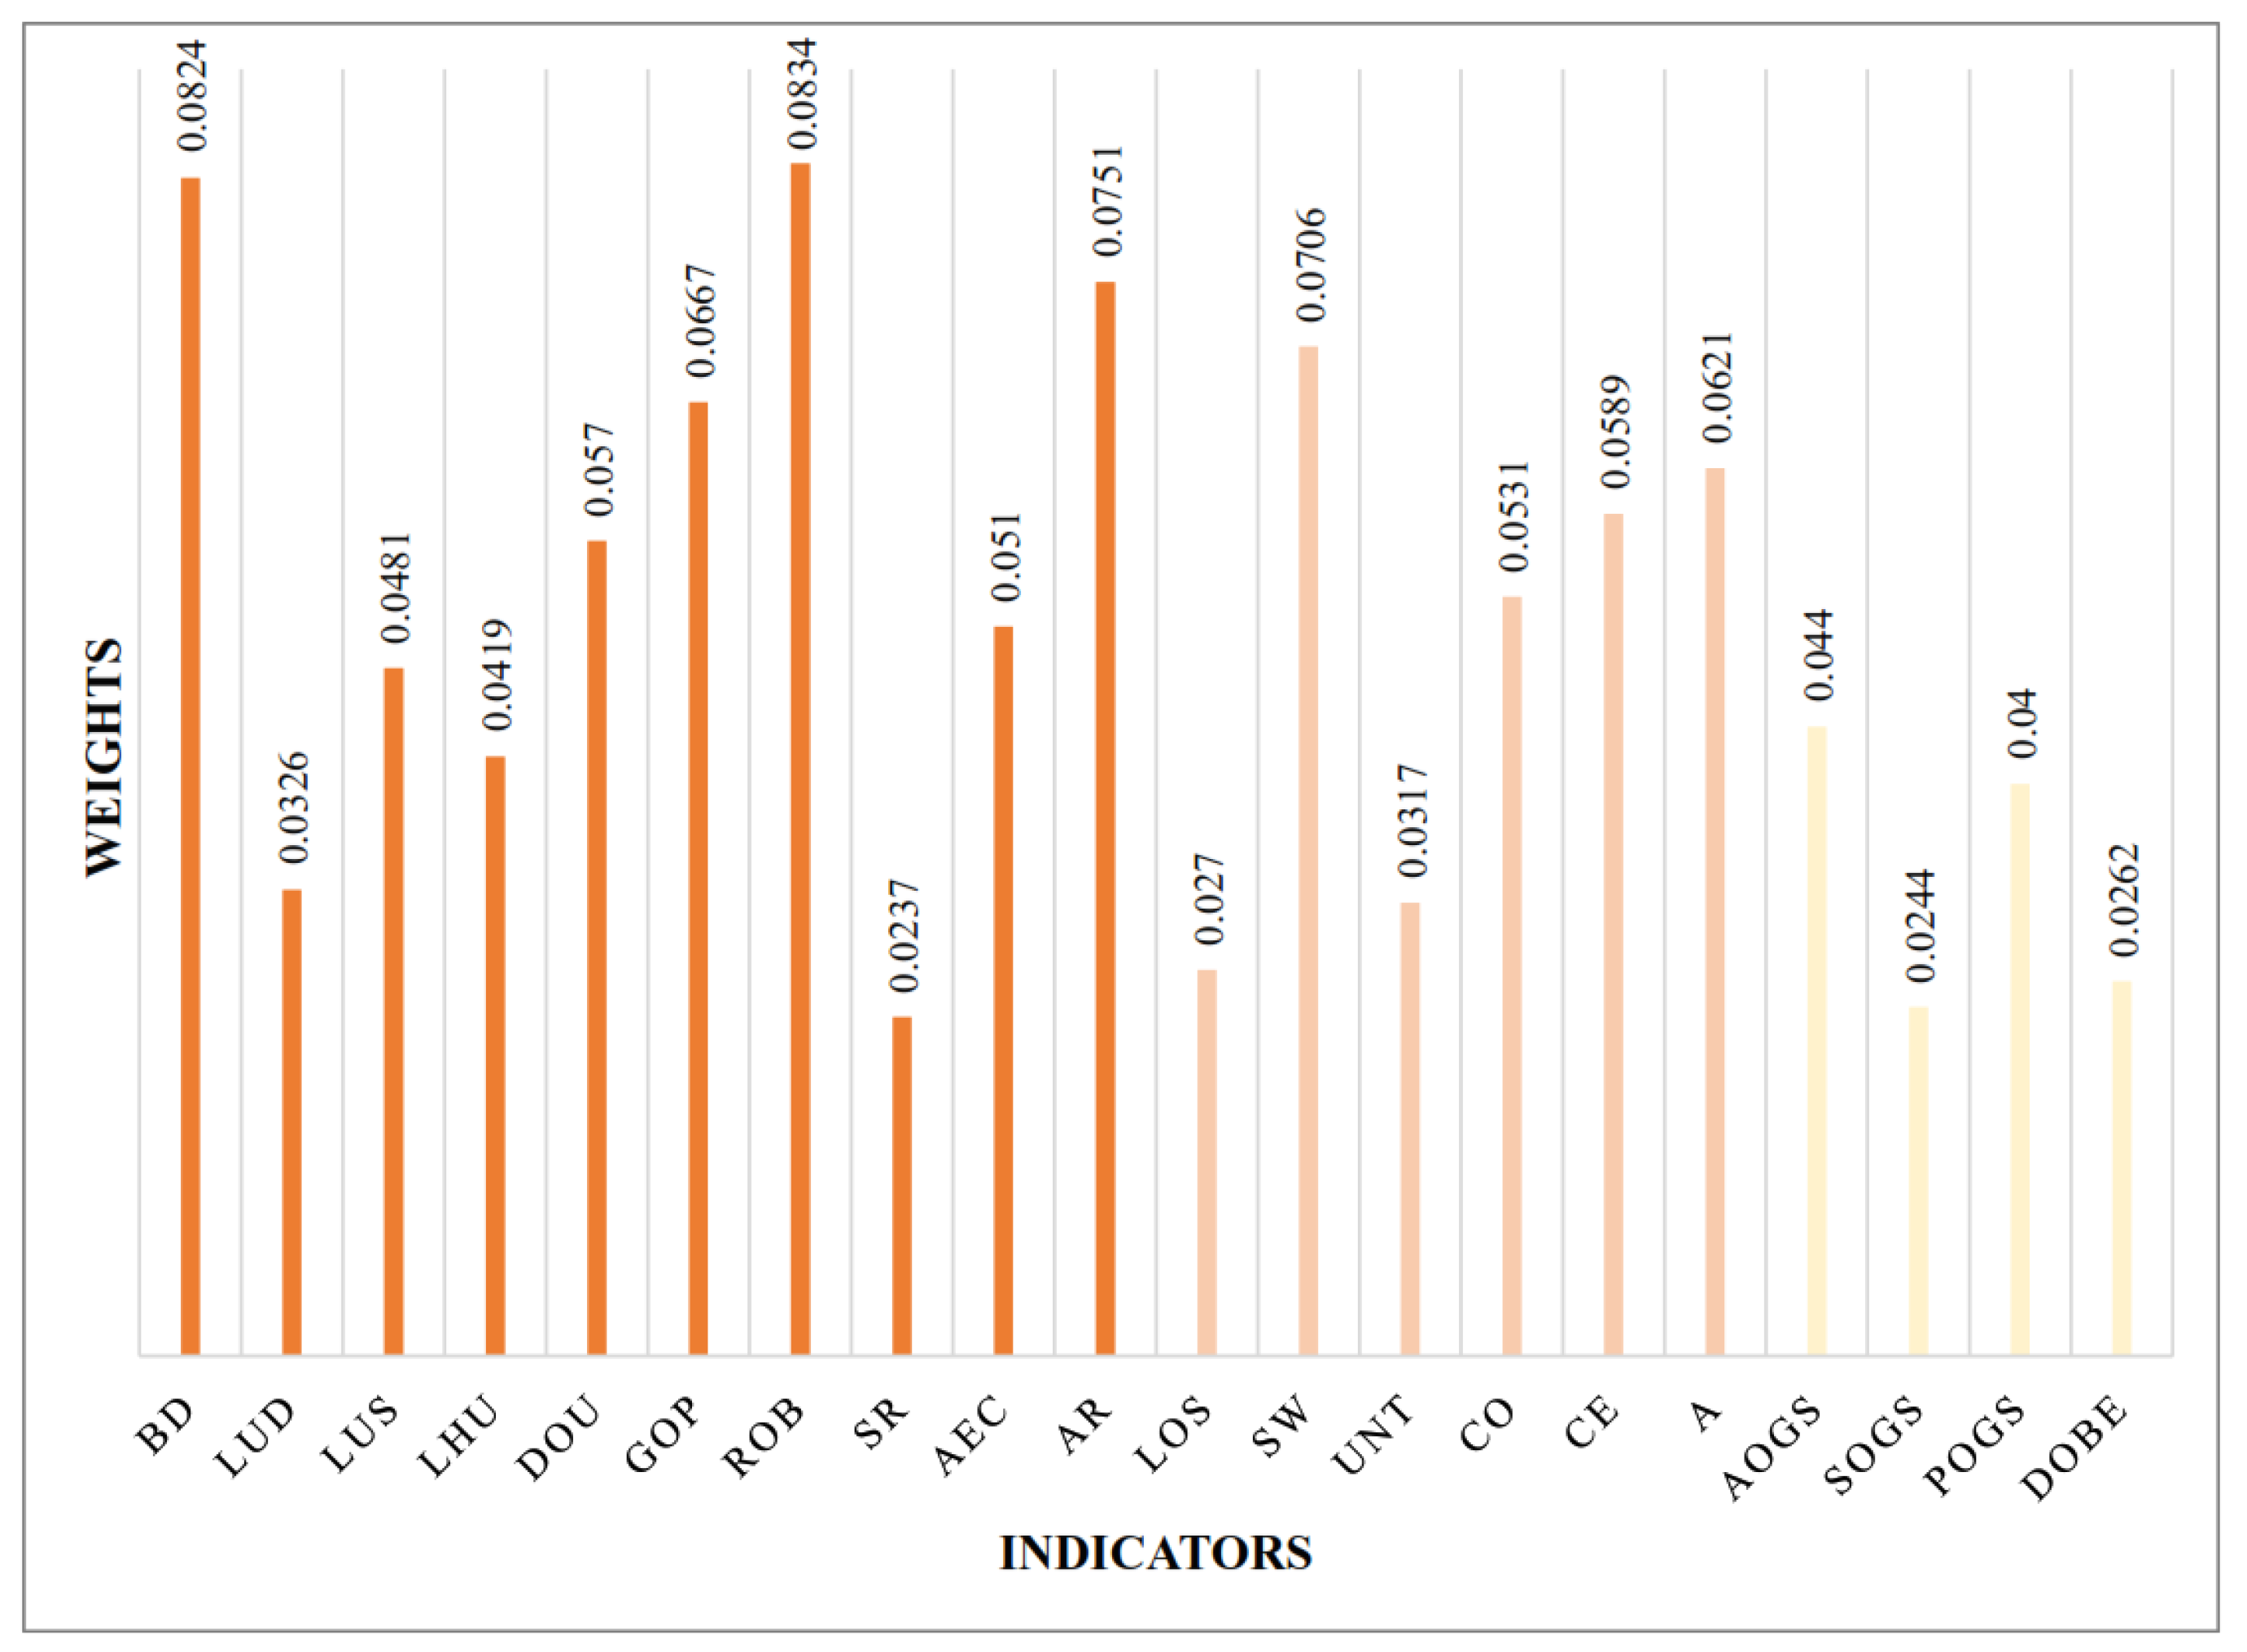
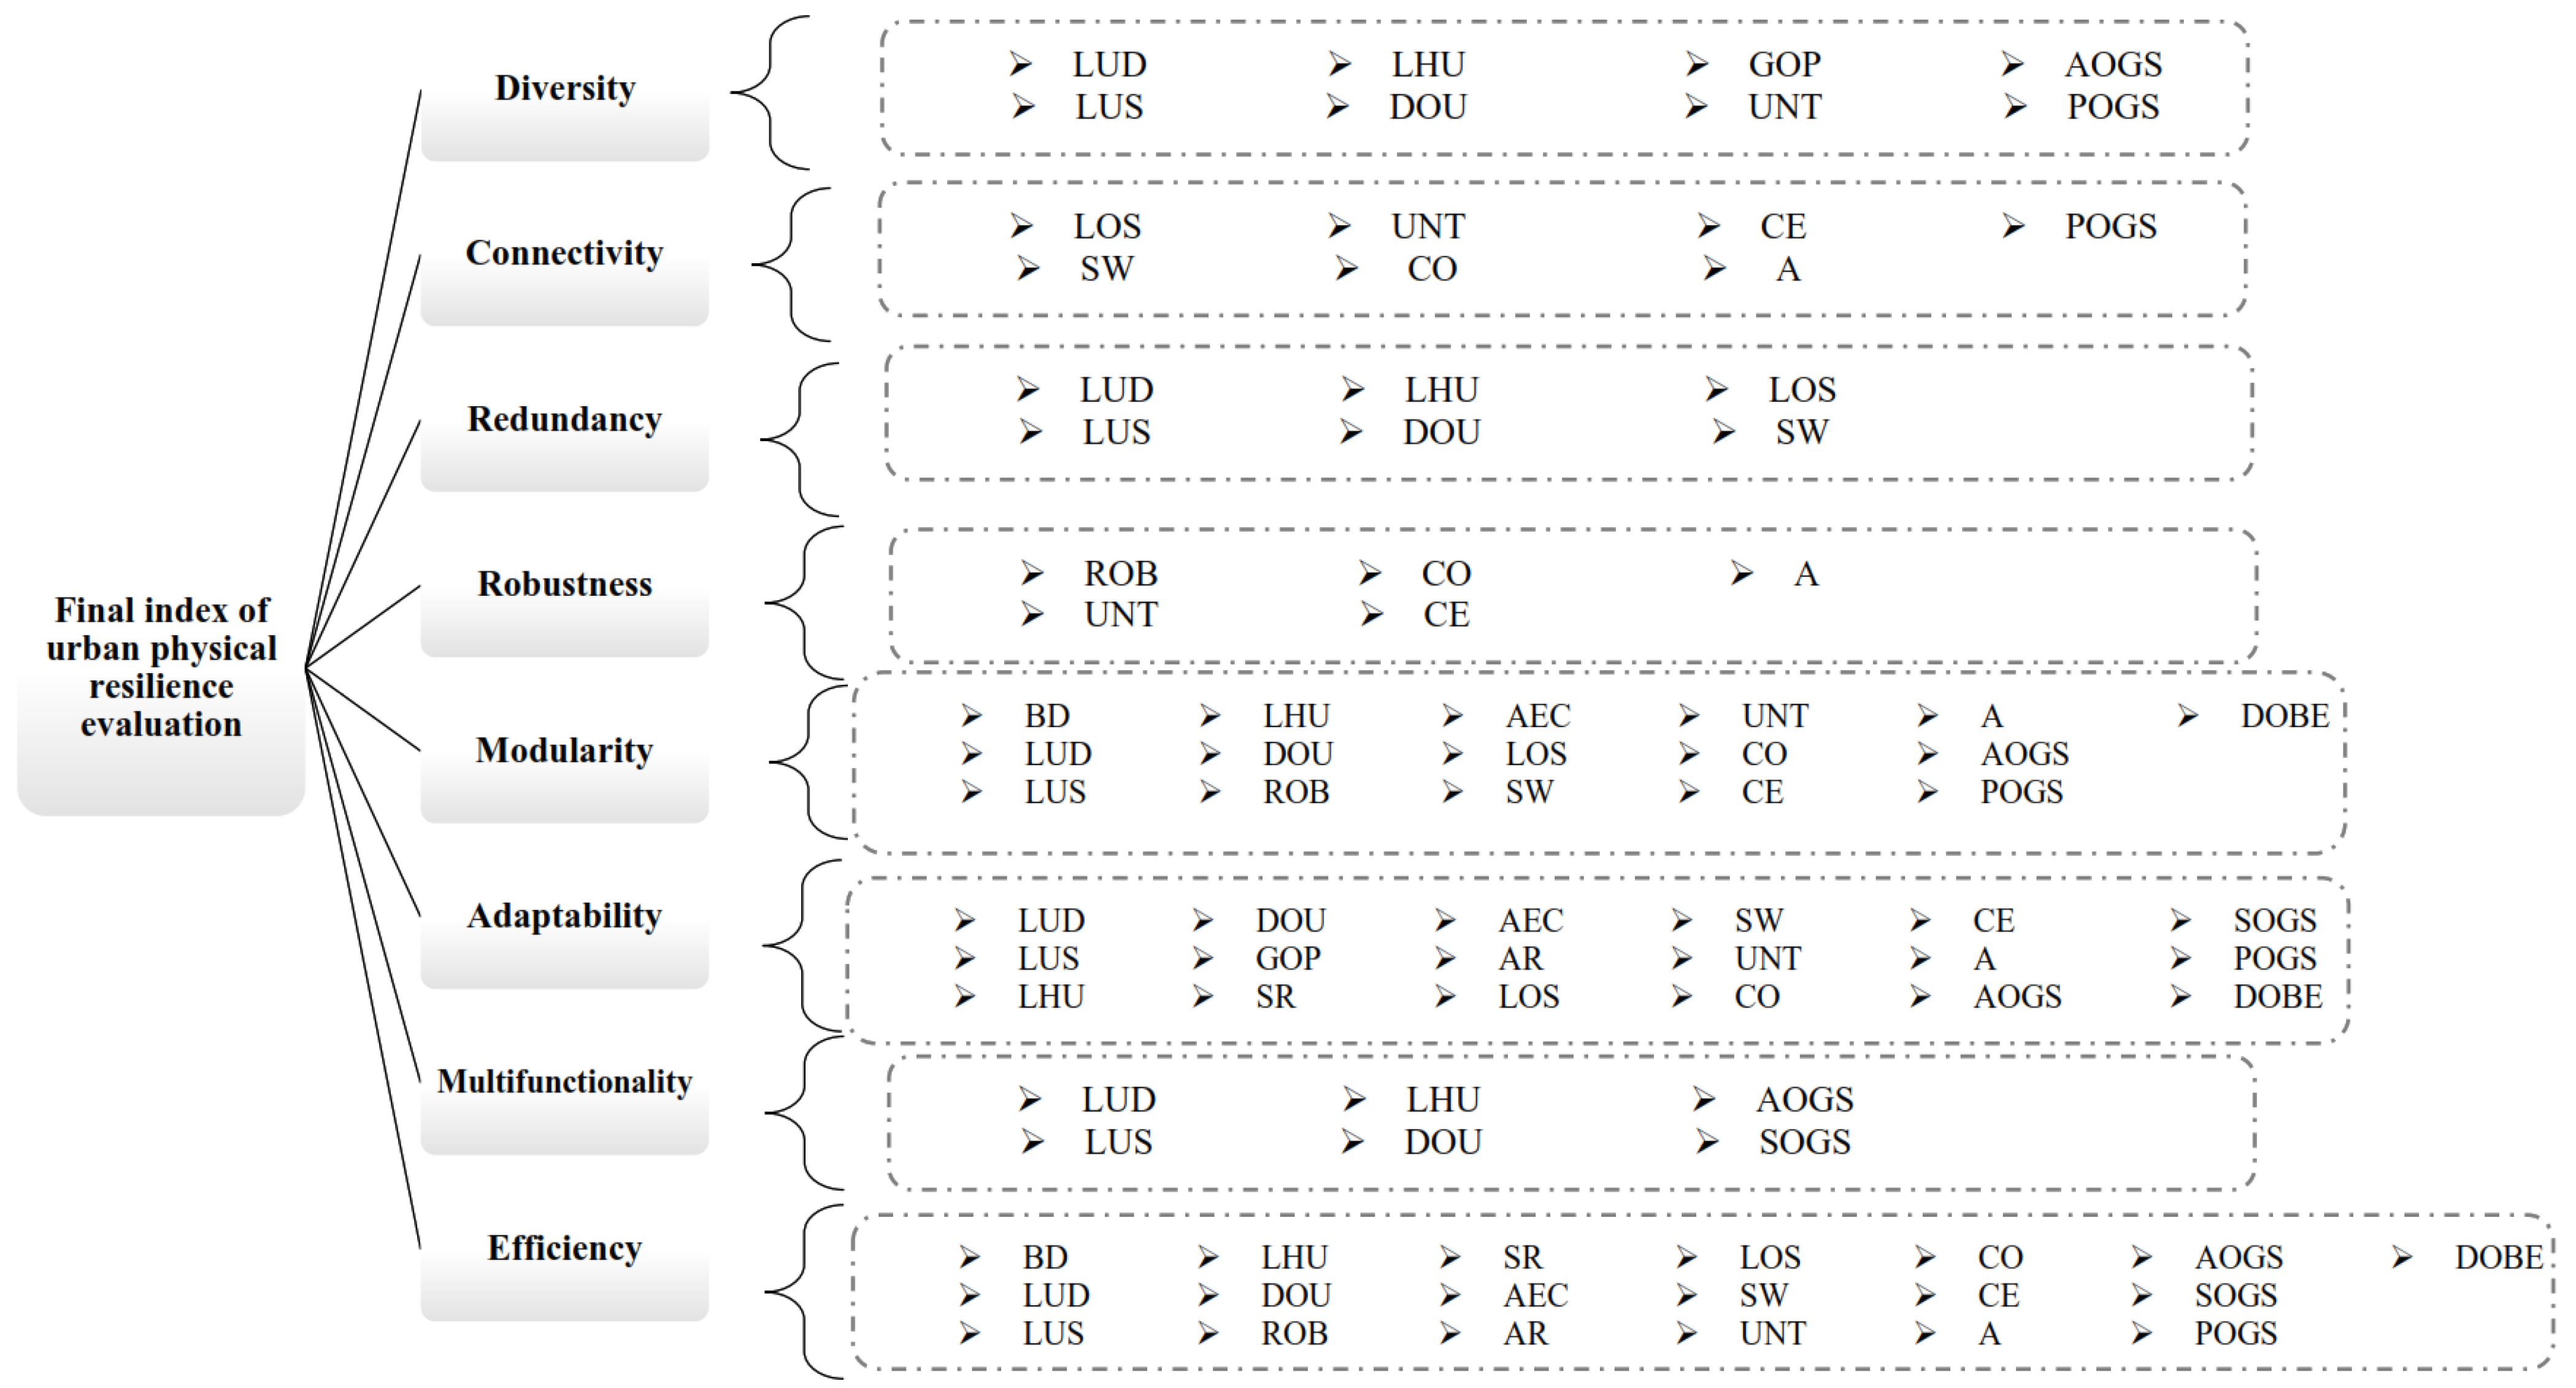
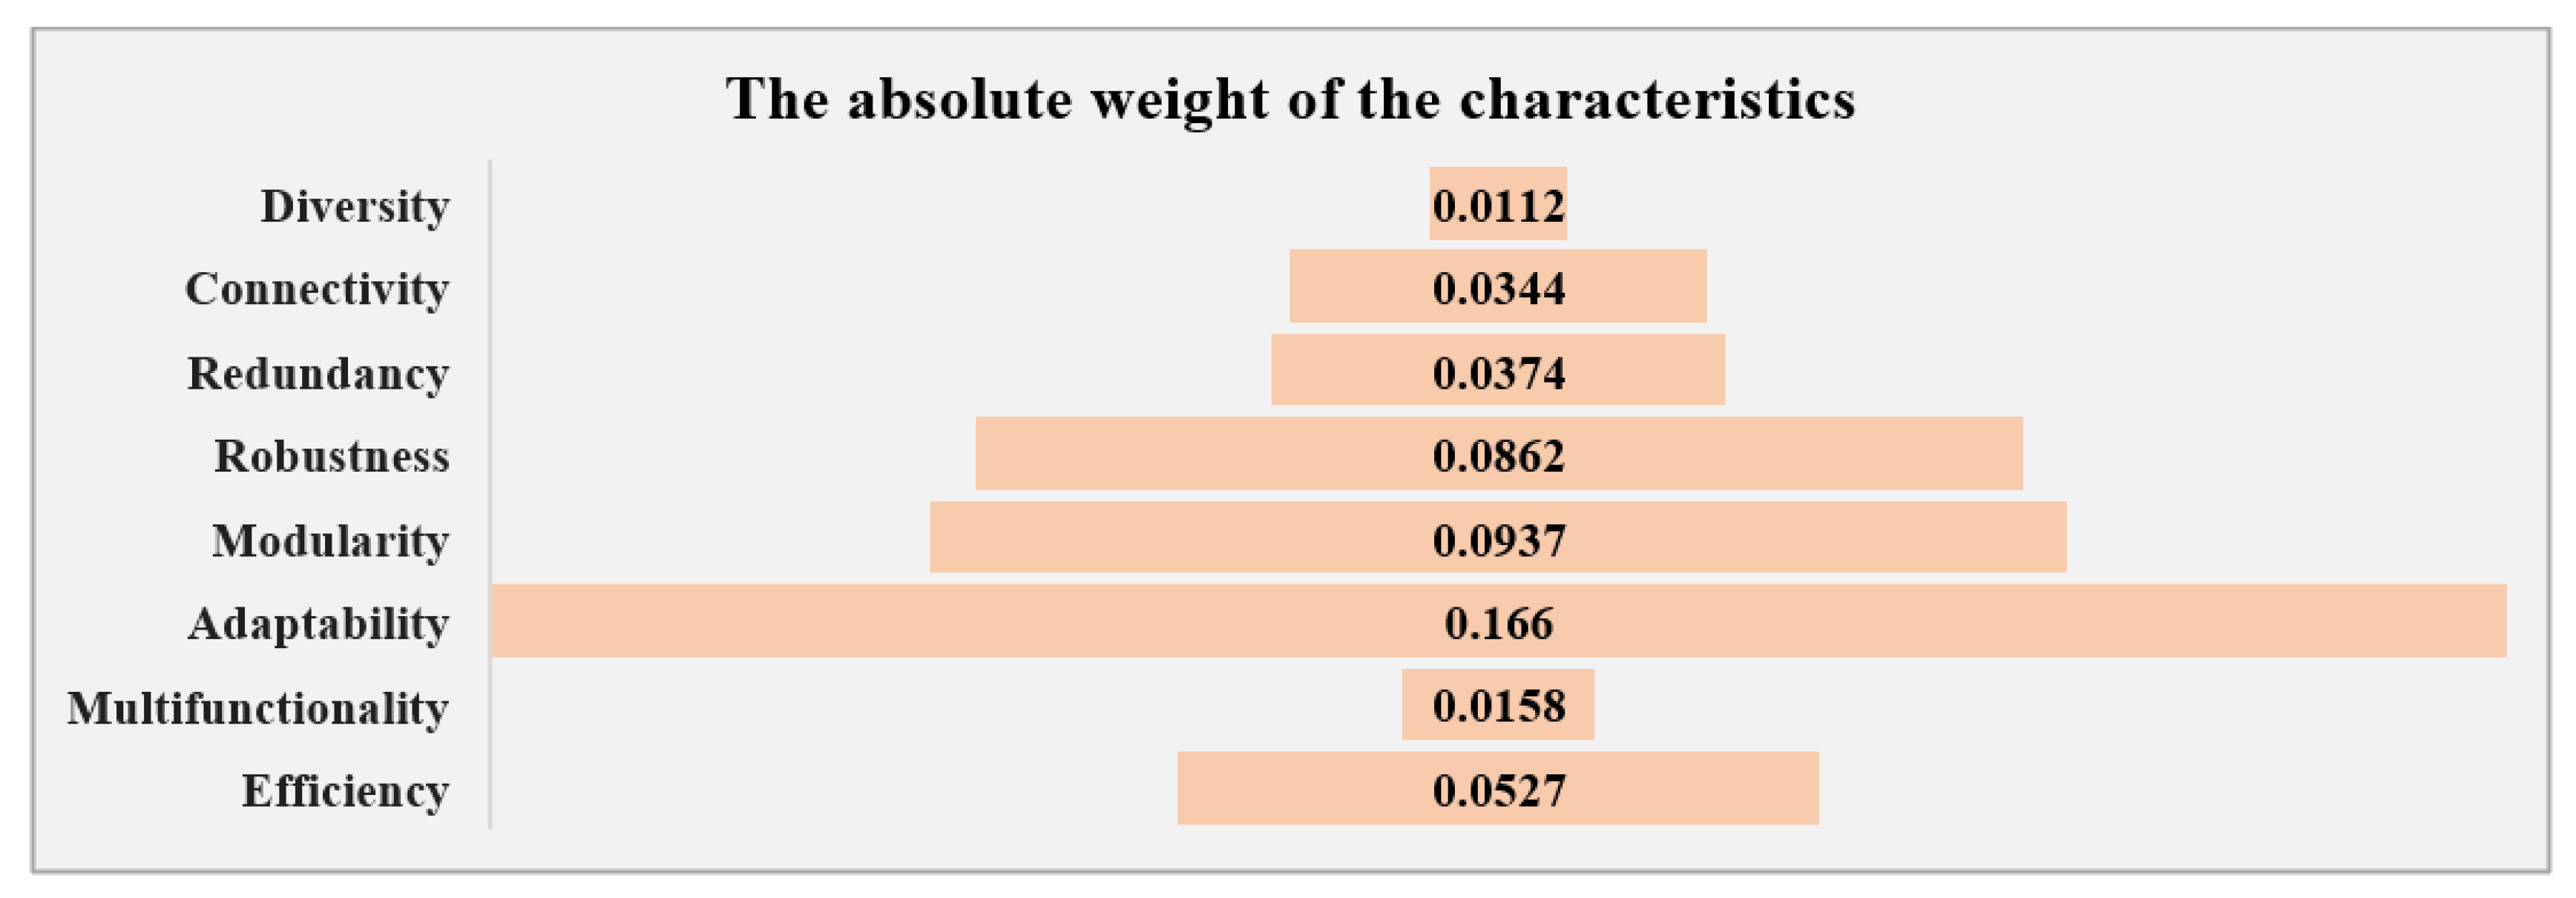
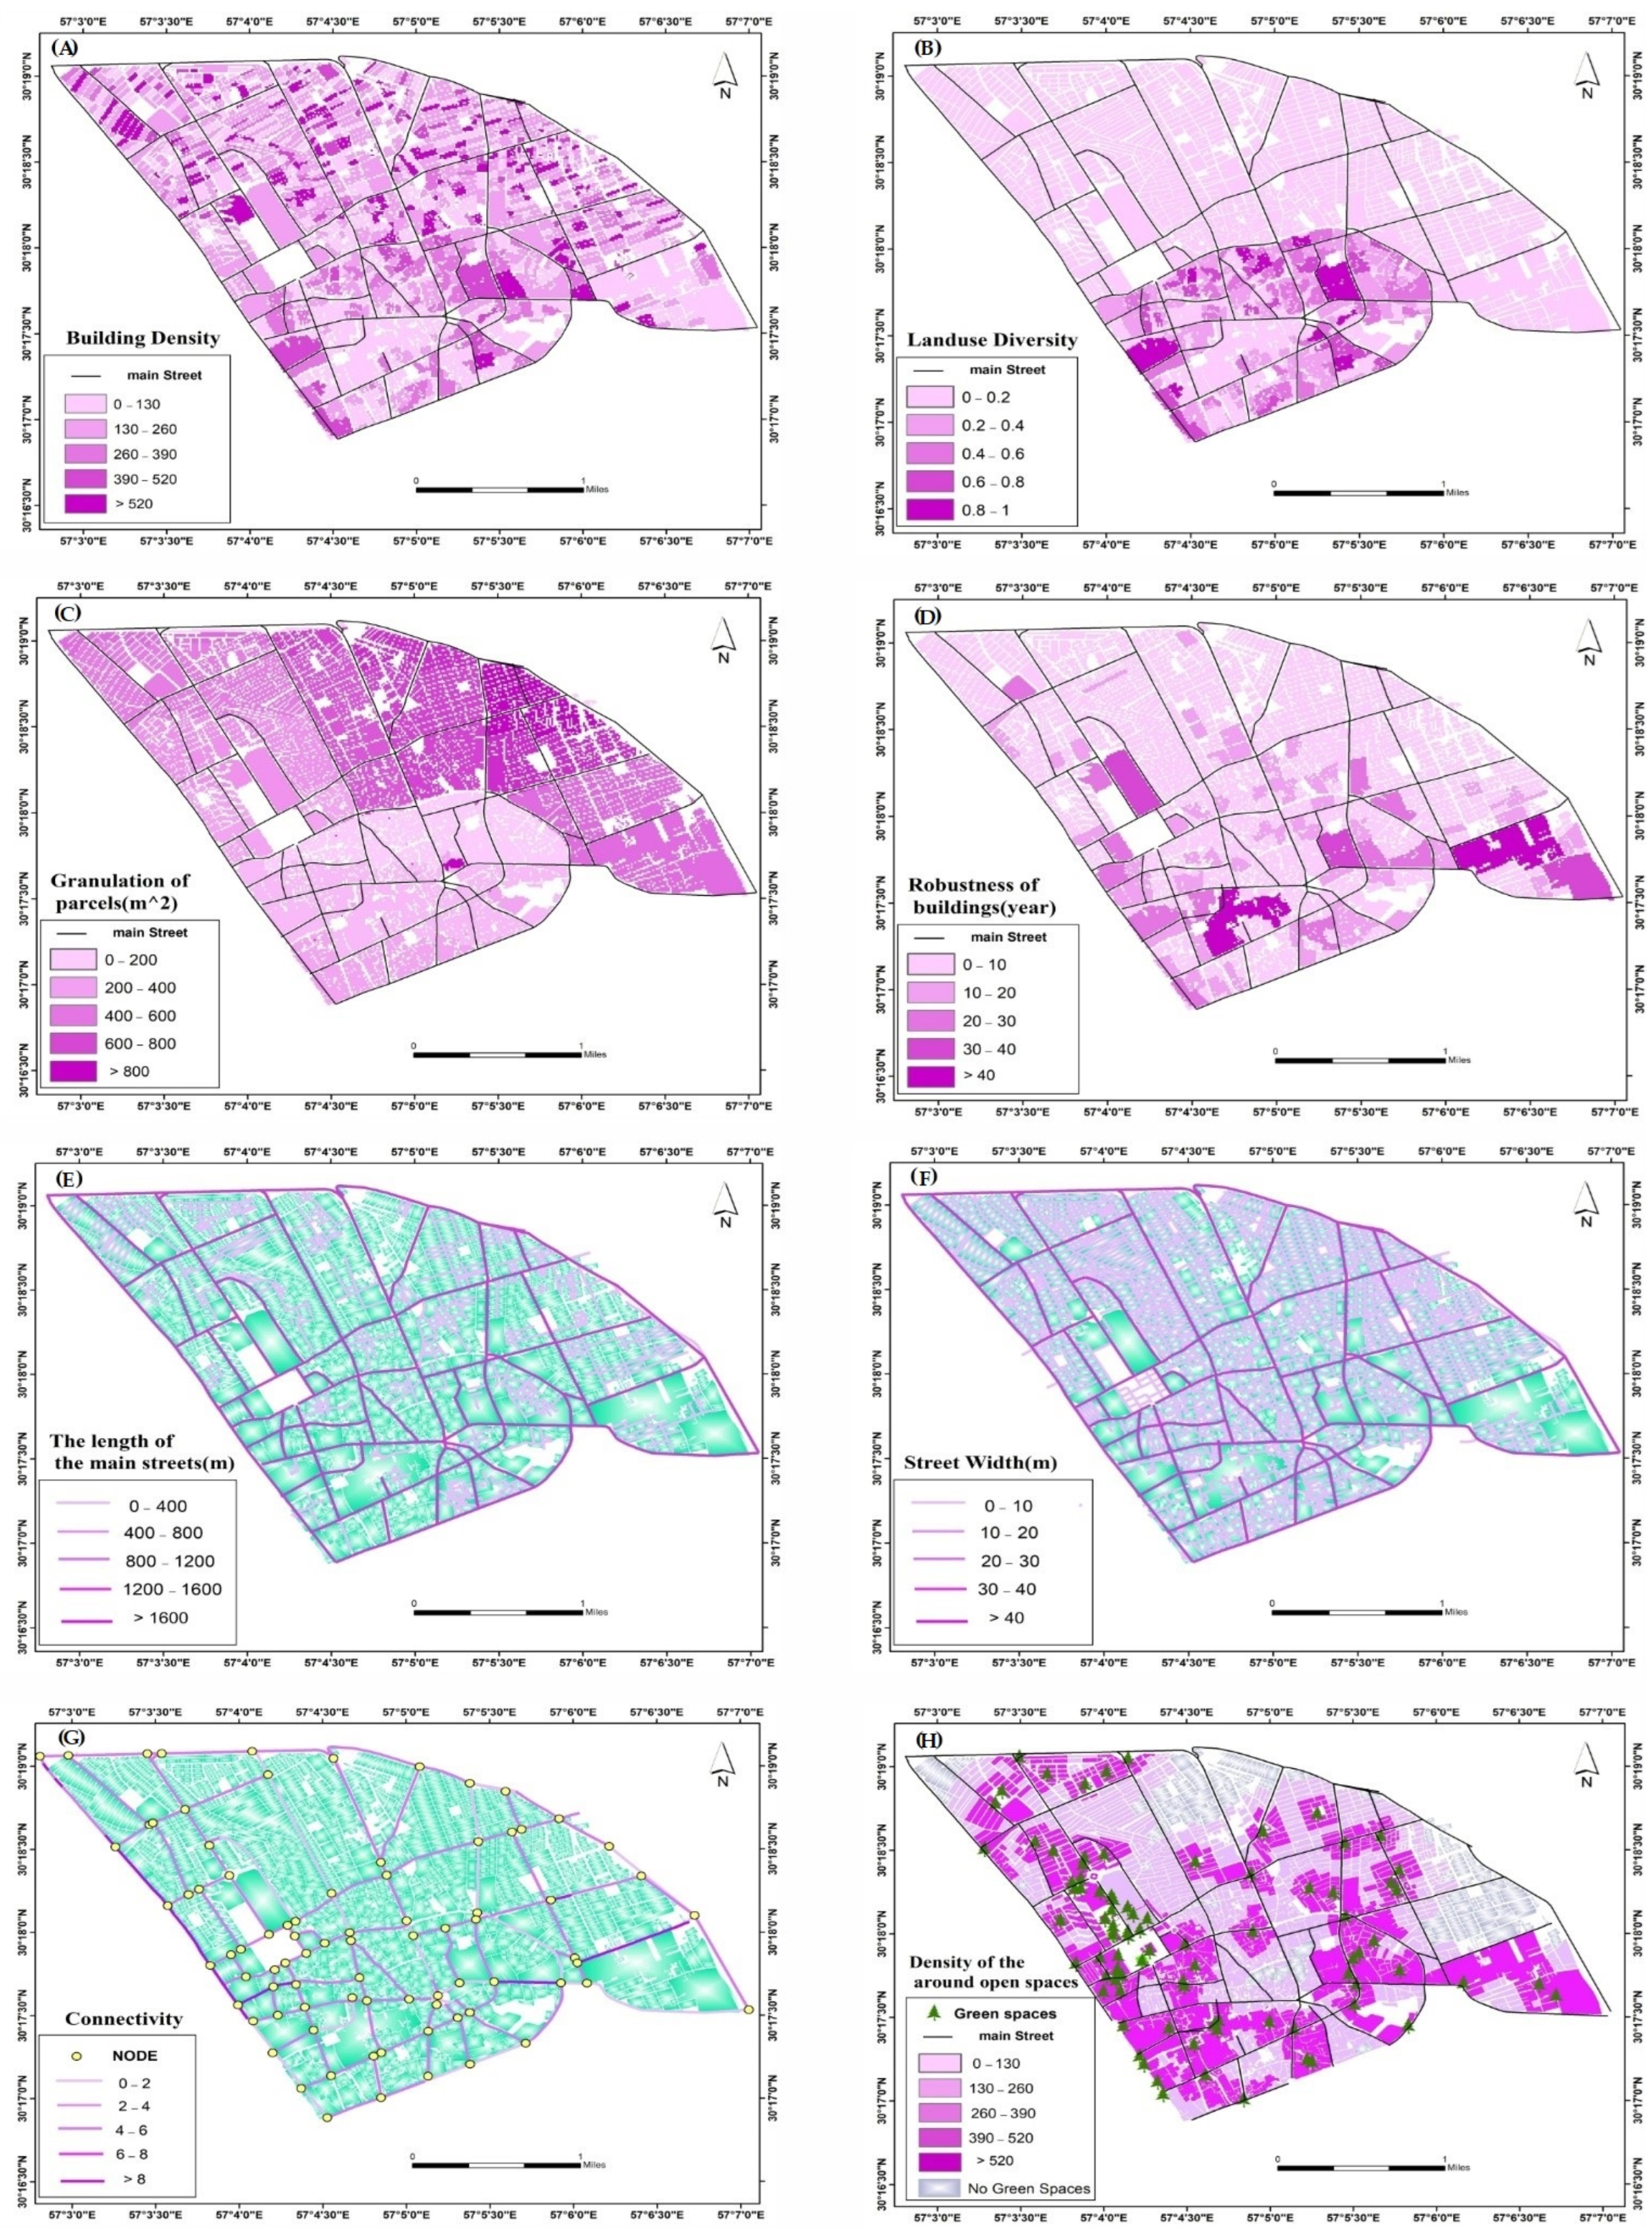
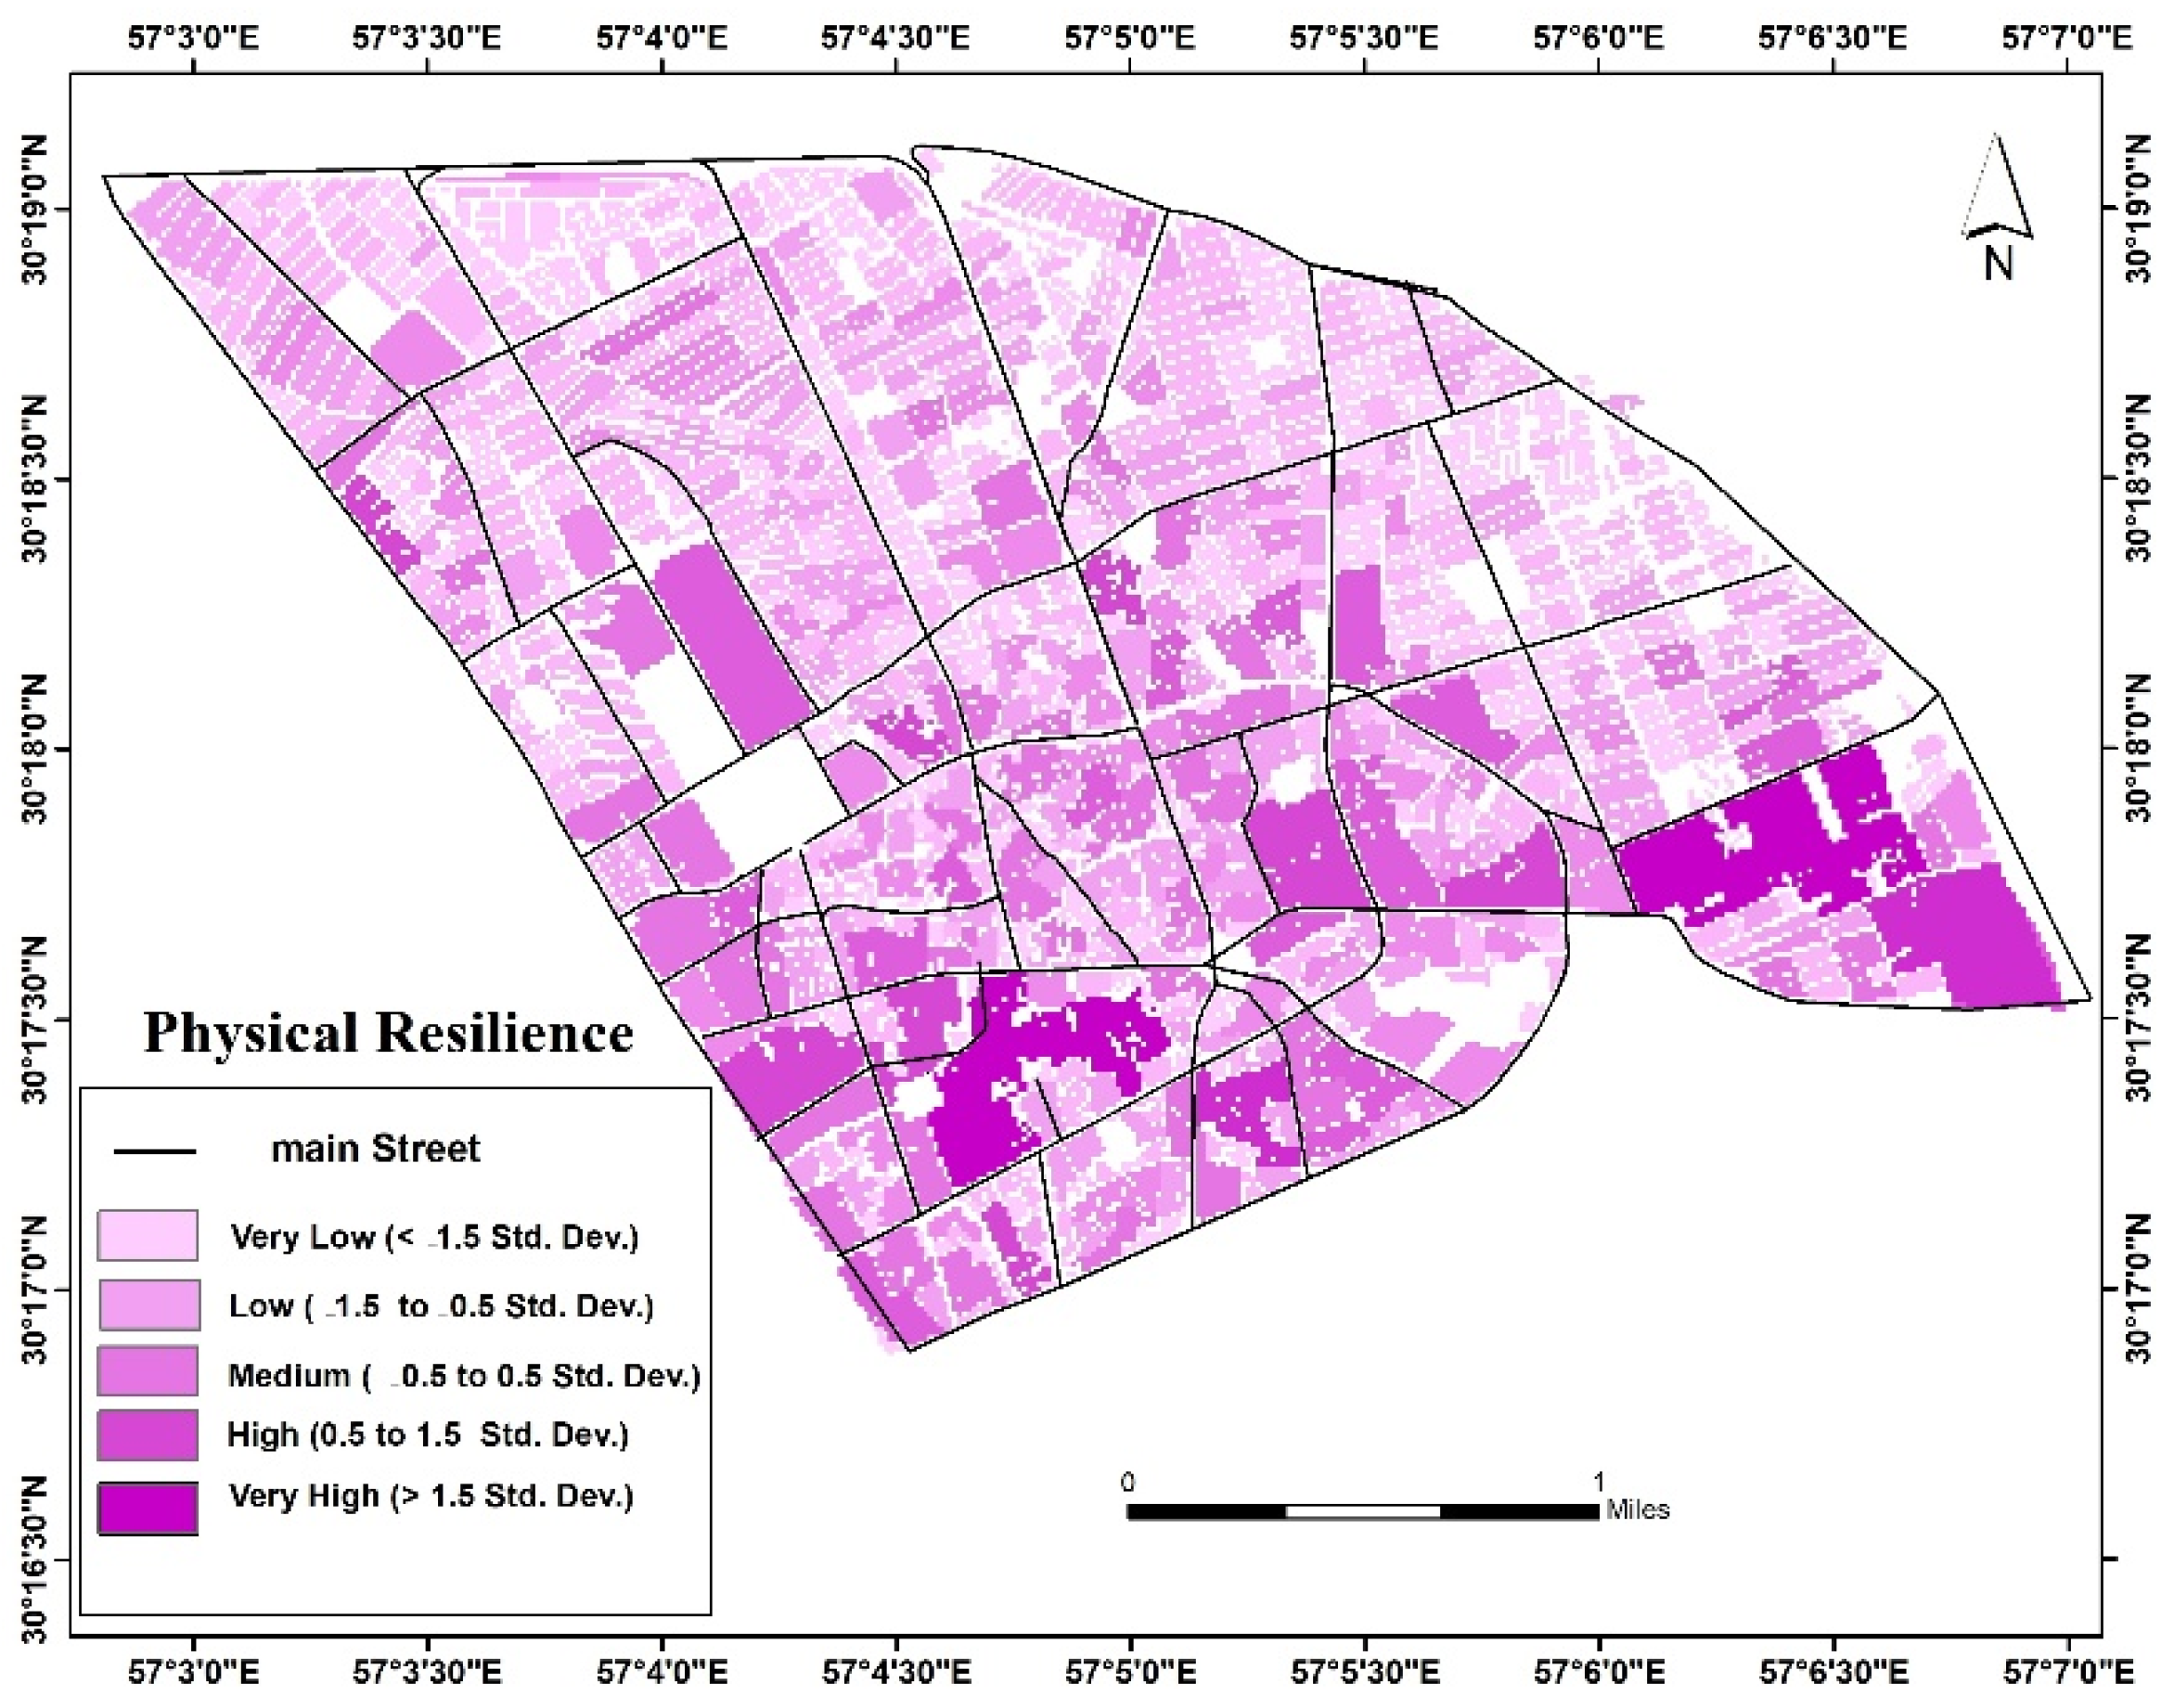
Table 1.
Urban physical indicators and related characteristics.
| Focus Area | Indicators | Relevant Resilience Characteristic | Measurement of Indicators | Effect on Resilience | Related References |
|---|---|---|---|---|---|
| Built Environment | Building Density (BD) | Modularity, Efficiency | The ratio of the built-up area of a building and the area of land | Negative | [39,40,42,87,88,89] |
| Land use Diversity (LUD) | Diversity, Redundancy, Modularity, Adaptability, Multifunctionality, Efficiency | Shannon entropy index | Positive | [28,39,87,88,89,90,91,92,93,94,95,96] | |
| Land uses Suitability (LUS) | Diversity, Redundancy, Modularity, Adaptability, Multifunctionality, Efficiency | Land uses compatibility matrix | Positive | ||
| Location status of hazardous uses such as gas stations (LHU) | Diversity, Redundancy, Modularity, Adaptability, Multifunctionality, Efficiency | Existing standards related to the placement and location of land uses | Positive | ||
| Distribution of uses (DOU) | Diversity, Redundancy, Modularity, Adaptability, Multifunctionality, Efficiency | Proximity Nearest index | Positive | ||
| Granulation of parcels (GOP) | Diversity, Adaptability | The ratio of the number of parcels to the total land area | Negative | [88,97,98] | |
| Robustness of buildings (ROB) | Robustness, Modularity, Efficiency | The strength of the building according to the number of years of construction | Positive | [39,99] | |
| Slope Ratio (SR) | Adaptability, Efficiency | Topographic maps and DEMs | Negative | [100] | |
| Access to emergency services centers (AEC) | Modularity, Adaptability, Efficiency | Accessibility | Positive | [28,95] | |
| Aspect Ratio (H/W) (AR) | Adaptability, Efficiency | The ratio of the height of the buildings to the width of the adjacent pathway | Negative | [88,98] | |
| Urban Network | The length of the main streets (LOS) | Connectivity, Redundancy, Modularity, Adaptability, Efficiency | The ratio of network area with arterial function to the total area | Positive | [39,100] |
| Street Width (SW) | Connectivity, Redundancy, Modularity, Adaptability, Efficiency | The numerical value of the width of the street | Positive | [100] | |
| Urban Network Type (UNT) | Diversity, Connectivity, Robustness, Modularity, Adaptability, Efficiency | The street network patterns such as grid, ring… | Positive | [82] | |
| Connectivity (CO) | Connectivity, Robustness, Modularity, Adaptability, Efficiency | The ratio of the number of links to the number of intersections in the street network | Positive | [7,88,89,100,101,102] | |
| Centrality (CE) | Connectivity, Robustness, Modularity, Adaptability, Efficiency | The ratio of the number of nodes to the total number of nodes | Negative | [7] | |
| Accessibility (A) | Connectivity, Robustness, Modularity, Adaptability, Efficiency | The maximum distance among all shortest distances between two intersections in the network | Positive | [38,88,103] | |
| Urban open and green spaces | Access to open and green spaces (AOGS) | Diversity, Modularity, Adaptability, Multifunctionality, Efficiency | Kernel Density | Positive | [20,38,40,84,87,88,89,98,104] |
| The size of open and green spaces (SOGS) | Adaptability, Multifunctionality, Efficiency | Area of open and urban green spaces | Positive | ||
| Proportion of open and green spaces (POGS) | Diversity, Connectivity, Modularity, Adaptability, Efficiency | The ratio of urban green and open spaces to the total land area | Positive | ||
| Density of the built environment around open spaces (DOBE) | Modularity, Adaptability, Efficiency | Balance Index | Negative |
Table 2.
Structural Self-Interaction Matrix
| BD | LUD | LUS | LHU | DOU | GOP | ROB | SR | AEC | AR | LOS | SW | UNT | CO | CE | A | AOGS | SOGS | POGS | DOBE | |
|---|---|---|---|---|---|---|---|---|---|---|---|---|---|---|---|---|---|---|---|---|
| BD (1) | X | O | V | V | O | X | O | V | X | X | X | X | O | X | V | V | X | V | X | |
| LUD (2) | X | X | X | O | A | O | V | O | O | O | A | A | A | V | V | O | V | A | ||
| LUS (3) | X | A | O | O | O | V | O | A | O | O | O | O | V | O | V | V | X | |||
| LHU (4) | X | V | O | O | O | O | O | A | A | V | A | V | O | O | O | O | ||||
| DOU (5) | O | X | A | X | O | A | A | A | A | A | X | V | V | X | A | |||||
| GOP (6) | A | A | O | O | O | O | O | V | O | O | O | O | O | O | ||||||
| ROB (7) | A | V | O | X | X | V | V | O | V | V | V | V | O | |||||||
| SR (8) | V | O | O | O | V | V | V | V | V | O | V | O | ||||||||
| AEC (9) | O | A | A | A | A | A | A | O | O | O | O | |||||||||
| AR (10) | X | A | O | V | O | V | O | O | O | O | ||||||||||
| LOS (11) | V | X | X | V | X | V | O | O | O | |||||||||||
| SW (12) | A | X | O | V | V | O | O | O | ||||||||||||
| UNT (13) | X | X | X | V | O | O | O | |||||||||||||
| CO (14) | X | X | V | O | O | A | ||||||||||||||
| CE (15) | V | V | V | V | A | |||||||||||||||
| A (16) | X | O | X | V | ||||||||||||||||
| AOGS (17) | A | A | A | |||||||||||||||||
| SOGS (18) | V | A | ||||||||||||||||||
| POGS (19) | A | |||||||||||||||||||
| DOBE (20) |
Table 3.
Representation of level partitioning.
| Factor | Reachability Set | Antecedent Set | Intersection Set |
|---|---|---|---|
| 1 | 1,2,3,4,5,6,7,9,10,11,12,13,14,15,16,17,18,19,20 | 1,2,3,4,5,7,8,10,11,12,13,14,15,16,18,20 | 1,2,3,4,5,7,10,11,12,13,14,15,16,18,20 |
| 2 | 1,2,3,4,5,6,7,9,10,11,12,13,14,15,16,17,18,19,20 | 1,2,3,4,5,6,7,8,9,10,11,12,13,14,15,16,18,19,20 | 1,2,3,4,5,6,7,9,10,11,12,13,14,15,16,18,19,20 |
| 3 | 1,2,3,4,5,9,11,13,14,15,16,17,18,19,20 | 1,2,3,4,5,7,8,9,10,11,12,13,14,15,16,19,20 | 1,2,3,4,5,9,11,13,14,15,16,19,20 |
| 4 | 1,2,3,4,5,7,9,11,12,13,14,15,16,17,18,19,20 | 1,2,3,4,5,7,8,9,10,11,12,13,14,15,16,18,19,20 | 1,2,3,4,5,7,9,11,12,13,14,15,16,18,19,20 |
| 5 | 1,2,3,4,5,6,7,9,11,12,13,14,16,17,18,19,20 | 1,2,3,4,5,6,7,8,9,10,11,12,13,14,15,16,17,18,19,20 | 1,2,3,4,5,6,7,9,11,12,13,14,16,17,18,19,20 |
| 6 | 2,5,6,9,11,12,13,14,15,16,17 | 1,2,5,6,7,8,11,12,13,15 | 2,5,6,11,12,13,15 |
| 7 | 1,2,3,4,5,6,7,9,10,11,12,13,14,15,16,17,18,19,20 | 1,2,4,5,7,8,9,10,11,12,13,14,15,16,18,19,20 | 1,2,4,5,7,9,10,11,12,13,14,15,16,18,19,20 |
| 8 | 1,2,3,4,5,6,7,8,9,11,12,13,14,15,16,17,18,19,20 | 8 | 8 |
| 9 | 2,3,4,5,7,9,16,17,18,19 | 1,2,3,4,5,6,7,8,9,10,11,12,13,14,15,16,17,18,19,20 | 2,3,4,5,7,9,16,17,18,19 |
| 10 | 1,2,3,4,5,7,9,10,11,12,13,14,15,16,17,18,19,20 | 1,2,7,10,11,12,13,14,15,16,18,20 | 1,2,7,10,11,12,13,14,15,16,18,20 |
| 11 | 1,2,3,4,5,6,7,9,10,11,12,13,14,15,16,17,18,19,20 | 1,2,3,4,5,6,7,8,10,11,12,13,14,15,16,17,18,19,20 | 1,2,3,4,5,6,7,10,11,12,13,14,15,16,17,18,19,20 |
| 12 | 1,2,3,4,5,6,7,9,10,11,12,13,14,15,16,17,18,19,20 | 1,2,4,5,6,7,8,10,11,12,13,14,15,16,18,20 | 1,2,4,5,6,7,10,11,12,13,14,15,16,18,20 |
| 13 | 1,2,3,4,5,6,7,9,10,11,12,13,14,15,16,17,18,19,20 | 1,2,3,4,5,6,7,8,10,11,12,13,14,15,16,17,18,19,20 | 1,2,3,4,5,6,7,10,11,12,13,14,15,16,17,18,19,20 |
| 14 | 1,2,3,4,5,7,9,10,11,12,13,14,15,16,17,18,19,20 | 1,2,3,4,5,6,7,8,10,11,12,13,14,15,16,17,19,20 | 1,2,3,4,5,7,10,11,12,13,14,15,16,17,19,20 |
| 15 | 1,2,3,4,5,6,7,9,10,11,12,13,14,15,16,17,18,19,20 | 1,2,3,4,6,7,8,10,11,12,13,14,15,16,18,20 | 1,2,3,4,6,7,10,11,12,13,14,15,16,18,20 |
| 16 | 1,2,3,4,5,7,9,10,11,12,13,14,15,16,17,18,19,20 | 1,2,3,4,5,6,7,8,9,10,11,12,13,14,15,16,17,18,19,20 | 1,2,3,4,5,7,9,10,11,12,13,14,15,16,17,18,19,20 |
| 17 | 5,9,11,13,14,16,17,19,20 | 1,2,3,4,5,6,7,8,9,10,11,12,13,14,15,16,17,18,19,20 | 5,9,11,13,14,16,17,19,20 |
| 18 | 1,2,4,5,7,9,10,11,12,13,15,16,17,18,19,20 | 1,2,3,4,5,7,8,9,10,11,12,13,14,15,16,18,19,20 | 1,2,4,5,7,9,10,11,12,13,15,16,18,19,20 |
| 19 | 1,2,3,4,5,7,9,11,13,14,16,17,18,19,20 | 1,2,3,4,5,7,8,9,10,11,12,13,14,15,16,17,18,19,20 | 1,2,3,4,5,7,9,11,13,14,16,17,18,19,20 |
| 20 | 1,2,3,4,5,7,9,10,11,12,13,14,15,16,17,18,19,20 | 1,2,3,4,5,7,8,10,11,12,13,14,15,16,17,18,19,20 | 1,2,3,4,5,7,10,11,12,13,14,15,16,17,18,19,20 |
| L1 = {5,9,16,17,19} | |||
| 1 | 1,2,3,4,6,7,10,11,12,13,14,15,18,20 | 1,2,3,4,7,8,10,11,12,13,14,15,18,20 | 1,2,3,4,7,10,11,12,13,14,15,18,20 |
| 2 | 1,2,3,4,6,7,10,11,12,13,14,15,18,20 | 1,2,3,4,6,7,8,10,11,12,13,14,15,18,20 | 1,2,3,4,6,7,10,11,12,13,14,15,18,20 |
| 3 | 1,2,3,4,11,13,14,15,18,20 | 1,2,3,4,7,8,10,11,12,13,14,15,20 | 1,2,3,4,11,13,14,15,20 |
| 4 | 1,2,3,4,7,11,12,13,14,15,18,20 | 1,2,3,4,7,8,10,11,12,13,14,15,18,20 | 1,2,3,4,7,11,12,13,14,15,18,20 |
| 6 | 2,6,7,11,12,13,14,15 | 1,2,6,7,8,11,12,13,15 | 2,6,7,11,12,13,15 |
| 7 | 1,2,3,4,6,7,10,11,12,13,14,15,18,20 | 1,2,4,7,8,10,11,12,13,14,15,18,20 | 1,2,4,7,10,11,12,13,14,15,18,20 |
| 8 | 1,2,3,4,6,7,8,11,12,13,14,15,18,20 | 8 | 8 |
| 10 | 1,2,3,4,7,10,11,12,13,14,15,18,20 | 1,2,7,10,11,12,13,14,15,18,20 | 1,2,7,10,11,12,13,14,15,18,20 |
| 11 | 1,2,3,4,6,7,10,11,12,13,14,15,18,20 | 1,2,3,4,6,7,8,10,11,12,13,14,15,18,20 | 1,2,3,4,6,7,10,11,12,13,14,15,18,20 |
| 12 | 1,2,3,4,6,7,10,11,12,13,14,15,18,20 | 1,2,4,6,7,8,10,11,12,13,14,15,18,20 | 1,2,4,6,7,10,11,12,13,14,15,18,20 |
| 13 | 1,2,3,4,6,7,10,11,12,13,14,15,18,20 | 1,2,3,4,6,7,8,10,11,12,13,14,15,18,20 | 1,2,3,4,6,7,10,11,12,13,14,15,18,20 |
| 14 | 1,2,3,4,7,10,11,12,13,14,15,18,20 | 1,2,3,4,6,7,8,10,11,12,13,14,15,20 | 1,2,3,4,7,10,11,12,13,14,15,20 |
| 15 | 1,2,3,4,6,7,10,11,12,13,14,15,18,20 | 1,2,3,4,6,7,8,10,11,12,13,14,15,18,20 | 1,2,3,4,6,7,10,11,12,13,14,15,18,20 |
| 18 | 1,2,4,7,10,11,12,13,15,18,20 | 1,2,3,4,7,8,10,11,12,13,14,15,18,20 | 1,2,4,7,10,11,12,13,15,18,20 |
| 20 | 1,2,3,4,7,10,11,12,13,14,15,18,20 | 1,2,3,4,7,8,10,11,12,13,14,15,18,20 | 1,2,3,4,7,10,11,12,13,14,15,18,20 |
| L2 = {2,11,13,15,18,20} | |||
| 1 | 1,3,4,6,7,10,12,14 | 1,3,4,7,8,10,12,14 | 1,3,4,7,10,12,14 |
| 3 | 1,3,4,14 | 1,3,4,7,8,10,12,14 | 1,3,4,14 |
| 4 | 1,3,4,7,12,14 | 1,3,4,7,8,10,12,14 | 1,3,4,7,12,14 |
| 6 | 6,12,14 | 1,6,7,8,12 | 6,12 |
| 7 | 1,3,4,6,7,10,12,14 | 1,3,4,7,8,10,12,14 | 1,3,4,7,10,12,14 |
| 8 | 1,3,4,6,7,8,12,14 | 8 | 8 |
| 10 | 1,3,4,7,10,12,14 | 1,7,10,12,14 | 1,7,10,12,14 |
| 12 | 1,3,4,6,7,10,12,14 | 1,4,6,7,8,10,12,14 | 1,4,6,7,10,12,14 |
| 14 | 1,3,4,7,10,12,14 | 1,3,4,6,7,8,10,12,14 | 1,3,4,7,10,12,14 |
| L3 = {3,4,14} | |||
| 1 | 1,6,7,10,12 | 1,7,8,10,12 | 1,7,10,12 |
| 6 | 6,12 | 1,6,7,8,12 | 6,12 |
| 7 | 1,6,7,10,12 | 1,7,8,10,12 | 1,7,10,12 |
| 8 | 1,6,7,8,12 | 8 | 8 |
| 10 | 1,7,10,12 | 1,7,10,12 | 1,7,10,12 |
| 12 | 1,6,7,10,12 | 1,6,7,8,10,12 | 1,6,7,10,12 |
| L4 = {6,10,12} | |||
| 1 | 1,7 | 1,7,8 | 1,7 |
| 7 | 1,7 | 1,7,8 | 1,7 |
| 8 | 1,7,8 | 1,7,8 | 1,7,8 |
| L5 = {1,7,8} | |||
Table 4.
The Weighted supermatrix
| BD | LUD | LUS | LHU | DOU | GOP | ROB | SR | AEC | AR | |
|---|---|---|---|---|---|---|---|---|---|---|
| BD | 0 | 0.09996 | 0.09655 | 0.06874 | 0.09077 | 0.09614 | 0.06655 | 0.09601 | 0.13517 | 0.09259 |
| LUD | 0.02852 | 0 | 0.03626 | 0 | 0.04213 | 0.04296 | 0.04033 | 0.03884 | 0 | 0.03824 |
| LUS | 0.04844 | 0.04803 | 0 | 0.04983 | 0.05575 | 0.05408 | 0.04933 | 0.03734 | 0.06733 | 0.04915 |
| LHU | 0.04554 | 0.03557 | 0.04146 | 0 | 0.04794 | 0.05318 | 0.04223 | 0.04345 | 0.05833 | 0.04374 |
| DOU | 0.05935 | 0.06744 | 0.04985 | 0.06016 | 0 | 0.06109 | 0.05684 | 0.05035 | 0.07334 | 0.06026 |
| GOP | 0.07376 | 0.06514 | 0.0646 | 0.06914 | 0.07126 | 0.05398 | 0 | 0.06767 | 0.10175 | 0.07197 |
| ROB | 0.07686 | 0.09475 | 0.11257 | 0.08725 | 0.09848 | 0 | 0.08066 | 0.08269 | 0.12166 | 0.08208 |
| SR | 0.02492 | 0.02912 | 0.02764 | 0.03352 | 0 | 0 | 0.02772 | 0 | 0 | 0.02562 |
| AEC | 0.05494 | 0.05193 | 0.04457 | 0.05504 | 0.06305 | 0.05238 | 0.05474 | 0.03053 | 0 | 0.05325 |
| AR | 0.08096 | 0.09645 | 0.07461 | 0.07266 | 0.07746 | 0.08252 | 0.08186 | 0.04525 | 0.13467 | 0 |
| LOS | 0.03313 | 0.03712 | 0.03272 | 0.04113 | 0.03433 | 0.04266 | 0.03592 | 0.07709 | 0 | 0.03193 |
| SW | 0.08036 | 0.07995 | 0.07301 | 0.07265 | 0.08567 | 0.07231 | 0.07635 | 0.03654 | 0.09555 | 0.07787 |
| UNT | 0.03693 | 0.03662 | 0.03395 | 0.04573 | 0.03693 | 0.04326 | 0.04313 | 0.06687 | 0 | 0.03353 |
| CO | 0.06435 | 0.04883 | 0.05138 | 0.05784 | 0.06705 | 0.05308 | 0.05354 | 0.03544 | 0.06813 | 0.05455 |
| CE | 0.07286 | 0.06273 | 0.05996 | 0.05072 | 0.06295 | 0.0641 | 0.06024 | 0.05066 | 0.07114 | 0.06596 |
| A | 0.06645 | 0.07194 | 0.05803 | 0.05844 | 0.06205 | 0.0657 | 0.07205 | 0.05987 | 0.07294 | 0.06977 |
| AOGS | 0.05354 | 0.03802 | 0.04793 | 0.05133 | 0.05575 | 0.04767 | 0.04643 | 0.05967 | 0 | 0.04905 |
| SOGS | 0.02832 | 0 | 0.0268 | 0.03692 | 0 | 0.03385 | 0.03503 | 0.03624 | 0 | 0.0283 |
| POGS | 0.04053 | 0.03641 | 0.03806 | 0.04723 | 0.04844 | 0.04146 | 0.04313 | 0.04845 | 0 | 0.04119 |
| DOBE | 0.03022 | 0 | 0.03005 | 0.04167 | 0 | 0.03956 | 0.03392 | 0.03704 | 0 | 0.03097 |
| LOS | SW | UNT | CO | CE | A | AOGS | SOGS | POGS | DOBE | |
| BD | 0.08088 | 0.09307 | 0.07858 | 0.08128 | 0.09238 | 0.07046 | 0.09463 | 0.08588 | 0.09196 | 0.0983 |
| LUD | 0.04084 | 0.04324 | 0.03994 | 0.04205 | 0.04164 | 0.03973 | 0 | 0.04434 | 0.03542 | 0.03694 |
| LUS | 0.04714 | 0.04894 | 0.04264 | 0.04044 | 0.04985 | 0.05224 | 0.06152 | 0.04904 | 0.05202 | 0.03874 |
| LHU | 0.04464 | 0.04724 | 0.04174 | 0.06298 | 0.05145 | 0.04544 | 0 | 0 | 0.04377 | 0.03533 |
| DOU | 0.04765 | 0.06365 | 0.05035 | 0.05783 | 0.07036 | 0.06435 | 0.07232 | 0.04954 | 0.05524 | 0.05445 |
| GOP | 0.07397 | 0.07166 | 0.07387 | 0.0836 | 0.07897 | 0.06725 | 0.08071 | 0.05785 | 0.06007 | 0.06456 |
| ROB | 0.07057 | 0.09408 | 0.08999 | 0.07794 | 0.09919 | 0.08857 | 0.11233 | 0.07136 | 0.08844 | 0.0959 |
| SR | 0.02833 | 0.03353 | 0.03103 | 0.05348 | 0.04424 | 0.02722 | 0 | 0.03703 | 0.0319 | 0.02703 |
| AEC | 0.04935 | 0.04914 | 0.05295 | 0.06601 | 0.06526 | 0.05314 | 0.05972 | 0.04584 | 0.04809 | 0.04464 |
| AR | 0.08839 | 0.07756 | 0.08469 | 0.03932 | 0.09188 | 0.08186 | 0.08542 | 0.07116 | 0.07858 | 0.08268 |
| LOS | 0 | 0 | 0 | 0 | 0 | 0.03343 | 0.04121 | 0.04254 | 0.04729 | 0.03213 |
| SW | 0.07457 | 0 | 0.07708 | 0.04842 | 0.08017 | 0.07536 | 0.09242 | 0.07557 | 0.0654 | 0.08609 |
| UNT | 0.03063 | 0.04073 | 0 | 0 | 0 | 0.03743 | 0.04085 | 0.04604 | 0.03562 | 0.03303 |
| CO | 0.05215 | 0.04754 | 0.04665 | 0 | 0.06396 | 0.05674 | 0.06772 | 0.05965 | 0.04719 | 0.04665 |
| CE | 0.06056 | 0.06585 | 0.07387 | 0.05014 | 0 | 0.06315 | 0.05902 | 0.06556 | 0.05564 | 0.05475 |
| A | 0.06586 | 0.06695 | 0.07267 | 0.05297 | 0.06856 | 0 | 0.07772 | 0.06276 | 0.0648 | 0.06356 |
| AOGS | 0.04655 | 0.04724 | 0.04515 | 0.04913 | 0.05635 | 0.04644 | 0 | 0.04144 | 0.04286 | 0.03914 |
| SOGS | 0.03113 | 0.03293 | 0.03143 | 0.05297 | 0 | 0.02892 | 0 | 0 | 0.03461 | 0.03674 |
| POGS | 0.04053 | 0.03641 | 0.03806 | 0.04723 | 0.04844 | 0.04146 | 0.04313 | 0.04845 | 0 | 0.04119 |
| DOBE | 0.03022 | 0 | 0.03005 | 0.04167 | 0 | 0.03956 | 0.03392 | 0.03704 | 0 | 0.03097 |
Table 5.
Relative importance values in paired comparisons (Adapted from [61]).
Table 5.
Relative importance values in paired comparisons (Adapted from [61]).
| Rank of Importance | Definition | Description |
|---|---|---|
| 1 | Equal importance | Two elements are equally important to achieve the goal |
| 3 | Some more important | One element is slightly more important than the other |
| 5 | Much more important | One element is more important than the other |
| 7 | Very much important | One element is much more important than the other |
| 9 | Extremely important | One element is quite more important than the other |
| 2,4,6,8 | Intermediate values between adjoining values | Comparison times are required |
| Reciprocals above | Reciprocal for inverse comparison | In inverse comparison, the inverse number must be considered |
Table 6.
Normalized Matrix and weight of characteristics.
| Diversity | Connectivity | Redundancy | Robustness | Modularity | Adaptability | Multifunctionality | Efficiency | Weights | |
|---|---|---|---|---|---|---|---|---|---|
| Diversity | 0.033 | 0.014 | 0.022 | 0.045 | 0.038 | 0.048 | 0.029 | 0.030 | 0.032 |
| Connectivity | 0.200 | 0.082 | 0.054 | 0.105 | 0.057 | 0.065 | 0.118 | 0.121 | 0.100 |
| Redundancy | 0.167 | 0.164 | 0.109 | 0.079 | 0.227 | 0.097 | 0.118 | 0.121 | 0.135 |
| Robustness | 0.233 | 0.247 | 0.435 | 0.314 | 0.227 | 0.388 | 0.294 | 0.242 | 0.297 |
| Modularity | 0.100 | 0.164 | 0.054 | 0.157 | 0.113 | 0.097 | 0.118 | 0.121 | 0.116 |
| Adaptability | 0.133 | 0.247 | 0.217 | 0.157 | 0.227 | 0.194 | 0.235 | 0.182 | 0.199 |
| Multifunctionality | 0.067 | 0.041 | 0.054 | 0.063 | 0.057 | 0.048 | 0.059 | 0.121 | 0.064 |
| Efficiency | 0.067 | 0.041 | 0.054 | 0.079 | 0.057 | 0.064 | 0.029 | 0.061 | 0.056 |
Publisher’s Note: MDPI stays neutral with regard to jurisdictional claims in published maps and institutional affiliations. |
© 2022 by the authors. Licensee MDPI, Basel, Switzerland. This article is an open access article distributed under the terms and conditions of the Creative Commons Attribution (CC BY) license (https://creativecommons.org/licenses/by/4.0/).
Share and Cite
MDPI and ACS Style
Parizi, S.M.; Taleai, M.; Sharifi, A. A GIS-Based Multi-Criteria Analysis Framework to Evaluate Urban Physical Resilience against Earthquakes. Sustainability 2022, 14, 5034. https://0-doi-org.brum.beds.ac.uk/10.3390/su14095034
AMA Style
Parizi SM, Taleai M, Sharifi A. A GIS-Based Multi-Criteria Analysis Framework to Evaluate Urban Physical Resilience against Earthquakes. Sustainability. 2022; 14(9):5034. https://0-doi-org.brum.beds.ac.uk/10.3390/su14095034
Chicago/Turabian StyleParizi, Sedigheh Meimandi, Mohammad Taleai, and Ayyoob Sharifi. 2022. "A GIS-Based Multi-Criteria Analysis Framework to Evaluate Urban Physical Resilience against Earthquakes" Sustainability 14, no. 9: 5034. https://0-doi-org.brum.beds.ac.uk/10.3390/su14095034
Note that from the first issue of 2016, this journal uses article numbers instead of page numbers. See further details here.