Monitoring Land Use: Capturing Change through an Information Fusion Approach †

Abstract
:1. Introduction
2. Research Methodology
2.1. Overview of Data Mining and Text Analysis
2.2. Overview of Information Fusion
3. Applied Methods
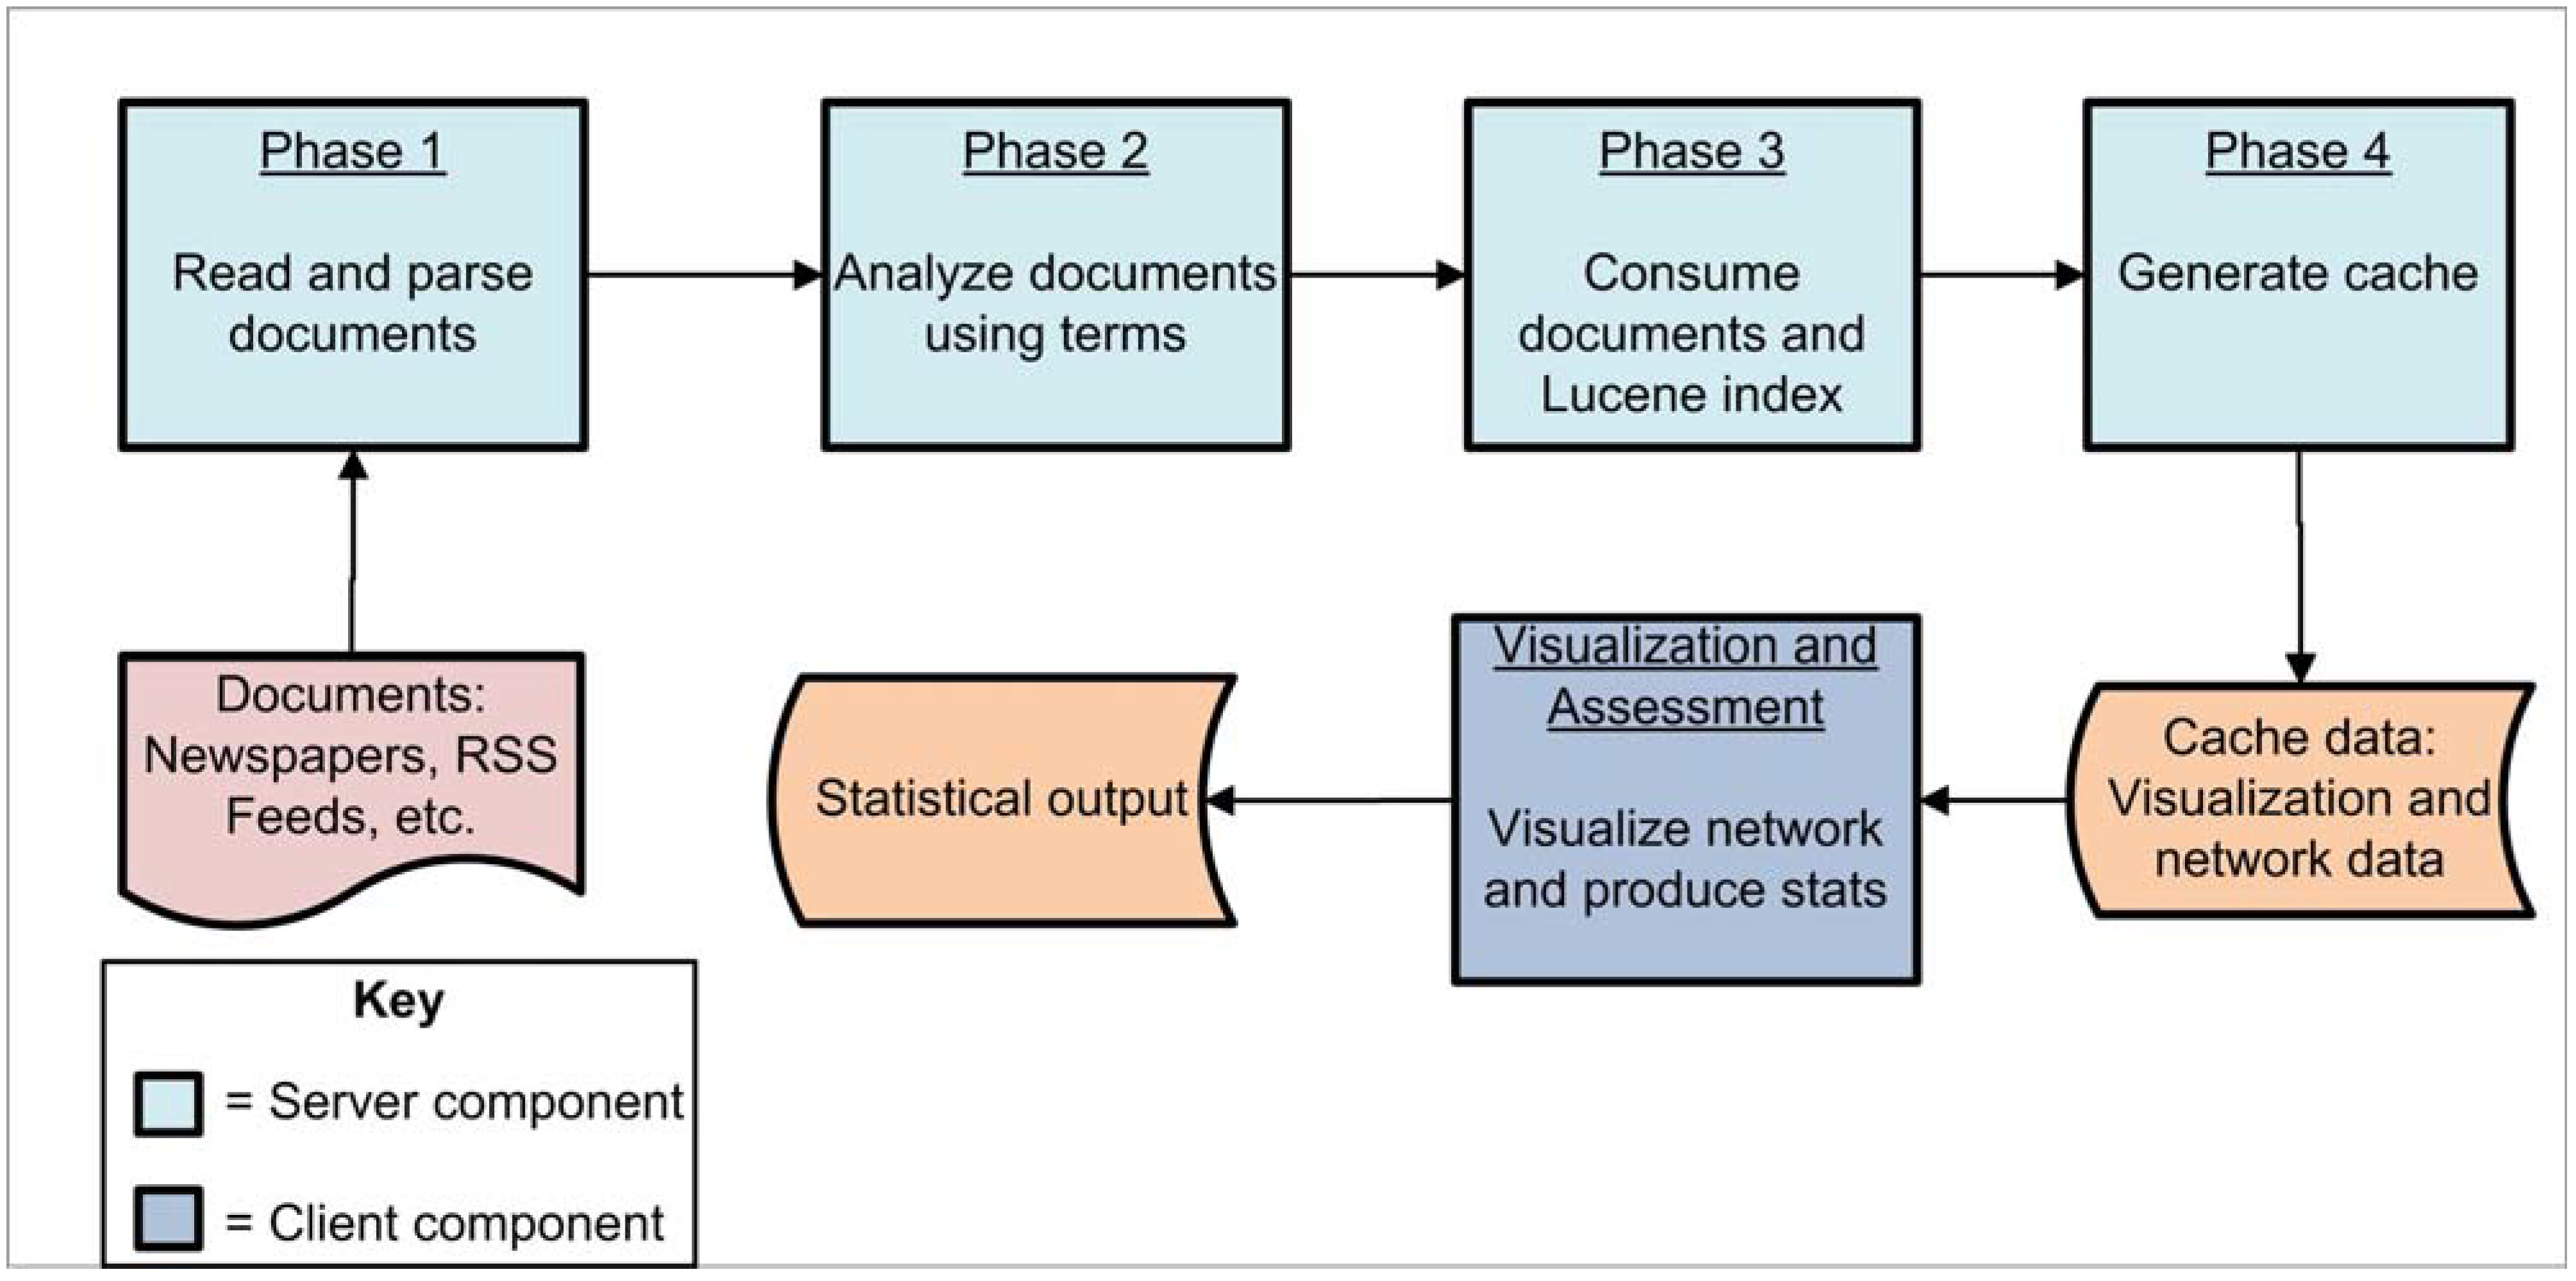
3.1. Phase 1
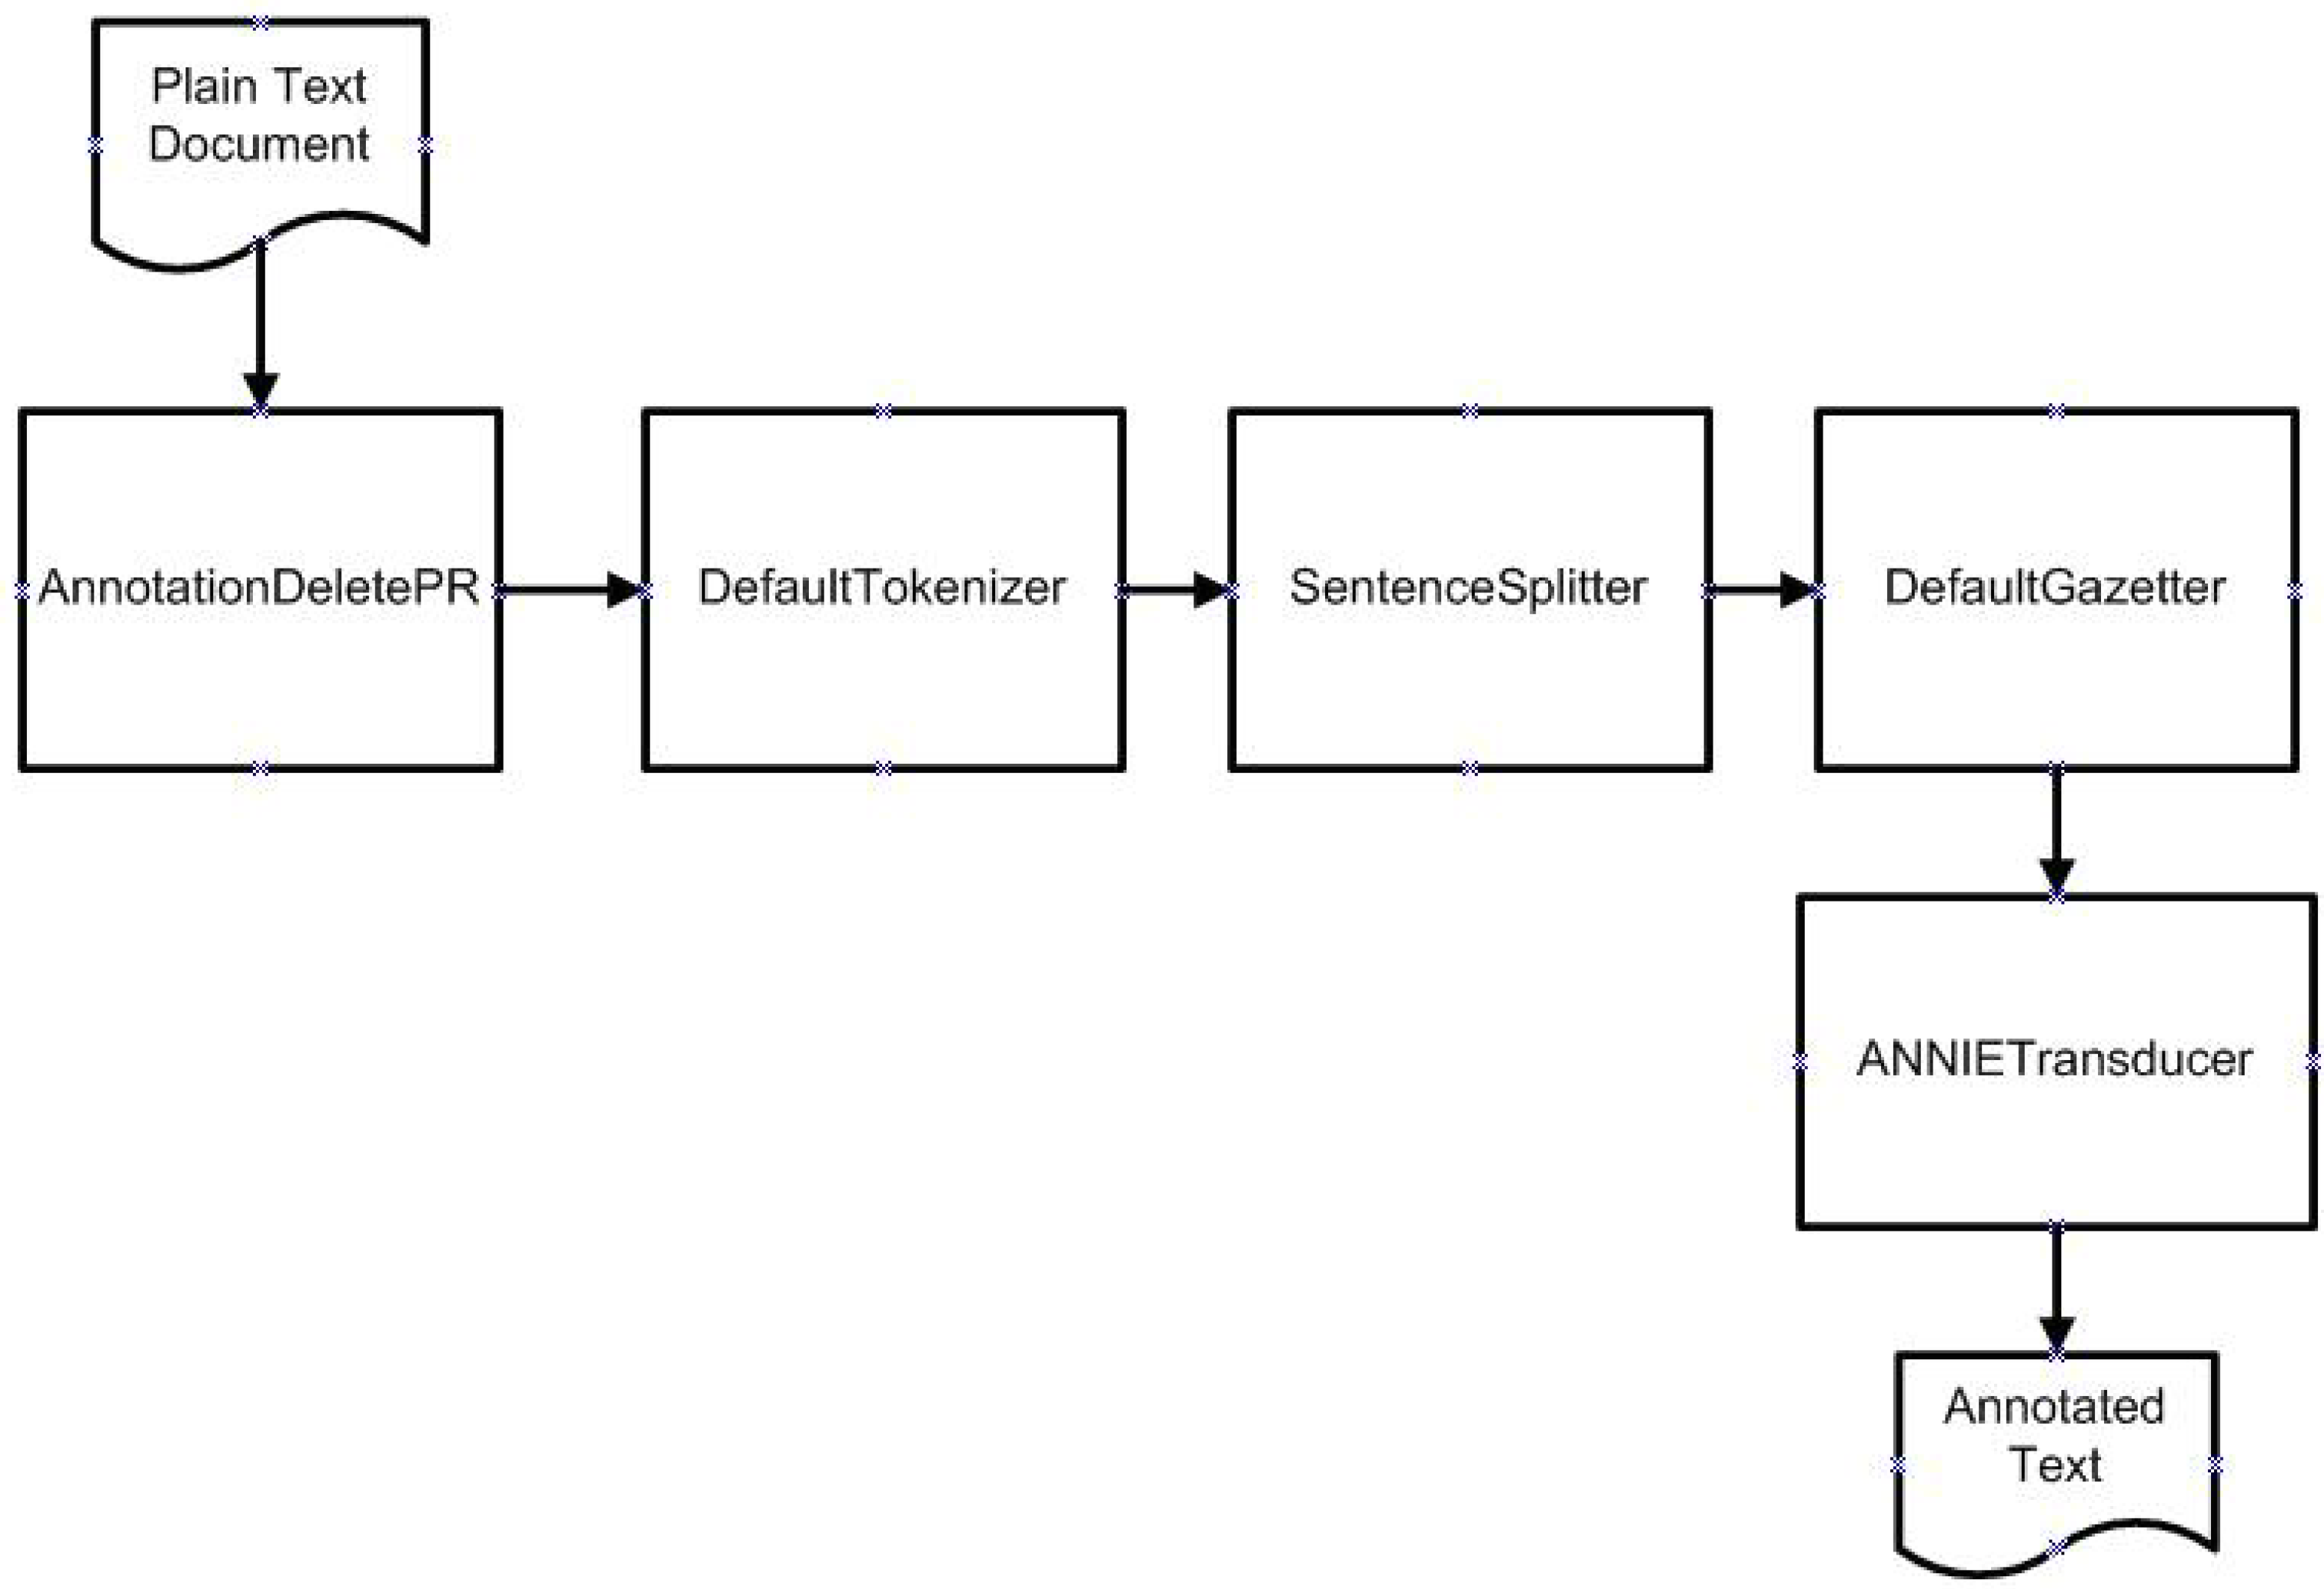
3.2. Phase 2
- Rule: Agriculture
- (
- {Lookup.majorType == agriculture}
- )
- :agriculture -->
- :agriculture.Agriculture = {kind = “Agriculture”, canonicalName = :agriculture.Lookup.cName, rule = “Agriculture”}

3.3. Phase 3
3.4. Phase 4
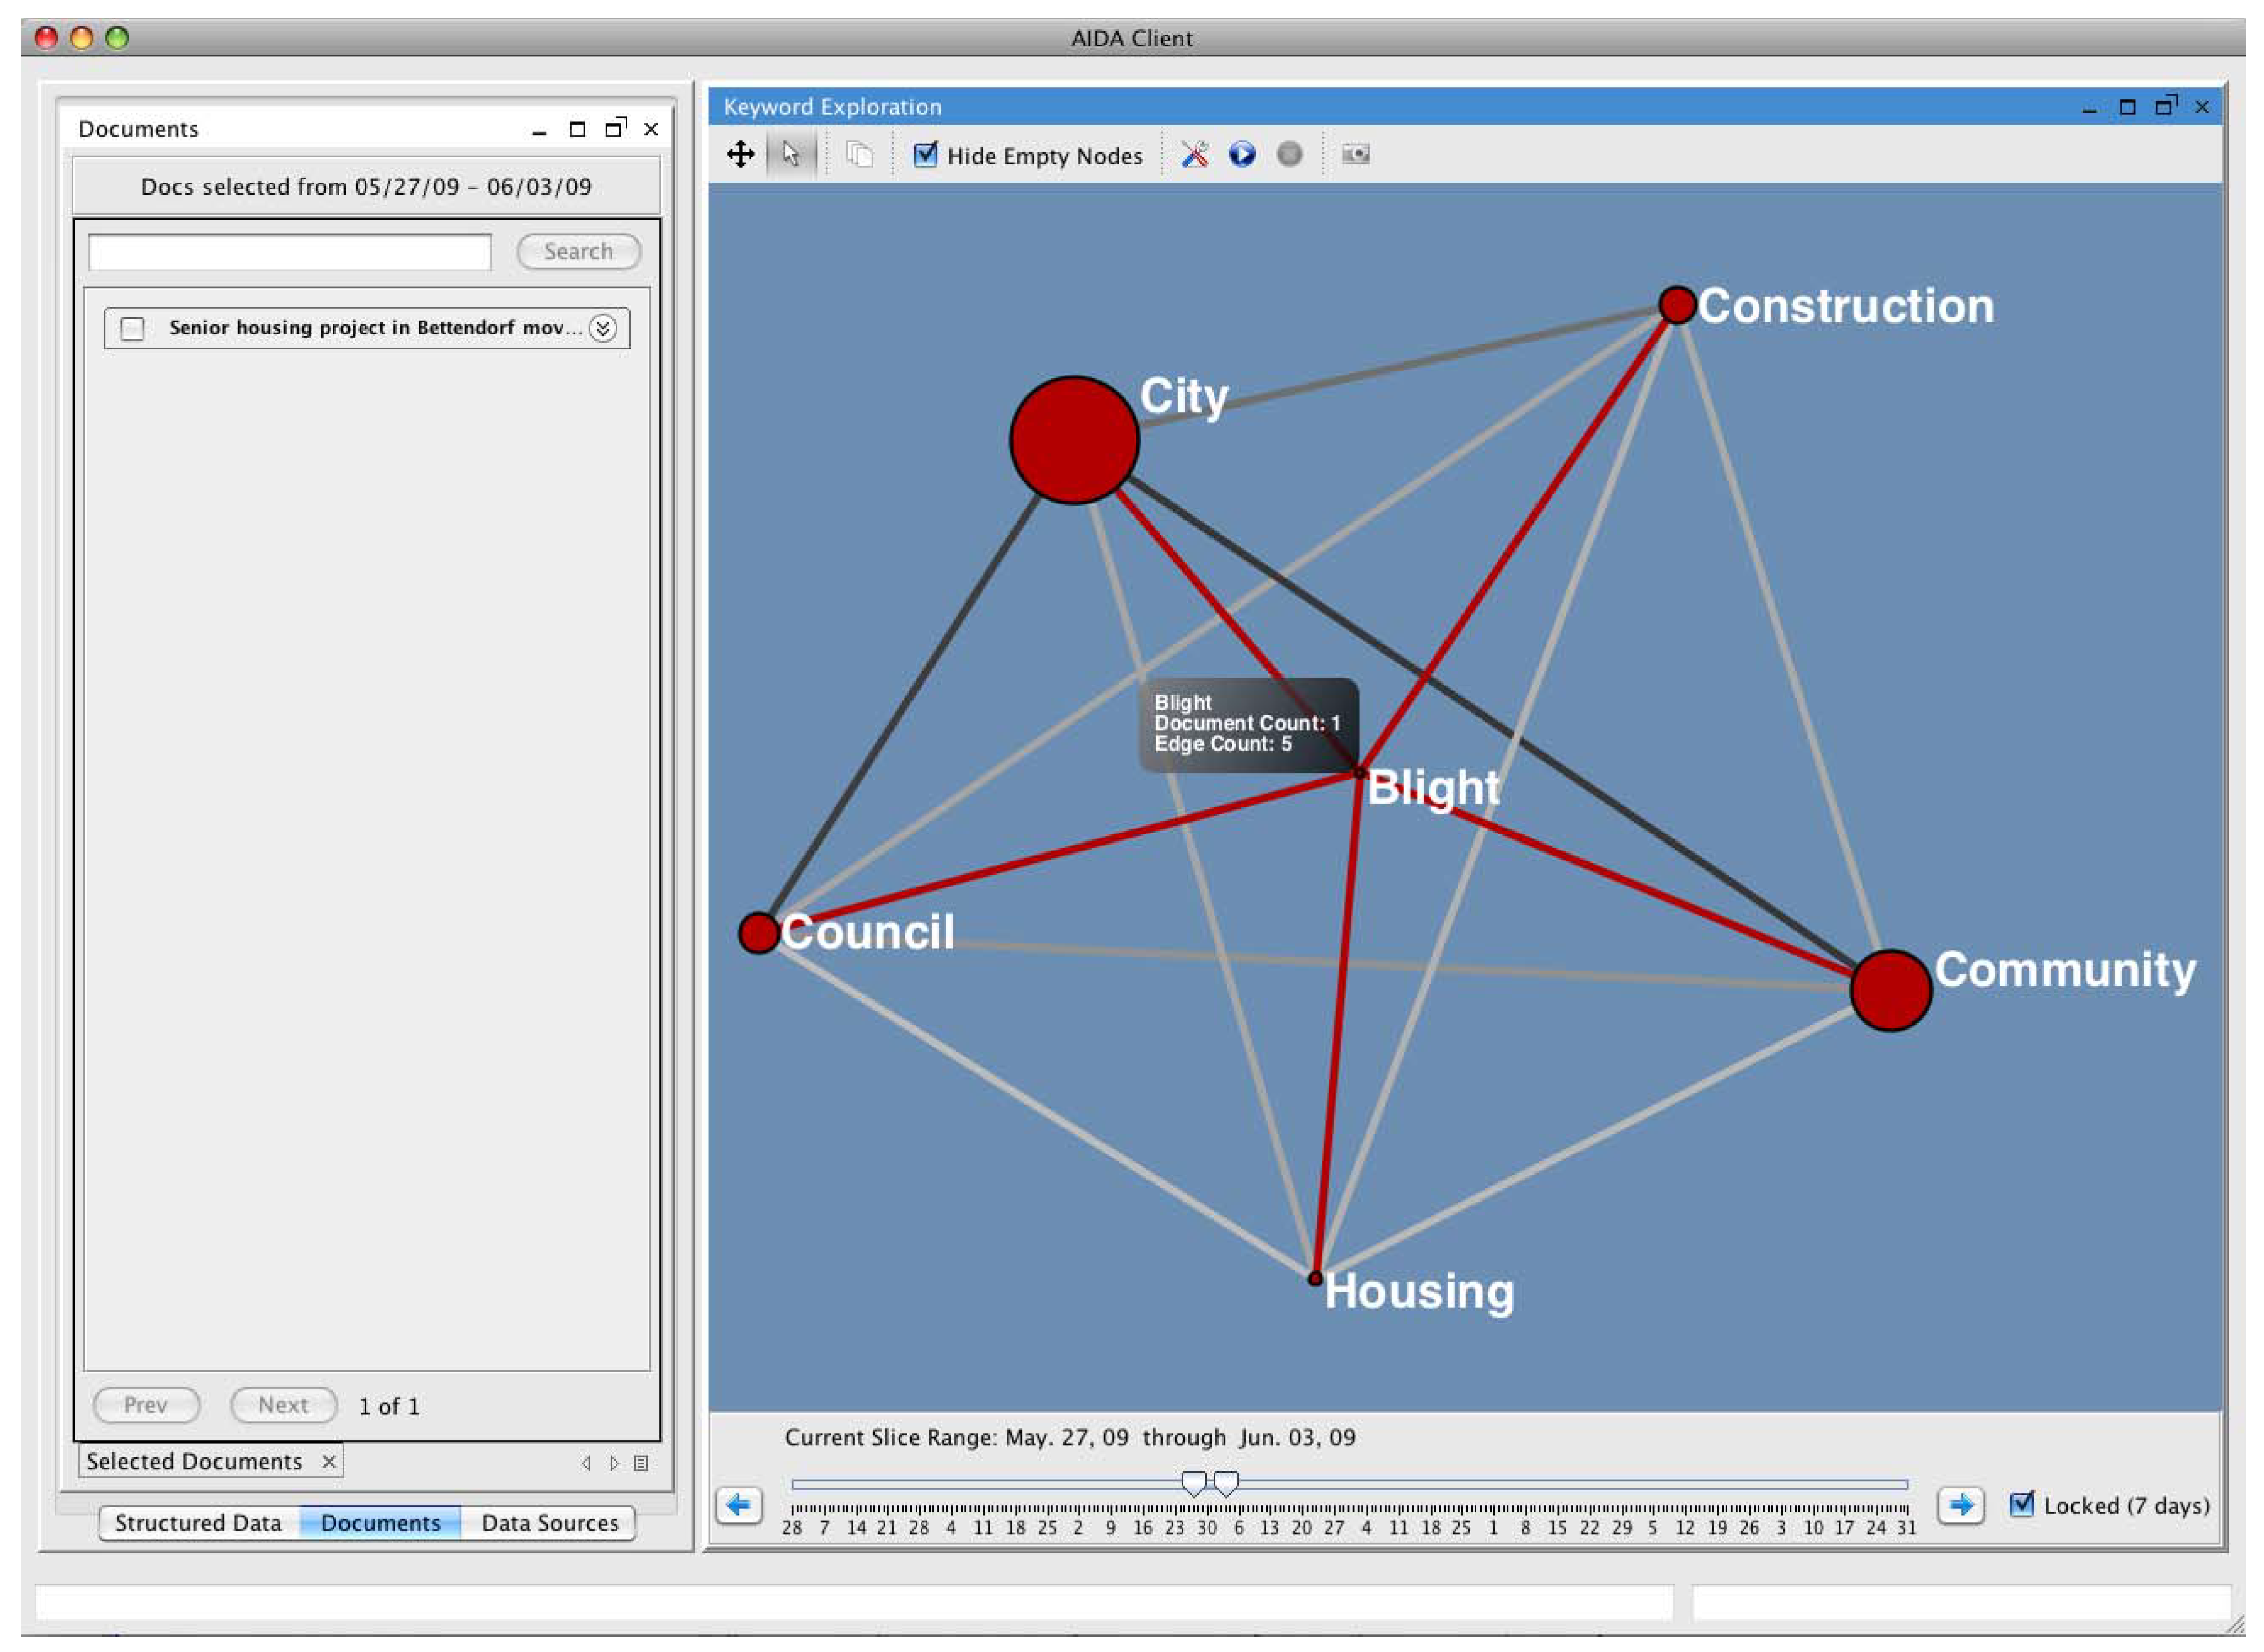
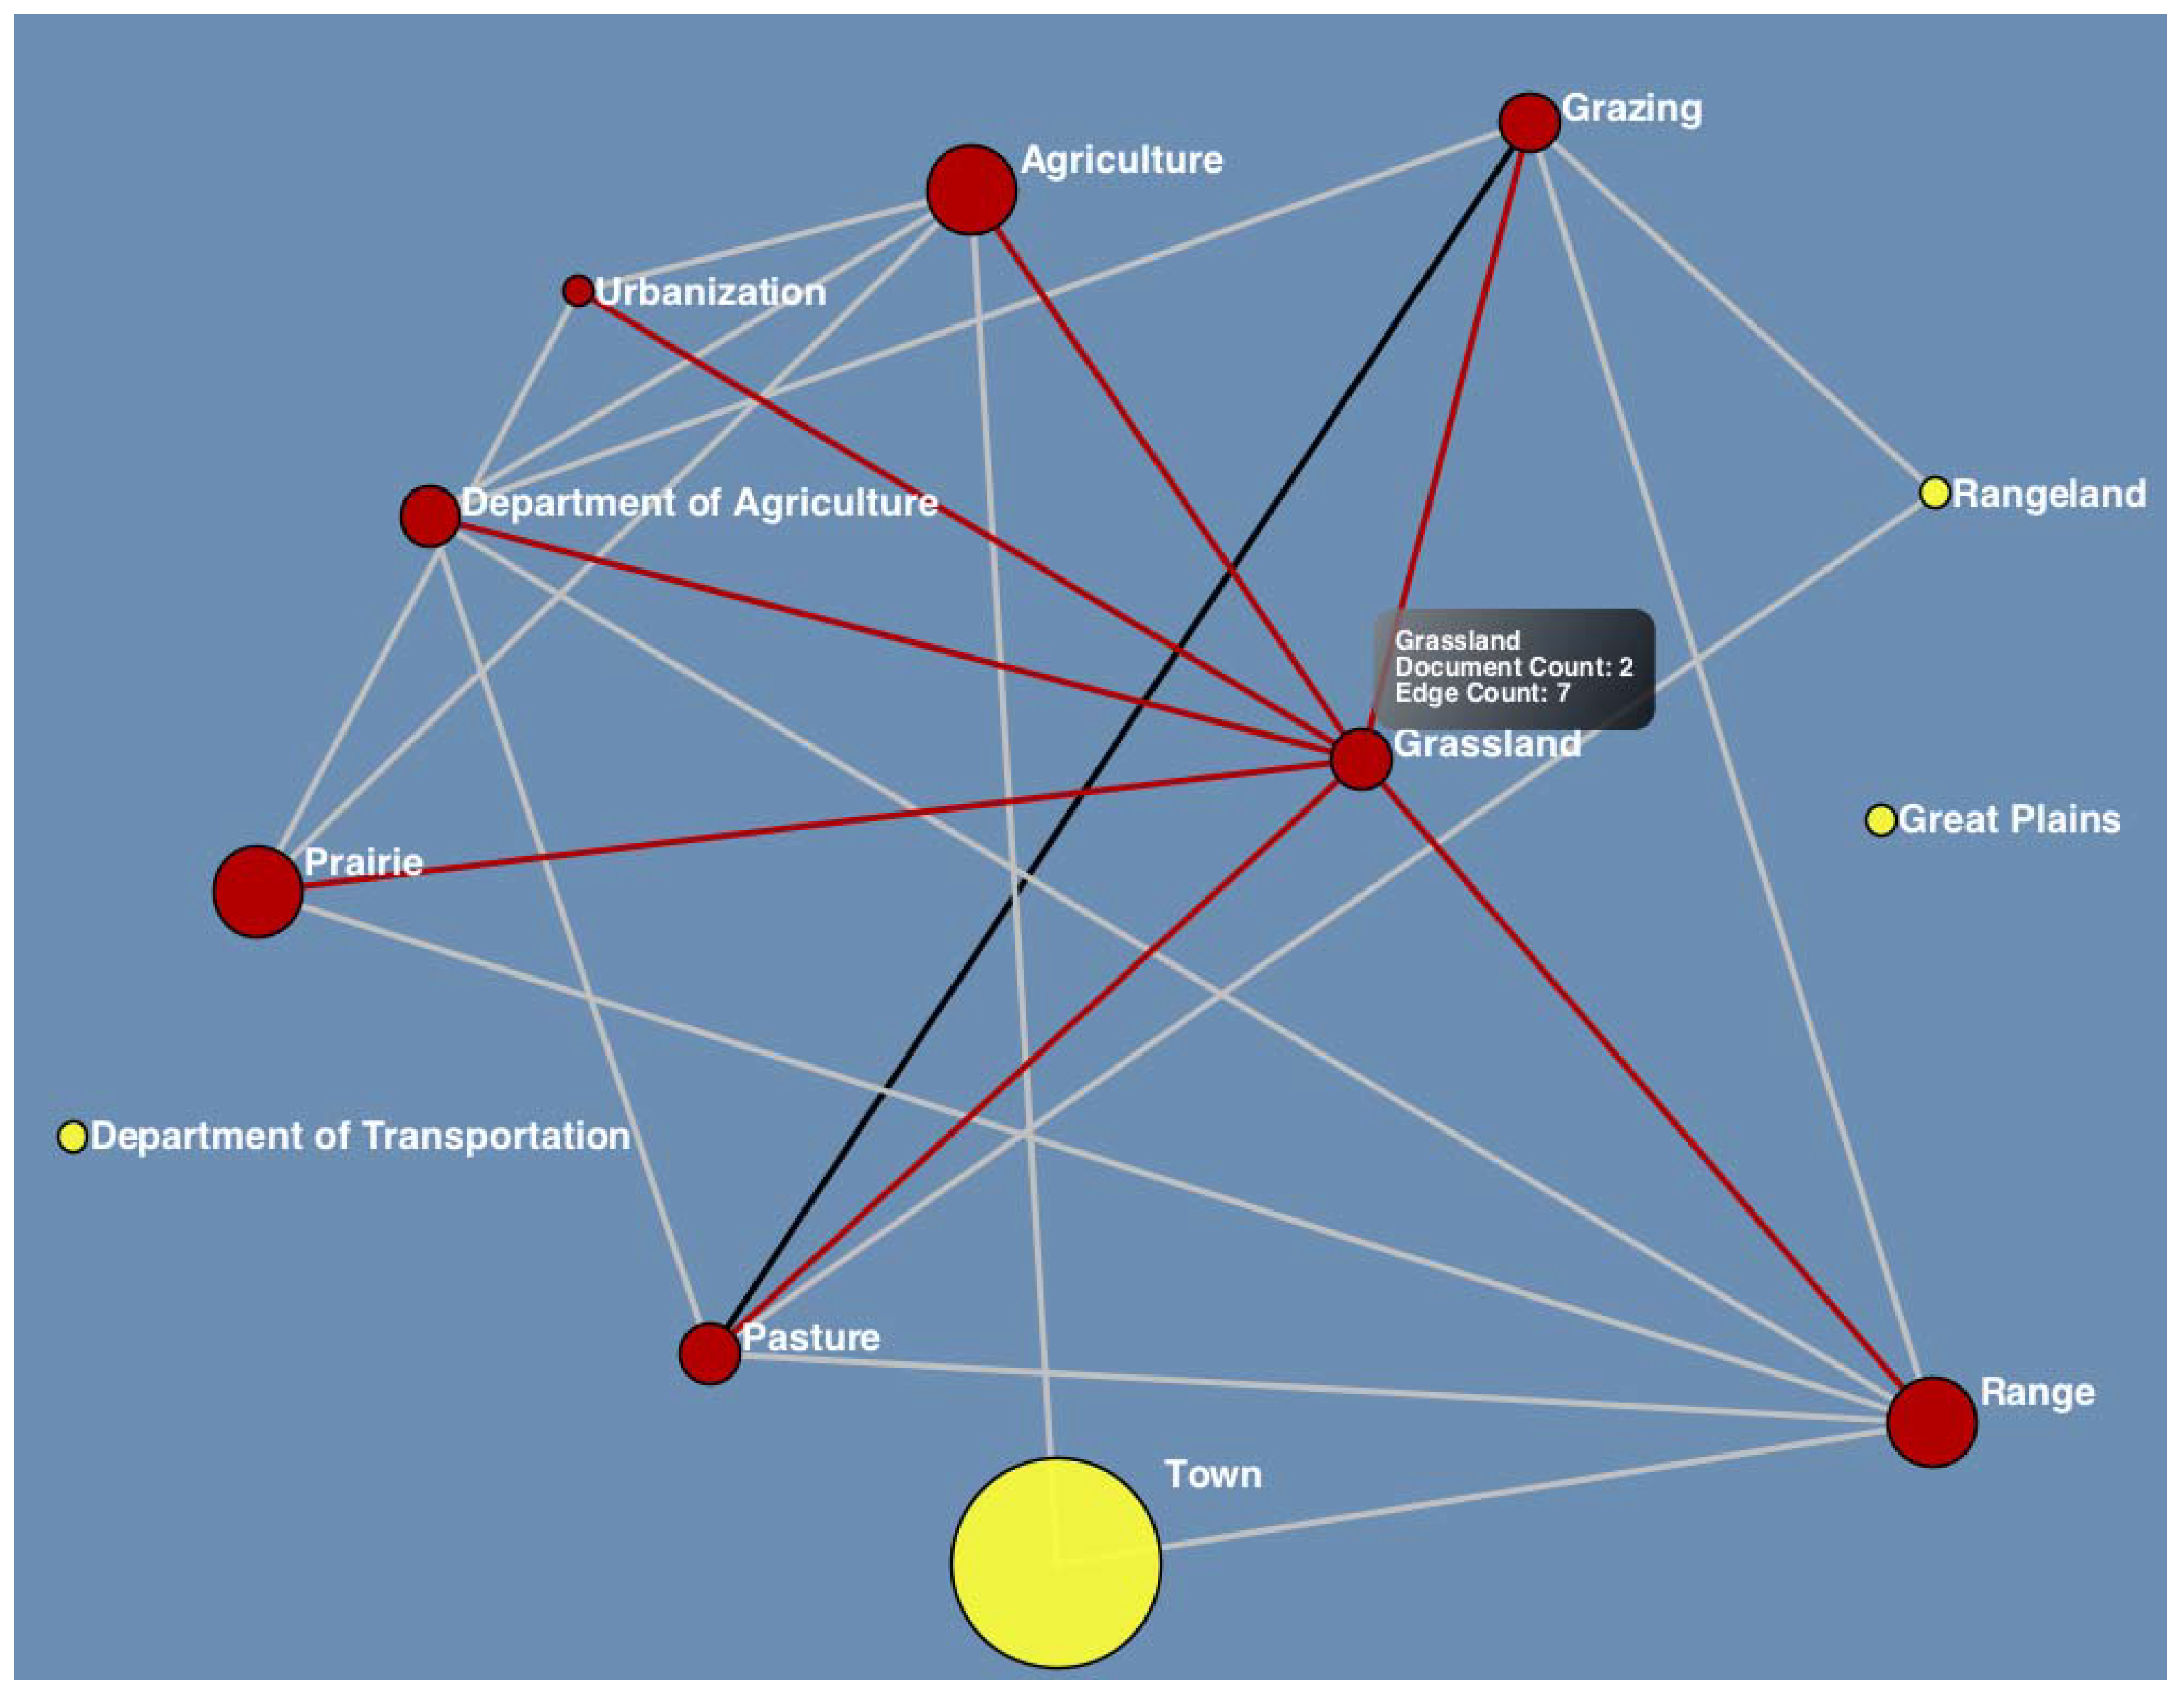
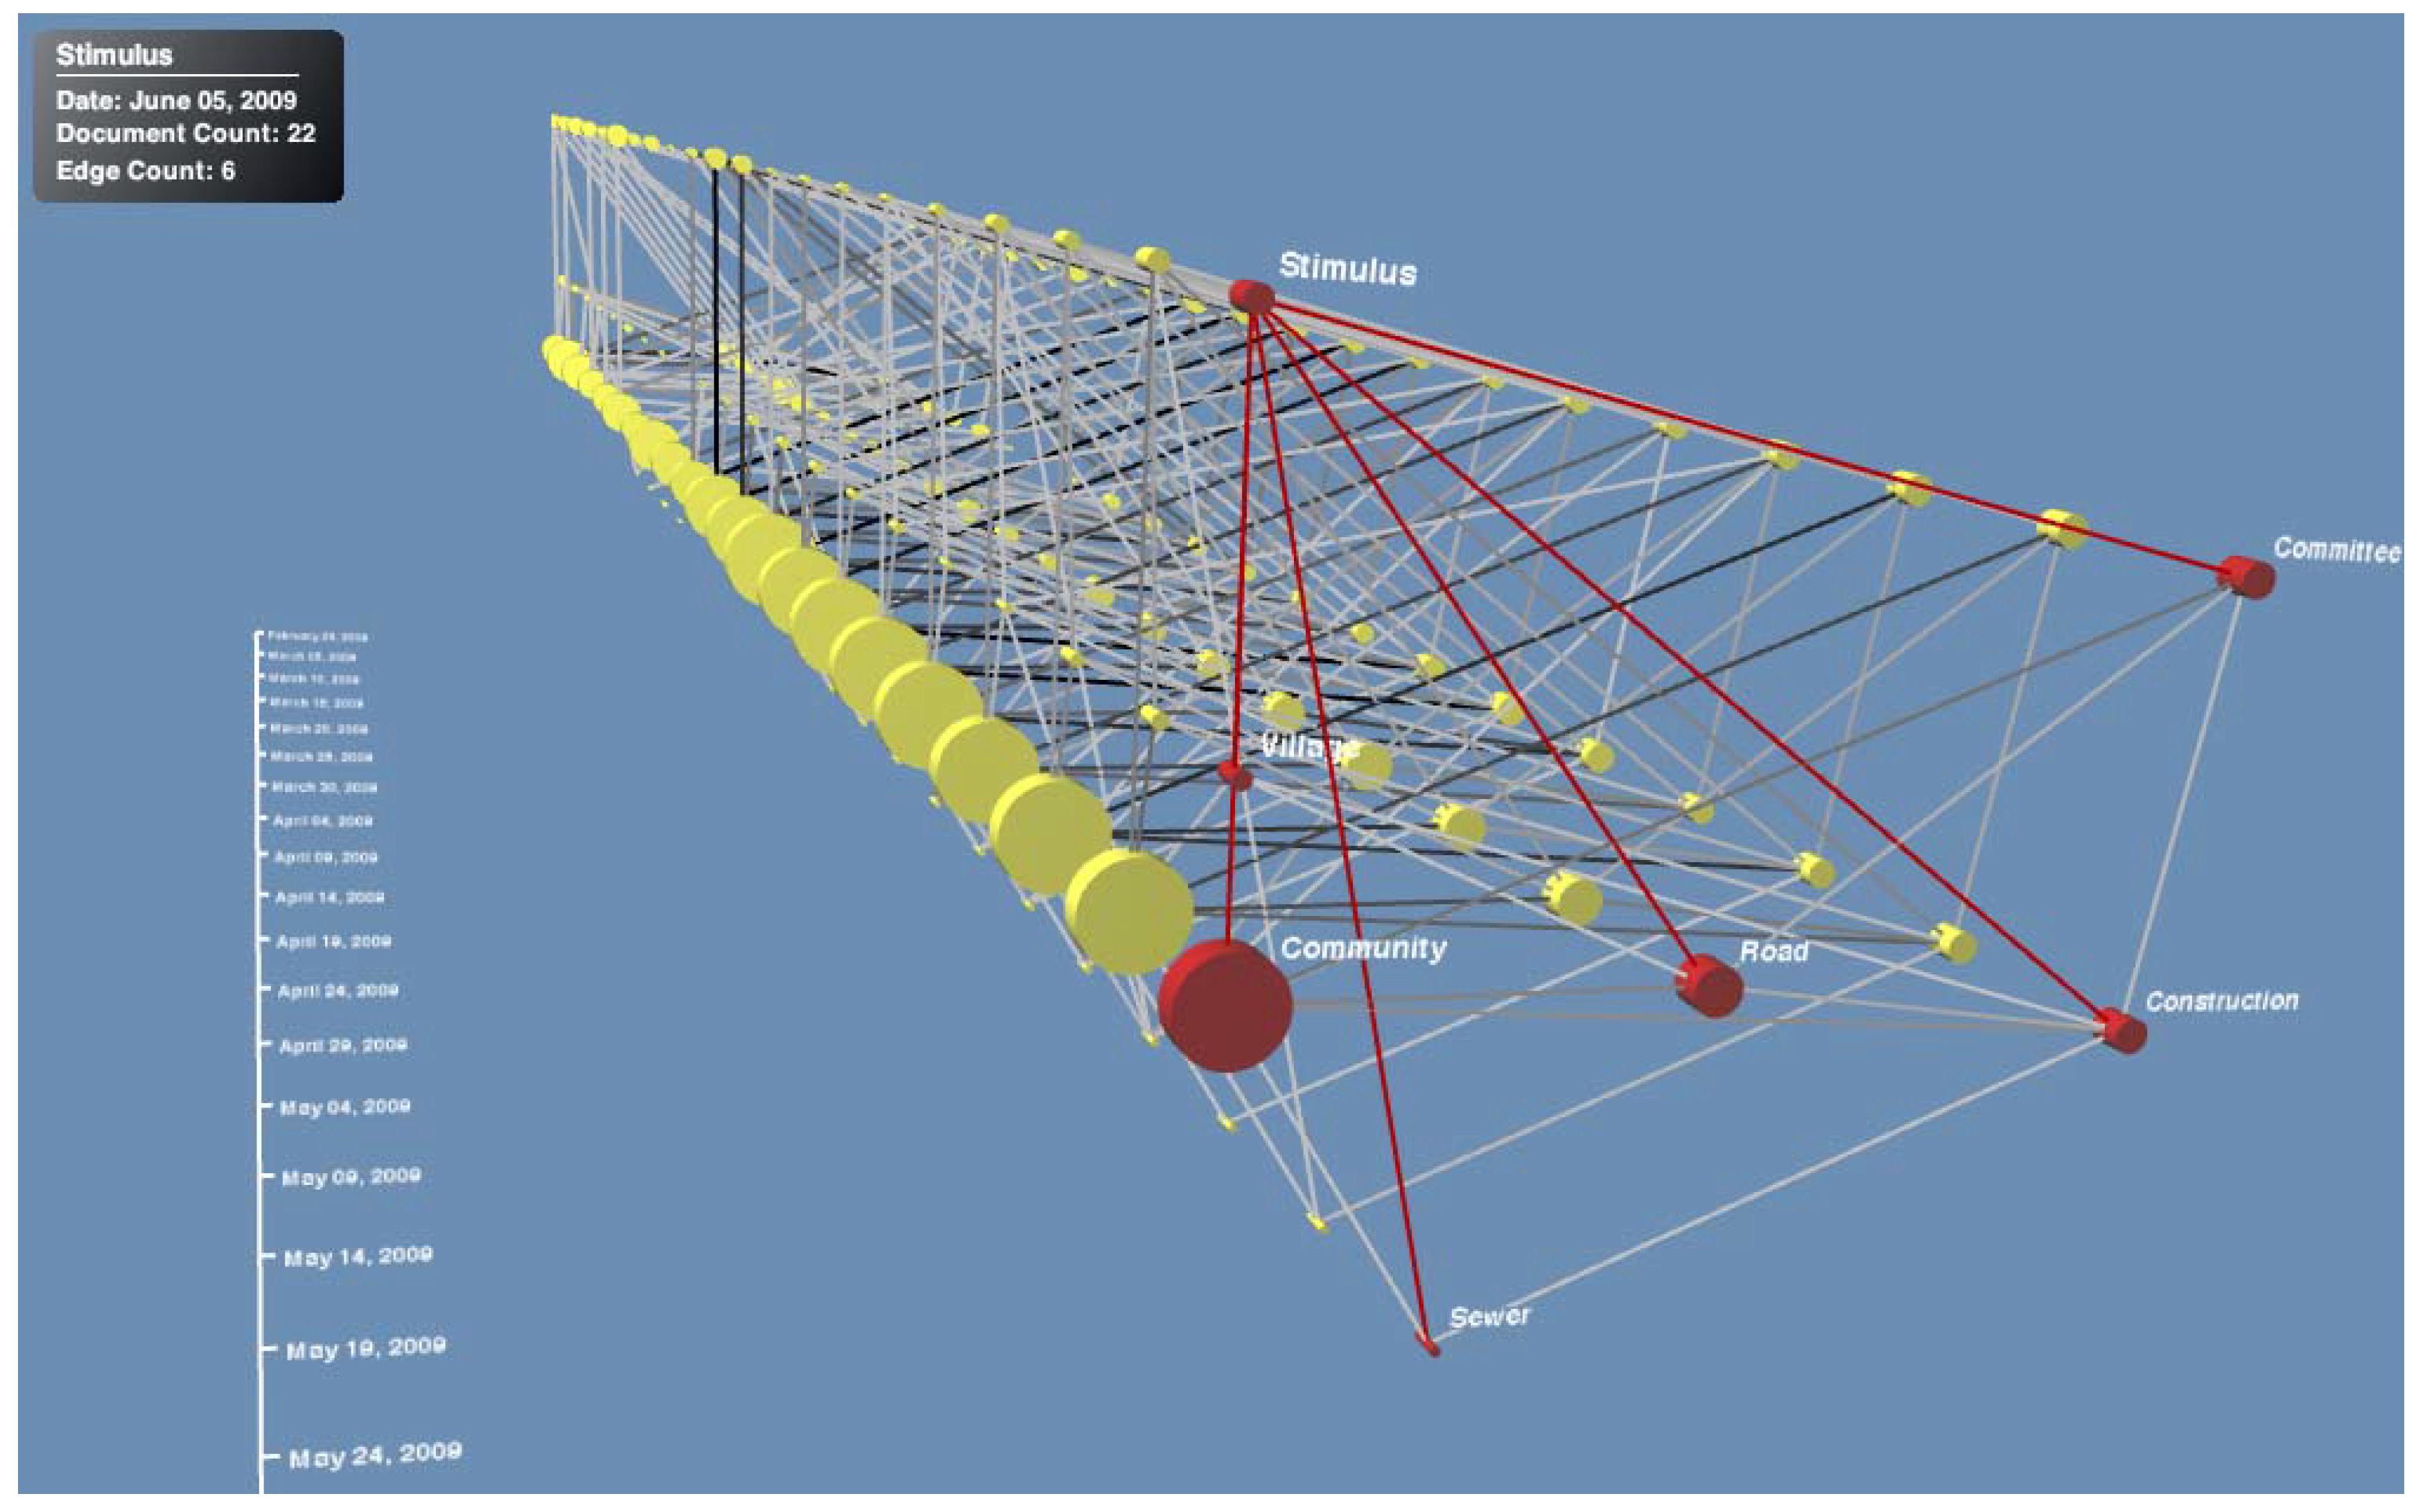
3.5. Visualization and Assessment
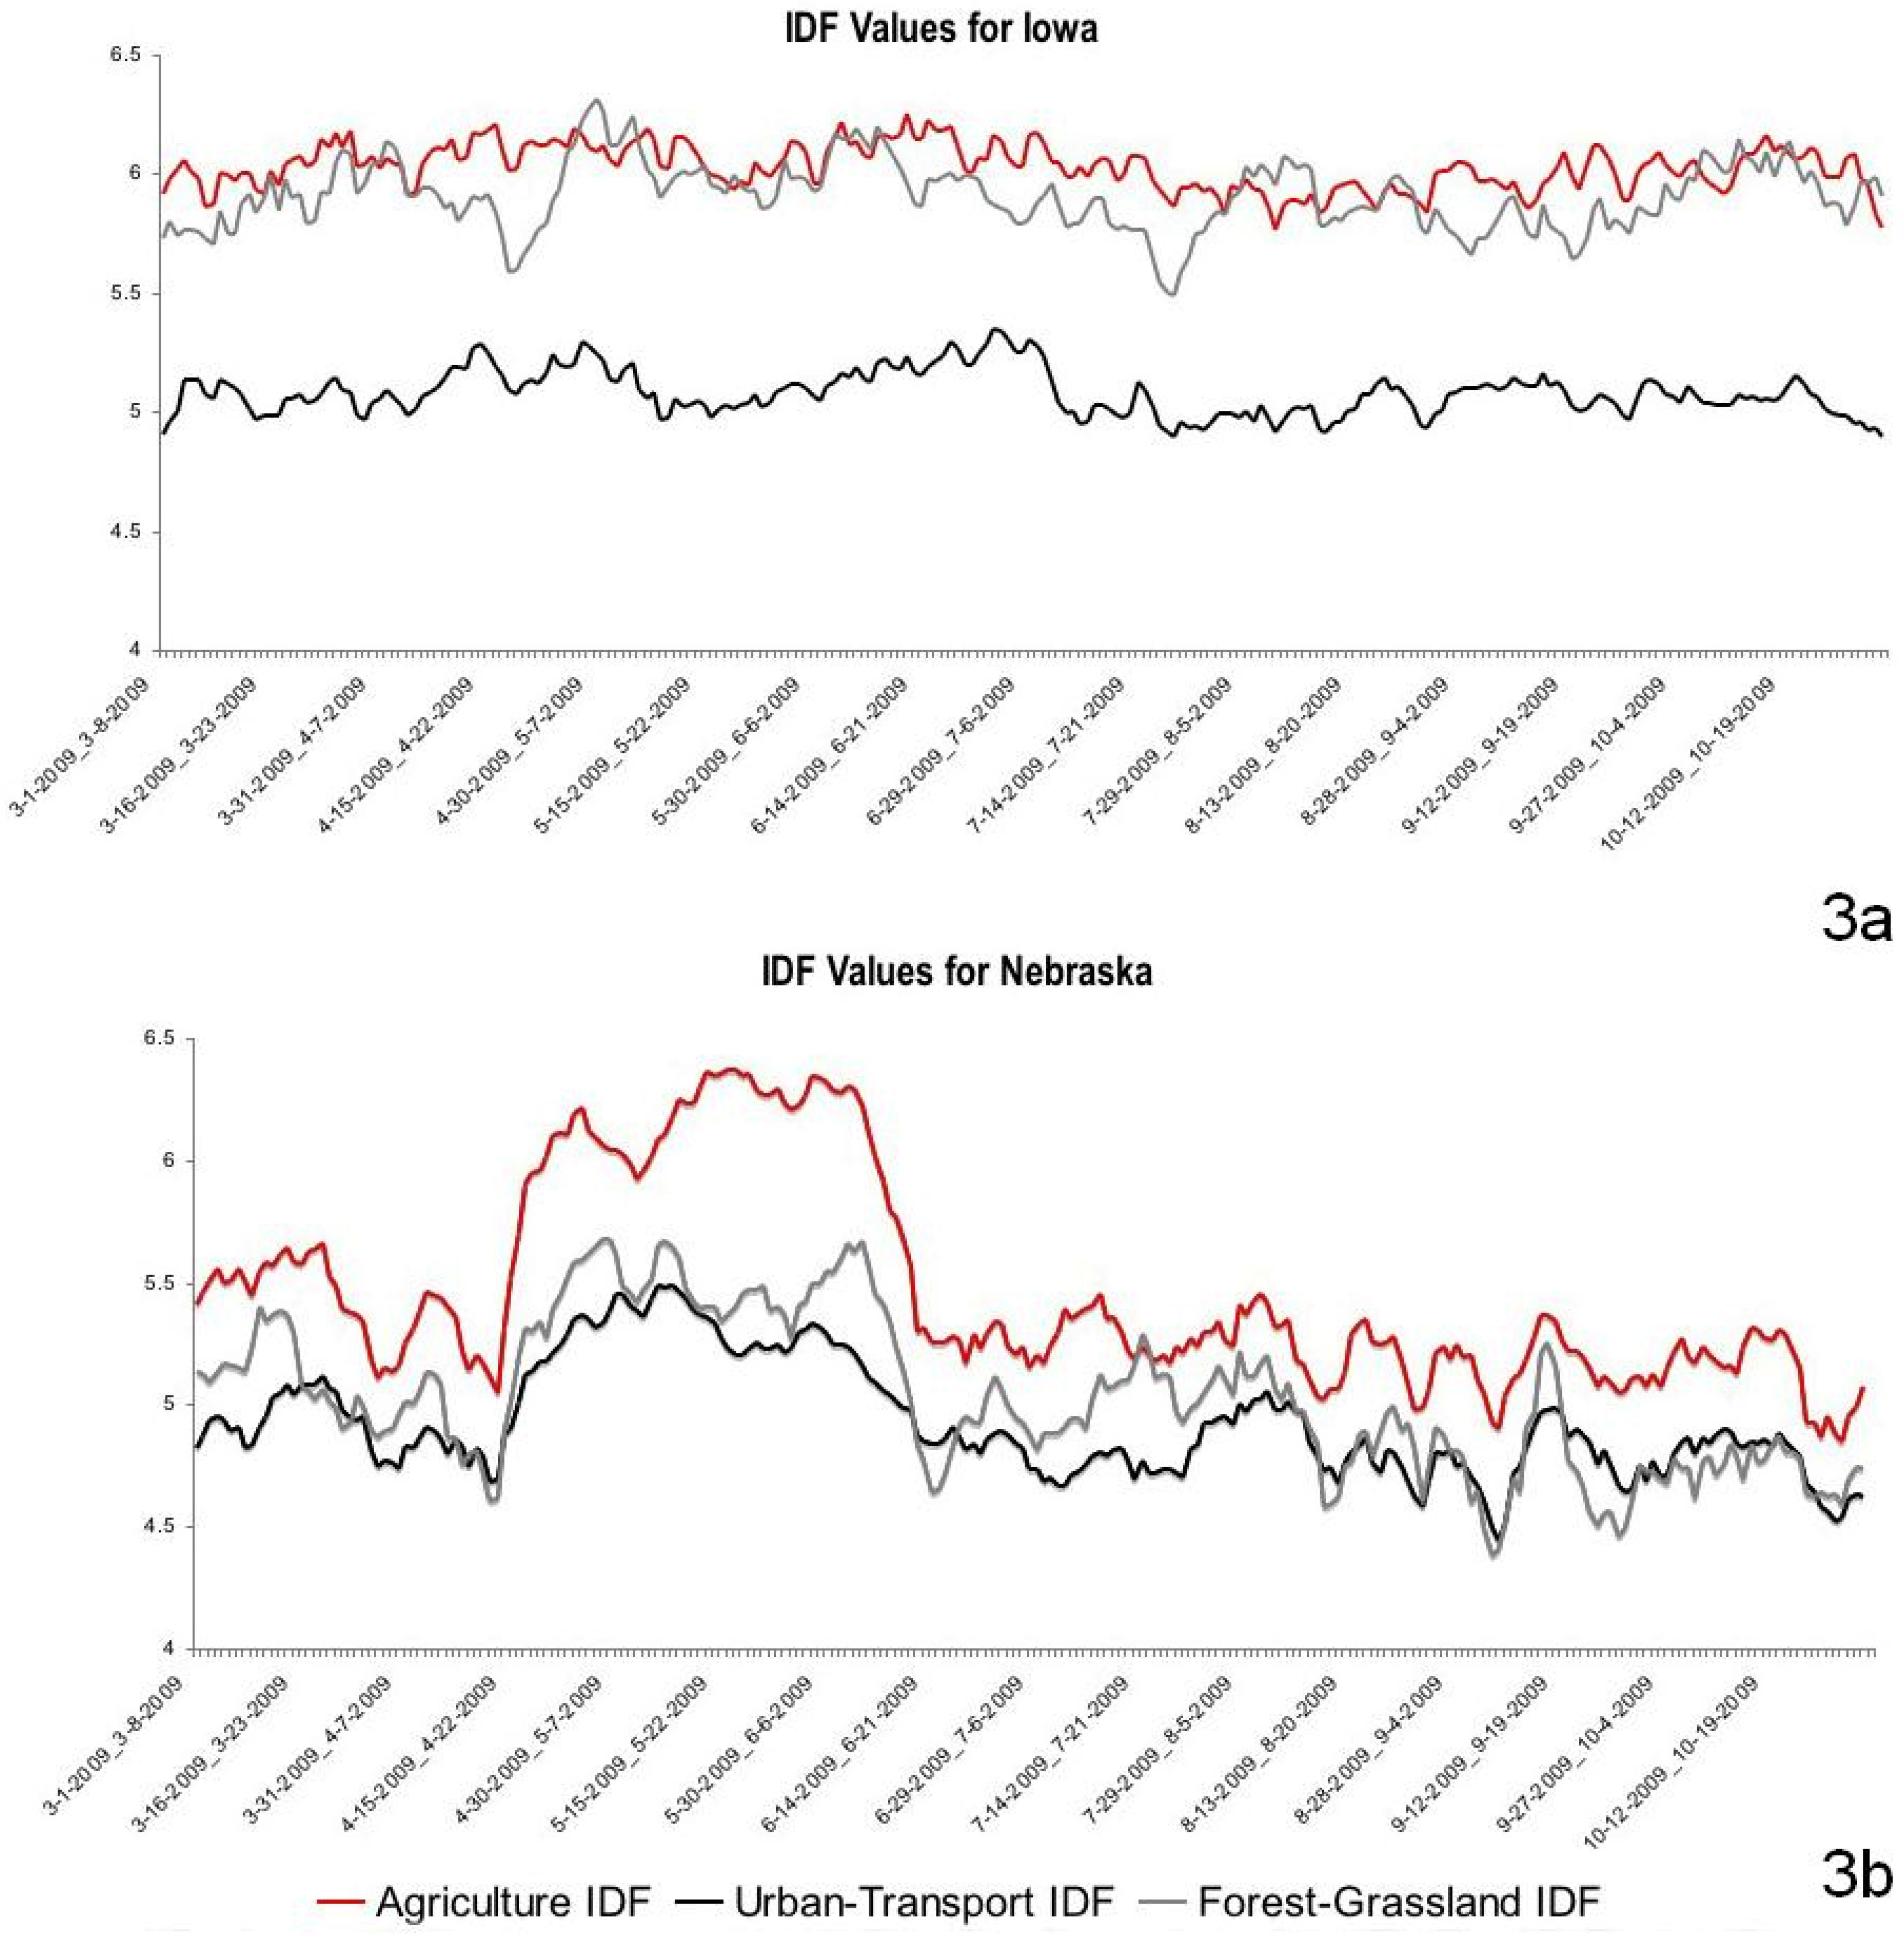
4. Applied Case Study
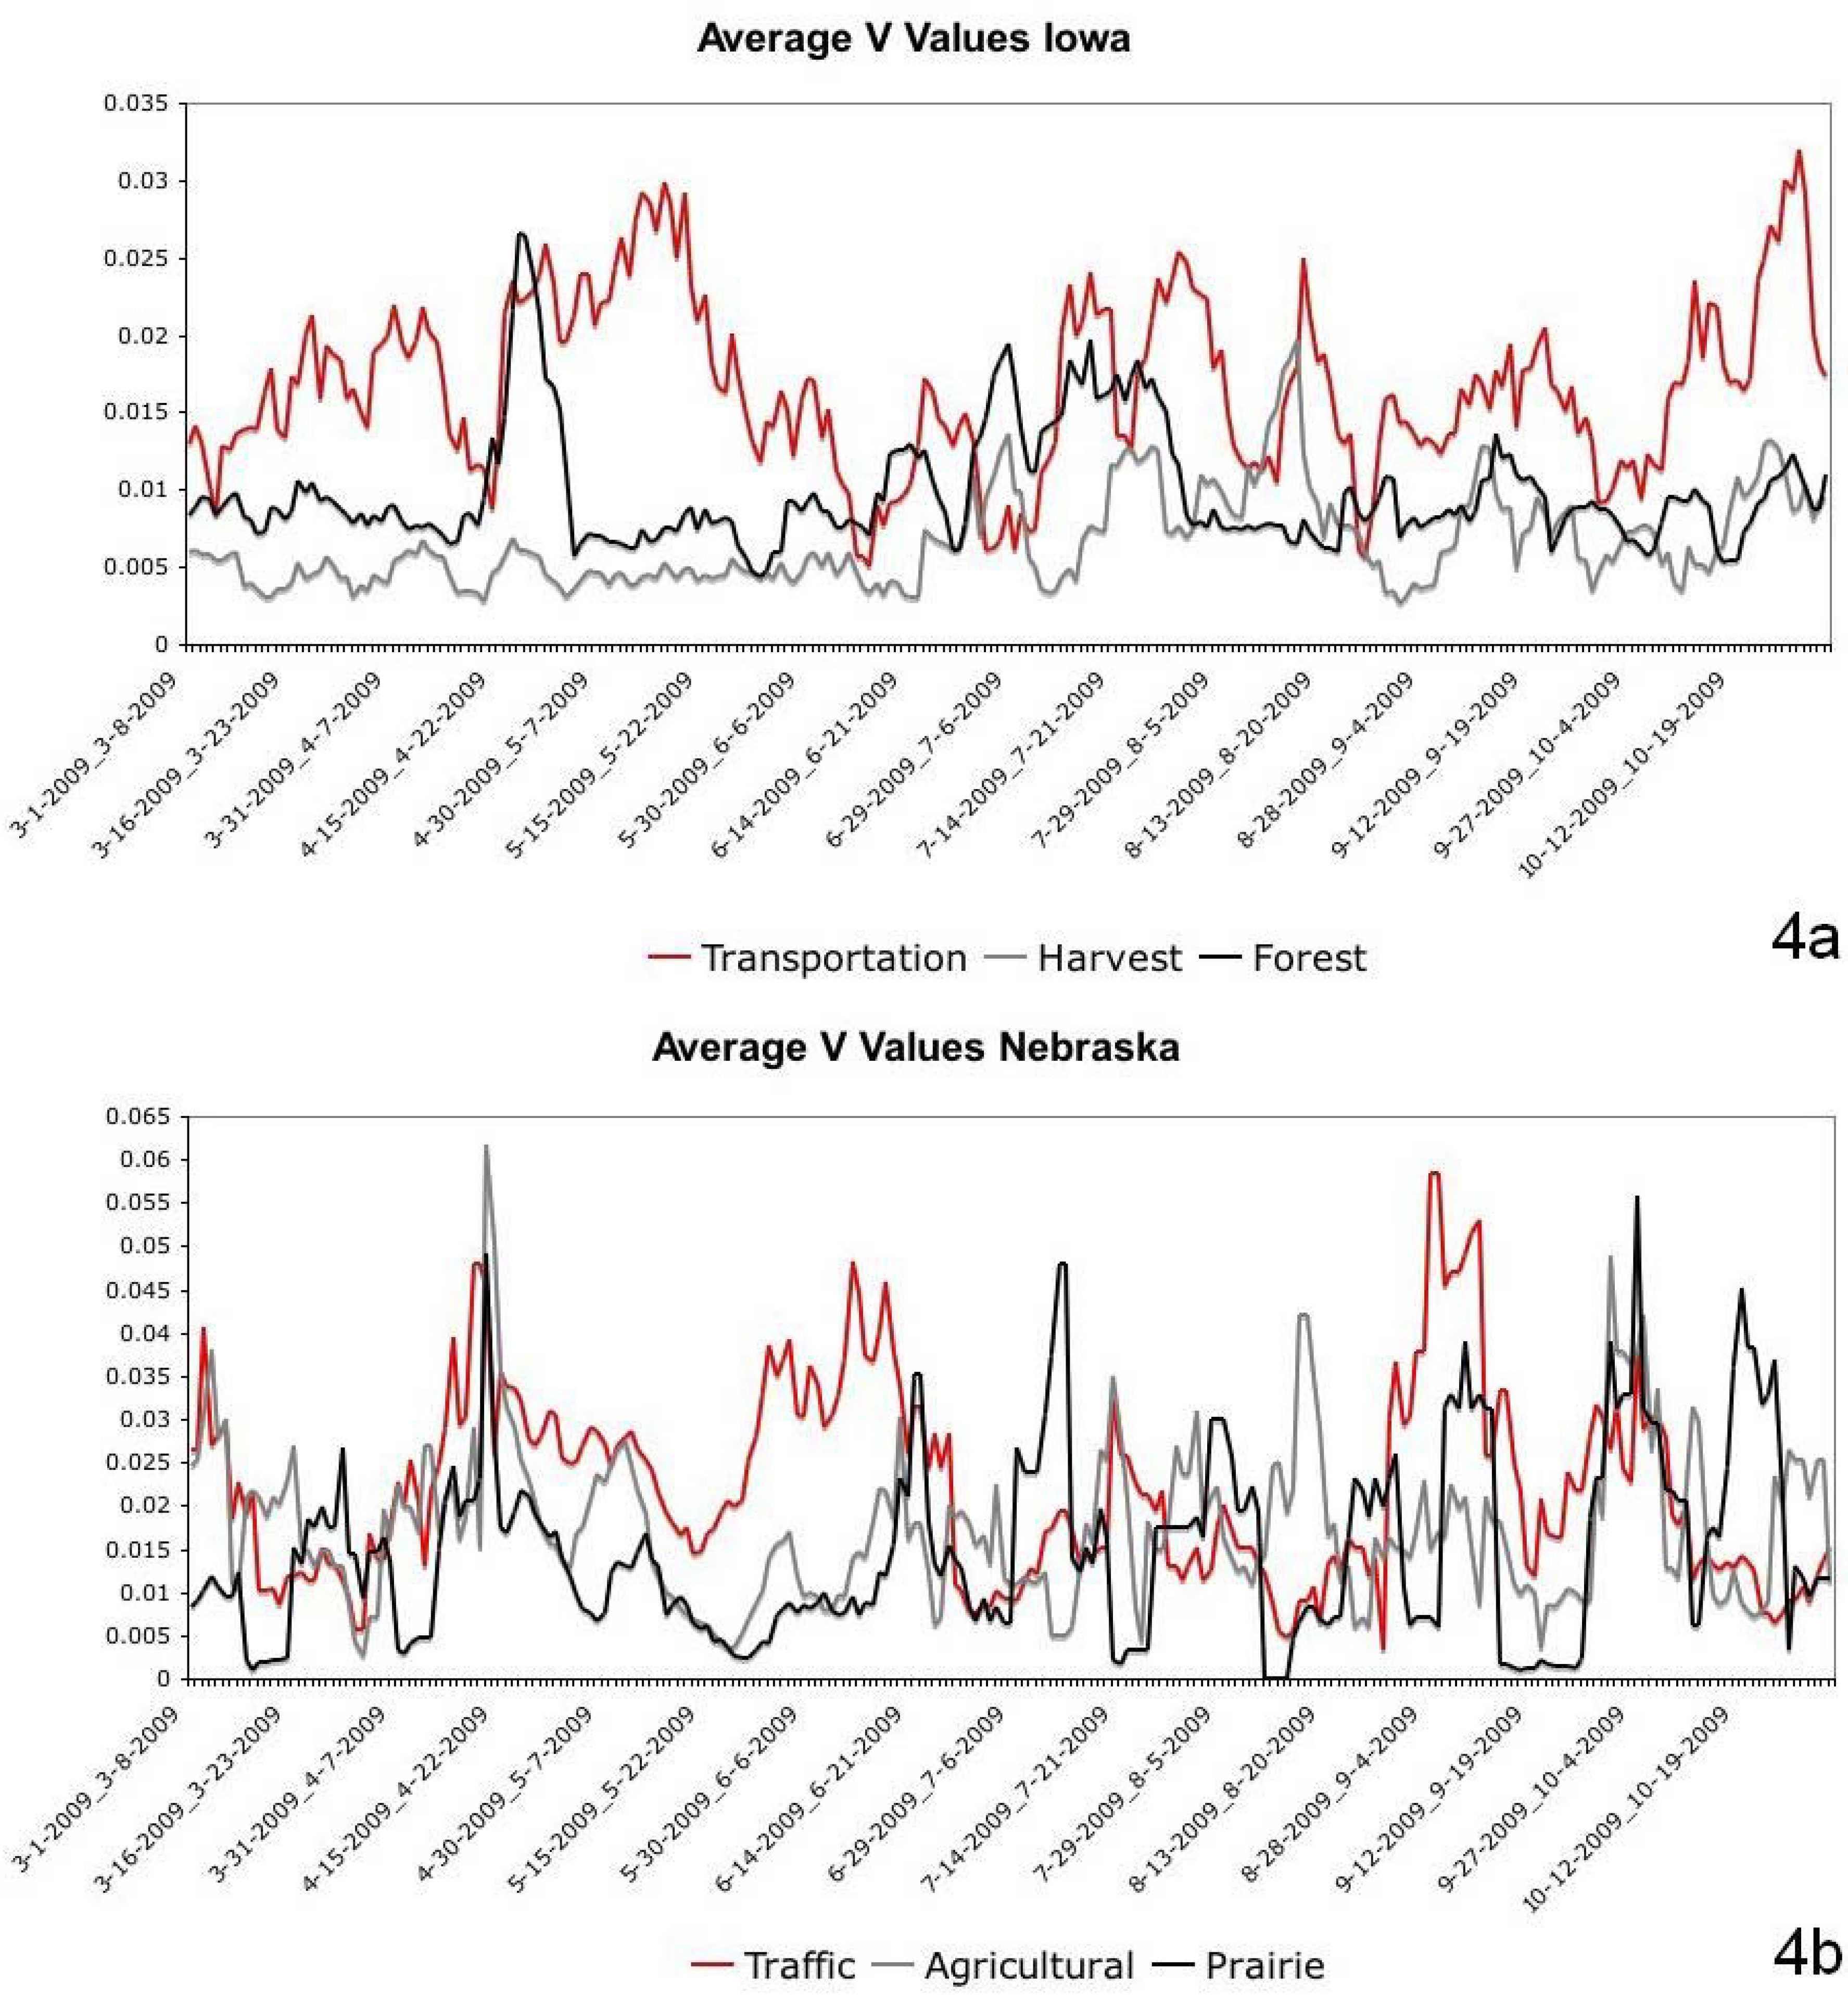
4.1. Case Study Results


| Term | Document count | Average v | |
|---|---|---|---|
| Urban and Transport | |||
| Community | 19,657 | 0.0386 | |
| Street | 13,453 | 0.0429 | |
| Transportation | 3,921 | 0.0166 | |
| Mayor | 5,606 | 0.0221 | |
| Traffic | 4,925 | 0.0222 | |
| City | 31,982 | 0.0652 | |
| Agriculture | |||
| Harvest | 563 | 0.0066 | |
| Corn | 1,322 | 0.0091 | |
| Agriculture | 1,152 | 0.0072 | |
| Farm | 3,173 | 0.0134 | |
| Planting | 3,283 | 0.0132 | |
| Crops | 403 | 0.0083 | |
| Farmer | 722 | 0.0063 | |
| Seed | 628 | 0.0045 | |
| Forestry and Grasslands | |||
| Forest | 447 | 0.0098 | |
| Wood | 1,249 | 0.0161 | |
| Great Plains | 16 | 0.0008 | |
| Prairie | 1,219 | 0.0091 | |
| Other | |||
| Service | 13,387 | 0.0277 | |
| Council | 10,260 | 0.0309 | |
| River | 10,113 | 0.0315 | |
| Committee | 19,657 | 0.0245 | |
| Term | Document count | Average v | |
|---|---|---|---|
| Urban and Transport | |||
| Community | 9,664 | 0.0464 | |
| Street | 6,956 | 0.0427 | |
| Highway | 2,632 | 0.01844 | |
| Mayor | 3,162 | 0.022 | |
| Traffic | 2,175 | 0.0222 | |
| City | 12,775 | 0.0638 | |
| Agriculture | |||
| Grain | 381 | 0.0125 | |
| Corn | 955 | 0.0152 | |
| Agricultural | 988 | 0.0044 | |
| Farm | 2,069 | 0.0213 | |
| Planting | 2,426 | 0.0162 | |
| Crops | 441 | 0.0096 | |
| Farmer | 523 | 0.011 | |
| Cattle | 526 | 0.0119 | |
| Forestry and Grasslands | |||
| Forest | 296 | 0.001 | |
| Wood | 861 | 0.0154 | |
| Plain | 279 | 0.0063 | |
| Prairie | 770 | 0.0148 | |
| Other | |||
| Service | 6,968 | 0.0373 | |
| Board | 6,275 | 0.0336 | |
| River | 2,103 | 0.0152 | |
| Bill | 3,670 | 0.0288 | |


5. Discussion and Conclusions
Acknowledgements
Supplementary Files
Supplementary File 1References and Notes
- Pielke, R.A. Land use and climate change. Science 2005, 310, 1625–1626. [Google Scholar] [CrossRef] [PubMed]
- Pirot, J.Y.; Meynell, P.; Elder, D. Ecosystem Management: Lessons from Around the World, 1st ed.; IUCN: Gland, Switzerland, 2000. [Google Scholar]
- Folke, C.; Hahn, T.; Olsson, P.; Norberg, J. Adaptive governance of social-ecological systems. Annu. Rev. Environ. Resour. 2005, 30, 441–473. [Google Scholar] [CrossRef]
- Guralnick, R.; Hill, A. Biodiversity informatics: Automated approaches for documenting global biodiversity patterns and processes. Bioinformatics 2009, 25, 421–428. [Google Scholar] [CrossRef] [PubMed]
- Altaweel, M.; Alessa, L.; Kliskey, A. Visualizing situational data: Applying information fusion for detecting social-ecological events. Soc. Sci. Comp. Rev. 2010. [Google Scholar] [CrossRef]
- Zhang, J.; Gruenwal, L.; Gertz, M. VDM-RS: A visual data mining system for exploring and classifying remotely sensed images. Comput. Geosci. 2009, 35, 1827–1836. [Google Scholar] [CrossRef]
- Krippendorff, K. Content Analysis: An Introduction to Its Methodology, 2nd ed.; Sage: Thousand Oaks, CA, USA, 2004. [Google Scholar]
- Landmann, J.; Zuell, C. Identifying events using computer-assisted text analysis. Soc. Sci. Comp. Rev. 2008, 26, 483–497. [Google Scholar] [CrossRef]
- Dumouchel, W. Bayesian data mining in large frequency tables, with an application to the FDA spontaneous report system. Am. Stat. 1999, 53, 177–190. [Google Scholar]
- Hand, D.J. Pattern detection and discovery. In Pattern Detection and Discovery, 1st ed.; Lecture Notes in Artificial Intelligence; Hand, D., Adams, N., Bolton, R., Eds.; Springer-Verlag: New York, NY, USA, 2002; Volume 2447, pp. 1–12. [Google Scholar]
- Pharo, N.; Järvelin, K. The SST method: A tool for analysing Web information search processes. Inform. Process. Manag. 2004, 40, 633–654. [Google Scholar] [CrossRef]
- Rushing, J.; Ramachandran, R.; Nair, U.; Graves, S.; Welch, R.; Hong, L. ADaM: A data mining toolkit for scientists and engineers. Comput. Geosci. 2005, 31, 607–618. [Google Scholar] [CrossRef]
- Wu, S.Y.; Chen, Y.L. Mining nonambiguous temporal patterns for interval-based events. IEEE Trans. Knowl. Data Eng. 2007, 19, 742–758. [Google Scholar] [CrossRef]
- Smith, G. Illinois Wind Turbines: Florida Company Wants to Build 133 in Dekalb County, 18 in Lee County; Chicago Tribune: Chicago, IL, USA, 3 April 2009; Available online: http://archives.chicagotribune.com/2009/apr/03/local/chi-wind-farm-debate-03-apr03 (accessed on 26 December 2009).
- Walker, B.; Holling, C.S.; Carpenter, S.R.; Kinzig, A. Resilience, adaptability, and transformability in social-ecological systems. Ecol. Soc. 2004, 9, p. 5. Available online: http://www.ecologyandsociety.org/vol9/iss2/art5/ (accessed on 26 December 2009).
- Arens, Y.; Knoblock, C.A.; Shen, W.M. Query reformulation for dynamic information integration. J. Intell. Inf. Syst. 1996, 6, 99–130. [Google Scholar] [CrossRef]
- Torra, V. Information Fusion in Data Mining: Studies in Fuzziness and Soft Computing, 1st ed.; Springer-Verlag: Berlin, Germany, 2003. [Google Scholar]
- Mitra, P.; Wiederhold, G.; Kersten, M. A graph-oriented model for articulation of ontology interdependencies. In Proceedings of the 7th International Conference on Extending Database Technology: Advances in Database Technology (EDBT 2000), Konstanz, Germany, March 2000; pp. 86–100.
- Zhai, Y.; Shah, M. Tracking news stories across different sources. In Proceedings of the 13th Annual ACM International Conference on Multimedia, Singapore, November 2005; pp. 2–10.
- Google Trends Homepage. http://www.google.com/trends (accessed on 27 December 2009).
- Sallach, D.L.; Jozik, J. Data theory, discourse mining and thresholds. In Proceedings of the Complex Adaptive Systems and the Threshold Effect: Views from the Natural and Social Sciences: Papers from the AAAI Fall Symposium, Arlington, VA, USA, November 2009; pp. 110–116.
- AIDA. Downloadable code and example can be obtained in the repository of Sustainability at: https://0-www-mdpi-com.brum.beds.ac.uk/2071-1050/2/5/1182/s1.
- UIMA Homepage. http://incubator.apache.org/uima/ (accessed on 28 December 2009).
- GATE Homepage. http://gate.ac.uk (accessed on 28 December 2009).
- WordNet Search Homepage. http://wordnetweb.princeton.edu/perl/webwn (accessed on 31 January 2010).
- TreeTagger Homepage. http://www.ims.uni-stuttgart.de/projekte/corplex/TreeTagger/ (accessed on 29 December 2009).
- Gospondnetic, O.; McCandless, M. Lucene in Action, 2nd ed.; Manning Publications: Greenwhich, CT, USA, 2005. [Google Scholar]
- Lucene Homepage. http://lucene.apache.org/java/docs/ (accessed on 29 December 2009).
- Salton, G.; Buckley, C. Weighting approaches in automatic text retrieval. Inform. Process. Manag. 1988, 24, 513–523. [Google Scholar] [CrossRef]
- GeoTools Homepage. http://www.geotools.org/ (accessed on 21 February 2010).
- Alessa, L.N.; Kliskey, A.D.; Williams, P.; Barton, M. Perceptions of change in freshwater remote resource-dependent Arctic communities. Global Environ. Chang. 2008, 18, 153–164. [Google Scholar] [CrossRef]
- Speaker to address the “greening” of Lincoln. Lincoln Journal Star. 3 September 2009. Available online: http://journalstar.com/news/local/article_da526d18-980c-11de-b2d9-001cc4c03286.html (accessed on 23 February 2010).
- Heitz, D. Senior housing project in Bettendorf moves forward. Quad-City Times. 2 June 2009. Available online: http://www.qctimes.com/news/local/article_46e08238-4fda-11de-960d-001cc4c002e0.html (accessed on 23 February 2010).
- Grassland bird study could help population. Journal Star. 15 June 2009. Available online: http://journalstar.com/news/local/article_6c73ef9a-db6e-523f-8deb-52ecbc03cfaf.html (accessed on 23 February 2010).
- Federal money available to preserve grasslands. Journal Star. 14 June 2009. Available online: http://journalstar.com/news/state-and-regional/govt-and-politics/article_b10968b8-bbec-5b18-b542-ed40ec2ef973.html (accessed on 23 February 2010).
- U.S. Government Printing Office. Public Law 111-5-American Recovery and Reinvestment Act of 2009. Available online: http://www.gpo.gov/fdsys/pkg/PLAW-111publ5/content-detail.html (accessed on 19 April 2010).
- Bunescu, R.C.; Mooney, R.J. Extracting relations from text: From word sequences to dependency paths. In Natural Language Processing and Text Mining, 1st ed.; Kao, A., Poteet, S.R., Eds.; Springer-Verlage: London, UK, 2006; pp. 29–44. [Google Scholar]
- Chambers, N.; Jurafsky, D. Unsupervised learning of narrative schemas and their participants. In Proceedings of the Joint Conference of the 47th Annual Meeting of the ACL and the 4th International Joint Conference on Natural Language Processing of the AFNLP, Singapore, August 2009; Volume 2, pp. 602–610.
- Bonabeau, E. Agent-based modeling: Methods and techniques for simulating human systems. Proc. Nat. Acad. Sci. USA 2002, 99, 7280–7287. [Google Scholar] [CrossRef] [PubMed]
- Altaweel, M.; Alessa, L.; Kliskey, A.; Bone, C. A framework to structure agent-based modeling data for social-ecological systems. Struct. Dynam. eJ. Anthro. Rel. Sci. 2010, (in press). [Google Scholar]
- North, M.J.; Macal, C. Managing Business Complexity: Discovering Strategic Solutions with Agent-Based Modeling and Simulation, 1st ed.; Oxford University Press: New York, NY, USA, 2007. [Google Scholar]
- Gan, T.Y.; Dlamini, E.M.; Biftu, G.F. Effects of model complexity and structure, data quality, and objective functions on hydrologic modeling. J. Hydrol. 1997, 192, 81–103. [Google Scholar] [CrossRef]
© 2010 by the authors; licensee MDPI, Basel, Switzerland. This article is an open-access article distributed under the terms and conditions of the Creative Commons Attribution license (http://creativecommons.org/licenses/by/3.0/).
Share and Cite
Altaweel, M.R.; Alessa, L.N.; Kliskey, A.D.; Bone, C.E. Monitoring Land Use: Capturing Change through an Information Fusion Approach. Sustainability 2010, 2, 1182-1203. https://0-doi-org.brum.beds.ac.uk/10.3390/su2051182
Altaweel MR, Alessa LN, Kliskey AD, Bone CE. Monitoring Land Use: Capturing Change through an Information Fusion Approach. Sustainability. 2010; 2(5):1182-1203. https://0-doi-org.brum.beds.ac.uk/10.3390/su2051182
Chicago/Turabian StyleAltaweel, Mark R., Lilian N. Alessa, Andrew D. Kliskey, and Christopher E. Bone. 2010. "Monitoring Land Use: Capturing Change through an Information Fusion Approach" Sustainability 2, no. 5: 1182-1203. https://0-doi-org.brum.beds.ac.uk/10.3390/su2051182