Modeling Evacuate versus Shelter-in-Place Decisions in Wildfires


Abstract
: Improving community resiliency to wildfire is a challenging problem in the face of ongoing development in fire-prone regions. Evacuation and shelter-in-place are the primary options for reducing wildfire casualties, but it can be difficult to determine which option offers the most protection in urgent scenarios. Although guidelines and policies have been proposed to inform this decision, a formal approach to evaluating protective options would help advance protective-action theory. We present an optimization model based on the premise that protecting a community can be viewed as assigning threatened households to one of three actions: evacuation, shelter-in-refuge, or shelter-in-home. While evacuation generally offers the highest level of life protection, it can place residents at greater risk when little time is available. This leads to complex trade-offs involving expected fire intensity, available time, and the quality and accessibility of in-place shelter. An application of the model is presented to illustrate a range of issues that can arise across scenarios.1. Introduction
Wildfire disasters have become increasingly high-profile events in recent years. Fires in Australia, Canada, Greece, Israel, Russia, and the United States have heightened awareness of this threat worldwide. The financial toll has risen to a scale routinely measured in the billions of U.S. dollars, and regional events such as the 2003 and 2007 Southern California Fires resulted in the loss of thousands of homes in a single event [1]. In addition to the staggering losses in terms of personal and public property in the “wildland-urban interface” [2-5], a number of fires have resulted in casualties including the 2003 Southern California Fires, the 2008 Fires in Greece, and the 2009 Victoria Fires in Australia. The personal stories of survival and loss in these fires span the full range of human circumstances, decision making, and outcomes. Taken together, recent wildfire disasters have galvanized efforts to improve community resiliency and adaptive capacity [6] at the same time they have fostered new international partnerships for research and policy development.
One topic related to improving community resiliency to wildfire is that of protective actions. There are two general strategies for protecting people in wildfires—evacuation and shelter-in-place [7]. Evacuation, the process of removing people from a threatened area, is the most common recommendation because it offers a relatively high level of life protection if there is sufficient time available to clear the threat area. Shelter-in-place offers protection against the direct effects of fire and can encompass a range of approaches including harboring in a structure, safety area, or water body. It can be distinguished from shelter outside a threat area designed to meet basic human needs (e.g., food, water, and clothing). In the broadest sense, in-place shelter can be divided into refuge shelter and in-home shelter. Refuge shelter does not typically require active defense on the part of its occupants and may involve a short trip to the refuge site in a vehicle or on foot [8]. In-home shelter is usually associated with the dual goals of protecting life and property [9]. Unfortunately the terminology for wildfire protective strategies has not been standardized, and some jurisdictions may refer to a short trip from a residence to a fire shelter as “refuge shelter” while others may call this “evacuate to shelter.” Furthermore, “shelter-in-place” may be used to refer to all forms of fire shelter in a threat area or solely to the case where no travel is involved. However, the phrase “stay and defend” is less ambiguous and refers to the case where residents shelter-in and actively defend a home.
No single protective option represents a universal solution to eliminating casualties in fire-prone areas—each one has circumstances where it eclipses the others as the best form of protection. For example, the 2003 Cedar Fire in San Diego County, California involved evacuating hundreds of thousands of residents, but some last-minute evacuations by residents near the San Vicente Reservoir resulted in 14 fatalities. At the same time, a few neighboring households successfully sheltered in their homes [10,11]. Refuge shelter was also used in this event, as an estimated 300 people were directed to stay put in the Barona Casino rather than attempt to evacuate. In 2008, thousands of residents successfully evacuated from the path of the 2008 Tea Fire in Montecito, California, while an estimated 800 Westmont College students sought refuge in a campus gymnasium [12]. In general, evacuation, refuge shelter, and in-home shelter have all resulted in successful and unsuccessful outcomes in protecting people in wildfires, and developing effective community protection plans is a significant policy and research focus.
In an urgent wildfire scenario, the unique geography and circumstances of each affected household can lead to difficult trade-offs, and experts frequently differ on which of the above options might offer the highest level of protection for a particular household or community. While this is not surprising given the complexity and potential consequences in this decision-making context, it is not always easy to explain why one expert recommends evacuation while another recommends shelter-in-place in the same urgent circumstances. While there are a number of situations that can lead to an urgent scenario, it is often the few remaining households in a threat area at the tail end of an evacuation that either did not receive a warning or chose not to heed one. This challenge highlights the need for a means to articulate why individuals differ in recommending one action over another. For this reason, a current challenge in advancing wildfire protective-action research is to develop formal representations that capture the key factors, parameters, and trade-offs that are inherent in this decision-making context.
The purpose of this paper is to present a framework and an associated decision model for assigning optimal protective-actions to households in an urgent wildfire scenario. The next section provides background on protective-action research followed by a section that presents an optimization model designed to capture some of the key factors and parameters associated with this problem. An application of the model is described for an example fire-prone community across a range of scenarios, and the paper concludes with a discussion of issues that arise in practice, including areas for further research.
2. Background
Evacuation as a protective action has been studied for decades in the context of many environmental hazards [13-16]. The process of evacuation is typically studied from a behavioral perspective that involves examining factors that influence public compliance with evacuation recommendations [17-19] or from an engineering perspective that focuses on traffic flow modeling and estimating evacuation time [20-23]. These two perspectives are not mutually exclusive, and recent efforts have shifted toward integrating these two perspectives by incorporating behavioral elements into transportation models to generate more realistic evacuation time estimates [24,25]. Currently there are many active areas of evacuation research that include work on social networking and citizens as sensors [26], the geography of warning and response [16], contraflow freeway operations [27], multi-objective evacuation routing [28], and evacuation staging [29].
Although evacuation from environmental threats has been well-studied from many perspectives, shelter-in-place has received much less attention. Research on the decision of whether to evacuate or shelter-in-place is most closely associated with chemical emergencies [30] but has since broadened to include other threats both natural [31] and intentional [32]. The leading model for describing how protection actions are selected by decision makers is the protection action decision model (PADM) developed by Lindell and Perry [33]. PADM is a conceptual model that depicts how the many factors associated with making protective decisions are causally related, but it is not prescriptive in nature. Sorensen et al. [34] presented a prescriptive conceptual model to inform whether to evacuate or shelter-in-place in a chemical emergency that addresses many of the same questions faced in the context of other hazards including the time available to carry out an action and the level of protection each action offers.
Much of the modeling work on protective actions does not include shelter-in-place as an option, and instead focuses on moving an affected population out of a threat area or emergency planning zone (EPZ). However, some studies have included in-place shelter as an option. In terms of formal, prescriptive modeling of shelter-in-place, Yamada's [35] work is a key contribution. In his work, residents of Yokosuku City, Japan are threatened, and the shortest-path-assignment and minimum-cost-flow models are used to develop plans to get people safely to their closest place of refuge. Other cases where shelter was incorporated into protective action modeling tend to focus on congregate care facilities outside the threat area rather than in-place shelter that offers direct protection from a threat [36,37].
The policy side of wildfire protective action is an active area of research. Australia's “Stay or Go?” policy [38] which places the decision of whether to “leave early or prepare, stay and defend (property)” inspired researchers to look at this problem from one of international policy diffusion [39,40]. These efforts resulted in findings related to properly preparing a home for defense, along with many other foci from historical studies of cases where individuals defended homes to studies of fatalities in evacuations [41-43]. The 2009 Black Saturday Fires in Victoria led to a review of the “Stay or Go?” policy because 173 residents died, many that were actively defending a home [44]. In the United States, the most current national wildfire protection policy is “Ready, Set, Go!” (RSG) which educates citizens on how to prepare and leave in the event of a fire [45], but there are also many cases where the focus of community outreach has been educating residents on when to shelter-in-place [46-50].
Given the research on stay-or-go decisions in Australia and the noted use of shelter-in-place in North America in some events, it is important to separate shelter-in-place where the goal is improving structure survivability from shelter-in-place when evacuation is not feasible or perceived as too risky [7]. In the former case, there may be ample time to evacuate, but one or more household members has decided to stay behind to protect property, where in the latter case time constraints make shelter-in-place a better option because leaving the threat area may increase one's exposure to fire in transit. Refuge shelter is generally viewed as a passive strategy where one travels to, or remains in, a structure, clearing, or water body without the need to actively defend it. For the purposes of this paper we will not consider the case where citizens voluntarily choose to actively defend a home when options that offer greater life protection are available. The results of the above conceptual analysis leads to the creation of three protective-action categories: 1) evacuation: traveling from within the threat area to a location outside the threat area, 2) refuge shelter: traveling to or remaining in protective shelter within the threat area, and 3) in-home shelter: sheltering in and actively defending one's home when it offers more protection than the other options. We recognize that options 2 (refuge shelter) and 3 (in-home shelter) could both be viewed as forms of shelter-in-place, but there is broad agreement that leaving the threat area entirely (option 1) is referred to as evacuation, although there are different views of this process [51]. Therefore, in-home shelter will be treated as a back-up plan in the context of this paper if evacuation and refuge shelter are either not feasible or do not offer a higher level of protection.
3. Model Formulation
There are many benefits to formally representing a decision problem [52]. In general, a formal representation can serve as a starting point from which to improve one's understanding of a given problem at the same time that it provides a means for experts and policy-makers to better visualize a decision space. This process begins by identifying objectives, key variables, and constraints such that an initial model can be articulated that reveals one view of the problem. Formal models and problem instances also offer a window into a modeler's view of a problem, and this is one manner by which they can advance the research and associated discussion regarding social and environmental problems including disaster management [53].
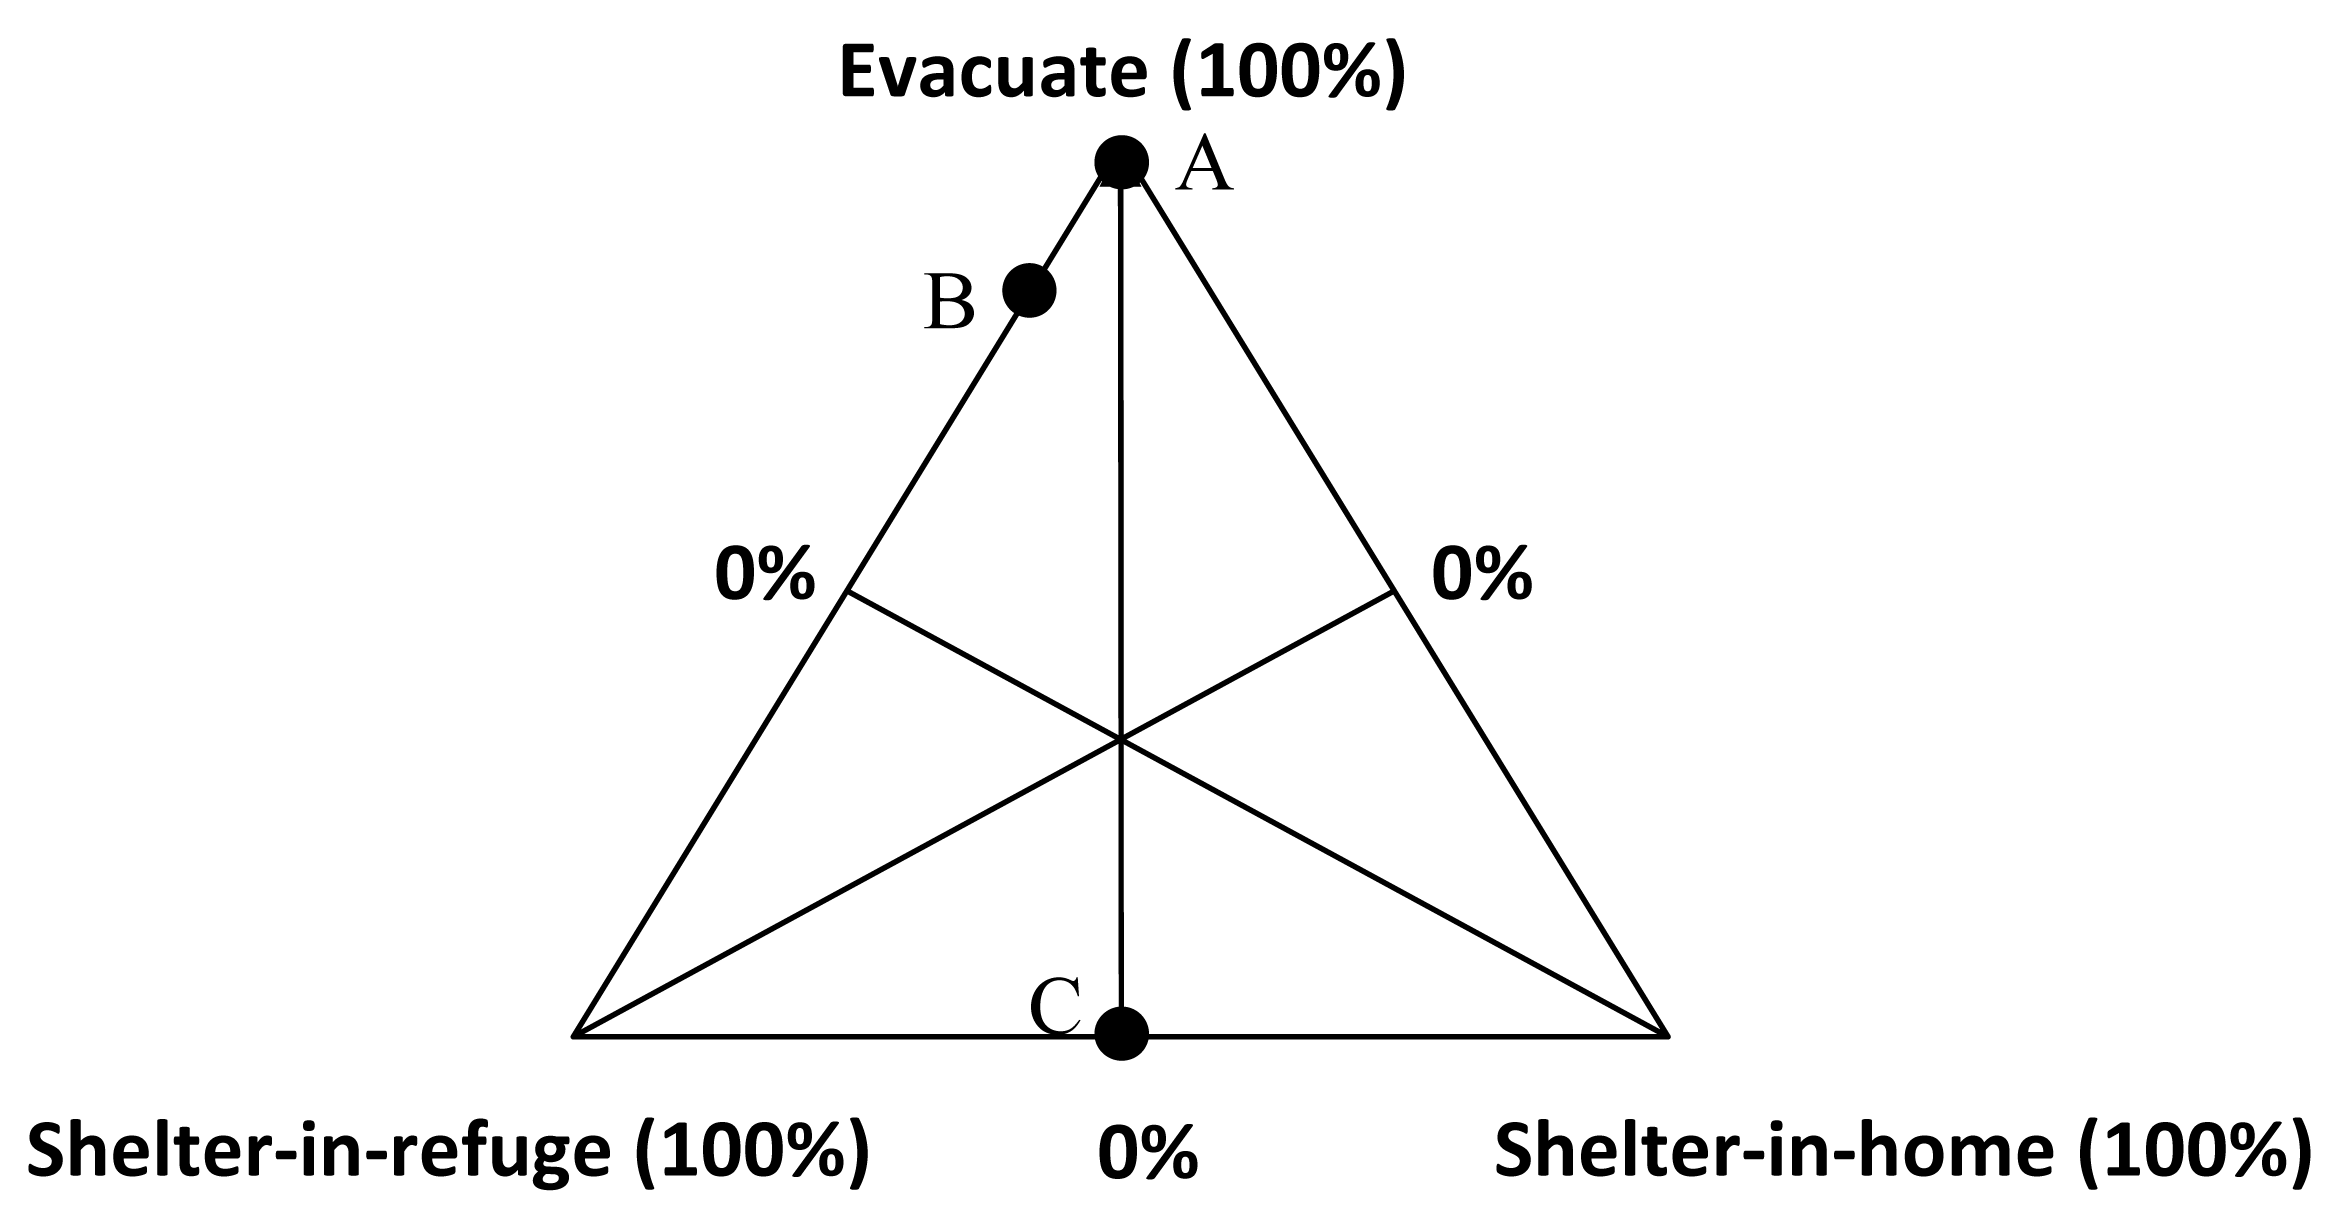
As noted in the previous section, we will rely on three categories of protective options to represent the actions that might be recommended by emergency managers in a wildfire: evacuation, shelter-in-refuge (SIR), and shelter-in-home (SIH). To visualize the full range of potential community protection plans, these recommended actions can be viewed as summing to 100% in a given scenario:
Figure 1 shows this combination as a ternary diagram where a given community protection plan can be represented as a point in this three-space. For example, the common case of recommending that all households evacuate places the point at the apex of the triangle (A). Other plans where a community is assigned one of two options would place the point along an edge, and assigning all three options would place it in the middle. For example, point B represents a plan where 90% of the households are assigned to evacuate and 10% are assigned to SIR (e.g., 2003 Cedar Fire or the 2009 Tea Fire). Point C represents a plan where evacuation was not possible (e.g., the exits are blocked), and the plan is an equal split between SIR and SIH.
3.1. Specification
An initial goal in formulating the model is to make it as simple as possible while still capturing key aspects of the problem space. A secondary goal is to formulate a model that does not require advanced solution methods, such that it can provide guidance that is more in line with easily conveyed rules-of-thumb. While this means that some aspects of the problem space will not be represented, this formulation can serve as starting point toward the prescriptive modeling of wildfire protective decisions. A departure from past optimization models for evacuation planning is the inclusion of a decision variable that allows households to be assigned to a protective action other than evacuation. In short, rather than assume that evacuation is the preferred action, the assignment of households to different options hinges on the expected fire threat level, the available time, and the required time to execute each option for each household—with total evacuation still possible.
The model is based on a number of assumptions, which include but are not limited to:
The set of protective options available to each household can be defined. This might be modeled at different levels of detail from considering evacuation or refuge shelter as one option to representing each exit (or refuge location) as a separate option.
The time available for each household to execute each protective option can be estimated.
The time required for each household to execute each option can be estimated.
A rating system exists to rank the expected fire threat level at a given household (or location) from lowest (1) to highest (5) threat (see Table 1).
A rating system exists to rank the level of protection offered by each option available to a household from lowest (1) to highest (5) protection (see Table 1).
Household members in a threat area are together (or the assembly/gathering process is not a significant barrier to taking action), and all members are assigned the same strategy.
Household responses are independent (i.e., the action of one household does not affect the available option for other households or the time it takes them to execute each one).
Households will comply with their assignments.
Given these assumptions, the protective assignment model can be formulated as follows:
i index of households
j index of available protective actions
tij the estimated time required for household i to execute protective action j
pij the level of protection provided to household i by protective action j
Tij the time available for household i to execute protective action j
fij the expected fire threat level that household i will face under action j
Objective: Maximize the protection of the community.
Subject to:
All threatened households must be assigned a protective action.
A household i can only be assigned option j if there is time to execute it.
A household must be assigned a given action or not.
The objective (2) of this model is to maximize overall community protection where (pij − fij) is a measure of household i's safety under action j. Ideally this term would be positive and as large as possible for all households. If fij is greater than pij, then household i has a protective deficit under option j and would be vulnerable to the degree of this deficit (e.g., −3 is more vulnerable than −1). This might occur if evacuation is not feasible (e.g., insufficient time or blocked exits), high-quality refuge shelter is not easily accessed (e.g., insufficient time and/or protection), or a household is not prepared and equipped to defend a home against the expected fire threat-level. The first constraint (equation 3) states that each household must be assigned one-and-only-one protective action, a common constraint found in assignment problems [54]. The second constraint (equation 4) states that a household cannot be assigned a protective action unless there is sufficient time to execute it. The third constraint (equation 5) states that a household cannot be assigned a partial protective option (i.e., all household members must be assigned the same action).
An interesting initial step in discussing this formulation is comparing it to realistic scenarios. In a real event, the estimated fire threat level for household i under action j can be highly dynamic and difficult to predict, particularly in rapidly changing conditions (i.e., produced by erratic wind speed or direction). Action j is included in the parameter fij because each respective action can expose household members to a different fire threat level. While the protection level offered by a given action is generally more stable than the expected fire threat level in real scenarios, it can also be dynamic and uncertain in some cases. For example, a household with a rating of 3 (moderate protection) for the SIH option might suddenly drop to a 1 (lowest protection) if a power failure removes the primary water source, the structure is compromised, or the occupants are unable to defend the structure.
The preliminary decision to exclude interactions between households is important, as assigning one household to evacuate may affect another household's evacuation time due to traffic delays. One reason to keep household interactions initially exogenous is that this is the context in which households make decisions in real scenarios. In other words, households do not know which actions other households will execute or when, and they must estimate the time required to evacuate with possible delays in mind (tij when j is “evacuate”). For example, household 1 may decide to evacuate based on an official warning and perceived risk, but its occupants may not know what households 2..n in the community will do or the effect that other evacuating households may have on them. For this reason, representing these interactions as initially exogenous can help highlight some of the inherent challenges and potential errors in making protective decisions. There are also many urgent scenarios where household interactions are not a significant factor, such as the case where a few residents that chose not to evacuate are still in the threat area at the onset of a wildfire.
In some scenarios however, particularly cases where many households are still in the threat area at the onset of the hazard, there may be a need to consider traffic delays that result from assigning many households to evacuate. In general, this means that a household's evacuation time is a function of the number of other households that evacuate at the same time. One simple approach to including this interaction is to modify the second constraint (equation 4) such that a household's evacuation time is a function of the number of households assigned to evacuate. This can be represented as follows:
3.2. Model Parameters
There are many issues involved in initializing the model parameters to represent a given scenario. Example questions that may arise include: (1) what is the threat area (i.e., set of threatened households), (2) which households have occupants at home, (3) how much time is available for each household to take each action, (4) how much time would each action take a household to execute, (5) what fire threat level is expected at each household when taking each action, and (6) how much protection does each option offer? While there are many other aspects that might be included, these six represent the most relevant ones in this modeling context. One of the more interesting aspects of moving to a formal approach to this problem is how the answers to these questions may help reveal and quantify differences in the perceived efficacy of different protective actions across experts (e.g., the level of protection provided by a given protection option).
Questions (1) and (2) deal with estimating the potential demand for protective actions both in terms of the threat area itself (i.e., set of threatened households), as well as those that have members that are at home at the time of the event. A complete treatment of potential protective demand would include transient populations [56], special facilities, time-dependent populations [57], and the mobility level of each household. The gathering process of household members within the threat area can also be a challenge when families are separated at the onset of an event, but this depends on the scenario [58,59]. The number of household that have members at home can vary significantly across time scales from seasons (e.g., second homes) to diurnal variations. In the simplest case, all households members are at-home and together in the threat area (e.g., night time), but there are many other instances in which household members may be separated (e.g., work, school, recreation).
Question (3) addresses the critical issue of the time available for each household to take each action. Gill and Stephens [60] note that estimating this time is a research area in need of attention. In many scenarios with ample lead time, it is common for emergency managers to assume that this parameter is uniform across threatened households (e.g., we have two hours to clear the threatened community before the fire arrives). However, in urgent scenarios, and certainly for communities that span a large area, the time for households to take action before the fire adversely impacts their available options can vary significantly. While it is up to an analyst, the formulation in equation (2–5) can be initialized such that all households have the same available time to carry out each action, or the time for each action can be varied geographically across households (i.e., households closer to an advancing fire can be assigned less time to act) as well as across actions (i.e., there may be less time available to evacuate than to travel to a refuge shelter). Available times can either be provided by expert input or derived from a fire-spread model [61].
Question (4) addresses the estimation of the time required for each household to execute each available action. This topic has received a significant amount of attention in evacuation research at the aggregate level using simulation and optimization approaches, and a number of decision support systems have been developed to deal with the overall case of moving a threatened population to safety (see [62] for a recent review). Although methods have been developed for estimating mean evacuation times at the household level across scenarios using statistical simulation [22], it is rare to estimate the time required for each household to carry out a given protective action, as evacuation areas can have hundreds of thousands of households. However, this is an important parameter in determining which options are feasible for a few remaining households when a wildfire impacts a community.
Question (5) addresses the expected characteristics of the fire and its associated threat at various locations including evacuation routes, refuge shelters, and residences. For a structure to ignite, some portion of it must be elevated to temperatures necessary for combustion. Energy can be transferred to the structure through direct contact by flame or by burning embers (fire brands). Energy can also be transferred without direct contact by the fire, through both radiation and convection. The expected fire threat level at each household, as well as for each refuge shelter and along evacuation routes, could be parameterized directly by modeling radiative energy transfer based on temperature [63] or reaction intensity [64], or indirectly by using an index that combines multiple energy transfer factors (e.g., [65]). However, energy transfer may not be predictable or measureable for actual wildfire circumstances. Flame length can be predicted or measured in the field, and is closely related to fire intensity [66]. Table 1 contains a hypothetical fire threat scale based on maximum predicted flame lengths. Currently-used fire danger ratings capture expected fire behavior and are also likely suitable for assigning a fire threat level. The U.S. National Fire Danger Rating System (NFDRS) produces a Burning Index (BI) that approximates maximum predicted flame lengths multiplied by a scaling factor [67]. NFDRS also provides an adjective fire danger rating (five descriptors ranging from “low” to “extreme”) based on BI values that may be suitable for assigning a fire threat level. The Canadian Fire Weather Index [68] or the Australian Forest Fire Danger Index [69] could alternatively be used to set fire threat level.
Question (6) addresses the protection offered to each household by each protective option. For example, evacuation might be coded as offering the highest level of life protection (if the exit routes are clear of fuel) because it involves removing people from the threat area. In terms of in-place shelter, the protection offered by a structure will depend on the fuels within the “home ignition zone” and the materials and design of the structure [70]. Residents in fire-prone areas are encouraged to create defensible space surrounding their homes, although in dense, fire-prone communities defensible space also depends on the actions of neighbors [71]. The use of flammable building materials increases likelihood of ignition, especially where flammable roofing material (or flammable debris on the roof) can be ignited by burning embers. Windows broken by thermal expansion [72] and attic vents [73] can also result in structure ignition by allowing embers to enter the interior of the structure. The protection level provided by a household could be parameterized by rating structure materials and design, and fuels surrounding the structure. Rating systems for structure ignition characteristics have already been developed, and one prominent example is the rating system contained within the National Fire Protection Association 1,144 Standard [74].
3.3. Solving the Model
As the formulation in equation (2–5) intentionally favors simplicity over completeness, it does not require integer-programming solution methods to generate an optimal solution. A simple greedy (i.e., take the option that most increases the objective function at each iterative step) algorithm can be used to solve the model. This approach can be stated briefly as, “For each household, identify the protective option that offers the highest level of (life) protection (relative to its expected fire threat level) that meets the time constraints.” This means that each household is treated as a separate problem. For example, if evacuation is scored such that it offers the highest protection level for a household (i.e., greatest protective buffer), and there is sufficient time available for the household to leave safely, this option would be assigned.
For the more complex case where assigning a household to evacuate affects the evacuation time of other households due to possible traffic delays (equation 6), an off-the-shelf integer-programming (IP) solver can be used to identify the optimal solution. In this context, each household cannot be treated as a separate problem, and the objective is to identify a community-wide plan that maximizes overall protection. This can be viewed as a system-optimal plan where it is possible that households with relatively high-quality, easily-accessible, protective shelter may be assigned to shelter-in-place to reduce any traffic delays for other households, such that the overall protection is maximized. This solution method can be stated as, “For a given threatened community, identify the protective assignment plan that maximizes total household protection (relative to the expected fire threat for each household) that meets the time constraints.” This approach to generating protective plans can result in challenging trade-offs depending on the nature of a problem instance.
4. Application
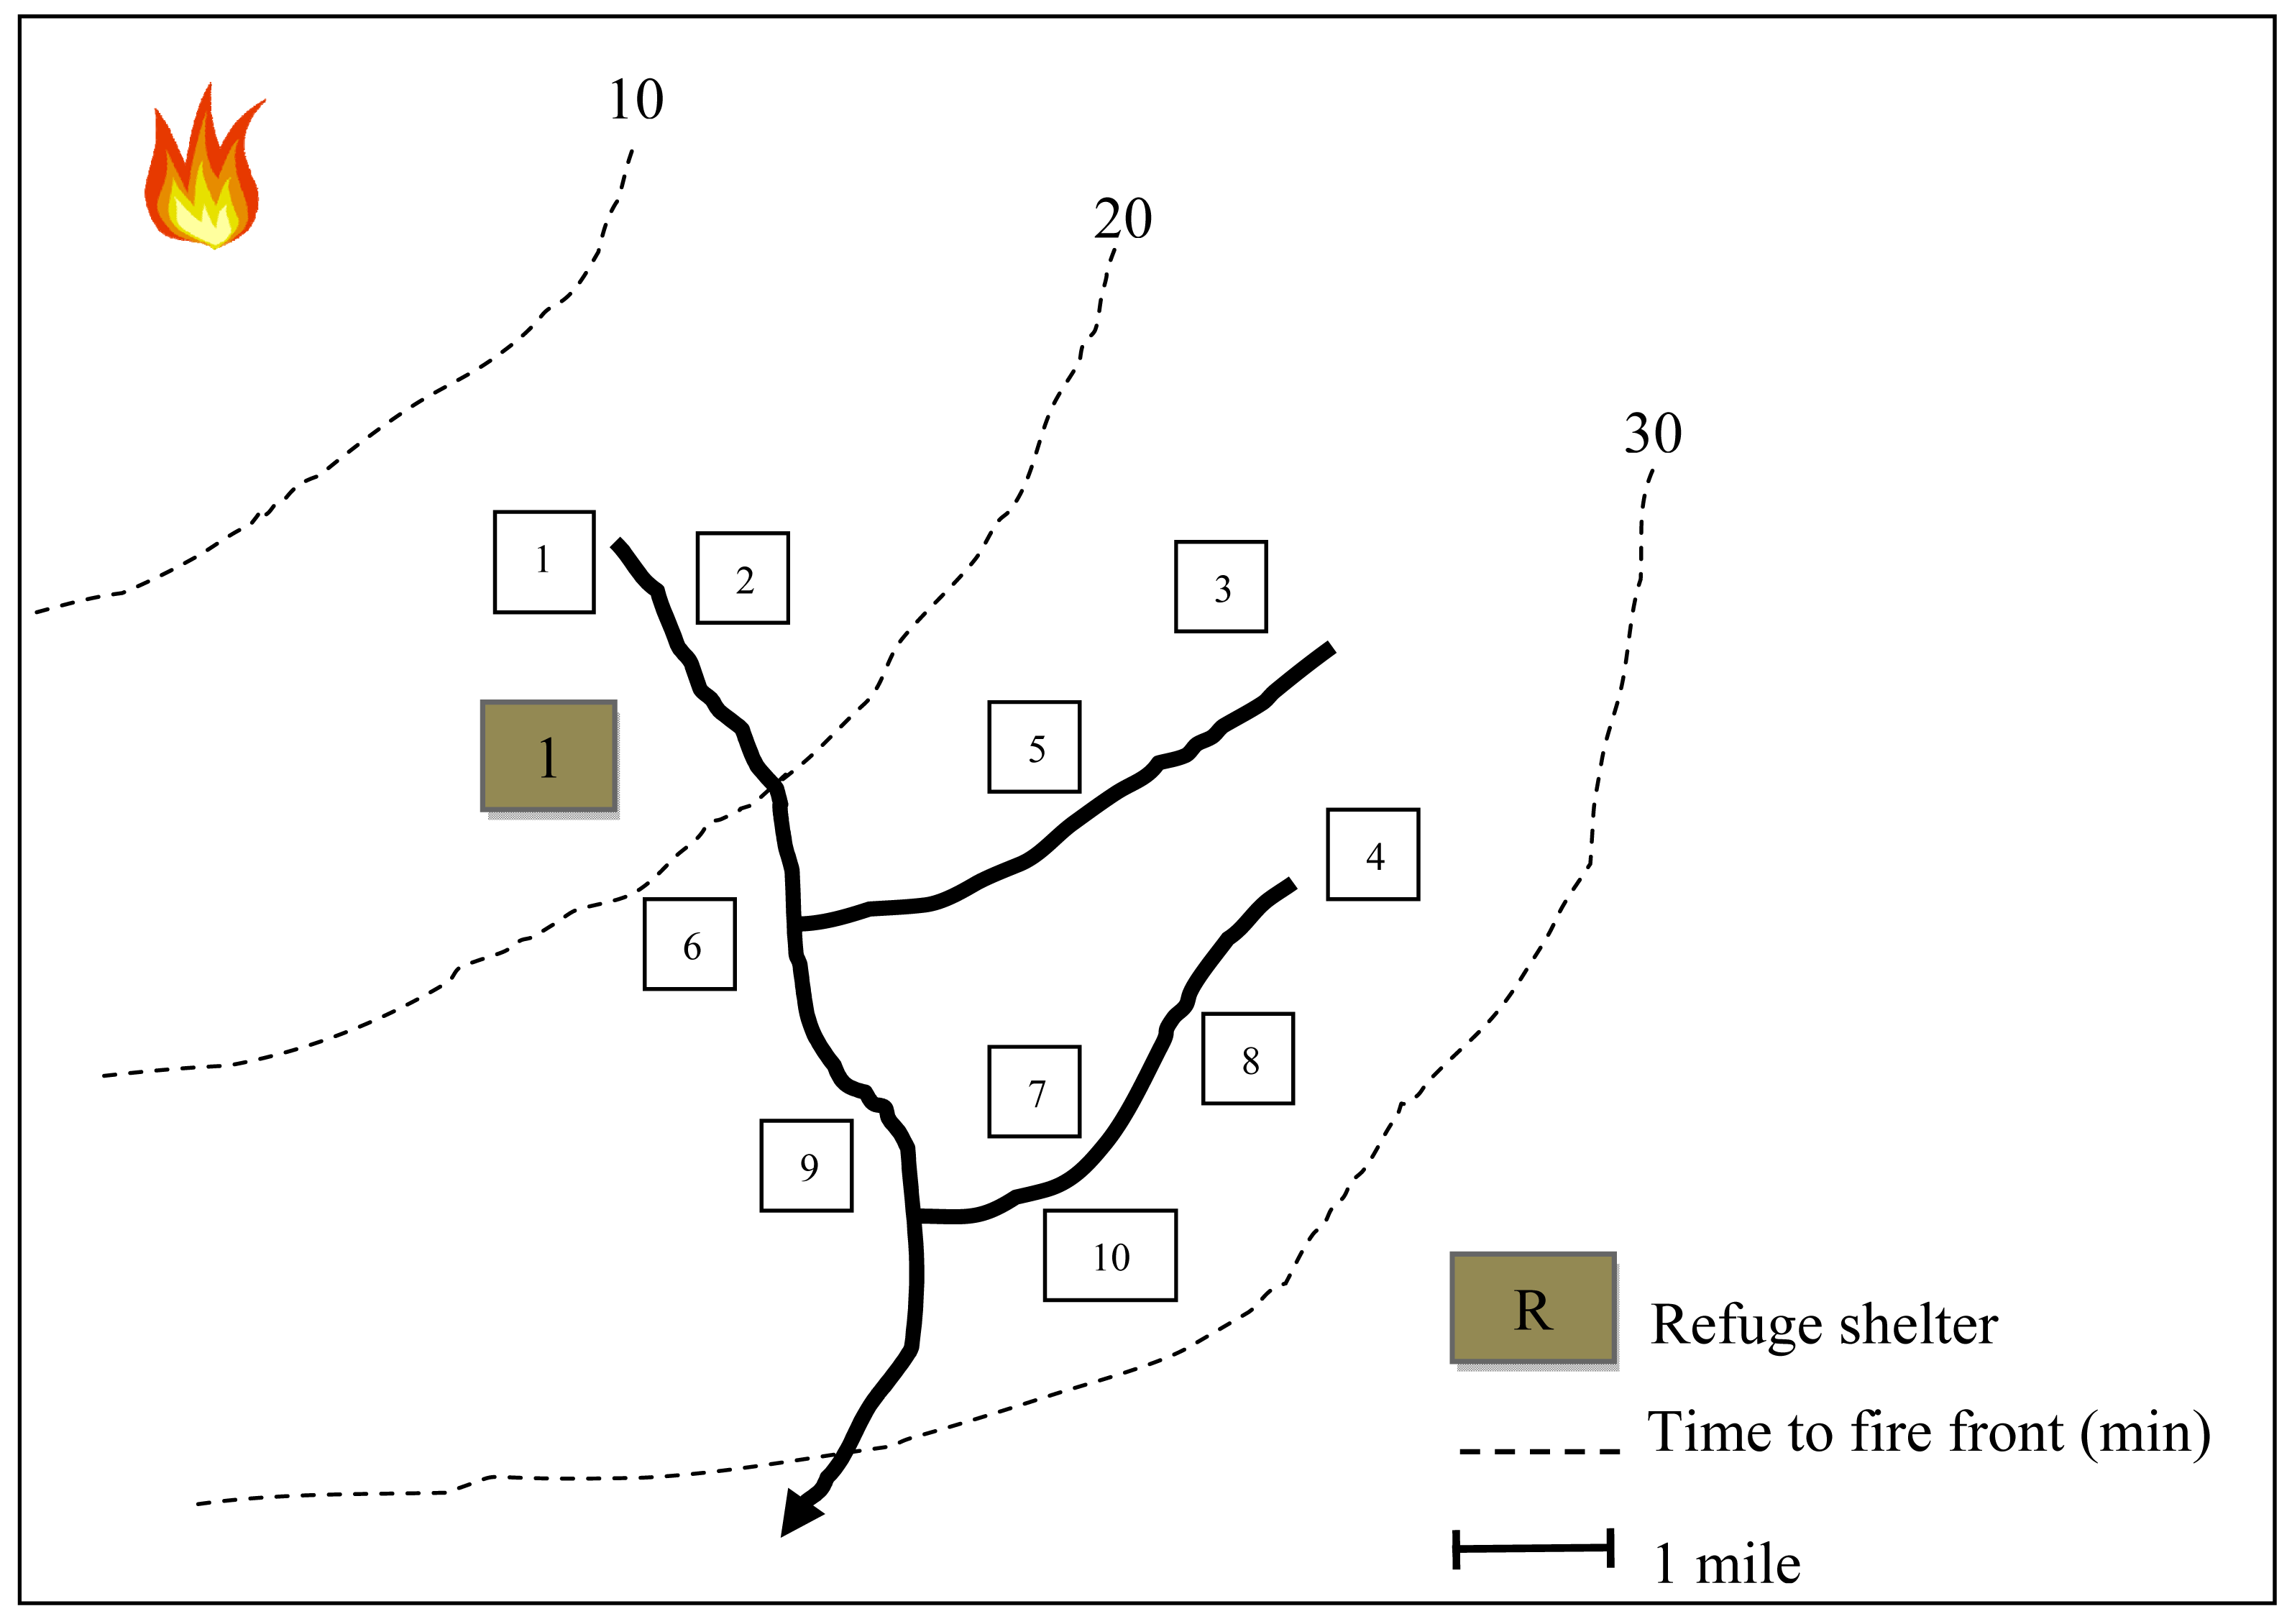
This section presents an application of the model to highlight its behavior across different scenarios (or problem instances), as well as its limitations and potential extensions. The primary goal is to demonstrate how the formulation in equation (2–6) can be used to advance our understanding of protective-action decisions in wildfires. In the process, we introduce rigorous definitions for commonly-used terms in wildfire protective-action planning including late evacuation and well-prepared fire shelter. Figure 2 depicts a small, hypothetical study area of 10 homes with 1 refuge shelter and 1 evacuation exit that is used in the example scenarios. This can be viewed as the only 10 homes in a very sparse community or the 10 remaining households with members at home following an evacuation of the rest of the community. Fire isochrones (lines of equal fire arrival times) are used to represent an urgent fire-spread scenario relative to a reference time.
In the simplest case, there is sufficient time to carry out the full suite of protective options. In most cases emergency managers assume uniformity across all households in terms of variables such as available time, evacuation time and expected fire threat level. While this may conceal household-level variation, its strength lies in simplifying the task of recommending protective actions to a community as a single entity (i.e., one recommendation for everyone). Table 2 depicts a scenario where there is ample time to carry out any action, and the household input variables are assumed to be uniform. Using acronyms drawn from Table 3, the community has 30 minutes available for each of the three possible actions (AE, AR, AH) with an estimated evacuation time of 20 minutes (TE), an estimated SIR time of 10 minutes (TR), and an estimated SIH of 1 minute (TH). In this scenario, evacuation is assumed to provide the highest protection level (PE = 5 or pij = 5 when j is evacuation), and the expected fire threat for evacuation is assumed to not be significant (FE = 1 or fij = 1 when j is evacuation) because the exit routes are assumed to be relatively clear of fuel. This leads to a protective buffer (PE − TE or pij − fij) of 4 for all households under evacuation. Note also that the fire threat level for SIH in this community is very high (FH = 4) which assumes that these structures will be exposed to high-danger fire behavior, and the protection level that the homes offer is scored below this threat level (PH = 3). In short, this is not a community that has been designed to support SIH as an option for high-intensity fires [31].
Solving this uniform scenario yields the case where evacuation offers a protective buffer (PB) of 4, SIR offers a PB of 3, and SIH offers a PB of −1 (i.e., a protective deficit). The plan assigns every household to evacuate with a time buffer (TB) of 10 minutes (i.e., available time minus protection time for the action offering the most protection). At the bottom right corner of the table are the performance metrics for this plan. The sum across households for the protective buffer column is 40, which is the maximum that can be achieved (e.g., pij − fij = 4 for all households), so the plan is considered to offer 100% of the total possible protection for this community. In terms of execution time, the average time buffer (TB) is 10 minutes and the minimum time buffer for any household is also 10 minutes (e.g., Tij − tij = 10 for all households i under j = evacuation).
While it is common to treat a threatened community as a single entity with uniform circumstances to simplify the warning process, in very urgent scenarios the unique geography of households can play a more significant role in determining the best option. Common reasons that may lead to a household's circumstances becoming urgent include: (1) a fast-moving wildfire that ignites very close to the household, (2) a delay in warning receipt or no warning at all, (3) a delayed decision in responding to a warning or environmental cue (e.g., smoke or flames), or (4) prolonged preparation time in carrying out a selected action. It is also important to note that the available time that each household has to execute each action may vary across households as well as across actions. For example, one household may have 20 minutes to travel to a refuge shelter (AR) that takes 15 minutes to reach (RT) while another may only have 10 minutes to travel to the same refuge shelter (AR) that takes 12 minutes to reach (RT).
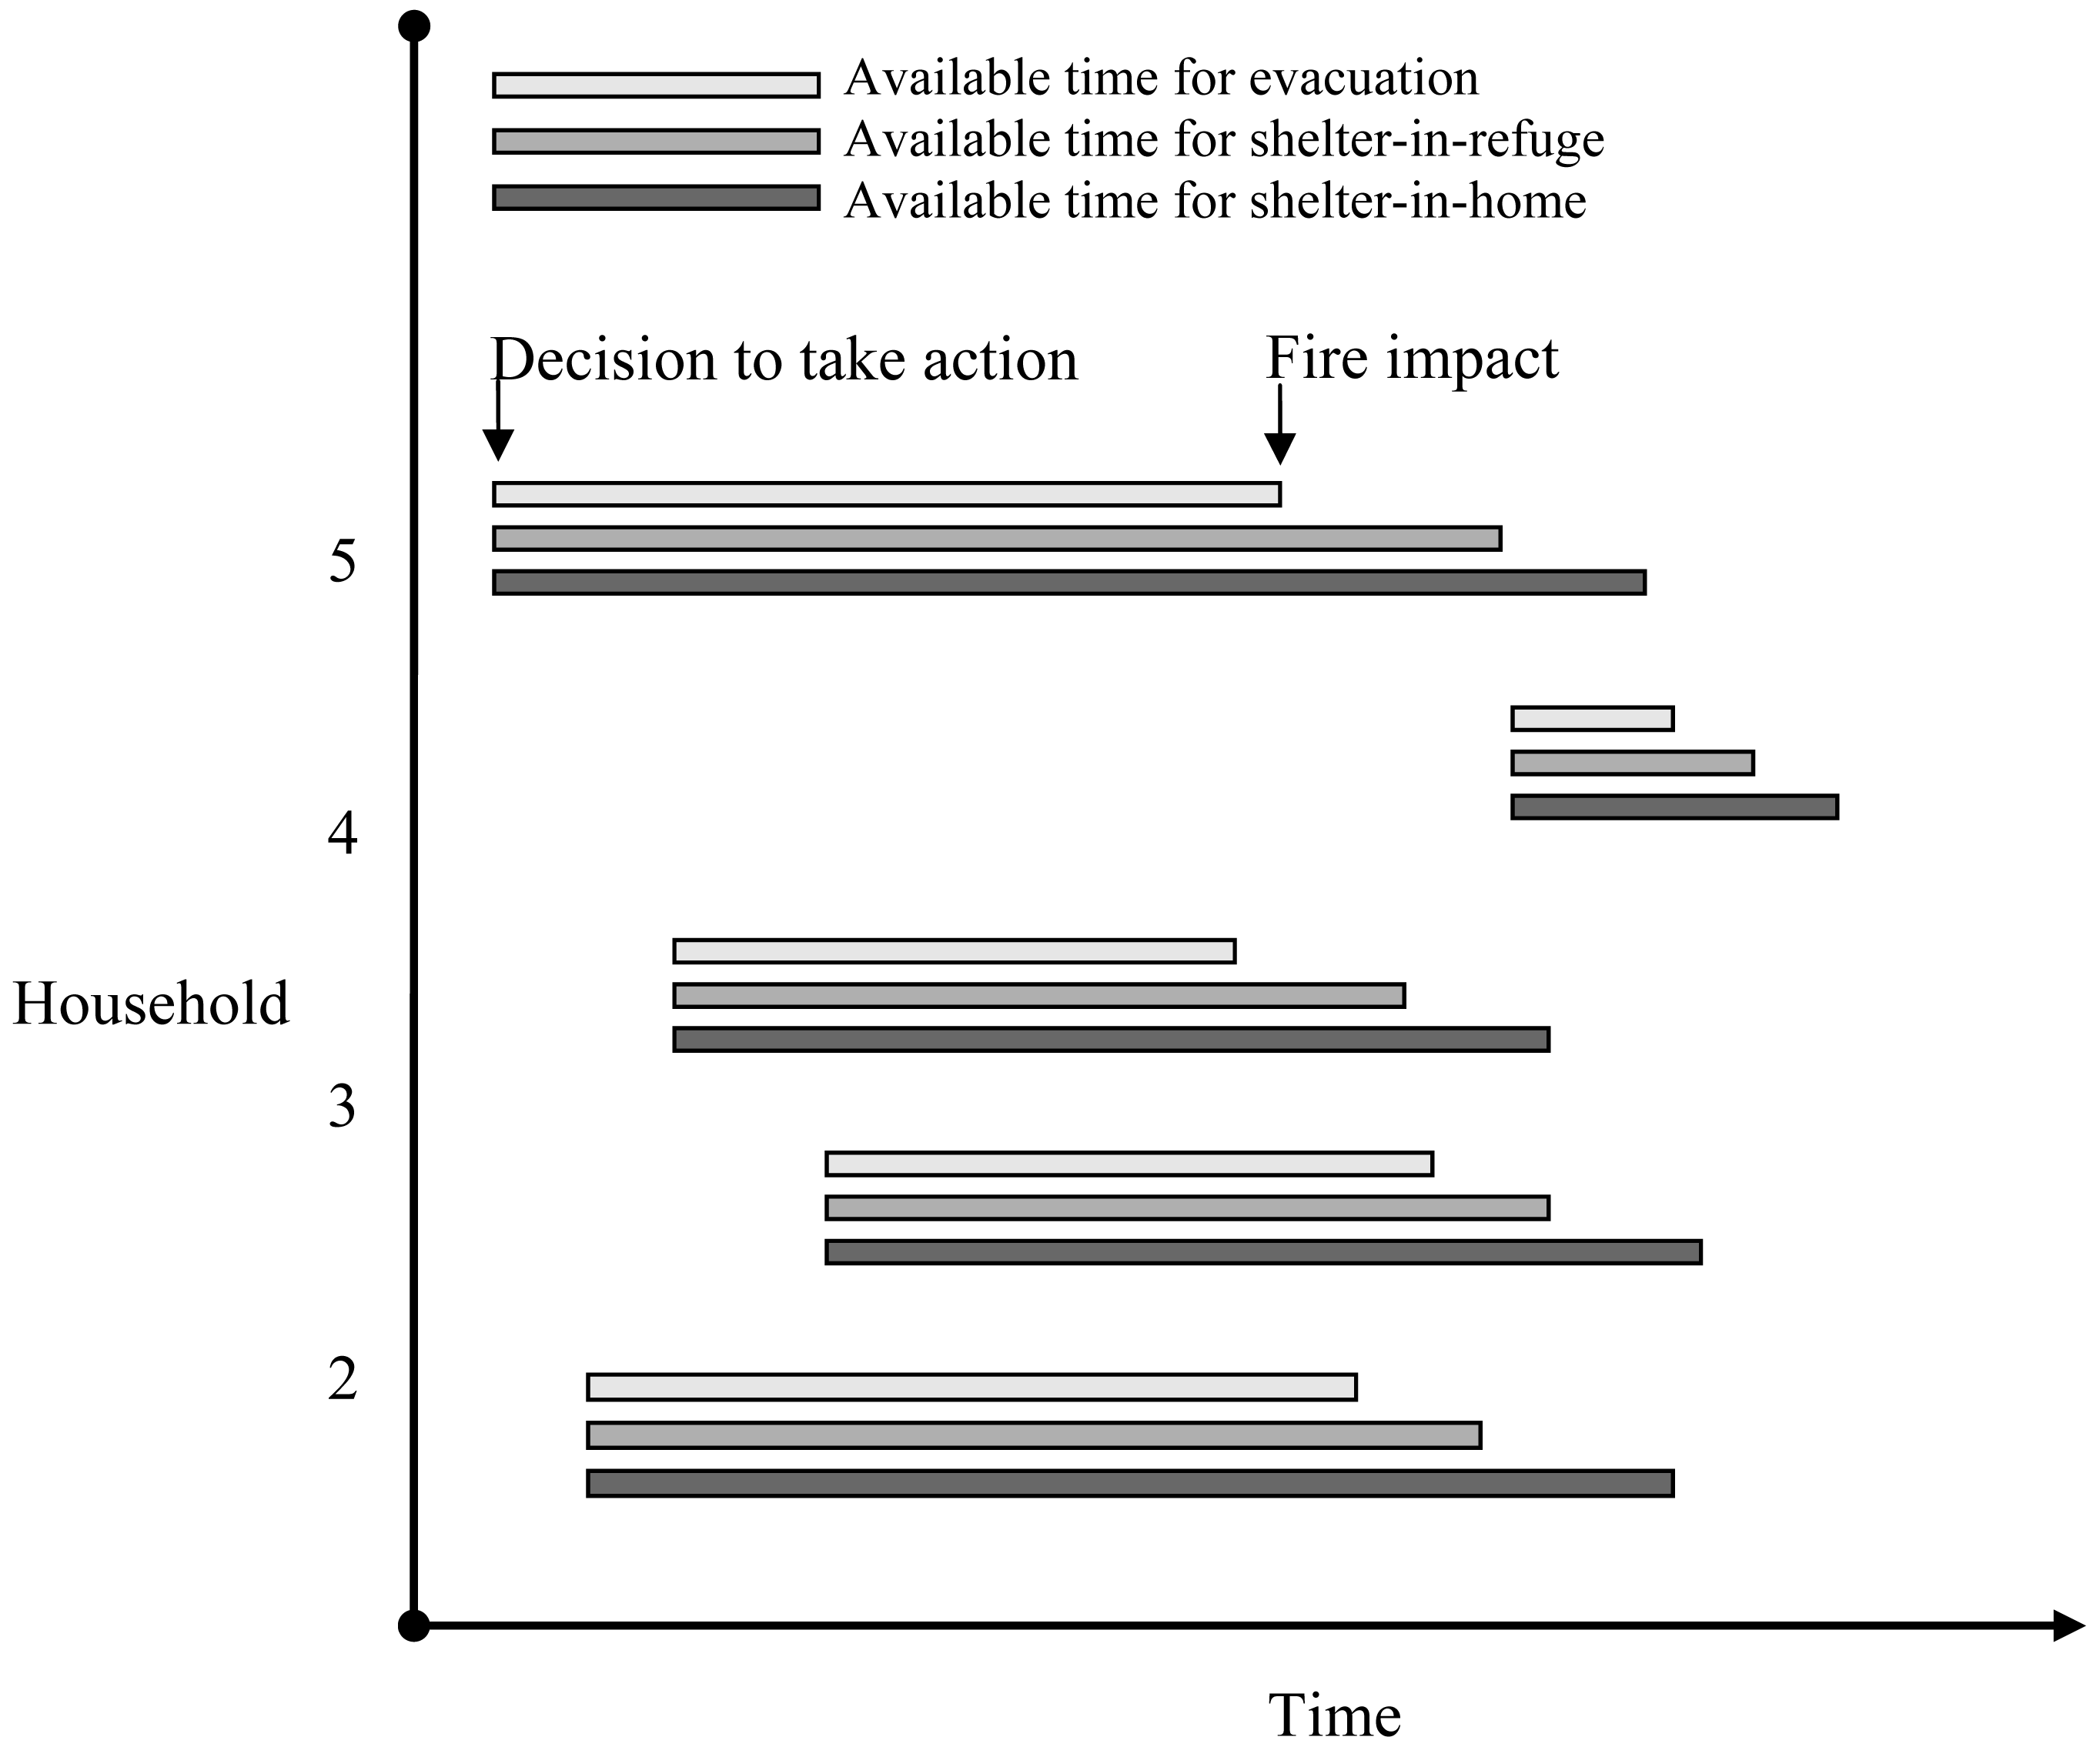
Figure 3 shows an example of how the point in time at which a household decides to take action can vary, as can the time at which the household's options are compromised by the fire. This means that the key variables used to represent the available time that a household has to carry out each option is a function of: (1) the point in time when a household first receives a warning, (2) the time it takes the household to decide whether to take action (e.g., information search and communication with others), (3) the time it takes the household to prepare to execute the action, and (4) the time at which the fire is expected to limit the household's options. In the context of this research, components 1–3 are considered to be “upstream” of our focus [75], where a household's available time to carry out a given action is bounded on either end by the time at which a decision is made to execute the action and the time at which the action is no longer possible. Depending on a fire's direction as well as the configuration of a community's roads, the time available to evacuate may not be as long as the time to seek refuge, as the fire may compromise evacuation routes, effectively removing this option before it compromises the route to a proximal refuge shelter. This is represented in Figure 4 by the different lengths of available time for each option, in that the available time to evacuate is not as long as the time available to reach a refuge or shelter in a home. For example, household 5 in Figure 4 was the first to decide to take action, household 4 was the last to decide to take action, they will both be impacted by the fire at different times, and they each have less time available to evacuate than to shelter in a refuge or at home.
Table 4 depicts a more urgent scenario where detailed variation has been introduced across the household input parameters. The fire-spread scenario in figure 3 was used to guide the estimation of the available time for households to carry out each action which ranges from 10 minutes (household 1's available time to evacuate) up to 28 minutes (household 10's available time to SIH), although there is still room for variation in the available time to execute each option based on when a household decides to take any protective action. Variation has also been introduced in the level of protection offered by each option (PE, PR, PH) as well as the estimated time to execute each option (TE, TR, TH) across households. This scenario leads to a protective plan where most of the community is assigned to evacuate, but three households (1, 2, and 5) are assigned to travel to the refuge shelter. These assignments occur because households 1 and 2 are relatively far from the exit, and their evacuation time exceeds their available time (tij > Tij when j is evacuation). Household 3 is in a unique situation, as its optimal assignment was to SIH because its members have access to a fire-bunker that offers a higher level of protection (PH = 5) than the refuge shelter (PR = 4). In terms of the overall performance of this assignment plan, the sum of the protective buffers (PB) across the households is 37 out of a possible 40 (or 93%), and the average time buffer (TB) across households is 11 minutes with the smallest buffer being household 6's at 5 minutes.
In general, as the available time for households to take action is reduced, the more likely it is that households with longer evacuation times will be assigned to shelter-in-place (SIR or SIH) to avoid potential exposure to the fire along an evacuation route. While this can work well when the level of protection offered by an easily-accessed fire shelter exceeds the expected fire threat-level at the shelter location, it can lead to problems when this condition is not met (e.g., fij > pij). Example recent events where refuge shelter has worked well in the U.S. have typically been large community-based fire shelters (e.g., Westmont College gymnasium in the 2008 Tea Fire, Barona Casino in the 2003 Cedar Fire). To consider these special facilities (e.g., hotels, assisted living facilities, hospitals, campus buildings), an analyst can assume that the time to seek refuge shelter is not a factor when residents are ordered to stay put.
The two scenarios just presented rely on household evacuation time estimates that are exogenous to the model (i.e., an independence assumption). This approach works fine as long as the evacuation travel demand is lower than the evacuation route capacity such that no significant traffic delays occur. This is likely to occur in sparsely-populated areas where evacuees do not interact to the point of affecting one another's evacuation time. However, in the context of cases where many households are in the threat area when a fire impacts a community, this assumption is not tenable, and it is very likely that household evacuation times will be a function of the number of other households that are assigned to evacuate. The simplest approach to this problem is to adopt a conservative (longer) estimate of a given household's evacuation time to include possible traffic delays that may increase evacuation time (i.e., set a household's tij value when j is evacuation to 30 minutes instead of 20 minutes if traffic delays are anticipated). However, in a planning context, it may be valuable to generate plans where the time for a household to evacuate is a function of the number of other households in the community that are assigned to evacuate. In other words, household evacuation times can be endogenously altered within the model, and the evacuation time (and therefore protective assignment) of one household may be affected by the protective assignments of other households (i.e., a dependence assumption). While this is a very dynamic process in practice, it can be initially treated in a simple, static manner to demonstrate its effect on household assignments.
Using equation (6) to represent the effect that assigning many households to evacuate has on household evacuation times, Table 5 shows the same input scenario as Table 4 but with a marginal delay of 1 minute (k = 1) for each additional household that is assigned to evacuate (including itself). This example is analogous to stating that the average increase in each household's evacuation time is 1 minute when another household in the community is assigned to evacuate (i.e., assigning 5 households to evacuate would add 5 minutes to the evacuation time of each of these households). This is a hypothetical example to demonstrate the effect that evacuation delays can have on protective action assignments, as no empirical studies have been done to determine how the evacuation decisions of one household affect the time for other households to evacuate.
In making traffic delays endogenous, as more households are assigned to evacuate, the more household evacuation times will increase. For this reason, households with longer evacuation times without considering traffic delays will more likely be assigned to SIR or SIH (at least in the static case). This also has the effect of decreasing the average protection offered by the overall plan (i.e., a decrease in the protective buffer for some households), as the example scenarios assume that in-place shelter provides less protection than evacuation, in general. Note that in Table 5, household 6 was assigned to SIR because household 4 has a time buffer of 0 for evacuation, and assigning household 6 to evacuate would lead to household 4 being assigned to SIR. This means that with traffic delays included, one of these households can be assigned to evacuate but not both. This also had the effect of lowering household 6's protective buffer from 4 to 3 in Table 5, and the overall protection offered by this plan drops from 93% to 90%. In terms of overall plan performance, the average time buffer drops from 11 to 9, and the minimum time buffer is household 4's who has no time buffer at all (AE − TD = 0).
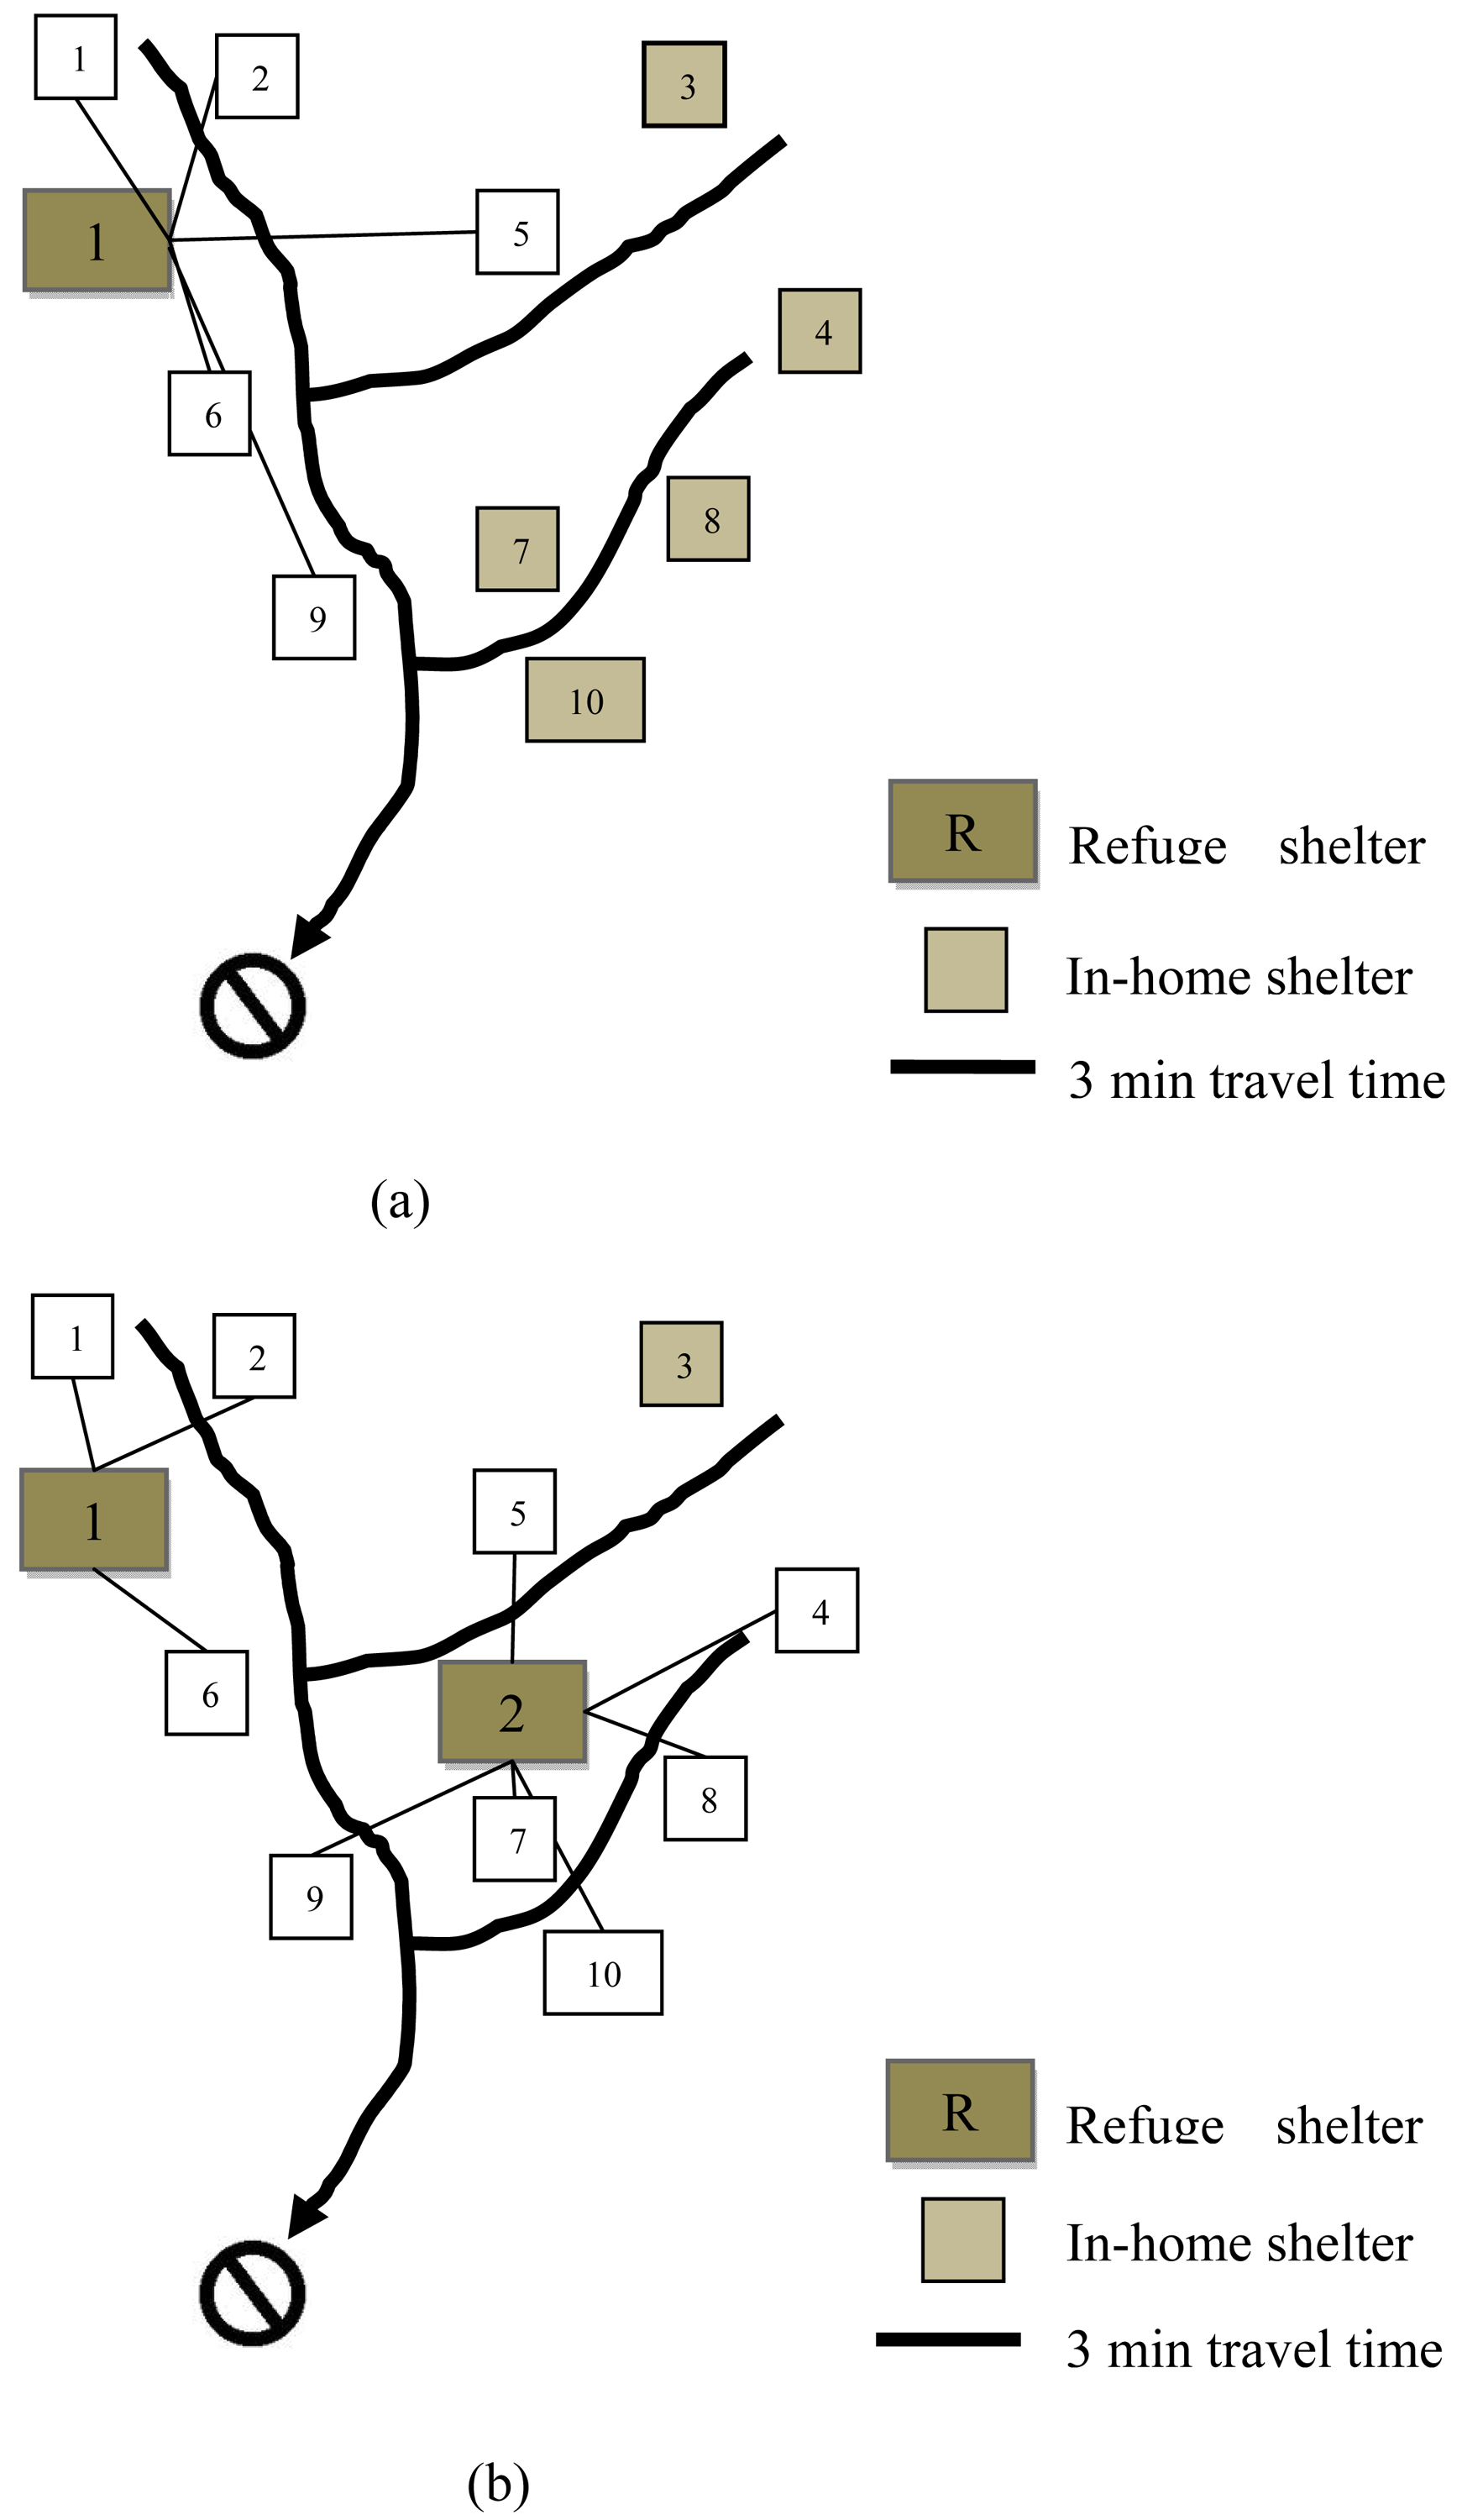
The final example considers the extreme (and rare) case where the sole evacuation exit has been blocked by the fire. Table 6(a) shows a case where the available time to evacuate was set to 5 minutes to render this option infeasible for all households. This might occur if a fire spreads up-canyon thereby blocking the community exit at the onset. The result is a mixture of assignments to SIR and SIH with varying levels of protection ranging from −3 for household 7 (a severe protective deficit) to 4 for households 3 (e.g., a home with an underground fire bunker). The overall performance of this plan is (not surprisingly) very poor at 38% of the maximum possible protection, as households 7, 8 and 10 are unable to reach the refuge shelter in time and were assigned to SIH in structures that offer less than the required protection given the expected fire threat level. Table 6(b) shows the effect of constructing a new refuge shelter near household 7 that offers a high protection level (PL = 4). Solving the problem instance in 6 (b) with the second community refuge shelter has the effect of assigning all but household 3 to a refuge shelter with no home having a protective deficit. The result is a plan that jumps from 38% protection to 78% protection. However, the average time-buffer drops from 12 minutes to 9 minutes because some households must now travel to a refuge shelter instead of being assigned to SIH. Figure 4 depicts the assignments shown before (a) and after (b) the addition of a new refuge shelter.
5. Discussion
The proposed model for improving our understanding of protective actions (as well as generating protective plans) represents a simple and clearly articulated means for formalizing this problem. It can be viewed as a first step toward the prescriptive modeling of wildfire protective actions, as it manages to integrate many of the key factors that come to bear in this decision context including: the protective level offered by each option, the expected fire threat level for each option, the time available to execute each option, and the time required to execute each option.
One of the most significant challenges in the context of prescriptive protective-action modeling is initializing a model's parameters. While the model presented is straightforward, extensible, and relatively easy-to-solve, it relies on many assumptions, not the least of which includes perfect knowledge of the inputs. Clearly, there is room for disagreement with the parameters that were chosen in the application section. However, this can be viewed as a positive in terms of research, as the model forces an expert to quantify his/her view of the key parameters at play in a given scenario. Also, in the dynamic and uncertain context that protective decisions are routinely made, the model should not be viewed as ready for operational use, as it is unlikely that all the parameters could be gathered on-the-fly with the required accuracy to make an optimal choice. However, formalizing the problem is a step forward in understanding why protective decisions in wildfires are so complex when there are so few options available.
One interesting research area to examine in the context of a formal, prescriptive model for protective decisions is developing a rigorous typology of common errors that can lead to adverse outcomes in a real scenario. While these errors have been discussed in the context of past events, they have not been treated formally. Typical errors include:
Over-estimating the available time to take a given protective action (Tij).
Under-estimating the time required to execute a given protective action (tij).
Over-estimating the protection level offered by a given option (pij).
Under-estimating the expected fire threat level at a given location (fij).
In more detail, error 1 above refers to over-estimating the available time to execute a given protective action. This can also be viewed as underestimating fire-spread rate or incorrectly predicting its direction, but the outcome is the same—a household or community has less time to take action than estimated. This error has received the most attention in the context of evacuation because a number of fatalities in past events have been ascribed to this error [41,42]. The term late evacuation has been used widely [9] in reference to cases where the time buffer (Tij − tij) is relatively small, leading to uncertainty as to whether a safe evacuation is feasible, or if an evacuee might be overcome by the effects of a fire in-transit. In a sense, much of the research and policy in Australia has been dedicated to reducing the likelihood of this error [43]. Formally, a late evacuation can be defined as:
The focus of errors 3 and 4 is the perceived threat level and associated protection level offered by competing options. In this case, a household may have succeeded in sheltering-in-place in time (i.e., available time and time to execute action correctly assessed), but the refuge or home may not offer the perceived level of protection. Similarly, the shelter may in fact provide the expected level of protection, but the fire threat-level may be higher than expected at the time of impact. Thus, in a similar manner to errors 1 and 2, errors 3 and 4 may occur together where a household perceives more protection than they have at the same time that they expect a lower fire threat level. Although this situation does not have a common name in the wildfire research literature, it can be viewed as a protective deficit and formalized as follows:
One commonality shared among the above error types is that they all involve overly optimistic assumptions. In the literature on cognitive biases the types of error above can be categorized as planning fallacies [79]. In this way, developing models such as the one presented here may help identify assumptions that are more robust or ones that are overly optimistic, such that the likelihood of errors can be reduced. Examples in this regard include over-estimating either the time available to evacuate or the protection offered by a given form of in-place shelter, or underestimating either the time required to evacuate or the expected fire threat-level.
Earlier we raised the issue of allowing (or encouraging) households to actively defend property against a wildfire. The model presented in this paper does not include the protection of property in the objective, yet research has shown that an active defense of a structure can improve its chances of survival [43]. In a number of studies it has been shown that the chance that a structure survives is improved by the presence of one or more household members who can actively defend the structure against embers as well as suppress the fire in general. The goal of including the protection of property would lead to a different objective, model, and tradeoffs than presented here. While formalizing this problem is left for further research, a model that incorporates the goal of improving structure survivability is likely to favor SIH over SIR (or evacuation) because it would lead to a higher property protection level and less household disruption. However, it is important to note that although the disruption caused by SIH is less than SIR and evacuation (and it may provide a means to protect property), it can come with higher up-front investment costs because a structure must be fortified to withstand the worst-case fire threat-level.
Finally, the model has a significant set of assumptions and does not consider many factors that may play an important role in certain scenarios including refuge shelter capacity, impediments to the family gathering process, traffic congestion dynamics (e.g., non-linear delays), the ability to recommend more than one action to a single household, warning time variation, the quality of evacuation routes, compliance with official recommendations, change in the model factors, and many others. While these can be viewed as shortcomings of the model presented here, they are also positives in the sense of providing fertile directions for further research and development in the prescriptive modeling and assessment of wildfire protective actions. At the same time, the model might also serve as a useful means for bringing community stakeholders together to discuss fire preparedness and mitigation planning.
6. Conclusions
This paper offers a preliminary step in formalizing the challenging problem of recommending optimal protective actions in urgent wildfire scenarios. There are many possible views on the objectives, constraints, decision variables, and parameters of such a decision support model. The broader goal of this research is to highlight that there are potential benefits in formalizing protective-action decisions and quantifying any associated parameters both in terms of improving our understanding of these decisions as well as advancing the discussion of this controversial problem. This represents a challenging yet potentially valuable new area for the decision sciences in general and spatial optimization in particular. In short, the model presented here offers a step forward in formalizing an interesting decision problem, but it should only be viewed as a theoretical starting point in a highly complex, dynamic, and uncertain research area in practice.
Protective-action decisions are challenging and the stakes are no less than life-or-death in some scenarios. The real challenge arises not as much from the number of choices but from the number of factors that enter into the decision, as well as the dynamic, uncertain nature of these factors. In general, effectively communicating the best recommended protection-actions to threatened citizens represents a significant challenge that will keep researchers and emergency managers busy for the foreseeable future.


| Level | Fire threat level (flame length) | Protection level offered by option j |
|---|---|---|
| 1 | Very low (< 1 m) | Very low-protection against the effects of very low threat fires. |
| 2 | Low (1–2 m) | Low-protection against the effects of low threat fires. |
| 3 | Moderate (2–4 m) | Moderate-protection against the effects of moderate threat fires. |
| 4 | High (4–8 m) | High-protection against the effects of high threat fires. |
| 5 | Extreme (> 8 m) | Extreme-protection against the effects of extreme threat fires. |
| H# | FE | FR | FH | AE | AR | AH | PE | TE | PR | TR | PH | TH | Best | PL | PB | PT | TB |
|---|---|---|---|---|---|---|---|---|---|---|---|---|---|---|---|---|---|
| 1 | 1 | 1 | 4 | 30 | 30 | 30 | 5 | 20 | 4 | 10 | 3 | 1 | evac | 5 | 4 | 20 | 10 |
| 2 | 1 | 1 | 4 | 30 | 30 | 30 | 5 | 20 | 4 | 10 | 3 | 1 | evac | 5 | 4 | 20 | 10 |
| 3 | 1 | 1 | 4 | 30 | 30 | 30 | 5 | 20 | 4 | 10 | 3 | 1 | evac | 5 | 4 | 20 | 10 |
| 4 | 1 | 1 | 4 | 30 | 30 | 30 | 5 | 20 | 4 | 10 | 3 | 1 | evac | 5 | 4 | 20 | 10 |
| 5 | 1 | 1 | 4 | 30 | 30 | 30 | 5 | 20 | 4 | 10 | 3 | 1 | evac | 5 | 4 | 20 | 10 |
| 6 | 1 | 1 | 4 | 30 | 30 | 30 | 5 | 20 | 4 | 10 | 3 | 1 | evac | 5 | 4 | 20 | 10 |
| 7 | 1 | 1 | 4 | 30 | 30 | 30 | 5 | 20 | 4 | 10 | 3 | 1 | evac | 5 | 4 | 20 | 10 |
| 8 | 1 | 1 | 4 | 30 | 30 | 30 | 5 | 20 | 4 | 10 | 3 | 1 | evac | 5 | 4 | 20 | 10 |
| 9 | 1 | 1 | 4 | 30 | 30 | 30 | 5 | 20 | 4 | 10 | 3 | 1 | evac | 5 | 4 | 20 | 10 |
| 10 | 1 | 1 | 4 | 30 | 30 | 30 | 5 | 20 | 4 | 10 | 3 | 1 | evac | 5 | 4 | 20 | 10 |
| sum | 40 | avg | 10 | ||||||||||||||
| pct | 100 | min | 10 | ||||||||||||||
| Acro. | Name | Description | Symbol(s) | Range | Units |
|---|---|---|---|---|---|
| FE | fire threat (evac) | threat along evac route | fi1 | 1–5 | level |
| FR | fire threat (refuge) | threat to and at refuge | fi2 | 1–5 | level |
| FH | fire threat (home) | threat at home location | fi3 | 1–5 | level |
| AE | available time (evac) | time available for evac | Ti1 | 0–n | min |
| AR | available time (refuge) | time available for SIR | Ti2 | 0–n | min |
| AH | available time (home) | Time available for SIH | Ti3 | 0–n | min |
| PE | protection (evac) | protection under evac | pi1 | 1–5 | level |
| PR | protection (refuge) | protection under SIR | pi2 | 1–5 | level |
| PH | Protection (home) | protection under SIH | pi3 | 1–5 | level |
| TE | time (evac) | time to evacuate | ti1 | 0–n | min |
| TR | time (refuge) | time to SIR | ti2 | 0–n | min |
| TD | TE with traffic delay | evac time with traffic delay | equation 6 | 0–n | min |
| TH | time (home) | time to SIH | ti3 | 0–n | min |
| PL | protection level | protect level (best option) | pij | 1–5 | level |
| PT | protection time | protect time (best option) | tij | 0–n | min |
| PB | buffer protection | (PL – FL) for best option | (pij − fij) | −4–5 | level |
| TB | buffer time | (PT – AT) for best option | (tij − Tij) | 0–n | min |
| H# | FE | FR | FH | AE | AR | AH | PE | TE | PR | TR | PH | TH | Best | PL | PB | PT | TB |
|---|---|---|---|---|---|---|---|---|---|---|---|---|---|---|---|---|---|
| 1 | 1 | 1 | 3 | 10 | 12 | 13 | 5 | 20 | 4 | 3 | 3 | 1 | refuge | 4 | 3 | 3 | 9 |
| 2 | 1 | 1 | 4 | 13 | 15 | 16 | 5 | 18 | 4 | 3 | 3 | 1 | refuge | 4 | 3 | 3 | 12 |
| 3 | 1 | 1 | 1 | 17 | 18 | 22 | 5 | 24 | 4 | 10 | 5 | 1 | house | 5 | 4 | 1 | 21 |
| 4 | 1 | 1 | 3 | 20 | 18 | 26 | 5 | 15 | 4 | 15 | 3 | 1 | evac | 5 | 4 | 15 | 5 |
| 5 | 1 | 1 | 1 | 16 | 18 | 21 | 5 | 18 | 4 | 7 | 2 | 1 | refuge | 4 | 3 | 7 | 11 |
| 6 | 1 | 1 | 3 | 17 | 18 | 20 | 5 | 12 | 4 | 3 | 1 | 1 | evac | 5 | 4 | 12 | 5 |
| 7 | 1 | 1 | 5 | 18 | 18 | 25 | 5 | 9 | 4 | 9 | 2 | 1 | evac | 5 | 4 | 9 | 9 |
| 8 | 1 | 1 | 2 | 21 | 18 | 26 | 5 | 12 | 4 | 12 | 3 | 1 | evac | 5 | 4 | 12 | 9 |
| 9 | 1 | 1 | 3 | 18 | 18 | 24 | 5 | 9 | 4 | 6 | 2 | 1 | evac | 5 | 4 | 9 | 9 |
| 10 | 1 | 1 | 3 | 26 | 18 | 28 | 5 | 9 | 4 | 10 | 1 | 1 | evac | 5 | 4 | 9 | 17 |
| sum | 37 | avg | 11 | ||||||||||||||
| pct | 93 | min | 5 | ||||||||||||||
| H# | FE | FR | FH | AE | AR | AH | PE | TE | PR | TR | PH | TH | Best | PL | PB | PT | TB | TD |
|---|---|---|---|---|---|---|---|---|---|---|---|---|---|---|---|---|---|---|
| 1 | 1 | 1 | 3 | 10 | 12 | 13 | 5 | 20 | 4 | 3 | 3 | 1 | refuge | 4 | 3 | 3 | 9 | 25 |
| 2 | 1 | 1 | 4 | 13 | 15 | 16 | 5 | 18 | 4 | 3 | 3 | 1 | refuge | 4 | 3 | 3 | 12 | 23 |
| 3 | 1 | 1 | 1 | 17 | 18 | 22 | 5 | 24 | 4 | 10 | 5 | 1 | house | 5 | 4 | 1 | 21 | 29 |
| 4 | 1 | 1 | 3 | 20 | 18 | 26 | 5 | 15 | 4 | 15 | 3 | 1 | evac | 5 | 4 | 20 | 0 | 20 |
| 5 | 1 | 1 | 1 | 16 | 18 | 21 | 5 | 18 | 4 | 7 | 2 | 1 | refuge | 4 | 3 | 7 | 11 | 23 |
| 6 | 1 | 1 | 3 | 17 | 18 | 20 | 5 | 12 | 4 | 3 | 1 | 1 | refuge | 4 | 3 | 3 | 15 | 17 |
| 7 | 1 | 1 | 5 | 18 | 18 | 25 | 5 | 9 | 4 | 9 | 2 | 1 | evac | 5 | 4 | 14 | 4 | 14 |
| 8 | 1 | 1 | 2 | 21 | 18 | 26 | 5 | 12 | 4 | 12 | 3 | 1 | evac | 5 | 4 | 17 | 4 | 17 |
| 9 | 1 | 1 | 3 | 18 | 18 | 24 | 5 | 9 | 4 | 6 | 2 | 1 | evac | 5 | 4 | 14 | 4 | 14 |
| 10 | 1 | 1 | 3 | 26 | 18 | 28 | 5 | 9 | 4 | 10 | 1 | 1 | evac | 5 | 4 | 14 | 12 | 14 |
| sum | 36 | avg | 9 | |||||||||||||||
| pct | 90 | min | 0 | |||||||||||||||
| H# | FE | FR | FH | AE | AR | AH | PE | TE | PR | TR | PH | TH | Best | PL | PB | PT | TB |
|---|---|---|---|---|---|---|---|---|---|---|---|---|---|---|---|---|---|
| 1 | 1 | 1 | 3 | 5 | 20 | 25 | 5 | 20 | 4 | 3 | 3 | 1 | refuge | 4 | 3 | 3 | 17 |
| 2 | 1 | 1 | 4 | 5 | 20 | 25 | 5 | 18 | 4 | 3 | 3 | 1 | refuge | 4 | 3 | 3 | 17 |
| 3 | 1 | 1 | 1 | 5 | 10 | 20 | 5 | 24 | 4 | 10 | 5 | 1 | house | 5 | 4 | 1 | 19 |
| 4 | 1 | 1 | 3 | 5 | 7 | 15 | 5 | 15 | 4 | 15 | 3 | 1 | house | 3 | 0 | 1 | 14 |
| 5 | 1 | 1 | 1 | 5 | 10 | 20 | 5 | 18 | 4 | 7 | 2 | 1 | refuge | 4 | 3 | 7 | 3 |
| 6 | 1 | 1 | 3 | 5 | 10 | 20 | 5 | 12 | 4 | 3 | 1 | 1 | refuge | 4 | 3 | 3 | 7 |
| 7 | 1 | 1 | 5 | 5 | 7 | 15 | 5 | 9 | 4 | 9 | 2 | 1 | house | 2 | −3 | 1 | 14 |
| 8 | 1 | 1 | 2 | 5 | 7 | 15 | 5 | 12 | 4 | 12 | 3 | 1 | house | 3 | 1 | 1 | 14 |
| 9 | 1 | 1 | 3 | 5 | 7 | 15 | 5 | 9 | 4 | 6 | 2 | 1 | refuge | 4 | 3 | 6 | 1 |
| 10 | 1 | 1 | 3 | 5 | 7 | 15 | 5 | 9 | 4 | 10 | 1 | 1 | house | 1 | −2 | 1 | 14 |
| sum | 15 | avg | 12 | ||||||||||||||
| (a) | pct | 38 | min | 1 | |||||||||||||
| 1 | 1 | 1 | 3 | 5 | 20 | 25 | 5 | 20 | 4 | 3 | 3 | 1 | refuge | 4 | 3 | 3 | 17 |
| 2 | 1 | 1 | 4 | 5 | 20 | 25 | 5 | 18 | 4 | 3 | 3 | 1 | refuge | 4 | 3 | 3 | 17 |
| 3 | 1 | 1 | 1 | 5 | 10 | 20 | 5 | 24 | 4 | 6 | 5 | 1 | house | 5 | 4 | 1 | 19 |
| 4 | 1 | 1 | 3 | 5 | 7 | 15 | 5 | 15 | 4 | 6 | 3 | 1 | refuge | 4 | 3 | 6 | 1 |
| 5 | 1 | 1 | 1 | 5 | 10 | 20 | 5 | 18 | 4 | 2 | 2 | 1 | refuge | 4 | 3 | 2 | 8 |
| 6 | 1 | 1 | 3 | 5 | 10 | 20 | 5 | 12 | 4 | 3 | 1 | 1 | refuge | 4 | 3 | 3 | 7 |
| 7 | 1 | 1 | 5 | 5 | 7 | 15 | 5 | 9 | 4 | 1 | 2 | 1 | refuge | 4 | 3 | 1 | 6 |
| 8 | 1 | 1 | 2 | 5 | 7 | 15 | 5 | 12 | 4 | 2 | 3 | 1 | refuge | 4 | 3 | 2 | 5 |
| 9 | 1 | 1 | 3 | 5 | 7 | 15 | 5 | 9 | 4 | 3 | 2 | 1 | refuge | 4 | 3 | 3 | 4 |
| 10 | 1 | 1 | 3 | 5 | 7 | 15 | 5 | 9 | 4 | 3 | 1 | 1 | refuge | 4 | 3 | 3 | 4 |
| sum | 31 | avg | 9 | ||||||||||||||
| (b) | pct | 78 | min | 1 | |||||||||||||
Acknowledgments
This research was supported by NSF grants CMMI-IMEE 065372 and 1100890. The lead author would like to thank the U.S. Department of Homeland Security for support to attend an international workshop hosted by Bushfire Cooperative Research Center (CRC) in Melbourne, Australia in 2010. Mike Lindell, Dave Theobald, and the anonymous reviewers provided valuable comments that greatly improved this paper.
References and Notes
- Keeley, J.E.; Safford, H.; Fotheringham, C.J.; Franklin, J.; Moritz, M. The 2007 Southern California wildfires: Lessons in complexity. J. For. 2009, 107, 287–296. [Google Scholar]
- Haight, R.G.; Cleland, D.T.; Hammer, R.B.; Radeloff, V.C.; Rupp, T.S. Assessing fire risk in the wildland-urban interface. J. For. 2004, 102, 41–47. [Google Scholar]
- Radeloff, V.C.; Hammer, R.B.; Stewart, S.I.; Fried, J.S.; Holcomb, S.S.; McKeefry, J.F. The wildland-urban interface in the United States. Ecol. Appl. 2005, 15, 799–805. [Google Scholar]
- Theobald, D.M.; Romme, W.H. Expansion of the US wildland-urban interface. Landsc. Urban Plan. 2007, 83, 340–354. [Google Scholar]
- Spyratos, V.; Bourgeron, P.S.; Ghil, M. Development at the wildland-urban interface and the mitigation of forest-fire risk. Proc. Natl. Acad. Sci. USA. 2007, 104, 14272–14276. [Google Scholar]
- Paveglio, T.B.; Jakes, P.J.; Carroll, M.S.; Williams, D.R. Understanding social complexity within the wildland-urban interface: A new species of human habitation? Environ. Manage. 2009, 43, 1085–1095. [Google Scholar]
- Cova, T.J.; Drews, F.A.; Siebeneck, L.K.; Musters, A. Protective actions in wildfires: Evacuate or shelter-in-place? Nat. Hazards Rev. 2009, 10, 151–162. [Google Scholar]
- Baxter, G.; Alexander, M. Travel rates by Alberta wildland firefighters using escape routes on a moderately steep slope. Advantage 2004, 5, 1–15. [Google Scholar]
- Handmer, J.; Tibbits, A. Is staying at home the safest option during bushfires? Historical evidence for an Australian approach. Glob. Environ. Change Part B Environ. Hazards 2005, 6, 81–91. [Google Scholar]
- Blackwell, J.A.; Tuttle, A. California Fire Siege 2003: The Story; California Department of Forestry and Fire Protection: Sacramento, CA, USA, 2003. [Google Scholar]
- Mutch, R.W. Faces: The story of the victims of the southern California's 2003 fire siege; Wildland Fire Lessons Learned Center: Tucson, USA, 2007. Available online: http://www.wildfirelessons.net/documents/FACES.pdf (accessed on 27 July 2011).
- Weiss, K.R.; Chawkins, S. A long night of fear in the college gym. Los Angeles Times, 15 November 2008. Available online: http://articles.latimes.com/2008/nov/15/local/me-college15 (accessed on 22 September 2011). [Google Scholar]
- Perry, R.W. Comprehensive Emergency Management: Evacuating Threatened Populations; JAI Press: Greenwich, CT, USA, 1985. [Google Scholar]
- Tierney, K.J.; Lindell, M.K.; Perry, R.W. Facing the Unexpected: Disaster Preparedness and Response in the United States; Joseph Henry: Washington, DC, USA, 2001. [Google Scholar]
- Vogt, B.M.; Sorensen, J. Evacuation Research: A Reassessment; ORNL/TM11908; Oak Ridge National Laboratory: Oak Ridge, TN, USA, 1992. [Google Scholar]
- Dash, N.; Gladwin, H. Evacuation decision making and behavioral responses: Individual and household. Nat. Hazards Rev. 2007, 8, 69–77. [Google Scholar]
- Mileti, D.S.; Sorensen, J.H. Communication of Emergency Public Warnings: A Social Perspective and State-of-the-Art Assessment; Federal Emergency Management Agency: Washington, DC, USA, 1990. [Google Scholar]
- Sorensen, J.H. Hazard warning systems: Review of 20 years of progress. Nat. Hazards Rev. 2000, 1, 119–125. [Google Scholar]
- Lindell, M.K.; Perry, R.W. Communicating Environmental Risk in Multiethnic Communities; Sage Publications: Thousand Oaks, CA, USA, 2004. [Google Scholar]
- Southworth, F. Regional Evacuation Modeling: A State-of-the-Art Review; ORNL/TM-11740; Oak Ridge National Laboratory: Oak Ridge, TN, USA, 1991. [Google Scholar]
- Church, R.L.; Sexton, R.M. Modeling small area evacuation: Can existing transportation infrastructure impede public safety? National Consortium for Remote Sensing in Transportation: Santa Barbara, CA, USA, 2002. Available online: http://www.ncgia.ucsb.edu/vital/research/pubs/200204-Evacuation.pdf (accessed on 27 July 2011).
- Cova, T.J.; Johnson, J.P. Microsimulation of neighborhood evacuations in the urban-wildland interface. Environ. Plan. A 2002, 34, 2211–2229. [Google Scholar]
- Wolshon, B.; Marchive, E. Emergency planning in the urban-wildland interface: Subdivision-level analysis of wildfire evacuations. J. Urban Plan. Dev. 2007, 133, 73–81. [Google Scholar]
- Lindell, M.K.; Prater, C.S. Critical behavioral assumptions in evacuation time estimate analysis for private vehicles: Examples from hurricane research and planning. J. Urban Plan. Dev. 2007, 133, 18–29. [Google Scholar]
- Lindell, M.K. Emblem2: An empirically based large scale evacuation time estimate model. Transp. Res. Part A Policy Pract. 2008, 42, 140–154. [Google Scholar]
- Sutton, J.; Palen, L.; Shklovski, I. Backchannels on the front lines: Emergent uses of social media in the 2007 Southern California wildfires. Proceedings of 5th International ISCRAM Conference, Washington, DC, USA, 1–9 May 2008.
- Wolshon, B. “One-way-out”: Contraflow freeway operation for hurricane evacuation. Nat. Hazards Rev. 2001, 2, 105–112. [Google Scholar]
- Stepanov, A.; Smith, J.M. Multi-objective evacuation routing in transportation networks. Eur. J. Oper. Res. 2009, 198, 435–446. [Google Scholar]
- Chen, X.; Zhan, F.B. Agent-based modelling and simulation of urban evacuation: Relative effectiveness of simultaneous and staged evacuation strategies. J. Oper. Res. Soc. 2008, 59, 25–33. [Google Scholar]
- Chan, W.R. Assessing the Effectiveness of Shelter-in-Place as an Emergency Response to Large-Scale Outdoor Chemical Releases. Ph.D. Dissertation, University of California at Berkeley, Berkeley, CA, USA, 2007. [Google Scholar]
- Paveglio, T.; Carroll, M.S.; Jakes, P.J. Alternatives to evacuation—Protecting public safety during wildland fire. J. For. 2008, 106, 65–70. [Google Scholar]
- Dombroski, M.; Fischhoff, B.; Fischbeck, P. Predicting emergency evacuation and sheltering behavior: A structured analytical approach. Risk Anal. 2006, 26, 1675–1688. [Google Scholar]
- Lindell, M.K.; Perry, R.W. The protective action decision model: Theoretical modifications and additional evidence. Risk Anal. in press.
- Sorensen, J.H.; Shumpert, B.L.; Vogt, B.M. Planning for protective action decision making: Evacuate or shelter-in-place. J. Hazard. Mater. 2004, 109, 1–11. [Google Scholar]
- Yamada, T. A network flow approach to a city emergency evacuation planning. Int. J. Syst. Sci. 1996, 27, 931–936. [Google Scholar]
- Sherali, H.D.; Carter, T.B.; Hobeika, A.G. A location-allocation model and algorithm for evacuation planning under hurricane/flood conditions. Transp. Res. Part B 1991, 25, 439–452. [Google Scholar]
- Kar, B.; Hodgson, M.E. A GIS based model to determine site suitability of emergency evacuation shelters. Trans. GIS 2008, 12, 227–248. [Google Scholar]
- Australasian Fire Authorities Council Position paper on bushfires and community safety; AFAC Limited: Melbourne, Australia, 2005. Available online: http://www.firewise.org/Information/Who-is-this-for/Firefighters/Evacuation-Planning/~/media/Firewise/Files/Pdfs/Research/BushfiresCommunitySafety.pdf (accessed on 27 July 2011).
- Stephens, S.L.; Adams, M.A.; Handmer, J.; Kearns, F.R.; Leicester, B.; Leonard, J.; Moritz, M.A. Urban-wildland fires: How California and other regions of the US can learn from Australia. Environ. Res. Lett. 2009, 4. [Google Scholar] [CrossRef]
- McCaffrey, S.M.; Rhodes, A. Public response to wildfire: Is the Australian “Stay and defend or leave early” approach an option for wildfire management in the United States? J. For. 2009, 107, 9–15. [Google Scholar]
- Krusel, N.; Petris, S. Staying alive: Lessons learnt from a study of civilian deaths in the 1983 Ash Wednesday bushfires. Fire Manag. Q. 1992, 2, 1–17. [Google Scholar]
- Wilson, A.A.G.; Ferguson, I.S. Fight or flee: A case study of the Mount Macedon bushfire. Aust. For. 1984, 47, 230–236. [Google Scholar]
- Handmer, J.; Haynes, K. Community Bushfire Safety; CSIRO Publishing: Collingwood, Australia, 2008. [Google Scholar]
- Teague, B.; McLeod, R.; Pascoe, S. Victorian Bushfires Royal Commission Final Report; Parliament of Victoria: Melbourne, Australia, 2009. [Google Scholar]
- International Wildland Firefighters Association. Ready, Set, Go! International Association of Fire Chiefs: Fairfax, VA, USA, 2011. Available online: http://www.wildlandfirersg.org (accessed on 27 July 2011).
- When Wildfire Threatens: Should Residents Stay or Evacuate? National Fire Protection Association: Quincy, MA, USA, 2004.
- Your Wildfire Action Plan: Should I Stay or Should I Go? Santa Barbara County Fire Department: Santa Barbara, CA, USA, 2008.
- Sheltering in Place During Wildfires: A Modern Approach to Living Safely in a Wildland-Urban Interface Community; Rancho Santa Fe Fire Protection District: Rancho Santa Fe, CA, USA, 2004.
- Wildfire Action Plan: Your First Weapon Against Wildfire; Ventura County Fire Department: Ventura, CA, USA, 2008.
- Saliant, C. Southern California fire chiefs debate stay-and-defend program. Los Angeles Times, 13 January 2009. Available online: http://articles.latimes.com/2009/jan/13/local/me-firefighting13 (accessed 21 September 2011). [Google Scholar]
- Cohn, P.J.; Carroll, M.S.; Kumagai, Y. Evacuation behavior during wildfires: Results of three case studies. West. J. Appl. For. 2006, 21, 39–48. [Google Scholar]
- Revelle, C.S.; Wright, J.; Whitlatch, E. Civil and Environmental Systems Engineering; Prentice-Hall: Saddle River, NJ, USA, 2003. [Google Scholar]
- Altay, N.; Green, W.G. OR/MS research in disaster operations management. Eur. J. Oper. Res. 2006, 175, 475–493. [Google Scholar]
- Hillier, F.S.; Lieberman, G.J. Introduction to Operations Research; McGraw-Hill: New York, NY, USA, 2004. [Google Scholar]
- Lindell, M.K.; Lu, J.C.; Prater, C.S. Household decision making and evacuation in response to Hurricane Lili. Nat. Hazards Rev. 2005, 6, 171–179. [Google Scholar]
- Drabek, T.E. Disaster Evacuation Behavior: Tourists and Other Transients; Institute of Behavioral Science, University of Colorado at Boulder: Boulder, CO, USA, 1996. [Google Scholar]
- Kobayashi, T.; Medina, R.M.; Cova, T.J. Visualizing diurnal population change in urban areas for emergency management. Prof. Geogr. 2011, 63, 113–130. [Google Scholar]
- Murray-Tuite, P.M.; Mahmassani, H.S. Transportation network evacuation planning with household activity interactions. Transp. Res. Rec. 2004, 1894, 150–159. [Google Scholar]
- Proudley, M. Fire, families and decisions. Aust. J. Emerg. Manag. 2008, 23, 37–43. [Google Scholar]
- Gill, A.M.; Stephens, S.L. Scientific and social challenges for the management of fire-prone wildland-urban interfaces. Environ. Res. Lett. 2009, 4. [Google Scholar] [CrossRef]
- Finney, M.A. FARSITE: Fire Area Simulator—Model Development and Evaluation; USDA Forest Service Rocky Mountain Research Station: Ogden, UT, USA, 2004. [Google Scholar]
- Lindell, M.K.; Prater, C.S. A hurricane evacuation management decision support system (EMDSS). Nat. Hazards 2007, 40, 627–634. [Google Scholar]
- Cohen, J.D.; Butler, B.W. Modeling potential structure ignitions from flame radiation exposure with implications for wildland/urban interface management. Proceedings of 13th Fire and Forest Meteorology Conference, Lorne, Australia, 24 October–2 November 1996; International Association of Wildland Fire: Lorne, Australia, 1996; pp. 81–86. [Google Scholar]
- Rothermel, R.C. A Mathematical Model for Predicting Fire Spread in Wildland Fuels; USDA Forest Service Intermountain Forest and Range Experiment Station: Ogden, UT, USA, 1972. [Google Scholar]
- Tolhurst, K.G.; Howlett, K.A. House ignition likelihood index—An hazard assessment method for land managers in the wildland-urban interface. Proceedings of 3rd International Wildland Fire Conference and 10th Annual Australian Fire Authorities Council Conference, Sydney, Australia, 2–6 October 2003.
- Byram, G.M. Combustion of forest fuels. In Forest Fire Control and Use; Davis, K.P., Ed.; McGraw-Hill: New York, NY, USA, 1959; pp. 61–89. [Google Scholar]
- Deeming, J.E.; Burgan, R.E.; Cohen, J.D. The National Fire-Danger Rating System—1978; USDA Forest Service Intermountain Forest and Range Experiment Station: Ogden, UT, USA, 1977. [Google Scholar]
- Van Wagner, C.E. Development and Structure of the Canadian Forest Fire Weather Index System; Technical Report 35; Canadian Forestry Service: Ottawa, ON, Canada, 1987. [Google Scholar]
- McArthur, A.G. Fire Behaviour in Eucalypt Forests; Commonwealth of Australia, Forestry and Timber Bureau: Canberra, Australia, 1967. [Google Scholar]
- Cohen, J.D. Preventing disaster: Home ignitability in the wildland-urban interface. J. For. 2000, 98, 15–21. [Google Scholar]
- Shafran, A.P. Risk externalities and the problem of wildfire risk. J. Urban Econ. 2008, 64, 488–495. [Google Scholar]
- Cuzzillo, B.R.; Pagni, P.J. Thermal breakage of double-pane glazing by fire. J. Fire Prot. Eng. 1998, 9, 1–11. [Google Scholar]
- Quarles, S.L.; Valachovic, Y.; Nakamura, G.M.; Nader, G.A.; De Lasaux, M.J. Home Survival in Wildfire-Prone Areas: Building Materials and Design Considerations; University of California Argiculture and Natural Resources: Davis, CA, USA, 2010. [Google Scholar]
- NFPA 1144, Standard for Reducing Structure Ignition Hazards from Wildland Fire; National Fire Protection Association: Quincy, MA, USA, 2007.
- Sorensen, J.H. When shall we leave? Factors affecting the timing of evacuation departures. Int. J. Mass Emerg. Disasters 1991, 9, 153–165. [Google Scholar]
- Cova, T.J.; Dennison, P.E.; Kim, T.H.; Moritz, M.A. Setting wildfire evacuation trigger points using fire spread modeling and GIS. Trans. GIS 2005, 9, 603–617. [Google Scholar]
- Dennison, P.E.; Cova, T.J.; Mortiz, M.A. WUIVAC: A wildland-urban interface evacuation trigger model applied in strategic wildfire scenarios. Nat. Hazards 2007, 41, 181–199. [Google Scholar]
- Larsen, J.C.; Dennison, P.E.; Cova, T.J.; Jones, C. Evaluating dynamic wildfire evacuation trigger buffers using the 2003 Cedar Fire. Appl. Geogr. 2011, 31, 12–19. [Google Scholar]
- Flyvbjerg, B. Curbing optimism bias and strategic misrepresentation in planning: Reference class forecasting in practice. Eur. Plan. Stud. 2008, 16, 3–21. [Google Scholar]
- Conflict of Interest: The authors declare no conflict of interest.
© 2011 by the authors; licensee MDPI, Basel, Switzerland. This article is an open access article distributed under the terms and conditions of the Creative Commons Attribution license (http://creativecommons.org/licenses/by/3.0/).
Share and Cite
Cova, T.J.; Dennison, P.E.; Drews, F.A. Modeling Evacuate versus Shelter-in-Place Decisions in Wildfires. Sustainability 2011, 3, 1662-1687. https://0-doi-org.brum.beds.ac.uk/10.3390/su3101662
Cova TJ, Dennison PE, Drews FA. Modeling Evacuate versus Shelter-in-Place Decisions in Wildfires. Sustainability. 2011; 3(10):1662-1687. https://0-doi-org.brum.beds.ac.uk/10.3390/su3101662
Chicago/Turabian StyleCova, Thomas J., Philip E. Dennison, and Frank A. Drews. 2011. "Modeling Evacuate versus Shelter-in-Place Decisions in Wildfires" Sustainability 3, no. 10: 1662-1687. https://0-doi-org.brum.beds.ac.uk/10.3390/su3101662