Structuring an Efficient Organic Wheat Breeding Program

Abstract
: Our long-term goal is to develop wheat cultivars that will improve the profitability and competitiveness of organic producers in Nebraska and the Northern Great Plains. Our approach is to select in early generations for highly heritable traits that are needed for both organic and conventional production (another breeding goal), followed by a targeted organic breeding effort with testing at two organic locations (each in a different ecological region) beginning with the F6 generation. Yield analyses from replicated trials at two organic breeding sites and 7 conventional breeding sites from F6 through F12 nurseries revealed, using analyses of variance, biplots, and comparisons of selected lines that it is inappropriate to use data from conventional testing for making germplasm selections for organic production. Selecting and testing lines under organic production practices in different ecological regions was also needed and cultivar selections for organic production were different than those for conventional production. Modifications to this breeding protocol may include growing early generation bulks in an organic cropping system. In the future, our selection efforts should also focus on using state-of-the-art, non-transgenic breeding technologies (genomic selection, marker-assisted breeding, and high throughput phenotyping) to synergistically improve organic and conventional wheat breeding.1. Introduction
A fundamental principle of plant breeding is that the phenotype (P) can be explained by the genotype (G), the environment (E) in which the plant is grown, and the genotype by environment interaction (G × E). The principle is often written as P = G + E + G × E [1,2]. The phenotype is important because that is what producers harvest. The genotype is important because that is what plant breeders manipulate. Finally, the environment in consort with the genotype, determines the phenotype. The genotype × environment interaction may be a little harder to conceptualize, but basically it highlights that genotypes may have significantly different performance relative to other genotypes, depending on environmental conditions. An example would be that a drought tolerant and drought susceptible plant may be phenotypically similar in environments that have optimal moisture, but greatly different in drought-stressed environments. The environment has been recognized as having a both a random aspect (those related to weather) and a planned aspect (those related to cropping systems or crop management, M; [1]). Hence the phenotype is explained by G, E, M, G × E, G × M, and G × E × M (the genotype × environment × crop management) and the equation becomes P = G + E + M + G × E + G × M + G × E × M. Others have expanded the G × E component to include societal and market factors [3]. Organic production systems are typically, though not always, different from conventional systems in soil nutrient status (E and M), fertility inputs (M), resilience to drought conditions (E and M), nitrogen mineralization rate (E and M), and timing of key operations such as planting date (M) [4,5]. Hence it is expected that the same genotypes in an organic and conventional cropping system will have different phenotypes even when grown under identical climatic or weather conditions, which has been confirmed by previous research [4,6,7].
A related principle is breeding for a target set of environments. In this case we are using environments in the broadest sense (E, M, and E × M, [7,8]). Plant breeders must determine if they should have a separate breeding program for different target environments. For the purposes of this paper, the question is whether separate breeding programs are needed for organic and conventional production (with the assumption that no aspect of breeding in a conventional cropping system will be applicable to performance in an organic cropping system) or if results from breeding in one system are transferable to another system (with the assumptions that lines developed in either system will be well adapted to both systems and that only late generation testing is needed to identify the best lines for either system). Breeding in one management system with the expectation the results will be transferable to another system is actually quite common and is known as indirect selection [9]. Another form of indirect selection is selecting lines using molecular markers (which are highly heritable) that are closely linked to quantitative trait loci (QTL) of interest.
Indirect selection is recommended whenever the ratio of the correlated response (selection in the non-targeted environments) to the direct response (selection in the targeted environments) is greater than one. The ratio is estimated by the square root of the heritability of the correlated trait [h2] divided by square root of the heritability of the direct trait [h1] multiplied by the genetic correlation between the genotypes (rG) or:
To be successful in this approach, h2rG > h1 which can occur whenever the square root of the heritability of the trait under direct selection is low relative to the square root of the heritability of the correlated trait and the genetic correlation. Previous reports have shown that this has not been true for conventional versus organic systems and that indirect selection has not been or was only partially successful ([6,10-13]).
The above two examples, separate breeding programs versus one breeding program with testing in the other management system, are the two extremes of the possible approaches. A blended approach is also possible where the breeding program has generations of testing that can be done in a combined conventional or organic breeding program, and other generations should be done in separate conventional and organic breeding programs. The driving force behind a blended program is resource allocation and cost savings. Wherever the programs can be combined, there is less duplication of resources, hence less cost. However, whenever it is critical to breed separately for the target organic and target conventional system, the required additional resources can be effectively utilized.
Wheat breeding can be divided into three phases: (1) Introduction of genetic variation via crossing (sexual hybridization), mutations, or, in future conventional plant breeding, by genetic engineering or transformation; (2) Inbreeding (selfing) accompanied by selection; and (3) Careful evaluation of advanced generation lines which are homozygous and homogeneous in replicated testing to determine if a line should be released and if it is released, resolving its area of adaptation [1,2]. In the first phase, parents must be selected. Parents for organic systems may be different than parents for conventional systems. Some traits will preclude the use of some parents in one system or the other. For example, lines that are susceptible to common bunt (syn. stinking smut, caused by Tilletia spp.) may lead to devastating losses in an organic system, but can be treated using fungicide seed treatments in a conventional system [14]. Similarly, lines that are tolerant to synthetic herbicides have little use in organic systems and would be used as parents only for their other characteristics. However, it is always difficult to predict in which system the progeny from a cross will be best and many parents and their crosses will be appropriate for use in either organic or conventional systems.
In the early generations when heads are selected, (each head representing a unique genotype or potential cultivar), seed limitations force either separate breeding programs for organic and conventional breeding efforts or a combined breeding effort. As selection in early generations is only effective for highly heritable traits, if there are highly heritable traits that are required for both systems, the combined system will be favored. If there are highly heritable traits that are required for organic systems, but not for conventional systems (or vice versa), then separate breeding programs will be favored. Using the Nebraska wheat-breeding program as an example, there are four key traits that every released line (for organic or conventional production) must have, namely: (1) Winter hardiness sufficient to survive the Nebraska winter; (2) Resistance to stem rust (caused by Puccinia graminis Pers.: Pers. f. sp. tritici Eriks & E. Henn.); (3) Excellent agronomic performance (e.g., grain yield, grain volume weight, maturity, standability); and (4) Good end-use quality for making bread or noodles [15]. Winter hardiness, resistance to stem rust, and maturity are highly heritable traits, hence can be measured in early generations [15]. Other agronomic performance (e.g., grain yield) and end-use quality (milling and baking) traits are poorly measured in early generations, are subject to large environmental effects, have large G × E, and require larger quantities of seed for testing. Hence for most agronomic and end-use quality traits, they are measured in later generations in replicated trials grown in the target set of environments [16]. Furthermore, the relative weights for selection based upon these traits will vary between production systems and their markets. Historically, conventional and organic wheat cultivars must have good agronomic performance and end-use quality. For organic cultivars, genetic resistance to diseases and insects is more critical than for conventional cultivars. In addition, the desired end-use quality characteristics in an organic production system may be different from those in a conventional production system. Organic grain is often used in whole grain products (as opposed to white flour products) which may also be used in artisan bakeries as opposed to large processors [17]. Many organic wheat producers feel that a loss in grain yield can be readily offset by superior end use quality in the marketplace. For these reasons, the Nebraska wheat improvement effort uses a combined breeding program from the F1 to F5 generation followed by a separate breeding program from the F6 until the lines are released in the F12 or later generations or dropped from further testing.
In this paper we will discuss the first three years of our efforts to develop an efficient wheat-breeding program for organic systems. The total breeding program develops lines adapted to conventional rain-fed, conventional irrigated, and organic production.
2. Materials and Methods
2.1. Testing Location Nurseries and Sites
Though the later generations (F7 to F12) will be discussed in this research (see below), it is important to understand the how lines were advanced to those generations. The early generations (F2 to F3:4) of the Nebraska Wheat Breeding Program are grown at Lincoln or Mead, NE. The F3:5 lines are grown in either an irrigated observation nursery in western NE or at Lincoln for visual selection. Beginning in the F3:6 lines are tested in dedicated programs for adaptation to conventional rain-fed (currently 7 testing locations), conventional irrigated (one irrigated testing location), and organic production (two organic testing locations; Table 1). The conventional testing locations are chosen to represent the three main ecological regions of Nebraska [18]. The irrigated location is chosen to represent the major irrigated wheat production region. The two organic testing locations are chosen to represent organic production in the highest (eastern) and lowest (western) yielding ecological regions in Nebraska. The two organic sites were certified organic in 2007 (Sidney, western NE) and 2008 (Mead, eastern NE).
Yield trial results for the advanced nursery (F7) and the elite nursery (F8-12) are discussed in this paper. Sites for the nurseries are at UNL research stations, except for the Alliance site on a commercial farm close to Hemingford, NE and the McCook site on a commercial farm near Culbertson, NE. Wheat plots at each site are rotated within a one to two kilometer radius each year.
2.2. Characterization of Environments
To understand the environments (E) where the tests occurred, it is important to first understand the general attributes of each location, followed by the specific attributes of each year. Alliance, McCook, Sidney and North Platte are in the Western High Plains. Clay Center is in the Central Great Plains. Mead and Lincoln are in the Western Corn Belt [19].
Soil properties are ‘fine’ or ‘fine-silty’ at all sites, except a portion of soils at Alliance and Sidney sites that are ‘fine-loamy’ and ‘coarse-silty’ at McCook. Soils at all sites are predominantly ‘Argiustolls,’ except the McCook site which is classified as ‘mesic Torriothentic Haplustoll’ and Mead and Mead Organic sites, which have an equal distribution of ‘mesic Mollic Hapludalf’, ‘mesic Pachic Argiudoll’ and ‘mesic Vertic Argialboll’ soils. Alliance and Sidney sites are predominantly of the subgroup ‘mesic Aridic’. Sites at Clay Center are either ‘mesic Pachic Argiustoll’ or ‘mesic Udic Argiustoll’ soils. At Lincoln, sites are primarily ‘mesic Pachic Argiustoll’ with some ‘mesic Abruptic Argiaquoll’ soils [20].
Growing-degree-days in June (the critical month for determining grain yield; mostly a 50 year average, base of 6.7 °C.) range from 435–485 at Alliance, 450–500 at Sidney, 510–560 at North Platte, 585–635 at Clay Center, 600–650 at McCook, 620–670 at Mead, to 655–705 at Lincoln [21,22]. The average annual precipitation (mostly a 50 year average) for the locations hosting the advanced and elite nurseries is 38–51 cm at Alliance and Sidney, 51–64 cm at North Platte and McCook, 64–76 cm at Clay Center, and 76–89 cm at Lincoln and Mead [19]. In Table 2, deviations from normal growing-degree-days in June and annual precipitation are indicated with a minus sign for slightly below normal, an equals sign for normal, a plus sign for above normal, and double plus or minus signs for much above or below the normal range for each location. Deviations in growing-degree-days and precipitation help to interpret the differences in yield from year to year for each location (Table 2).
2.3. Characterization of Management Systems
The management system (M) for each site is characterized by rotation, planting details (spacing, density, equipment and date), and fertility inputs. Rotations are: soybeans (Glycine max (L.) Merr.)-oats (Avena sativa L.)-wheat at Mead and Lincoln; fallow-wheat at Alliance; fallow-wheat-alternate crop at North Platte, McCook, Sidney and Sidney organic sites; corn (Zea mays L.)-soybeans-wheat at the Mead organic site; and soybeans-corn-fallow-wheat at Clay Center. The alternate crop is corn at North Platte and McCook, sunflowers (Helianthus annuus L.) or proso millet (Panicum miliaceum L.) at both Sidney sites, and occasionally corn at the Sidney conventional site.
All conventional sites and the Sidney organic site were planted in rows 30 cm apart in mid to late September. Except for the Mead organic plots, which were drilled into untilled soybean stubble, all other sites were planted into a fine-tilled seedbed. The Mead organic plots were planted in rows 19 cm apart in early to mid-October except when delayed by wet weather (2007). The planting rate for the organic plots (150 kg ha−1 wheat seed) was double the conventional plots (75 kg ha−1). The higher seeding rate in the organic trials was due to the later planting dates which can cause higher winter killing and reduced stands.
Conventional sites used recommended fertilizer rates appropriate for those locations. Wheat at the Sidney organic site relied on nitrogen from a green manure crop of forage pea (Pisum sativum L. cv 40–10) incorporated in mid-June preceding fallow and from soil mineralization. Wheat at the Mead organic site received 510 kg ha−1 nitrogen in the form of beef cattle manure in spring of 2006. The 2009 and 2010 organic wheat elite nursery plots at Mead were planted perpendicular to where strips of either manure was applied or berseem clover (Trifolium alexandrinum L.), soybeans ((Glycine max (L.) Merr.), or AC Greenfix® chickling vetch (Lathyrus sativus L.) had been planted following harvest of the previous wheat crops in 2007 and 2008, respectively. No further soil fertility treatments were applied for the subsequent soybean or wheat crops. The 2010 advanced breeding nursery was planted perpendicular to strips of where either berseem clover or soybeans had been planted in 2007. All plots were direct-harvested in mid-July.
2.4. Statistical Methods
Yield data for the advanced and elite nurseries was analyzed using SAS mixed model analysis of variance procedure in SAS 9.2 [23]. At each location, a randomized incomplete block design with three replications and 12 incomplete blocks within each replication was used for a total of 60 entries. The locations were combined to estimate the interaction effect for entries and locations. Then the meaningful orthogonal contrasts for the interaction between locations and entries were performed. Fixed effects were entries and replications, whereas incomplete block within replications and incomplete block within replications × locations were entered as random factors. For all analyses, statistical significance was set at p = 0.05 or less. Principal component analysis was performed on the symmetric correlation matrix, based on the grain yield data for each year separately across all locations [24]. Then the scores of the main components were plotted as biplots.
3. Results and Discussion
3.1. Differentiation of Genotypes and Management Systems Using ANOVA
Because the entries (syn. genotypes or lines) change each year in the advanced and elite nurseries, we ran ANOVAs across locations (syn. environments) within year and not across years. For both the advanced and elite nurseries, there were highly significant differences among locations and entries, and the location × entry interaction was highly significant. Using contrasts, we also found that the (conventional trials vs. the organic trials) × entries were highly significant. The (conventional trials vs. the organic trials) × entries within Mead and within Sidney were also highly significant (data not shown). The significant differences among locations and entries were expected as the locations were chosen to represent different growing environments within Nebraska [18] and the genotypes were selected for adaptation to some of these environments. Similarly, the significant interaction of (conventional trials vs. the organic trials) × entries was expected as the conventional trials were tested in an additional ecological region of Nebraska [18,25]. The highly significant interaction of (conventional trials vs. the organic trials) × entries within Mead and Sidney can be attributed to the different cropping system (conventional vs. organic) since soil types and climates for the two systems are very similar for their respective locations and the same entries were tested. The two cropping systems at Mead differ by their preceding crop, fertility treatments, weed control methods, the time of planting (the preceding organic crop often had to be harvested after a freeze to kill weeds), the tillage system, and the use of seed treatments. The two cropping systems at Sidney differ by fertility and seed treatments, weed control methods, and alternate crop in the three-year rotation.
3.2. Differentiation of Genotypes and Environments Using Principle Component Biplot Analysis
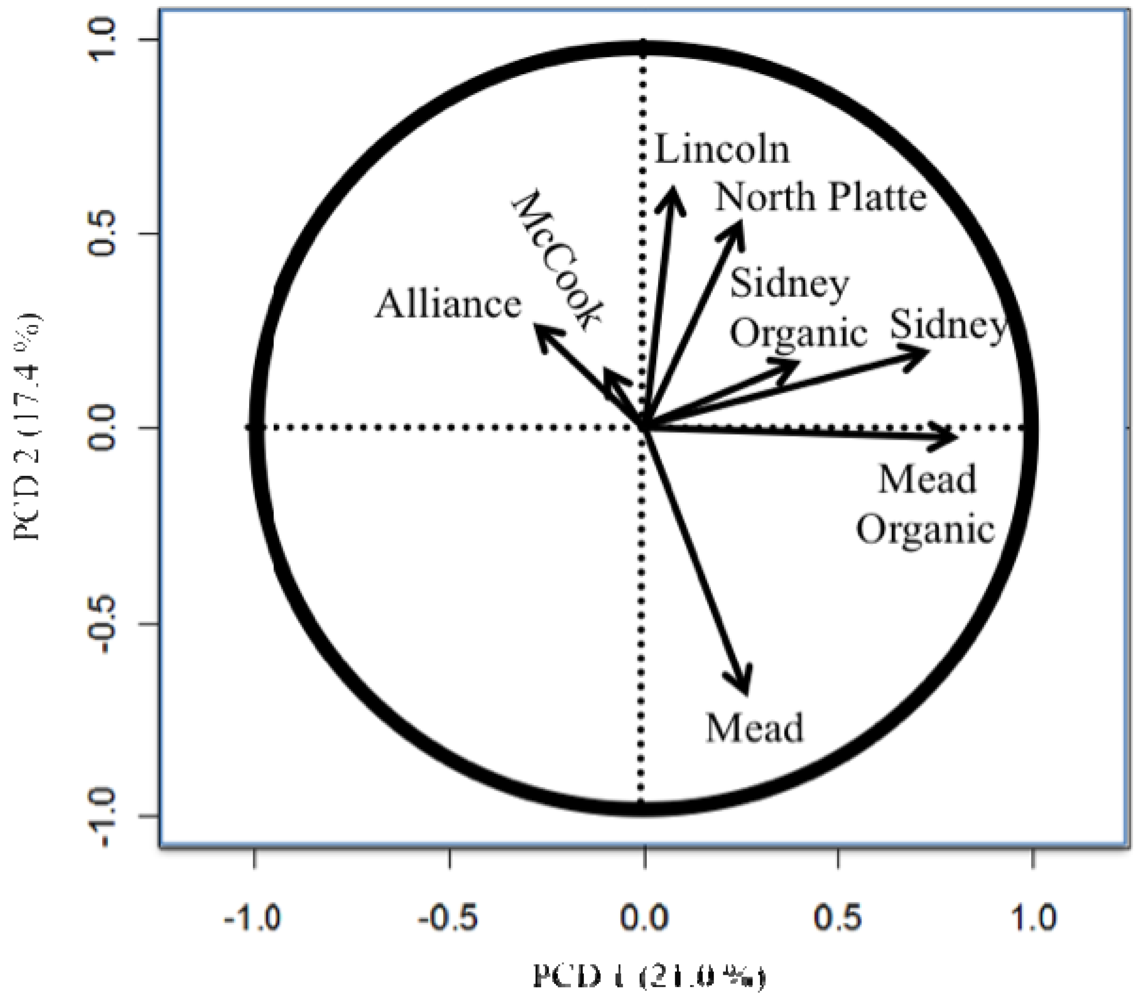
The importance of testing in different locations and the difference between the organic and conventional testing [8,11,26] are easily seen in the principle component biplots (Figures 1 to 4). The biplots from the 2008, 2009, and 2010 elite nurseries (Figures 1 to 3) indicate that the locations are quite diverse (as indicated by the directions of the vectors or arrows) and that the environments vary from year to year as seen by some environments being close in one year and quite different in the next year.
Also of note is the clustering of organic and conventional trials at the same locations (e.g., Mead and Sidney). In 2008, the organic and conventional elite trials at Mead and at Sidney were very different, whereas in 2009, the organic and conventional elite trials at Mead were relatively similar (the Sidney organic and the Alliance conventional trial were lost due to inclement weather). In 2010, the organic and conventional elite trials were similar at Sidney, but less so at Mead. Similar to the results from the elite trials in 2008 (Figure 1), the organic and conventional trials for the advanced trial (Figure 4) were dissimilar, however, what was also quite clear was that the locations had a very different pattern for the location vectors for the advanced trials compared to the elite trials. This result can be interpreted as the locations within each year (e.g., environments) vary from year to year in an inconsistent manner (e.g., the western locations are not always clustered together, nor are the eastern locations). While there are clear elevation, moisture, and temperature trends across Nebraska [18], specific weather events prevent the locations from clustering along these trends. The clusters Peterson [16] described were based on 30 years of data. Hence aposteri clustering of environments is superior to apriori clustering of environments ([18], Table 2). Also, the genotypes used to estimate the environmental similarity will provide different results between nurseries (e.g., the clusters developed by Peterson [16] changed with the nurseries [genotypes] that he used). The elite nursery contains lines with multiple years of testing and on average should have higher and more stable grain yields than lines in the advanced trial where the lines are in their first year of replicated testing.
3.3. Comparison of Selections That Are Based on Performance in Organic or Conventional Environments
To a breeder, the key question is how does the genotype × environment interaction affect the ability to select lines for organic and conventional production systems. Genotype × environment interaction can be caused by changes in magnitude (basically the ranks do not change, but magnitude of differences among the similarly ranked lines will change) or changes in order (also known as a cross-over interaction, where the ranks of the cultivars change). Of the two possible reasons for a significant genotype × environment interaction, the latter (changes in order) is the more problematic for plant breeders because if the grower cannot predict the environment, it is not clear which lines should be recommended from one year to the next. Similarly, the breeder cannot easily choose which lines should be advanced from one year to the next year. It should be understood that breeding is a continuous process and requires a balance of within-year and across-year evaluation and selection. There is only one year of state-wide testing in this breeding program in the preliminary nursery, hence lines must be advanced based on one year of testing. The poorest lines are discarded and many are advanced (selection intensity is roughly the top 20% of the lines). Even in the advanced nursery, in which selection intensity is approximately 45–50%, one could only have a single year of replicated state-wide testing which can be supplemented by the previous year's augmented single replicate testing. With multiple-year replicated testing in the elite trial, in which selection intensity is about 50%, the across-year averages become important.
If the breeder were using only yield data from the conventional trials with selection intensity of 50% for making selections, an obvious question would be how many of the selected lines would have also been selected using data from the organic trials. Are lines adapted to organic production dropped or missing due to testing only in conventional systems? This question can be restated as: How many selected lines are in common among the best lines in both the conventional and organic trials? In this case, are the selections suited for both systems? Using the elite trial mean data from all of the conventional and all of the organic trials for 2008, 2009, and 2010, we found 18, 19, and 17 lines were in the top 50% (top 30 lines) of the conventional and organic trials, respectively. Approximately 60% of the highest yielding lines were in common. Under a more stringent selection intensity of the top 20% (top 12 lines), one, seven, and four lines would have been selected from the elite trial in 2008, 2009, and 2010, respectively. In this case, approximately 30% of the lines were in common. These results may be biased because there are more conventional trials than organic trials and the conventional trials represent three of the four ecological regions within Nebraska while the organic trials represent two of the four ecological regions.
To remove this bias, we looked at how many lines in the elite trials in 2008, 2009, and 2010 were in the top 50% (top 30 lines) of the conventional and organic trials at Mead and at Sidney. In 2008, 2009, and 2010 at Mead, 15, 21, and 20 lines were in the top 50% of the conventional and organic trials, respectively. The correlation for grain yield in the two production systems for the three years were r = 0.10 n.s., r = 0.44**, and r = 0.46**, for 2008, 2009, and 2010 respectively. For Sidney in 2008 and 2010 (the 2009 elite organic trial was lost due to inclement weather), 13 and 15 lines were in the top 50% of the conventional and organic trials (approximately 50% of the top 30 lines), respectively. The correlation for grain yield in the two production systems for the two years were r = −0.02 n.s. and r = 0.00 n.s., for 2008 and 2010, respectively. While these data present the general trends, cultivar releases are very rare (generally one or two from the elite trials), hence data are critical from the trials using the targeted production systems and suggests that the later generation breeding program should be separate for each production system. This conclusion is similar to the one that led to the dedicated irrigated wheat breeding program for the irrigated production system (Table 1) and agrees with the conclusions of Murphy et al. [10] who found crossover interactions between cultivars tested in conventional and organic trials. The major difference between the irrigated and organic breeding program is the generation in which the lines are moved from a blended or common breeding effort into the dedicated breeding effort.
One further consideration is how data from the conventional system can be used to enhance our understanding of selections for the organic system. Currently, most wheat breeding programs will have more conventional than organic testing sites (in our case seven vs. two testing sites, respectively). Clearly for highly heritable traits (those affected less by the environment e.g., disease phenotypes) conventional data can assist the characterization of lines for organic production [11]. Furthermore, by testing lines in both organic and conventional systems, the breeder can identify lines with and without large G × E and those lines without changes in order (crossover-interactions). For experimental lines with a low G × E and without changes in order, it may be reasonable to extrapolate from the conventional system to the organic production system when no organic data are available. In our example, there are data for the Central High Plains (Sidney) and the Western Corn Belt (Mead) for line performance in both the conventional and organic systems. However, at Clay Center, representing the Central Great Plains, there would be conventional and organic systems data from the state variety trial, but only conventional systems data from the breeding program. To choose lines to go into the organic state variety trial, we select high yielding lines in both the conventional and organic systems in the breeding program at Sidney and Mead that have also performed well under the conventional system at Clay Center in hope the line will continue to do well in the organic system at Clay Center. Clearly, the preferred situation would be to have an organic breeding effort at Clay Center similar to those at Sidney and Mead that can directly identify lines organic testing. However, without having an organic breeding effort at Clay Center, using the conventional data from Clay Center and understanding the nature of GxE is helpful in selecting lines for the organic state variety trial at that location.
3.4. Achieving Synergism between Organic and Conventional Breeding Programs
Breeding systems are highly flexible and dependent upon resources and the target set of environments [1,2]. Potential improvements or modification are constantly evaluated. In the above breeding system, we propose using a blended/common system in early generations where seed is limited, and the traits under selection are highly heritable and common to all of the targeted environments (winter survival, stem rust resistance, and maturity). If there were a modification to the above approach, it would be to grow the early generation bulks in an organic production system. Competition within a bulk is well documented [27,28] and it may be that the competition in bulk under organic production practices is different from those under conventional systems. The advantage of this modification is that it can be coupled with on-farm testing (as certified organic testing sites remain rare among universities and private companies) and with participatory plant breeding [26,29]. Data from our irrigated breeding effort suggest that separating the breeding program in an earlier generation is beneficial. Another modification would be to grow the bulks in additional ecological zones in other states so lines could be developed for different sets of target environments. There will be relatively few organic wheat breeding programs for the foreseeable future, so having adapted organic wheat cultivars for the Great Plains could be enhanced by having one breeding program creating new germplasm, in this case, new early generation populations for organic environments, and having those populations grown across the Great Plains environments in collaboration with participatory or professional breeders. In this case, the diversity of the parents and their progeny can be selected in diverse environments at little additional cost. Simply a cross between an adapted Nebraska line by an adapted Oklahoma line should produce progeny adapted to Oklahoma, Kansas, and Nebraska (assuming no transgressive segregation, and a wider potential area of adaptation if there were transgressive segregation). However if those progeny and early generation bulks are only grown in Nebraska, the progeny adapted to Oklahoma and Kansas may be quickly lost due to competition within the bulk and selection for excellent winter hardiness, which is less needed in Oklahoma and Kansas [27,28].
An additional area of synergism between organic and conventional plant breeding will be marker assisted breeding [30] and genomic selection [31]. Molecular markers are becoming much less expensive, hence can be done on generations with a large number of lines. For example, molecular markers could be used to genotype lines in the F3:6 (the last generation in common to both the conventional and organic breeding program; Table 1) or an earlier generation. In this case, the genotyping with molecular markers would be done on the lines during the blended part of the breeding program. Those markers can be used for marker assisted breeding and genomic selection in both the conventional and organic breeding programs which diverge in the F3:7 and later generations. In this case, the genotyped lines and marker genotypes will be the same, but the traits the markers would be associated with and the estimated breeding values (based upon the phenotypes from organic or conventional systems) and the training populations [31] will be different and so will the selected lines. For example, traits such as weed suppression, disease resistance, and whole grain end-use quality have greater value in the organic system than in the conventional system where pesticides can be used and wheat is marketed as a commodity.
4. Conclusions
Based upon previous research and our own findings, a blended conventional and organic breeding program is recommended where selection in the early generations for highly heritable traits is done in either the conventional or organic system. These data should be valuable for selecting lines for both the conventional or organic systems. However, in later generations where the G × E is larger and the traits of interest are less heritable, separate breeding programs in conventional and organic systems are recommended. In areas where little data exist for line performance in the organic system, a careful use of the line performance data in the conventional system may be helpful. Finally, plant breeding programs are flexible; and as new tools are developed, it is important that these tools are used in organic crop improvement.


| Generation | Activity |
|---|---|
| Year 1 | Make 1,000 crosses at Lincoln in the greenhouse. This is F1 seed. |
| Year 2 | Grow the F1 seed in the Lincoln greenhouses or in Arizona. Harvest F2 seed. |
| Year 3 | Plant F2 seed in bulk populations at Mead, NE. Mead is the most severe winter site. Infect plants with stem rust. Hence winter-tender and stem rust susceptible plants may be severely injured or killed. Harvest F3 seed. |
| Year 4 | Plant F3 seed in bulk populations at Mead, NE. Infect plants with stem rust. Send 30 to 40 populations to the USDA-ARS to select Hessian fly resistant material. Select 45,000 heads from F3 bulks. |
| Year 5 | Plant 45,000 F4 head rows and Hessian fly resistant plant-rows at Lincoln or Mead, NE to select for plant type and disease resistance. Harvest 1,800–2,000 head rows. Evaluate harvested F3:5 seed and select 1,800 F3:5 lines for advancement in the rain-fed wheat production zones and approximately 300 F3:5 (of the 1800 lines) for testing under irrigation in western NE. |
| Year 6 | Plant 1,800 observation F3:5 plots at Lincoln, NE and approximately 300 F3:5 for testing under irrigation in western NE. All lines are screened in the greenhouse for stem rust. On the basis of plant type, yield, and disease resistance, harvest 400–450 plots from Lincoln and 40 from the irrigated trial in western NE. Evaluate harvested F3:6 seed using micro-quality analyses (flour protein and Mixograph mixing time and tolerance) in the Nebraska Wheat Quality Laboratory and select 280 lines for advancement that have acceptable end-use quality. |
| Year 7 | Plant 280 F3:6 lines and 2 replicated checks in a single replication augmented trial (preliminary nursery) at 7 Nebraska locations (Mead, Lincoln, Clay Center, North Platte, McCook, Sidney, and Alliance) for conventional testing and at Mead and Sidney for organic testing. On the basis of plant type, yield, disease resistance, and end-use quality, select 57 lines for advancement. Plant approximately 20 F3:6 lines and 20 lines retained from previous testing in the replicated (three) irrigated trial at one location in western NE and at Lincoln, North Platte and Alliance under rain-fed conditions. Evaluate harvested seed for end-use quality. |
| Year 8 | Plant 57 F3:7 lines and 3 checks (total of 60 lines) in replicated (three) and observation trials (advanced nursery) at 7 conventional testing and at two organic testing sites. Select about 25 F3:8 lines for advancement. At this stage, the organic trials have two years of testing and lines are being identified as those with good performance in organic production, in conventional production, or in both systems. Continue testing lines in the irrigated nursery. Evaluate harvested seed for end-use quality. |
| Year 9 | Plant 60 F3:8 to F3:12 lines in replicated and observation trials at 7 conventional testing and at two organic testing sites. The 60 lines include 10 to 15 check lines, 25 lines retained from the previous year's trials and the 25 newly advanced lines. Continue identifying lines adapted to organic or conventional production. Continue testing lines in the irrigated nursery. Evaluate harvested seed for end-use quality. Increase seed of 10 lines for advancement to regional nurseries. |
| Year 10 | Continue testing as in year 9. Retain 6 lines for second year testing in regional nurseries. Submit 4 to 6 lines to state cultivar testing. Lines may be submitted to either organic or conventional or both state variety testing locations. |
| Year 11 | Continue testing as in year 10. Retain 3 to 5 lines in the state cultivar trials. |
| Year 12 | Continue testing as in year 11. Retain 3 to 5 lines in the state cultivar trials. Continue Foundation Seed increase of advanced lines. If performance warrants release, release one line as a new cultivar. |
| Summary | A breeding program is a continuum; hence lines are constantly added and dropped from consideration. Of the 25 lines advanced in year 8, only 10–15 will be retained in year 9, 5–10 will be retained in year 10, 5 will be retained in year 11, and one or two in year 12. On average, over 100,000 lines will be looked at to find a cultivar. Over 15,000 yield plots will be harvested each year. A cultivar will be tested in over 100 location-years before we know enough to release it. It takes a minimum of 12 years to create a new wheat cultivar. |
| Location | 2008 | 2009 | 2010 | |||
|---|---|---|---|---|---|---|
| GDD | Precip. | GDD | Precip. | GDD | Precip. | |
| North Platte | − | = | − − | = | = | = |
| Sidney | − | = | NA | NA | ++ | = |
| Clay Center | − − | + | = | − | = | + |
| Mead | − | + | − | − | = | + |
| Lincoln | = | + + | = | = | + | = |
| Alliance | − | = | NA | NA | = | = |
| McCook | + | = | ||||
Acknowledgments
Partial funding for P.S. Baenziger is from Hatch project NEB-22-328, the Nebraska Wheat Development, Utilization, and Marketing Board, USDA OREI 2007-51300-03785, USDA-IFAFS competitive grant 2001-04462, USDA, NRICGP 00-353000-9266, and 2004-35300-1470, USDA, CSREES NRICAP grant number 2006-55606-16629, and USDA under Agreement No. 59-0790-4-092 which is a cooperative project with the U.S. Wheat & Barley Scab Initiative. Any opinions, findings, conclusions, or recommendations expressed in this publication are those of the authors and do not necessarily reflect the view of the USDA.
References
- Baenziger, P.S.; Russell, W.K.; Graef, G.L.; Campbell, B.T. Improving lives: 50 years of crop breeding; genetics and cytology (C-1). Crop Sci. 2006, 46, 2230–2244. [Google Scholar]
- Baenziger, P.S.; DePauw, R.M. Wheat Breeding: Procedures and Strategies. In Wheat: Science and Trade; Carver, B.F., Ed.; Wiley-Blackwell Publishing: Ames, IA, USA, 2009; pp. 275–308. [Google Scholar]
- Desclaux, D.; Nolot, M.M.; Chiffoleau, Y.; Goze, E.; Leclerc, C. Changes in the concept of genotype × environment interactions to fit agriculture diversification and decentralized participatory plant breeding: Pluridisciplinary point of view. Euphytica 2008, 163, 533–546. [Google Scholar]
- Mason, H.E.; Spaner, D. Competitive ability of wheat in conventional and organic management systems: A review of the literature. Can. J. Plant Sci. 2006, 86, 333–343. [Google Scholar]
- Kitchen, J.; McDonald, G.; Shepherd, K.; Lorimer, M.; Graham, D. Comparing wheat grown in South Australian organic and conventional farming systems. 1. Growth and grain yield. Aust. J. Agric. Res. 2003, 54, 889–901. [Google Scholar]
- Reid, T.A.; Yang, R.-C.; Salmon, D.F.; Navabi, A.; Spaner, D. Realized gains from selection for spring wheat grain yield are different in conventional and organically managed systems. Euphytica 2011, 177, 253–266. [Google Scholar]
- Loschenberger, F.; Fleck, A.; Grausgruber, H.; Hetxendorfer, H.; Hof, G.; Lafferty, J.; Marn, M.; Neumayer, A.; Pfaffinger, G.; Birschitzhy, J. Breeding for organic agriculture: The example of winter wheat in Austria. Euphytica 2008, 163, 469–480. [Google Scholar]
- Ortiz, R.; Trethowan, R.; Ferrara, G.O.; Iwanaga, M.; Dodds, J.H.; Crouch, J.H.; Crossa, J.; Braun, H.J. High yield potential; shuttle breeding; genetic diversity; and a new international wheat improvement strategy. Euphytica 2007, 157, 365–384. [Google Scholar]
- Falconer, D.S. The problem of environment and selection. Am. Nat. 1952, 86, 293–298. [Google Scholar]
- Murphy, K.; Campbell, K.G.; Lyon, S.R.; Jones, S.S. Evidence of varietal adaptation to organic farming systems. Field Crops Res. 2007, 102, 172–177. [Google Scholar]
- Przystalski, M.; Osman, A.; Thiemt, E.M.; Rolland, B.; Erickson, L.; Ostergard, H.; Levy, L.; Wolfe, M.; Busche, A.; Piepho, H.P.; et al. Comparing the performance of cereal varieties in organic and non-organic cropping systems in different European countries. Euphytica 2008, 163, 417–433. [Google Scholar]
- Reid, T.A.; Yang, R.-C.; Salmon, D.F.; Spaner, D. Should spring wheat breeding for organically managed systems be conducted on organically managed land? Euphytica 2009, 169, 239–252. [Google Scholar]
- Ceccarelli, S. Specific adaptation and breeding for marginal conditions. Euphytica 1994, 77, 205–219. [Google Scholar]
- Matanguihan, J.B.; Murphy, K.M.; Jones, S.S. Control of common bunt in organic wheat. Plant Dis. 2011, 95, 92–103. [Google Scholar]
- Baenziger, P.S.; Shelton, D.R.; Shipman, M.J.; Graybosch, R.A. Breeding for end-use quality: Reflection on the Nebraska experience. Euphytica 2001, 119, 95–100. [Google Scholar]
- Malla, S.; Ibrahim, A.M.H.; Little, R.S.; Kalsbeck, S.; Glover, K.D.; Ren, C. Comparison of shifted multiplicate models, rank correlation, and bioplot analysis for clustering winter wheat production environments. Euphytica 2010, 174, 357–370. [Google Scholar]
- Leonard, T. Flour Quality. Newsletter of the Bread Baker's Guild of America, Available online: http://www.theartisan.net/Organic_Flour.htm (accessed on 4 August 2011).
- Peterson, C.J. Similarities among test sites based on cultivar performance in the hard red winter wheat region. Crop Sci. 1992, 32, 907–912. [Google Scholar]
- Chapman, S.S.; Omernik, J.M.; Freeouf, J.A.; Huggins, D.G.; McCauley, J.R.; Freeman, C.C.; Steinauer, G.; Angelo, R.T.; Schlepp, R.L. Ecoregions of Nebraska and Kansas. (Color Poster with Map; Descriptive Text; Summary Tables and Photographs; Map Scale 1:1,950,000); U.S. Geological Survey: Reston, VA, USA, 2001. [Google Scholar]
- Web Soil Survey. Natural Resources Conservation Service, United States Department of Agriculture: Washington, D.C., 2011. Available online: http://websoilsurvey.nrcs.usda.gov/app/WebSoilSurvey.aspx (accessed on 24 May 2011).
- H.P.R.C.C. Climate Atlas Maps; High Plains Regional Climate Center: Lincoln, NE, USA. Available online: http://www.hprcc.unl.edu/maps/atlas/ (accessed on 23 May 2011).
- H.P.R.C.C. Monthly precipitation totals by station. Historical Climate Data Summaries; High Plains Regional Climate Center: Lincoln, NE, USA. Available online: http://www.hprcc.unl.edu/data/historical/ (accessed on 23 May 2011).
- SAS Institute Inc. The Mixed Procedure. In SAS/STAT 9.2 Users Guide, 2nd ed.; SAS Institute Inc.: Cary, NC, USA, 2009; pp. 3892–4084. [Google Scholar]
- Jolliffe, I.T. Graphical Representation of Data Using Principal Components. In Principal Component Analysis, 2nd ed.; Springer-Verlag Inc.: New York, NY, USA, 2002; pp. 78–110. [Google Scholar]
- Mishra, R.; Baenziger, P.S.; Russell, W.K.; Graybosch, R.A.; Baltensperger, D.D.; Eskridge, K.M. Crossover interaction for grain yield in multi-environmental trials of winter wheat. Crop Sci. 2006, 46, 1291–1298. [Google Scholar]
- Wolfe, M.S.; Baresel, J.P.; Desclaux, D.; Goldringer, I.; Hoad, S.; Kovacs, G.; Loschenberger, F.; Miedaner, T.; Ostergard, H.; Lammerts van Buren, E.T. Developments in breeding cereals for organic agriculture. Euphytica 2008, 163, 323–346. [Google Scholar]
- Khalifa, M.A.; Qualset, C.O. Intergenotypic competition between tall and dwarf wheats. I. in mechanical mixtures. Crop Sci. 1974, 14, 795–799. [Google Scholar]
- Khalifa, M.A.; Qualset, C.O. Intergenotypic competition between tall and dwarf wheats. II. in hybrid bulks. Crop Sci. 1975, 15, 640–644. [Google Scholar]
- Ceccarelli, S.; Grando, S.; Tutwiler, R.; Baha, J.; Martini, A.M.; Salahieh, H.; Goodchild, A.; Miachel, M. A methodological study on participatory barley breeding. I. Selection phase. Euphytica 2000, 111, 91–104. [Google Scholar]
- Lammerts van Bueren, E.T.; Kackes, G.; de Vriend, H.; Ostergard, J.H. The role of molecular markers and marker assisted selection in breeding for organic agriculture. Euphytica 2010, 175, 51–64. [Google Scholar]
- Heffner, E.L.; Sorrells, M.E.; Jannink, J.-L. Genomic selection for crop improvement. Crop Sci. 2009, 49, 1–12. [Google Scholar]
© 2011 by the authors; licensee MDPI, Basel, Switzerland. This article is an open access article distributed under the terms and conditions of the Creative Commons Attribution license (http://creativecommons.org/licenses/by/3.0/).
Share and Cite
Baenziger, P.S.; Salah, I.; Little, R.S.; Santra, D.K.; Regassa, T.; Wang, M.Y. Structuring an Efficient Organic Wheat Breeding Program. Sustainability 2011, 3, 1190-1205. https://0-doi-org.brum.beds.ac.uk/10.3390/su3081190
Baenziger PS, Salah I, Little RS, Santra DK, Regassa T, Wang MY. Structuring an Efficient Organic Wheat Breeding Program. Sustainability. 2011; 3(8):1190-1205. https://0-doi-org.brum.beds.ac.uk/10.3390/su3081190
Chicago/Turabian StyleBaenziger, P. Stephen, Ibrahim Salah, Richard S. Little, Dipak K. Santra, Teshome Regassa, and Meng Yuan Wang. 2011. "Structuring an Efficient Organic Wheat Breeding Program" Sustainability 3, no. 8: 1190-1205. https://0-doi-org.brum.beds.ac.uk/10.3390/su3081190