Ecology and the Tragedy of the Commons

Department of Invertebrate Zoology & Geology, California Academy of Sciences, 55 Music Concourse Drive, San Francisco, CA 94118, USA
Sustainability 2013, 5(2), 749-773; https://0-doi-org.brum.beds.ac.uk/10.3390/su5020749
Submission received: 17 December 2012
/
Revised: 21 January 2013
/
Accepted: 6 February 2013
/
Published: 18 February 2013
Abstract
:This paper develops mathematical models of the tragedy of the commons analogous to ecological models of resource consumption. Tragedies differ fundamentally from predator–prey relationships in nature because human consumers of a resource are rarely controlled solely by that resource. Tragedies do occur, however, at the level of the ecosystem, where multiple species interactions are involved. Human resource systems are converging rapidly toward ecosystem-type systems as the number of exploited resources increase, raising the probability of system-wide tragedies in the human world. Nevertheless, common interests exclusive of exploited commons provide feasible options for avoiding tragedy in a converged world.
1. Introduction
The Tragedy of the Commons (TOC) [1], in the most basic formulation outlined by Hardin, describes situations in which a shared resource is destroyed, or access to it rendered progressively more difficult or expensive, by rational users acting according to their own short-term interests. According to Hardin, if even one user increases its utilization of the resource, though the benefits accrue to that user alone, the cost of added use is shared by all because the resource is an unmanaged one. Other users are then compelled to increase their own rates of utilization, and eventually the resource is exhausted, destroyed, or access is made too expensive, bringing ruin to all. Hardin applied the term “tragedy” to such scenarios because of their inevitability given a growing population of users. TOC has been debated since Hardin’s first paper, with both examples and counter-examples being drawn from the real world. Hardin advocated coercive or top-down management of utilization that would limit or penalize users who pushed a situation towards a TOC, basing his argument on the assumption of a fundamentally selfish human nature. Ostrom, colleagues and others on the other hand [2,3], demonstrated real-world and experimental scenarios where users invented cooperative self-management strategies to avoid TOC (see also [4]). Yet, tragedies do occur in human societies and economies, with indisputable evidence from our over-exploitation of numerous natural resources and the associated ruination of their human exploiters.
Non-human species are also consumers of natural resources, yet exploitation to the point of elimination of the resource and demise of the users is rarely observed in nature, in the sense that both resource and users always survive. This point is supported most convincingly by the absence of any situations where one species has consumed another to extinction, in the absence of human interference. The major reasons for this are twofold. First, whereas individual human users can increase their rates of utilization, for example Hardin’s herdsmen adding more goats to their flocks each year while the number of herdsmen remains constant, species in the wild have rates of consumption limited by rates of encounter, rates of acquisition (e.g., successful handling of prey, and prey refuges) and satiation. Second, the population sizes of species in the wild are limited by numerous environmental factors, of which resource availability is a significant one. Human populations in contrast have been increasing almost exponentially since the nineteenth century.
Nevertheless, in this paper I will argue that a comparison between human and natural consumers illuminates three important aspects of TOC. First, it forces us to clarify explicitly several TOC parameters and processes, namely the types of resources that qualify as potential TOC resources, the multiple ways in which levels of utilization can be manipulated independently, what actually constitutes a cost to other users, and why users are apparently compelled to action based on another user’s actions. Second, the networked nature of consumers, resources and types of interactions in natural ecosystems demonstrates both the limited applicability of local, cooperatively self-managed strategies in an increasingly connected and populous human world, as well as the dangers of increased connectance. Third, the concept of mutualisms, which are widespread in nature, offer solutions to TOC that become more relevant in an increasingly connected world.
I will use simple mathematical models to describe natural systems, and develop comparable models for TOC. The advantages of mathematical models have been discussed extensively elsewhere [5], but it is worth reiterating several points here. Carefully constructed models force us to be explicit in our definitions of terms, concepts and parameters as well as their interrelationships. Those explicit definitions reduce ambiguity in an argument, often avoiding subsequently misdirected criticisms. For example, Hardin admitted that the use of the term “unmanaged” in his original paper would have avoided many subsequent disagreements and misunderstandings over the applicability of TOC. Finally, carefully constructed models state assumptions clearly, and often reveal where assumptions have been made in prior verbal arguments.
The paper is divided into the following sections. Section 2 provides an explanation of the simple logistic model of population growth and the Lotka–Volterra predator–prey model from ecology. Section 3 describes the development of an equivalent model for TOC, contrasting it with the Lotka–Volterra model and exploring the consequences of frequent assumptions in TOC studies. Section 4 presents the extension of TOC scenarios to networks of species and human consumers. Section 5 develops a simple model to explore the utility of exploiting human mutualisms.
2. The Logistic and Lotka–Volterra Models
Species in natural ecosystems can be divided into three general trophic or energy acquisition/transfer categories: producers, consumers (of which parasites are a subset) and decomposers. Populations of all those species grow or shrink according to the availability of necessary and suitable resources such as energy and habitat, and the limiting actions of the physical environment, competition within species (intraspecific), and antagonistic interactions between species (competition, interspecific predation, parasitism and disease). This regulated system is described simply by the logistic differential equation of population growth,
where N is population size, r is the intrinsic rate of increase of the population, and K is the environment’s carrying capacity, that is, the maximum number of individuals of the species that can be accommodated and attained given environmental limiting factors. Renewable natural resources have maximum sizes or concentrations set by the environments in which they exist and with which they interact. This and subsequent formulations are illustrated with a series of related simulations, the results of which are shown in the accompanying figures (Figure 1A).
One type of environmental interaction of interest to TOC is the consumption of a renewable resource by a biological agent. Consumption, or predation, is one of the fundamental interactions in the natural world, responsible for the transfer of energy through biological communities on an ecological timescale, and crucial to the diversification of ecological function on evolutionary timescales. The mathematical biology literature on predation is rich, but is derived almost exclusively from the pioneering work of Alfred Lotka and Vito Volterra [6,7], who independently formulated the following coupled differential equations describing the interaction between resource and consumption, e.g., a population of prey and a population of predators:
where H and P are population sizes of the prey and predators respectively at time t. The birth rate of the prey is a, b is the death rate of the predators, and and are their interspecific interactions (symbols adapted from [8]). An equilibrium exists between the two populations when neither is growing nor shrinking, calculated by setting each equation equal to zero.
This equilibrium is not a stable one, however, and any displacement or perturbation of the system away from it can lead to the well-known cyclic oscillations of both populations. That such regular cycles are almost never observed in natural populations is a function of the complexity of natural communities, where populations are influenced by many other factors in addition to predation, and predator behaviour is often more complex than reflected in the model. The Lotka–Volterra equations are too simple in the sense then that neither equation includes terms for the regulation of populations by terms other than and , for example K in the logistic model [8], and interspecific interactions (e.g., ) ignore many behavioural features, such as intraspecific interference [9]. The modeling of predator–prey systems has extended well beyond Lotka–Volterra, e.g., the well-known Rosenzweig–Macarthur model [10,11], but both the original and derived models highlight the fact that populations of resources and consumers limit each other by their interaction. Importantly, resource decline will drive decline of the consumer, moderated by the strength of the interaction and the availability to the consumer of alternative resources.
The potential for instability of the Lotka–Volterra system increases rapidly when it is extended to more than two species [8], the consequences of which are explored later in greater detail. The observation is relevant to TOC situations because of increasingly networked human societies and economies. A resource–user situation is so affected when there are users of multiple types, for example a meadow used for both cultivation and grazing, or when one situation has an impact on another, for example the fouling of fishery grounds by industrial activity. Contrary to the implications of the Lotka–Volterra system, many natural communities and ecosystems appear to exhibit degrees of stability in spite of high connectivity. This observation supports a notion that ecological complexity promotes stability [12]. Model support for such a hypothesis is equivocal at best, however, prompting May [8] to suggest that perhaps times of stability instead promote ecological complexity. Moreover, real ecological networks are a small subset of the total number of networks theoretically possible given a certain number of species, in general minimizing problems that could arise from Lotka–Volterra instability. The potential for mutual benefit or negative impact among resource–user systems in human economies, and its role in TOC, may therefore depend on the patterns of connections among those systems. A later section of this paper will examine potential lessons to be learned from how stable patterns evolve in natural communities.
3. A Simple Model for TOC
The most basic scenario with potential to become a TOC involves a renewable resource and two or more human users. The resource must be renewable, since finite resources, for example the quantity of various rare earth elements on Earth, are doomed to exhaustion anyway unless consumption is abandoned or recycling implemented. Additionally, the rate of renewal must be on a timescale comparable with the timescale over which utilization occurs, e.g., fish species are renewable resources because generation times (years) are commensurate with rates of utilization. In contrast, fossil fuels, though technically renewed by the continuous burial and fossilization of organic material, are renewed on geological timescales (millions of years). Those fuels are therefore non-renewable in practical terms of human consumption.
A basic TOC model must also include an interaction between resource and utilization, and a description of how utilization increases or decreases. In the absence of any human use, we will first describe the resource’s population dynamics with the Ricker model [13], a discrete equation equivalent to the logistic growth model. I adopt a discrete approach because decisions regarding changes to rates of utilization, for example the addition of another goat to the herd or vessel to the fishing fleet, often occur in discrete time (e.g., annually). Therefore, let
where is the resource level or population size at time t, r is the intrinsic rate of growth or renewal of the resource in the absence of any limitations, and K is the carrying capacity of the environment with respect to R. K again describes the maximum size of R, imposed by spatial limits, physical conditions, natural predation and so on. The discrete model mimics the continuous logistic model, with an initial exponential increase of R, followed by a leveling off at K (Figure 1B).
We now introduce a term to represent consumption or utilization by our human TOC agents.
where is the total fraction of R utilized by human users at time t, and ranges from 0 to 1. The term in square brackets on the right hand side of the equation is the modified growth rate of R. The resource is stable when this term is positive or zero, that is, the rate of resource renewal exceeds or is equal to utilization. Since U is the total standardized utilization rate of all users, it may be expanded to
where there are N users and is the standardized utilization rate of the user at time t. The benefit gained from utilization is modelled as
where is the benefit to user i, f is a factor that converts resources utilized into another commodity, for example converting harvested food to energy or currency, and B is the total benefit to all users.
Any situation where a renewable resource is being utilized will descend into a TOC whenever the rate of increase of utilization rates, or the acceleration of utilization, is positive, that is, users increase per capita utilization over time, or there is an increase in users, or both. Unlike the Lotka–Volterra system, acceleration of U couples increasing rates of utilization with a declining resource level, and exhaustion of the resource is then inevitable, as noted by Hardin [1]. Figure 1C compares resource level R with utilization and reveal two interesting features. First, total benefit continues to increase even after it has exceeded R. This is possible because both R and the growth of R, the standing resource and newly produced resource, are available at any given time. Second, benefit has a maximum level beyond which it begins to decrease along with R, even as the rate of utilization (U) continues to increase. This occurs when U has exceeded the rate of resource renewal.
Before proceeding further, a few notes on the model are in order. The Ricker model is a discrete equation that is subject to chaotic dynamics similar to those exhibited by the related discrete version of the logistic model [14]. This complication can be minimized, as in the simulation in Figure 1, by limiting the growth parameter r to small values (). Some fluctuation is nevertheless observed early in population growth prior to settling down to a fixed value equal to K, and there is no impact on the subsequent TOC simulation. The fluctuations would in reality be masked by environmental and demographic stochasticity, such as that stemming from small population size. Those fluctuations do become increasingly dangerous as R declines, increasing the probability of extinction prior to total utilization. Stochasticity is not incorporated in the current model, but could be with the addition of a simple, randomly varying term.
3.1. Costs
The additional factor in a TOC scenario, and the one of most relevance to all users, is cost. Hardin suggested that when a user increases its utilization, the additional benefits accrue to that user only, while the impact is direct to the resource and hence the cost of increased utilization is shared by all users. This is a very attractive cost-benefit ratio for the enterprising user, since the cost incurred per increase in benefit is distributed among all users. The notion of cost is, however, a particularly unclear one in the TOC concept. Exactly what is the cost to the users, and does every increase in utilization generate a cost? Re-visiting Hardin’s herdsmen scenario, what is the cost incurred by all when one more goat is added to the pasture? Examining both Equation 5 and Figure 1C, it is clear that when the amount of resource being used is less than the amount of resource available, no immediate cost is incurred by anyone! Even when utilization exceeds the rate of resource renewal, no immediate cost is incurred if the amount of standing resource is large enough to permit a further increase of utilization rates. Cost is realized only when the goat is added that prevents any subsequent growth without resource exhaustion, that is when utilization is already a sustainable maximum, and/or when a user must subsequently increase its rate of utilization in order to maintain its current benefit.
Initial cost begins to accrue whenever the acceleration of utilization is greater than zero, though it may be a hidden cost because it has no immediate impact on other users. A TOC has already been set in motion however, and can be averted only if utilization rates are subsequently frozen at a sustainable level, or are decelerated. Cost can be measured at this early stage as the reduction or loss of potential for future increases in utilization. That is, when one user increases its utilization, there is less of the resource being generated or renewed that is not being utilized, and hence a reduction of the extent to which any and all users can increase their own utilizations in the future. Therefore
where is the average cost to each user. Any reduction of the standing resource available is a positive cost, while increases are negative costs. A stable resource level means that no cost is incurred by any users. The important requirement of a TOC is that utilization must be accelerated, but while early cost is a potential one only, accelerations of utilization are either purely opportunistic, or necessitated by a user’s externally increasing needs (e.g., feeding a growing family). Continued acceleration, however, will eventually reduce the amount of unutilized resource to the point where users must increase the rate at which they are accelerating their utilization simply to maintain their current benefits (Figure 2). During the first phase of a TOC, increases of utilization are therefore opportunistic or externally-driven and cost is potential, while at a later stage increases of utilization are obligatory and cost increases. Nevertheless, the conditions for TOC are set the moment that there is a positive acceleration of utilization. It is important to note that a non-trivial TOC occurs because the rate of utilization has exceeded the rate of resource renewal by some factor. It does not occur because of the amount of resource used, because the resource is renewable (hence non-trivial).
Hardin’s use of the terms “compel” and “compulsion” was unfortunate. If the initial cost to all users incurred by a single user’s increased utilization is not necessarily immediate, what compels other users to increase their own utilization? Based on the above argument, there will be a time when the addition of a goat to one herdsman’s flock has no impact on any other herdsman. The latter should feel compelled to reciprocate only if they have assessed the potential of the meadow in terms of maximum use, or have rationally formulated plans for future increases of their own flock. Since no immediate cost has been incurred by them, the compelling cost is a perceived and potential one. I suggest three non-exclusive answers to why another user’s increased utilization, or a perceived cost, might compel a user to increase their own utilization. The first follows directly from the model, where users realize that the cost incurred because of another user’s increased utilization whether immediate or not, is a signal that their own future utilization, and any resource growth, are now more limited. Acting upon this information makes sense only if N is limited and there is a need to increase utilization as insurance against an uncertain future, or if the resource can be converted into other useful commodities. More likely scenarios are the realization that opportunity exists for the expansion of utilization in the favourable framework of unshared benefits and distributed cost, or meeting the demands of externally-driven costs. In either case, users are eventually compelled to increase utilization if benefits begin to decline. Other reasons for compulsion could perhaps exist if the users participate in a broader economy driven by a growth imperative. Finally, there is a possible natural compulsion of humans to compete, but exploring the validity and implications of that answer, which touches on the role of morality in Hardin’s argument, is beyond the scope of the current paper.
3.2. General Models
We can now generalize from the Ricker-based model to any description of a renewable resource.
is the production or growth rate of R at time t. The parameter can be any type of growth function, for example the Ricker exponential function, with production being a function of the standing resource (). and are the growth rates of per capita utilization and the number of users respectively. A TOC is inevitable if either or both those parameters exceed 1. As benefits decline, that is, , must grow at a rate that at least maintains current benefits, that is, the acceleration of utilization must itself be accelerated. The minimum increase of user effort is
This presents a dilemma for the user, since the new acceleration is based on a comparison of benefits from previous efforts, the current benefits being a function of . In the case of a resource in decline because of TOC, this minimum measure of will lag behind the rate of resource decline, and therefore be insufficient. Yet, in order to make the value sufficient, a user must have knowledge of all the above parameters, for all users in the system, or inflate the value of based on some estimate, which in turn hastens the TOC.
Additional insight into the TOC system can be gained by re-writing the system as a differential one (momentarily ignoring the earlier requirement for discrete time).
where again, is the acceleration of utilization, and j is the acceleration of . This might seem a tricky concept at first, but the interpretation is straightforward. During the first phase of an unfolding TOC, users increase their utilization per unit time, hence utilization is accelerated. That acceleration can, however, be constant, as in the simulations in Figure 1. As benefits begin to decline, however, users are compelled to respond by increasing the rate of acceleration, that is, accelerating acceleration. This “acceleration of acceleration” is termed jerk in physical mechanics, hence j.
The above system assumes that all users have the same rate of utilization (u), and is in equilibrium when is zero, that is, total utilization is balanced perfectly by the rate of resource production P.
The equilibrium is an unstable one, however, with depletion of R occurring for positive , that is, per capita utilization grows with time. While benefits remain stable or are growing, , and j may take any value; users are free to increase or decrease their utilizations, at any rate, or hold them constant. With the inevitable decline of R, however, the cost to at least maintain a constant benefit requires an increase of the rate at which utilization has been growing. Then
where , and . Under such circumstances, a TOC is facilitated by a succession of jerks. These are the fundamental dynamics of a tragedy of the commons.
4. Lessons from Nature
Tragedies of the commons between a resource and consumer occur in nature only under exceptional circumstances. Exceptions occur when prey are faced with a novel predator or are unable to find refuge (whether spatial, temporal or developmental), as has happened repeatedly when humans have introduced predators to small islands, for example rats in Polynesia or South Georgia, or the brown snake in Guam. In general, though, consumer populations are dependent on their resources to the extent that as consumption causes the resource to decline, consumer populations will also decline or will switch emphasis to other resources. Declining consumption subsequently allows resource replenishment, followed by recovery of consumer numbers, and so on. These are the simple dynamics captured by the Lotka–Volterra equations. Solutions to the TOC in human systems, whether they are Ostrom-type self-managed or cooperative schemes, or more coercive solutions of the sort advocated by Hardin, essentially mimic the Lotka–Volterra system. They do so by limiting resource utilization (U) to a maximum level that allows persistence of the resource, albeit at a level much lower than its natural limit, K. (Recall that U in the above TOC models is the product or function of the number of users and per capita utilization rates). Examples range from small-scale situations such as lobster fishermen off the coast of Maine [3] to the maximum sustainable yields (MSY) of large-scale fisheries. The former works by limiting the number of users, N, and the latter by limiting N or total utilization. We can model these solutions collectively with a Ricker-based model as
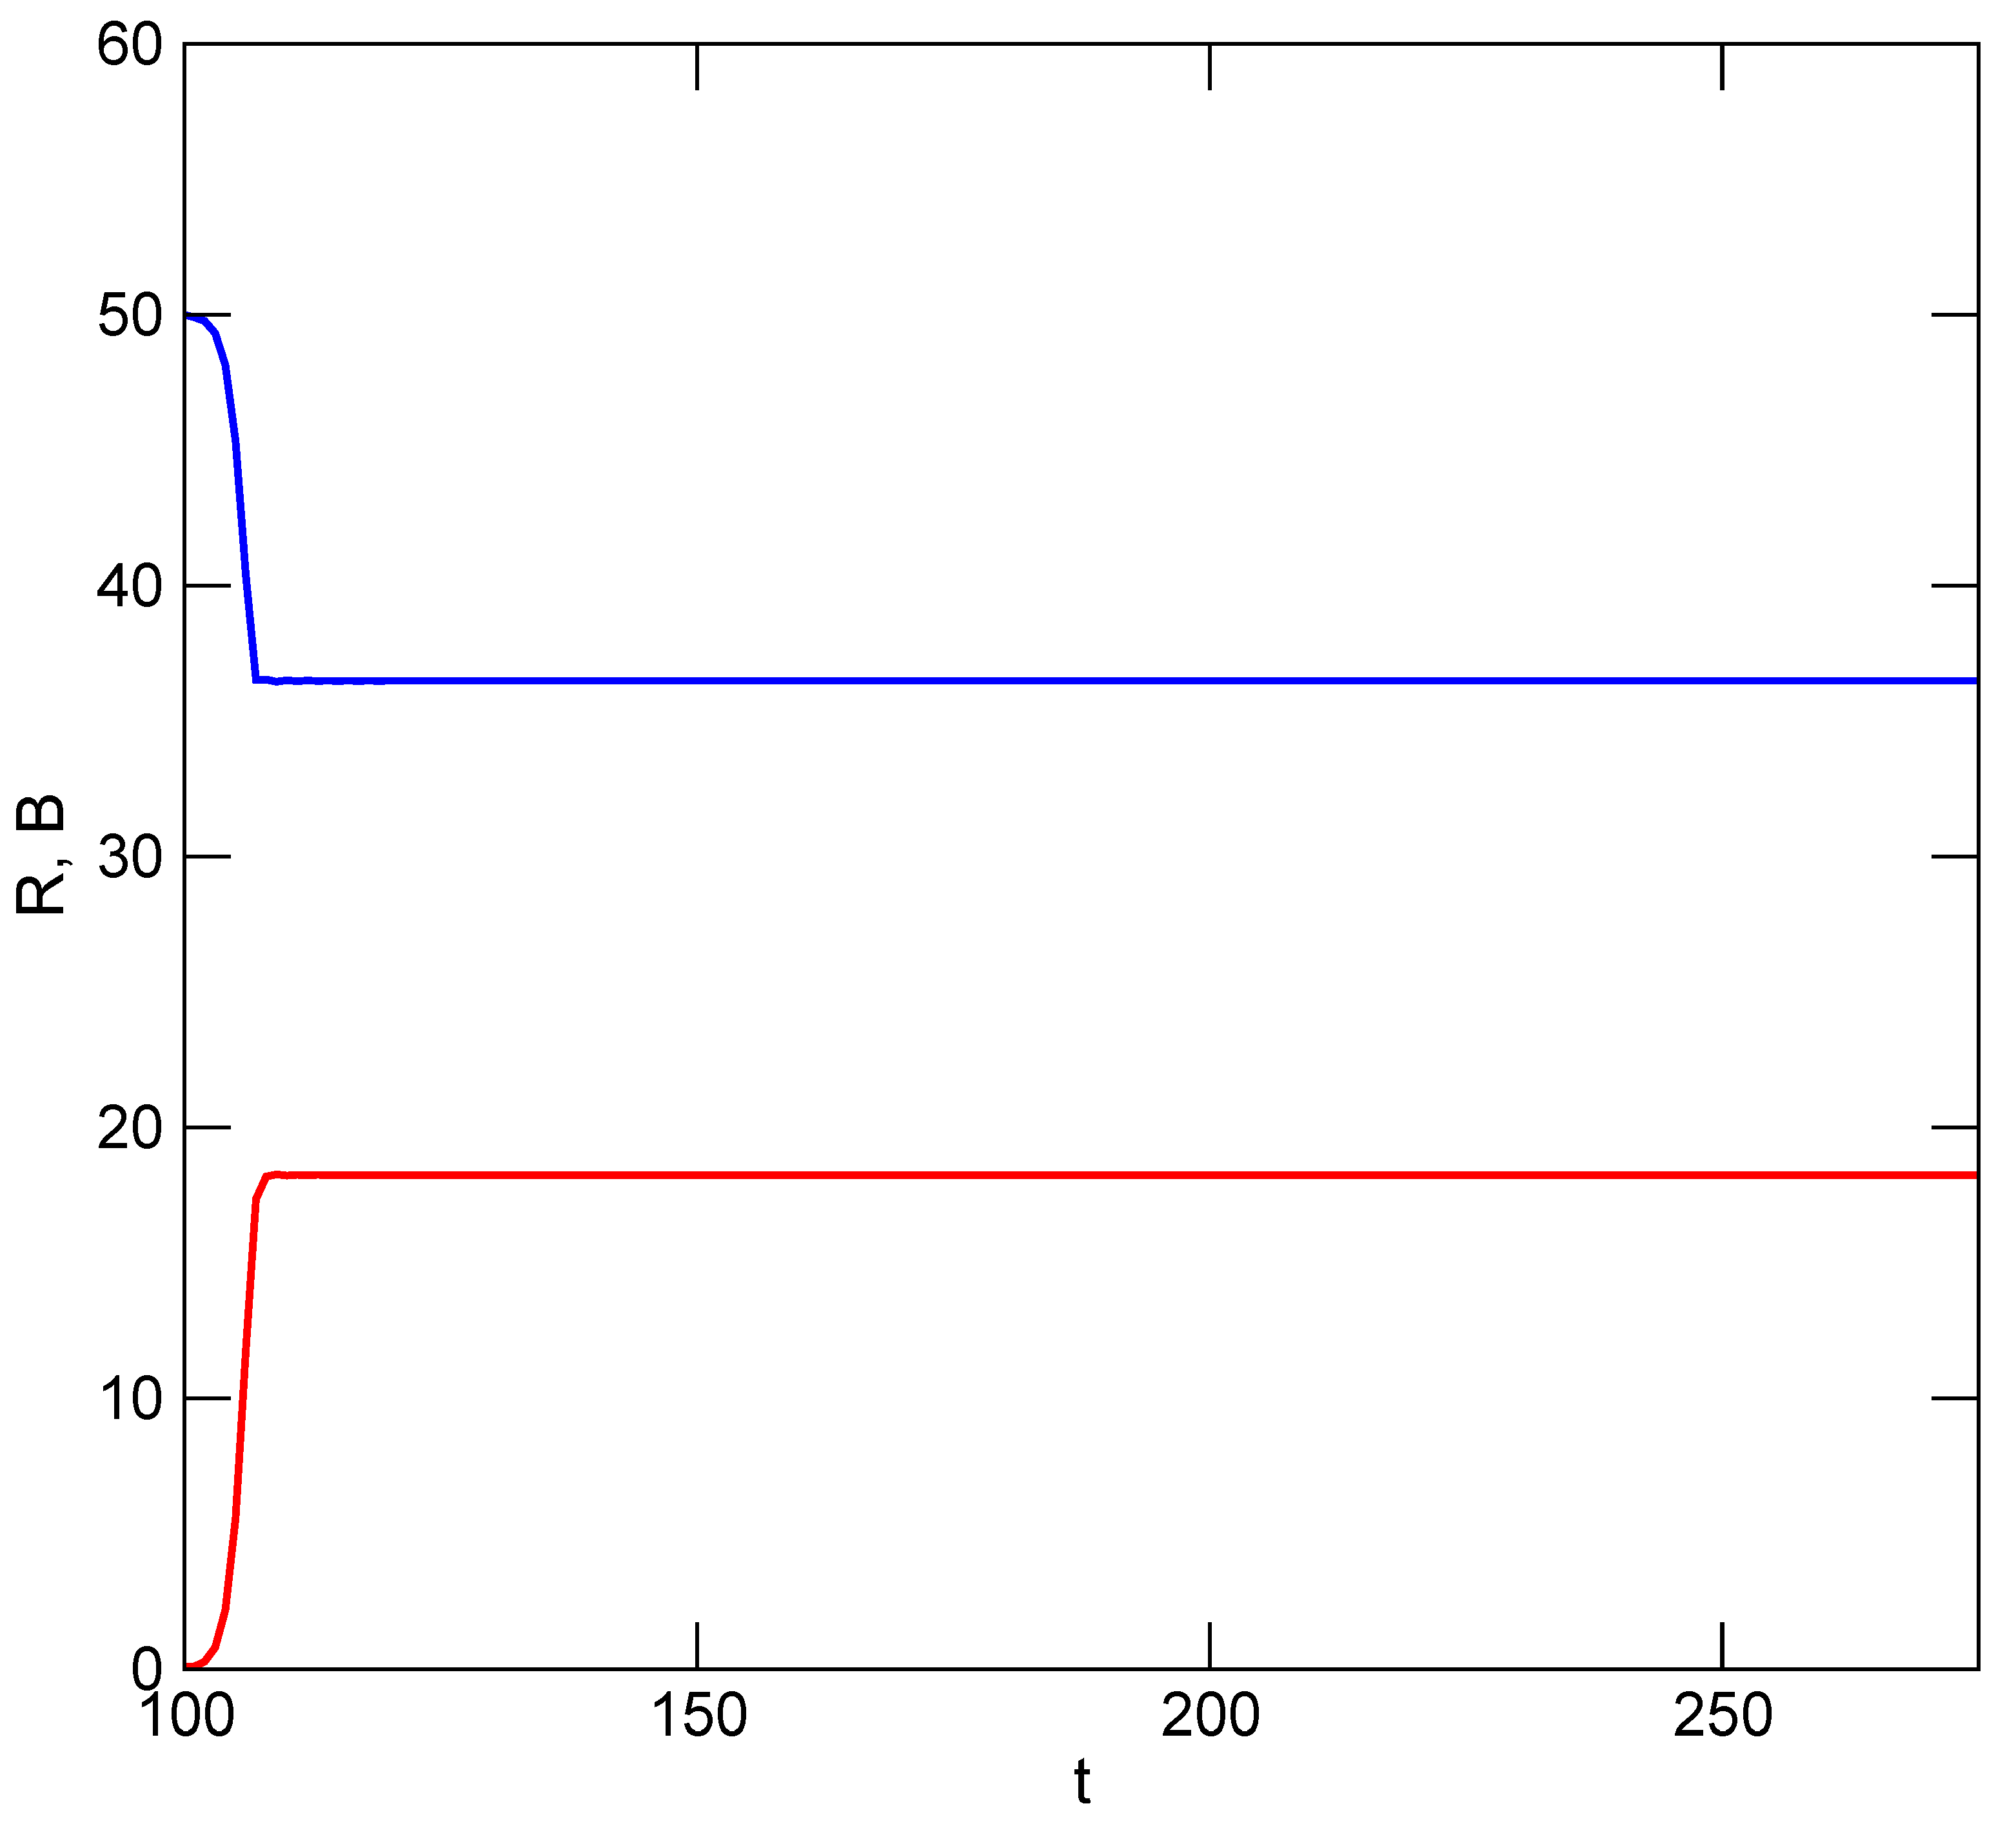
where m represents the maximum permissible fraction of K (= maximum value of R) that can be utilized. This sets a logistic or asymptotic limit to U (Figure 2).
Several problems nag this approach, however, and render these acceptable solutions to TOC temporally unstable. Their implementation depends on accurate assessments of the resource’s (R’s) demographic dynamics, that is, having knowledge of the rate of resource renewal r, and the carrying capacity K, while their success depends on limiting N. Demographic knowledge of R can be gained from experience or studying the relationship between production and utilization over time. Users are then faced with decisions of how to best manage their utilizations to both preserve the commons and the welfare of other users. For example, the Maine lobstermen have managed their fisheries successfully and productively for generations, keeping fishing rights within the community, admitting very few newcomers, and thereby either limiting N or allowing it to grow only slowly. Similarly, state or multi-nationally managed commons, such as access to fishing grounds or management of individual species often use a MSY approach. There, a common strategy is to limit N or u, though the composition of users may be varied or alternated over time. The solution hinges on two critical components; proper assessment of R and user decisions. The ability to measure and understand the demographic dynamics of renewable natural resources varies with the scale and complexity of the resource. It is far easier to measure the extent of an essentially two-dimensional surface such as a range of arable land, and to observe variation of its vegetation, than it is to measure standing stocks of open ocean fish and the relationship between stock, rates of recruitment and physical variables. The latter difficulties have plagued large-scale fisheries management since the earliest days of government control and multinational planning [15].
Another problem, and one which Hardin placed at the center of his argument, is of course whether users would indeed make decisions based on resource sustainability and user welfare. Hardin was decidedly of the opinion that selfish behaviour is a strategy adopted frequently by users for short-term gain. Observational and experimental work in both economics and social psychology present evidence that this is not always the case and that groups of users will in fact act cooperatively and altruistically. While the data cannot be doubted, one should nonetheless be skeptical of the impact of such solutions in the modern world for two reasons. First, contrary to arguments rooted in evolutionary group selection as explanation of the data [16], there is no compelling evidence that altruism has been selected for in humans which could extend beyond small groups of individuals with strong interrelationships, whether genetic or cultural. Species-wide selection would be required for tragedies to be avoided in a world where users and groups of users are converging increasingly on selected resources. Second, users of single resources, even when managing wisely, often are incapable or fail to account for the effects of their utilization on both the ecosystem and hence potential resources of other groups [17,18] in what is, after all, a finite and connected world. For example, a local fishery deprives predators and decomposers of energy, disrupting ecosystem functions and possibly affecting other human users. In the case of the harvesting of higher trophic level, keystone predators, there are likely to be top-down cascading effects on the ecosystem, with consequential increases of lower-level prey, decreases of the prey of those prey etc., and the loss of inferior competitors [19].
There is also a temporal problem because N is drawn from a growing human population, and N must either grow to reflect that broader population growth, or exclude a growing fraction of the population from a particular commons. The global human population has been growing roughly exponentially since the 19th century, and almost all states have contributed to this growth. (Minor exceptions include isolated or semi-isolated indigenous peoples and some religious communities). Global population is projected to increase from its present level of 6 billion to about 10 billion by 2050 [20], whereas it took 200,000 years for our species to reach the first billion! Therefore, when N-limitation is used as a means to avoid a TOC, it is increasingly at the expense of potentially new, and consequently disenfranchised users. This latter group must therefore either remain disenfranchised or engage in alternative occupations, some of which will involve the exploitation of other commons. In a sense then, the TOC has been avoided but only because the problem has been shifted elsewhere. Indeed, Hardin argued that the use of a commons could be justified only under conditions of low population density. Coping with a growing population means that resources can no longer be treated as commons, or that the number of exploited resources must be increased. The latter situation, of course, further multiplies the number of potential tragedies. In nature, specialization driven by competition promotes increases of functional diversity among species [21]. Analogously, Adam Smith associated greater wealth with more intense competition, and hence increases in both the division of labour and the number of occupations [22].
4.1. Multiplying Commons and Ecosystem Structure
A practical response to coupling N-limitation with a finite commons is to engage new potential users with other resources. Thus, if a fishery is crowded, add a new fishery based on an alternative species. Similarly, if the fishery is dangerously depleted, shift some users to an alternative species. An analogy can be drawn here with nature, where ecological niches have multiplied over broad spans of geological time as species have come to exploit an increasing number of habitats and other species, and in an increasingly diverse number of ways [23]. Rich biological communities today comprise easily more than a thousand species and tens of thousands of consumer–resource interactions. Similarly, over time humans have invented numerous ways in which to exploit natural resources, and continue to increase the number of exploited resources at an accelerating pace. Drawing an analogy between a group of humans and a group of multiple species is arguably legitimate because whereas a single species is adaptively limited to a specific set of resources, and all members of the species are engaged in exploiting those resources, humans collectively behave as an entire ensemble of multiple consumer species; single human populations are often divided into users of different resources, and resource switching and innovation can be rampant. One could therefore argue that the avoidance of TOC by limiting N, and hence U, is a sound one which leads to a diverse “ecosystem” of human interactions with natural resources. It is precisely at the level of the ecosystem, however, that tragedies occur in nature. Ecosystem-level tragedies have occurred in the past under two sets of circumstances; first, when there have been transformational evolutionary innovations, such as oxygenation of the atmosphere as a consequence of the first photosynthesizers, or the development of the first forests as the result of competition among plants [23]. Those circumstances must be viewed historically, however, and while the consequences may have set boundaries for subsequent ecosystems, similar situations today do not necessarily constitute tragedies. When Paleozoic plants began to evolve the capacity for increased height and woody stems as an adaptation to competition for light, there almost certainly were “losers” who either went extinct or whose descendants became confined to systems with lesser competitive pressures. Today, trees must compete for light in a forest by growing ever taller woody stems or be adapted to conditions of lower light. This competition makes access to light ever more difficult in a developing forest, but the resource (light) is not ruined in the process, and neither are the consumers (trees). In another example, Wardle et al. [24] demonstrated the long-term decline of forest ecosystems spanning a range of environments and timescales. In those ecosystems, long-term increases of N/P (nitrogen/phosphorus) ratios in the soil indicate that the ongoing depletion of soil phosphorus by tree usage leads to a decline of tree biomass. This could be interpreted as a TOC because the self-interests of the trees ruin the soil, the forest and the trees, but it likely is not for two reasons. First, as noted by the authors, phosphorus is biologically non-renewable, in contrast to nitrogen, with each ecosystem beginning with a finite phosphorus concentration. The loss of phosphorus from the system is not a consequence of consumption by the trees (or other organisms), but rather of natural physical processes such as leaching. Second, the authors note that decline of their ecosystems is inevitable in the absence of catastrophic events which would presumably “reset” the suite of tree competitors. One such event that is widely absent from many of today’s forest ecosystems, such as the Cooloola in Australia studied by the authors, is plant disturbance and destruction by very large mammalian herbivores. Their absence can be attributed to extinction or extirpation driven by human predation and climate change [25].
The second circumstance, relevant to the strategy of N-limitation, involves changes to the numbers of species engaged in particular ecological functions [26]. A conventional tenet of ecosystem biology is the hypothesis that complexity promotes stability [12]. The supporting reasoning is twofold. First, the more species in a community, the greater the number of interactions. Hence, the loss of any single species is unlikely to result in the secondary loss of any other species because of redundant dependencies. Second, the impact of such a loss will diffuse through the complex web of interactions and not be focused on any single species or group of species. This reasoning runs counter, however, to results of models where predator–prey, or consumer–resource interactions of the Lotka–Volterra type are scaled up to even dozens of interactions. Those model systems in general tend to be highly unstable [8]. Yet, real-world ecosystems do consist of thousands of species and interactions, for example coral reef communities in the northern Caribbean, where as many as 3899 amalgamated interactions have been documented among 691 species, and those are but a subset of a much larger community [27]. This seeming paradox between the implication of fine scale models and real-world diversity can be resolved by recognizing that, while on average model networks consisting of multiple consumer–resource interactions are indeed unstable, there is nothing average about real-world networks.
A random assemblage of interactions among S species yields a network where species have, on average, the same number of interactions. Such networks invariably lead to unstable predator–prey dynamics. The underlying Poisson or Gaussian distributions of the number of interactions per species, however, are extremely rare in nature. Rather, natural distributions tend to be decaying, long-tailed hyperbolic distributions such as exponential or power law distributions [28,29] (Figure 3), characteristic of many other types of real-world networks [30,31,32,33]. Most species in such systems have fewer interactions than the distribution’s mean, while a few species have a much greater number of interactions. Additionally, consumer–resource interactions are arranged hierarchically in biological communities, with trophic levels consisting of primary producers (e.g., photosynthesizing plants), primary consumers of those producers, secondary consumers of the primary consumers, and so on. The distribution of interactions and the hierarchical structure partition the set of interactions [8,29], and the net result is frequently a complex system capable of stability. Whether skewed, hyperbolic distributions are the only ones capable of promoting stability is an unexplored topic, but in the space of model community networks possible given S, real communities seem to occupy a special or restricted region. Furthermore, hierarchical partitioning is not the result of random ecological assembly, nor does it occur in ecological time, but rather it is the product of natural selection acting on species’ interactions on longer evolutionary timescales. It is precisely at the interface between species evolution and the ecological dynamics of a community that we finally find a dangerous analogy with the tragedy of the commons.
4.2. Tragedies in Ecosystems
A survey of hierarchy-based stability in biological communities at various times in the Earth’s history reveals that a majority of surveyed systems are robust against minor frequent perturbations, and that there is a considerable amount of variation of the hierarchical structure permitted that retains robustness [26,29,34,35,36,37]. There are two exceptions, however, and these are instructive to the argument that multiplying the commons is a dangerous side effect of solutions that seek to avoid tragedies of the commons.
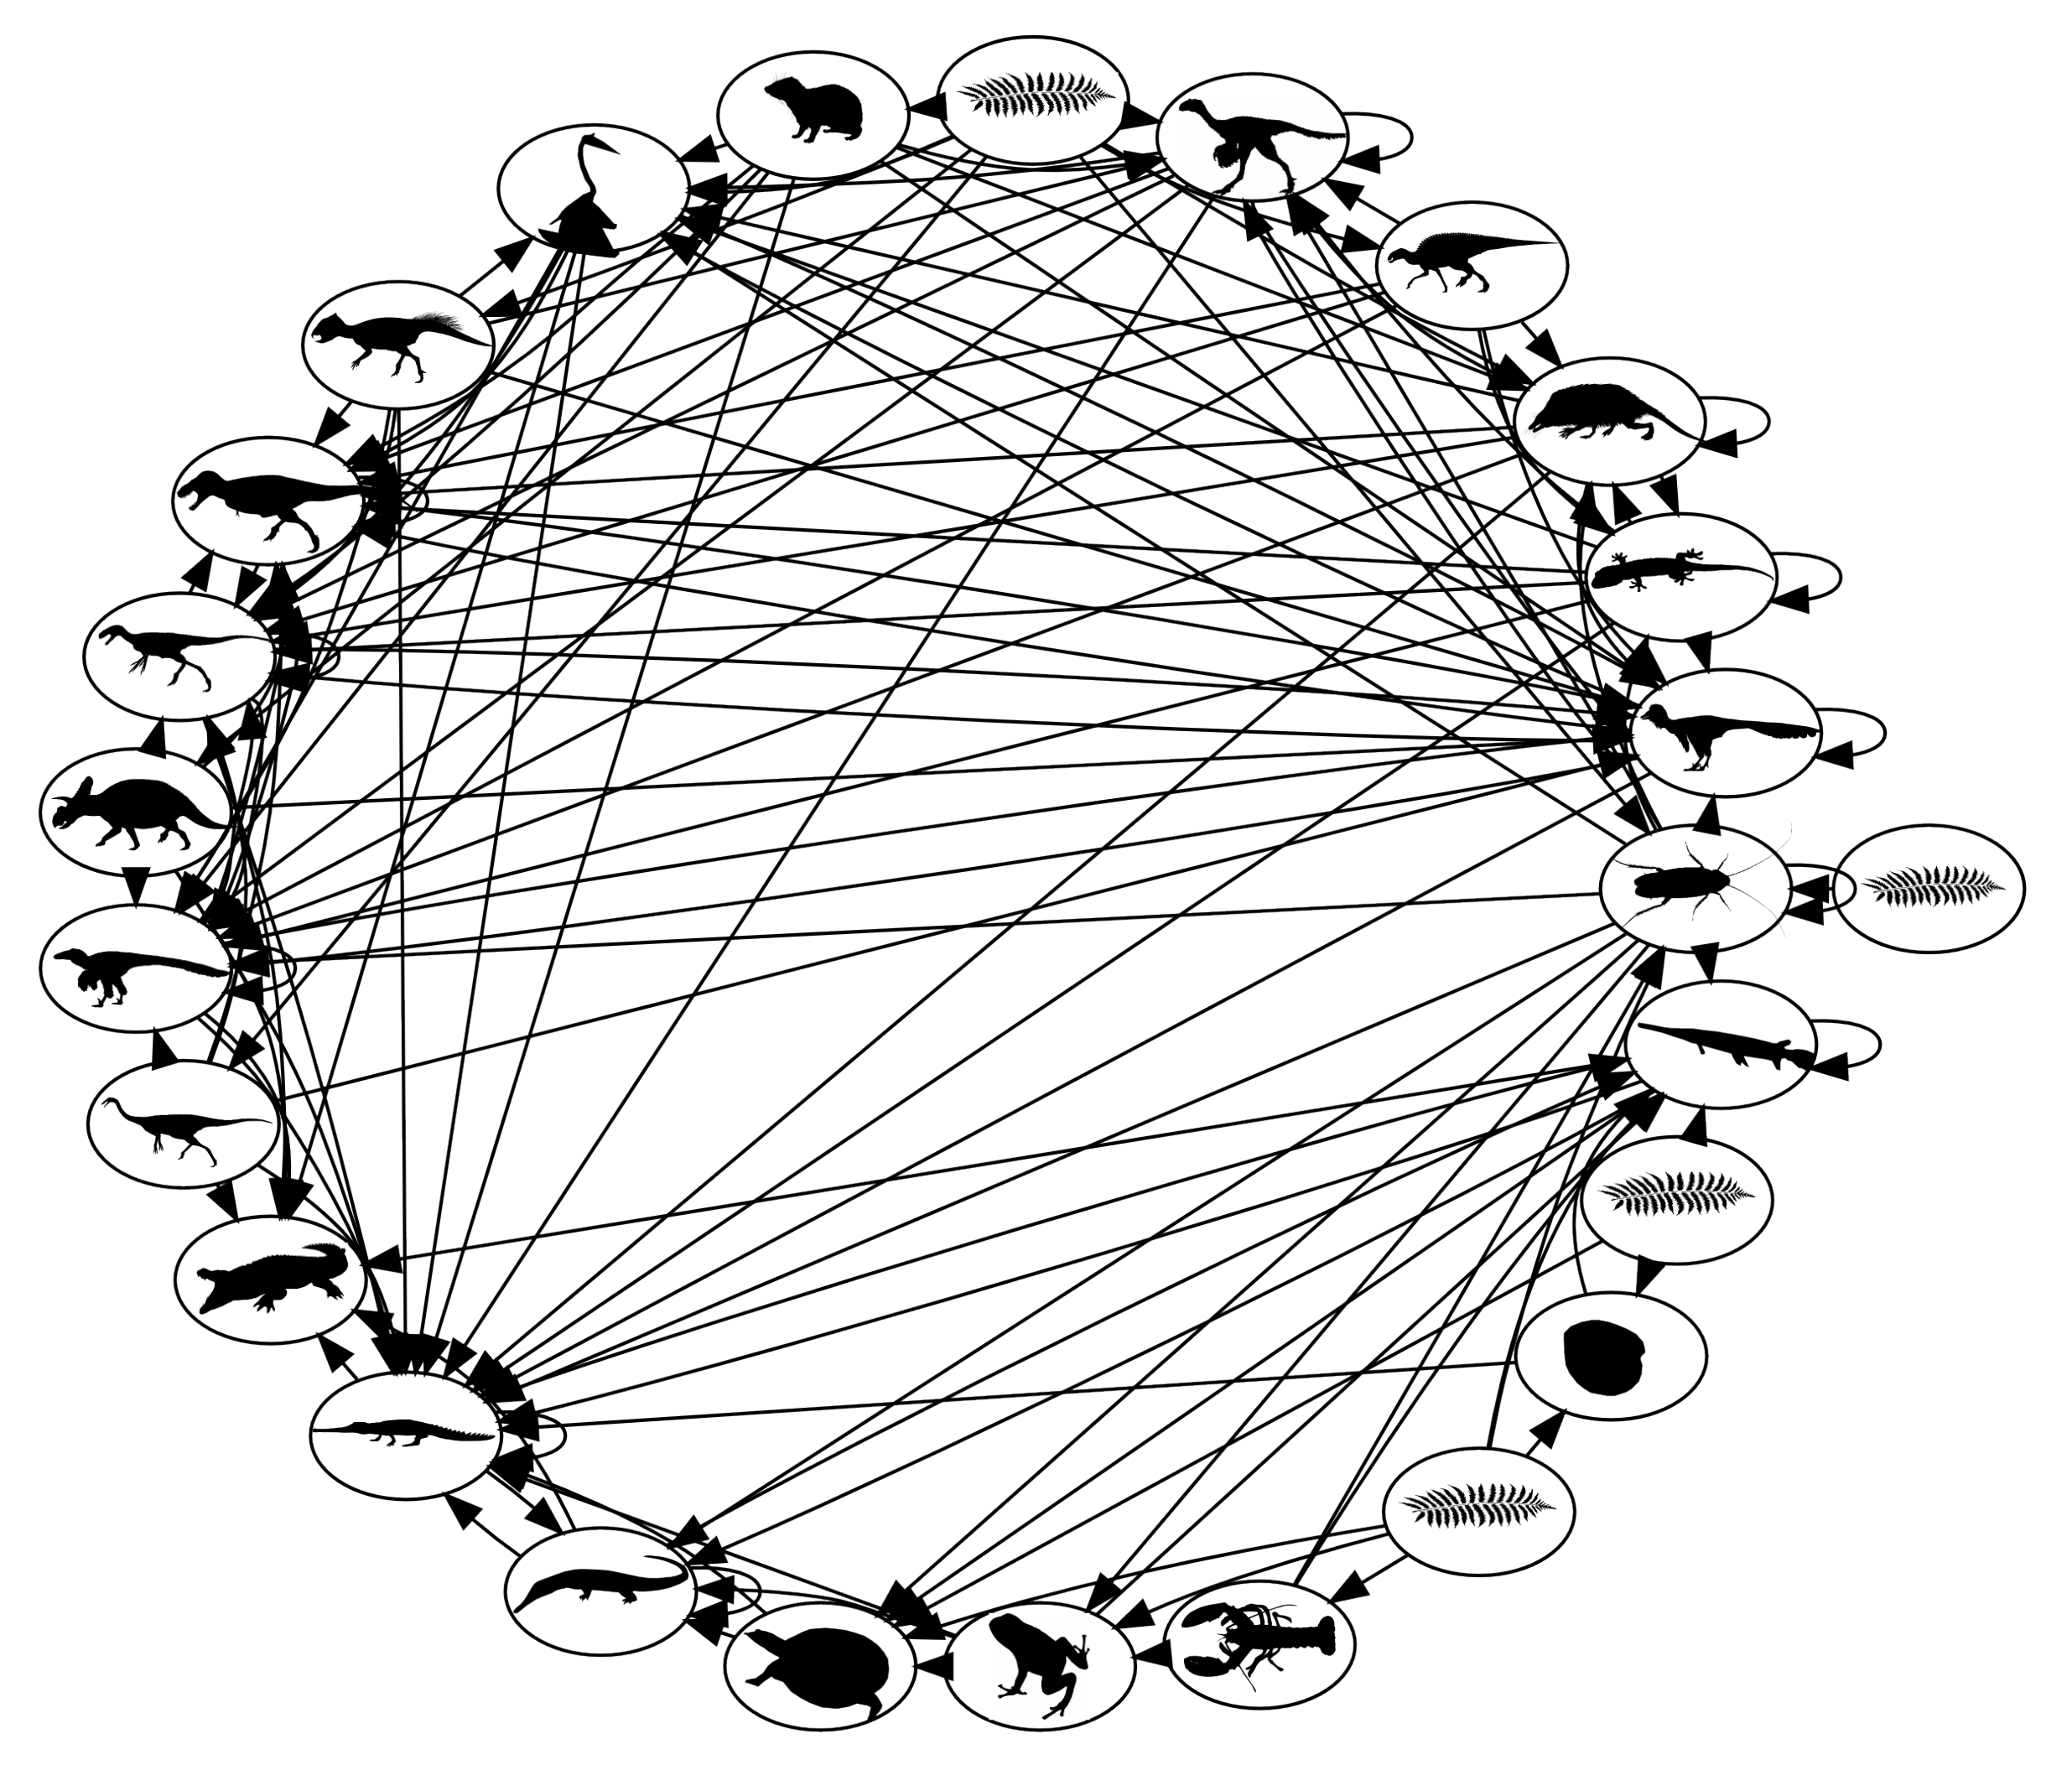
The first and more benign example is a comparison of terrestrial, dinosaur-bearing communities of North America in the 13 million year time span leading up to the end of the Cretaceous era 65 million years ago [37] (Figure 4). During that interval, a major shallow sea that previously had covered much of the western interior of the continent dried up. In the ensuing restructuring of surrounding terrestrial ecosystems, several trophic guilds, or groups of species with similar habitat, prey and predators, underwent changes of species richness. One notable group was the extremely large herbivorous sauropod and ceratopsian dinosaurs, such as Triceratops, which experienced an increase of species within local communities. A numerical model of community-wide predator–prey dynamics demonstrated that the increases of richness at this level of primary consumers resulted in communities that were slightly, but significantly, more vulnerable to cascades of extinction in response to any disruptions of primary production, i.e., the provision of energy to the community. Unfortunately, that was exactly one of the many catastrophic side-effects of the asteroid impact that occurred 65 million years ago [38]. The impact, energetically equivalent to 19,000 times the global nuclear arsenal, resulted in the extinction of more than 70% of all species documented in the fossil record at that time. Such a great and diverse number of carnivorous species preyed upon the giant herbivores at different stages of their lives that the abrupt removal of the herbivores, in response to the shutdown of photosynthesis in the months-long cool darkness that followed the impact, would have propagated disastrously through the community networks. The secondary loss of the carnivores was not solely a simple response to the loss of resources (prey) though. The model suggests that the primary vulnerability arose from an increase in the strength of relationships between carnivore species via shared prey. While it is very unlikely in reality, and highly improbable in the model that any two species of carnivores shared exactly the same set of prey species, the independent actions of members of separate species would have collided dangerously as prey species became extinct and options became more limited. Multiple competitively-driven tragedies of the commons were the consequence of multiple indirect relationships among the consumers.
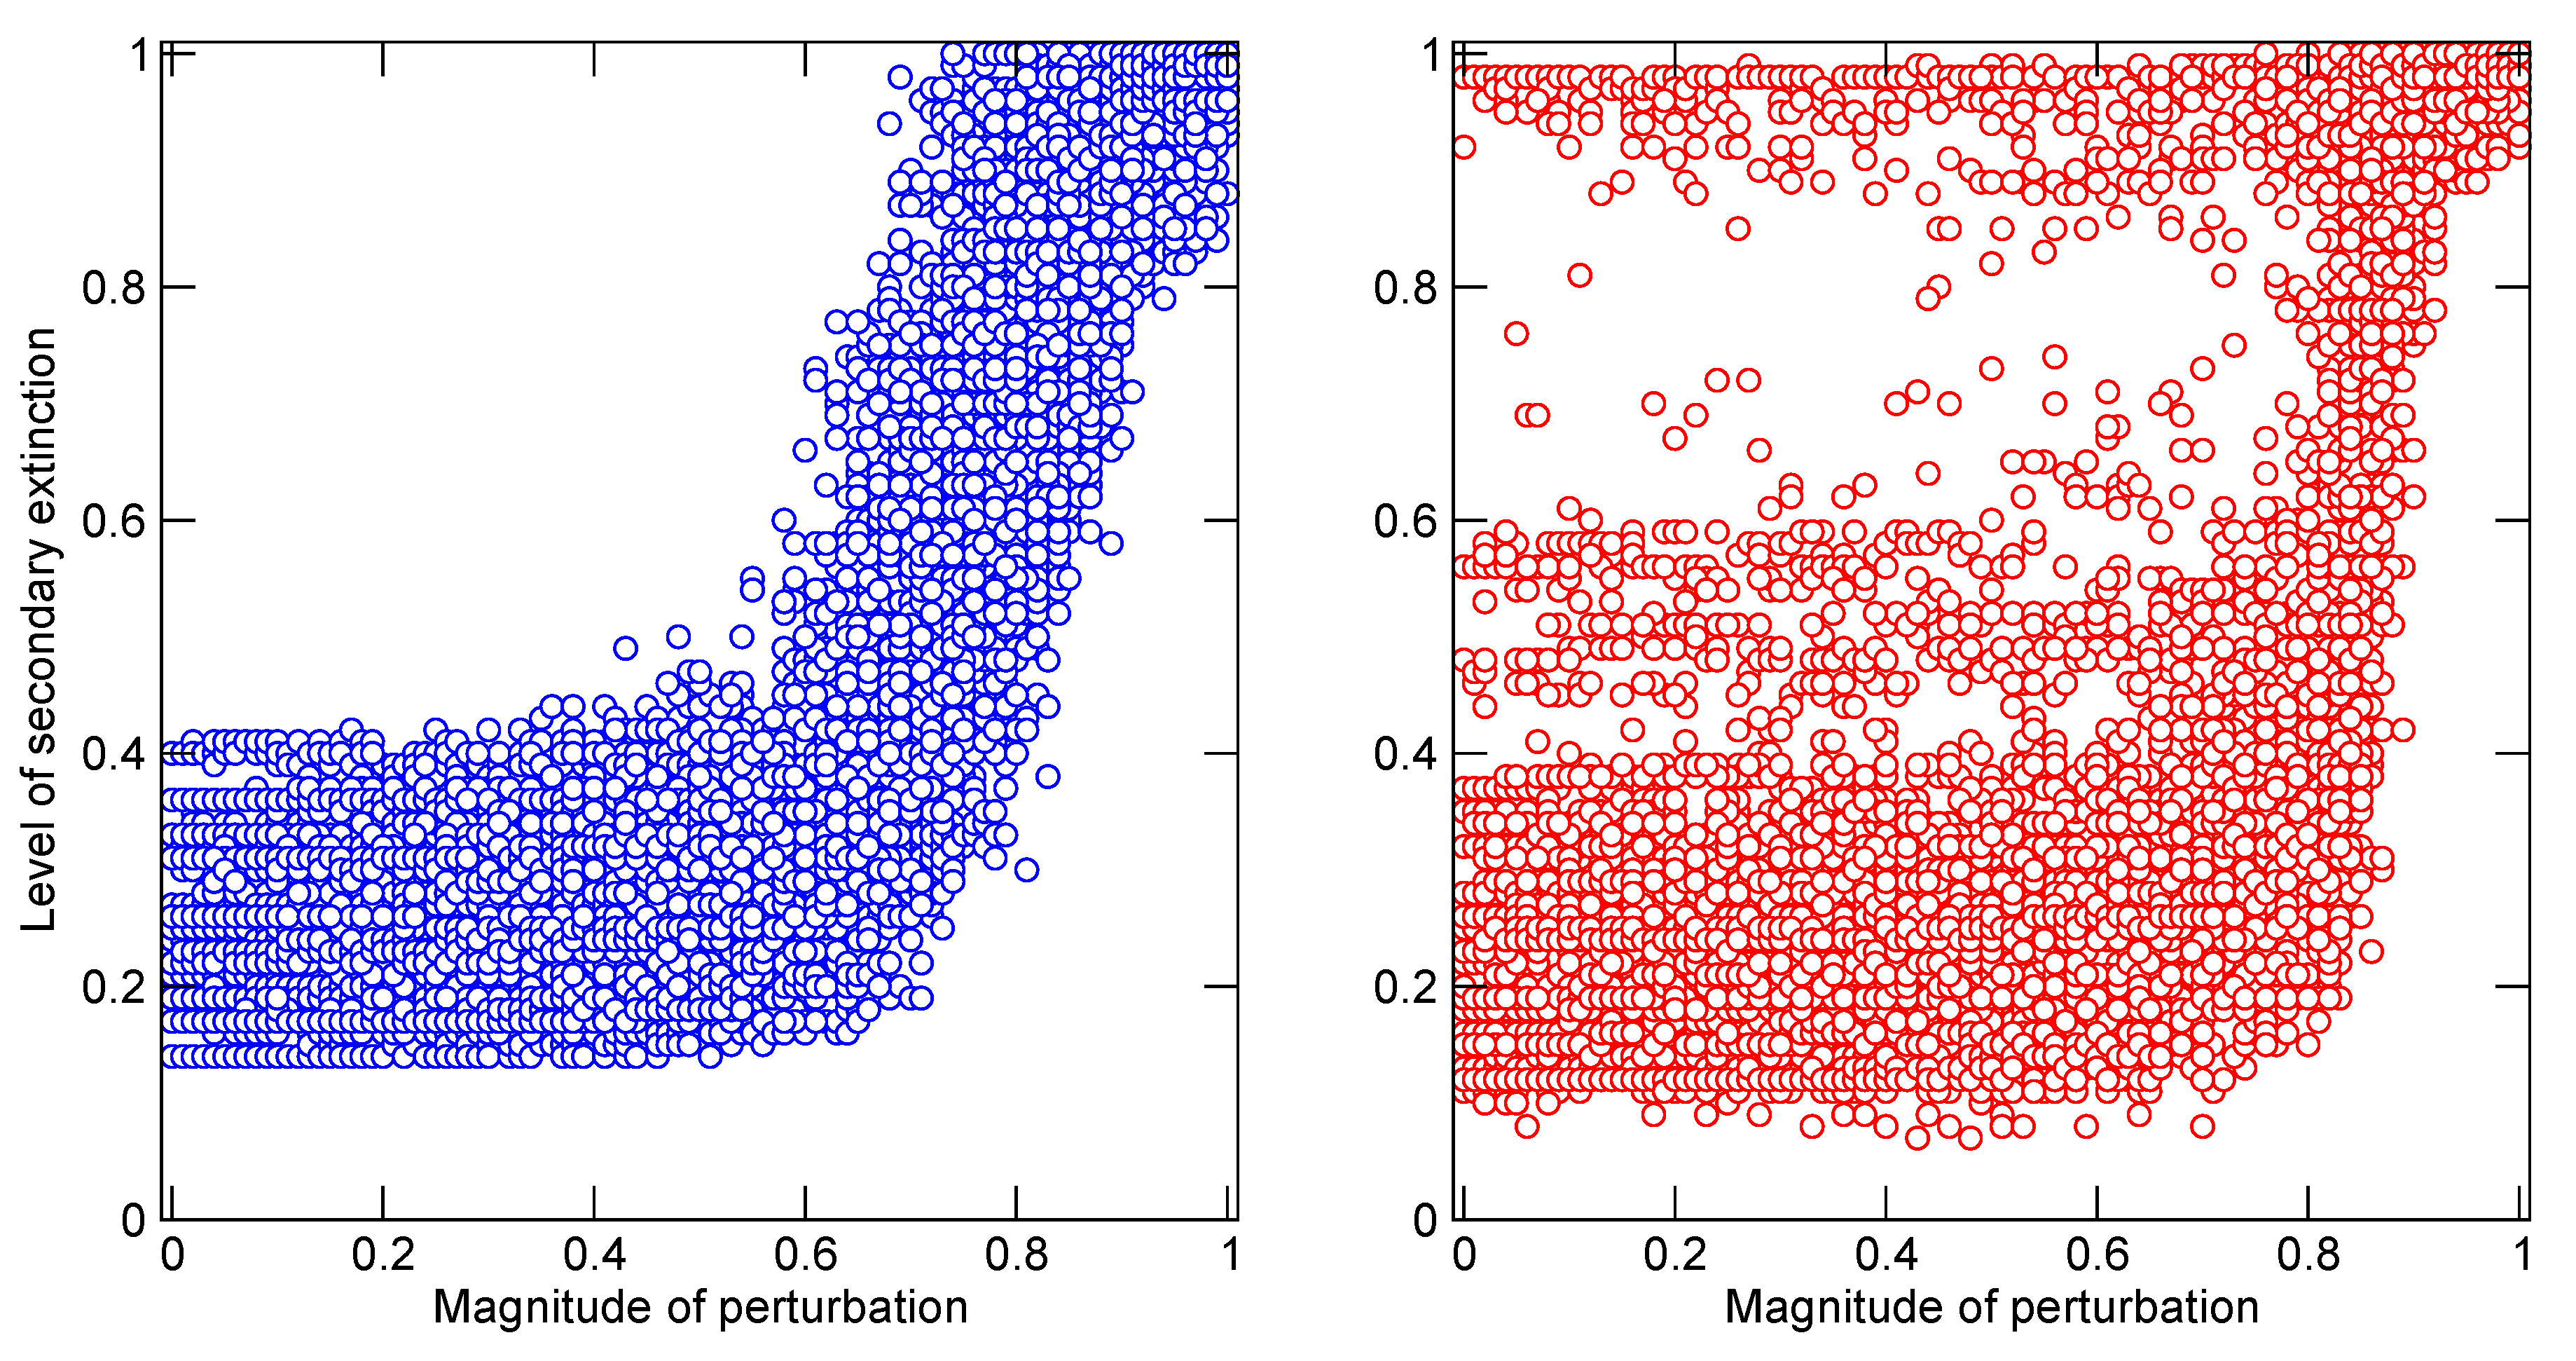
The second example is drawn from communities not prior to, but in the aftermath of a mass extinction, this one the devastating End Permian mass extinction of 251 million years ago. This is the largest known mass extinction in Earth’s history, when approximately 90% of fossil species became extinct. In this instance, the numerical model was used to examine the stability of well-preserved terrestrial communities from southern Africa over the 16 million years prior to the extinction, and immediately after [26,34,36]. The extinction struck species seemingly at random and uniformly across trophic guilds, but the recovery was both evolutionarily rapid and biased. Carnivorous amphibians, and small to medium-sized carnivorous-insectivorous amniotes (non-amphibian terrestrial vertebrates such as reptiles and the ancient relatives of mammals) diversified significantly, whereas related herbivores managed very little diversification at all. The result was an oddly imbalanced community of many predatory species and much fewer prey, and according to the model, one very prone to collapse in response to even mild disruptions of primary productivity (Figure 6). There is growing evidence that the world was biogeochemically unstable during this aftermath [39], and empirical fossil evidence exists to support the model prediction that many species were demographically unstable [40]. Again, the increased number of indirect relationships between carnivorous species via their prey increased the impacts that they had on each other. The short-term evolutionary success of the carnivores resulted in a community or system whose robustness suffered as a consequence of that success. There was in effect a tragedy of the commons, where the commons was system quality itself [26]. The evolutionary successes were in fact short-lived, and the community was eventually transformed by increased extinction of many of the carnivores, evolutionary diversification of herbivore lineages, and the development of a community more similar in structure and function to those that had existed prior to the mass extinction.
Figure 5.
Food web network of late Cretaceous terrestrial communities in North America. Nodes are trophic guilds, identifiable roughly by the cartoon silhouettes. Links are directed from prey to predators [37].
Figure 5.
Food web network of late Cretaceous terrestrial communities in North America. Nodes are trophic guilds, identifiable roughly by the cartoon silhouettes. Links are directed from prey to predators [37].

The message here for the TOC problem is simple. The natural world, particularly species in ecosystems, is a densely connected one, consisting of predator–prey, reproductive, symbiotic and other types of interactions and dependencies. The human world is transitioning very quickly to a densely connected one because of population growth and the increasing use of connected natural resources. At low human population densities, the interactions between different groups of users exploiting different resources, as commons or not, are likely to have little effect on each other. As populations grow, however, and the human economy diversifies with much the same effect as niche diversification among wild species, the probability that separate groups of users will interact indirectly via the ecosystem network increases. Therefore, solving TOC problems by limiting the number of users in a group, when the overall population is growing as rapidly as the human population currently is, amounts to local delay tactics and not global solutions. This is evident in fisheries, where even self-managed, cooperative fisheries will not escape the cascading effects of the ongoing loss of large and high trophic level species throughout the world’s oceans, nor the impacts of global warming, itself a TOC problem, notably rising seawater temperatures and ocean acidification. Moreover, as we degrade ecosystems and reduce the number of profitable commons, our network of economic interactions may converge to the unbalanced and vulnerable paleoecosystems described above.
5. Mutualism
The final section of this paper explores, in contrast to analogous problems in nature, a possible solution. A mutualism is an interspecific partnership, typically between two species [41], where each species performs a service to the benefit of the other. Well-known examples are: the symbiosis between many corals and single-celled photosynthesizers, where the coral provides raw nutrients (obtained by carnivory) to the algae in return for synthesized sugars; and certain species of ants and acacia trees, where the ants actively defend the trees from browsers and the trees yield sugary, fatty and proteinaceous exudates to the ants. The TOC solution that I propose here is not precisely like those found in nature, but instead one where users of a commons maintain a second and at least equally important common interest, performing a mutual service and sharing a mutual benefit that tempers their competition for the commons. For example, suppose that in addition to farming their goats in the meadow our herdsmen also rely on each other for mutual defense. Given the proper socio-political and/or cultural relationships, it is reasonable to suppose that when their security is threatened, the herdsmen band together. It therefore behooves each herdsman to maintain a healthy flock of herdsmen!
Generalizing, we state that when a user i imposes a cost on other users of the commons because of its utilization, the cost is ultimately fed back to i because of a consequent decline of another mutually held interest. In the above example, bringing ruin to one’s fellow herdsmen compromises one’s own security. The goal of this section is to develop a model that captures a solution to this problem while at the same time avoiding a TOC. The argument will be pursued as an extension of the discrete models presented earlier, with full awareness that alternative development is available using game theory. The former approach is favoured here both to maintain consistency with the earlier models, and in recognition that the model assumes that cooperation among users already exists.
Let the mutualism be represented as a function of each user’s utilization of the commons, . In other words, performance as a mutual partner is dependent on the benefits gained from exploitation of the commons. Realistically, other aspects of a user’s economy, such as alternative sources of income, would have to be included, but the situation is simplified here by referring solely to the value of the commons. The model must also necessarily be algorithmic, because during each time interval each user must answer the following question: If i increased its utilization over the preceding two intervals, and k incurred a cost as a result, i.e., its benefits declined, then should i reduce its current utilization? That would ensure k’s continuation and capability as a partner in the mutualism because of its replenished benefits. Therefore, if and , then i must decrease its per capita utilization. The manner or extent to which this is done is based upon agreement among the partners. It is implemented here in the Ricker-based discrete model by having i decelerate the rate at which its utilization grows, that is decrease its jerk j, as
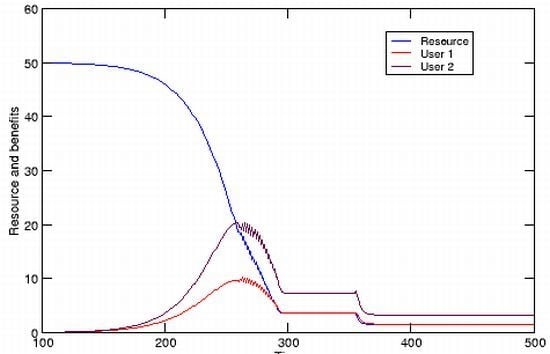
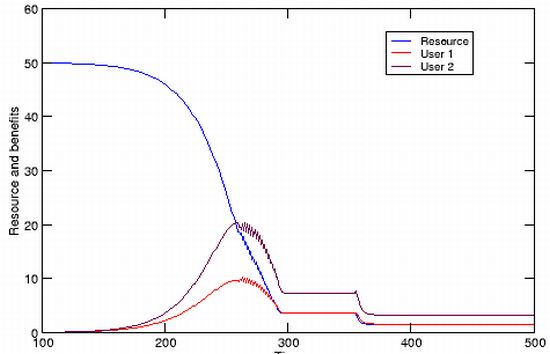
The acceleration of i’s utilization rate is reduced according to k’s decreased benefits, otherwise i maintains its current growth rates. Alternatively, if k experiences no reduction in benefits, i could revert to its original, and almost assuredly greater acceleration of utilization rate. All the above also hold true for k, who must reciprocate in the mutualism. Simulation results are illustrated in Figure 7, where it is shown that exploitation of R is now sustained by the mutualistic relationship under both conditions, though it is more beneficial for both partners to never revert to greater accelerations of utilization rate. In both scenarios, equilibrium is attained among the resource and users when utilization rate is no longer accelerated (). The TOC has been avoided.
The overall effect of the mutualism is similar to that yielded by implementation of a strategy for managing exploitation of R, but there is a subtle and important difference: limitation of a user’s utilization is neither imposed by a governing body or strategy, nor is it done solely in the interest of maintaining the resource for a user’s benefit. Instead, limits are imposed in the interest of maintaining benefits to other users so that they continue to serve as effective partners in another mutual interest. The arrangement is extended easily to groups of users who either belong to different communities, or who utilize a commons for different purposes.
An equivalent situation in nature would be species of carnivores that monitored the demographics of other carnivorous species and moderated their own consumption to benefit the other species. No such situations exist, however, in the evolutionary world of competitive interspecific interactions. Human communities, in contrast, do engage in mutualistic arrangements when agreements or treaties ensure fair access to resources in order to maintain peaceful relations. It is a model whose use must be increased because human population growth, the diversification and multiplication of exploited resources and the myriad connections among those resources, are most likely pushing the human-ecosystem relationship toward the unbalanced, mass extinction aftermath ecosystem model. Continued and extensive coupling of competitively exploited resources to mutual interests such as peace, clean air and water, and a stabilized climate would forestall such system-wide effects.
6. Discussion
Hardin’s tragedy of the commons is a powerful and compelling argument that has nevertheless proved controversial. Some of the controversy stemmed from Hardin’s failure to be explicit in parts of his original arguments, notably that the commons in question are unmanaged [42], and that there are two paths to tragedy: population growth and increased rates of resource consumption. Also controversial were his suggestions that successful management must rely on coercive or top-down implemented control, a suggestion apparently at odds with the subsequent discovery of numerous self- or cooperatively-managed groups. The current paper highlights vagueness in other aspects of the argument, namely why users should be compelled to increase their utilization of a resource, and exactly how the cost to users is measured when there is yet room for increased utilization. These questions and arguments are not restricted to the realm of human interactions and economies, but are also relevant in the world of natural economies. The intent of this paper was to explore the differences and similarities between the two types of economy in areas relevant to the tragedy of the commons. The approach has been to express Hardin’s argument in terms of a mathematical model, beginning with the basic ecological models of population growth and predator–prey interactions.
The resulting TOC models differ from the ecological ones primarily because humans exploiting a commons are not necessarily subject to the inhibitory negative feedback of a declining resource in the ways that wild consumer species are. Given any situation in which the number of human users, or their rates of consumption are increasing, a TOC becomes an inevitability because humans will often exploit a resource exhaustively. The detrimental effect of resource exhaustion on the group depends on many extraneous factors, such as the economic diversity of the group, the existence of alternative resources, whether banking or conversion to other resources of the benefits of exploitation were possible, and the ability of the group to predict the detrimental outcome of its actions. Hardin argued that a burgeoning human population, certainly a problem on the minds of ecologists by the 1960s, implied that tragedies would become more commonplace unless effective management strategies and restrictions were put in place. Demonstrations that groups of humans can effectively avoid TOC on local scales using cooperative strategies do not nullify Hardin’s main argument, because the overall human population continues to grow. It will, by 2050, be triple what it was when Hardin wrote his paper. The problem is that many management strategies rely upon control of the number of users of a commons. If in the process other potential users are excluded from a particular commons, or increasing numbers of users or rates of consumption lead to a tragedy, one option is to simply exploit another resource. This outcome is perhaps nowhere more evident than in oceanic fisheries, where the number of species exploited commercially grew tremendously during the 20th century primarily in response to the declining availability and profitability of formerly profitable species [19]. The growing population demands an ever increasing level of resources that can hardly be met by a fixed number of commons. The diversification of commons and resources, unlike the exploitation of single commons, both resembles natural ecosystems, and inadvertently taps into the connectivity of natural ecosystems via the interactions among natural resources.
An ecosystem comprises multiple species all engaged either in synthesizing resources (producers) or consuming them. The variety of ways in which consumers divide up resources is the result of evolution, whereby niches are diversified, sometimes reducing interspecific competition. The networks of interactions, or biological communities, which emerge reflect two processes. First, selection acting on a species, i.e., its evolution, is the best guarantee of its adaptation and survival in the environment, ensuring that a sufficient number of its members can acquire sufficient resources as individuals and thereby perpetuate the species. Second, the network of interactions of independently acting species is itself subject to selection of a sort on longer geological timescales. Geophysical events whether of terrestrial or extraterrestrial origin test the robustness of those networks. There is evidence to suggest that sometimes, in spite of the obvious evolutionary success of individual species, the systems that they produce collectively are not robust [26]. The most dramatic examples known to date are the result of increasingly dense indirect interactions among consumers via their resources. In one instance, the south African community after the End Permian mass extinction, evolutionary recovery of consumer species far exceeded that of their producer prey leading to a convergence of multiple resource-consumer relationships. In the second, the late Cretaceous terrestrial communities, evolutionary diversification of producers, and their interactions with consumers, led again to a convergence of multiple separate resource-consumer relationships. The growing human population, increasing rates of consumption, the ongoing exhaustion of numerous natural resources, and the increasing connectance of human populations and economies are collectively directing the network of human economic activities toward that type of system-level tragedy of the commons.
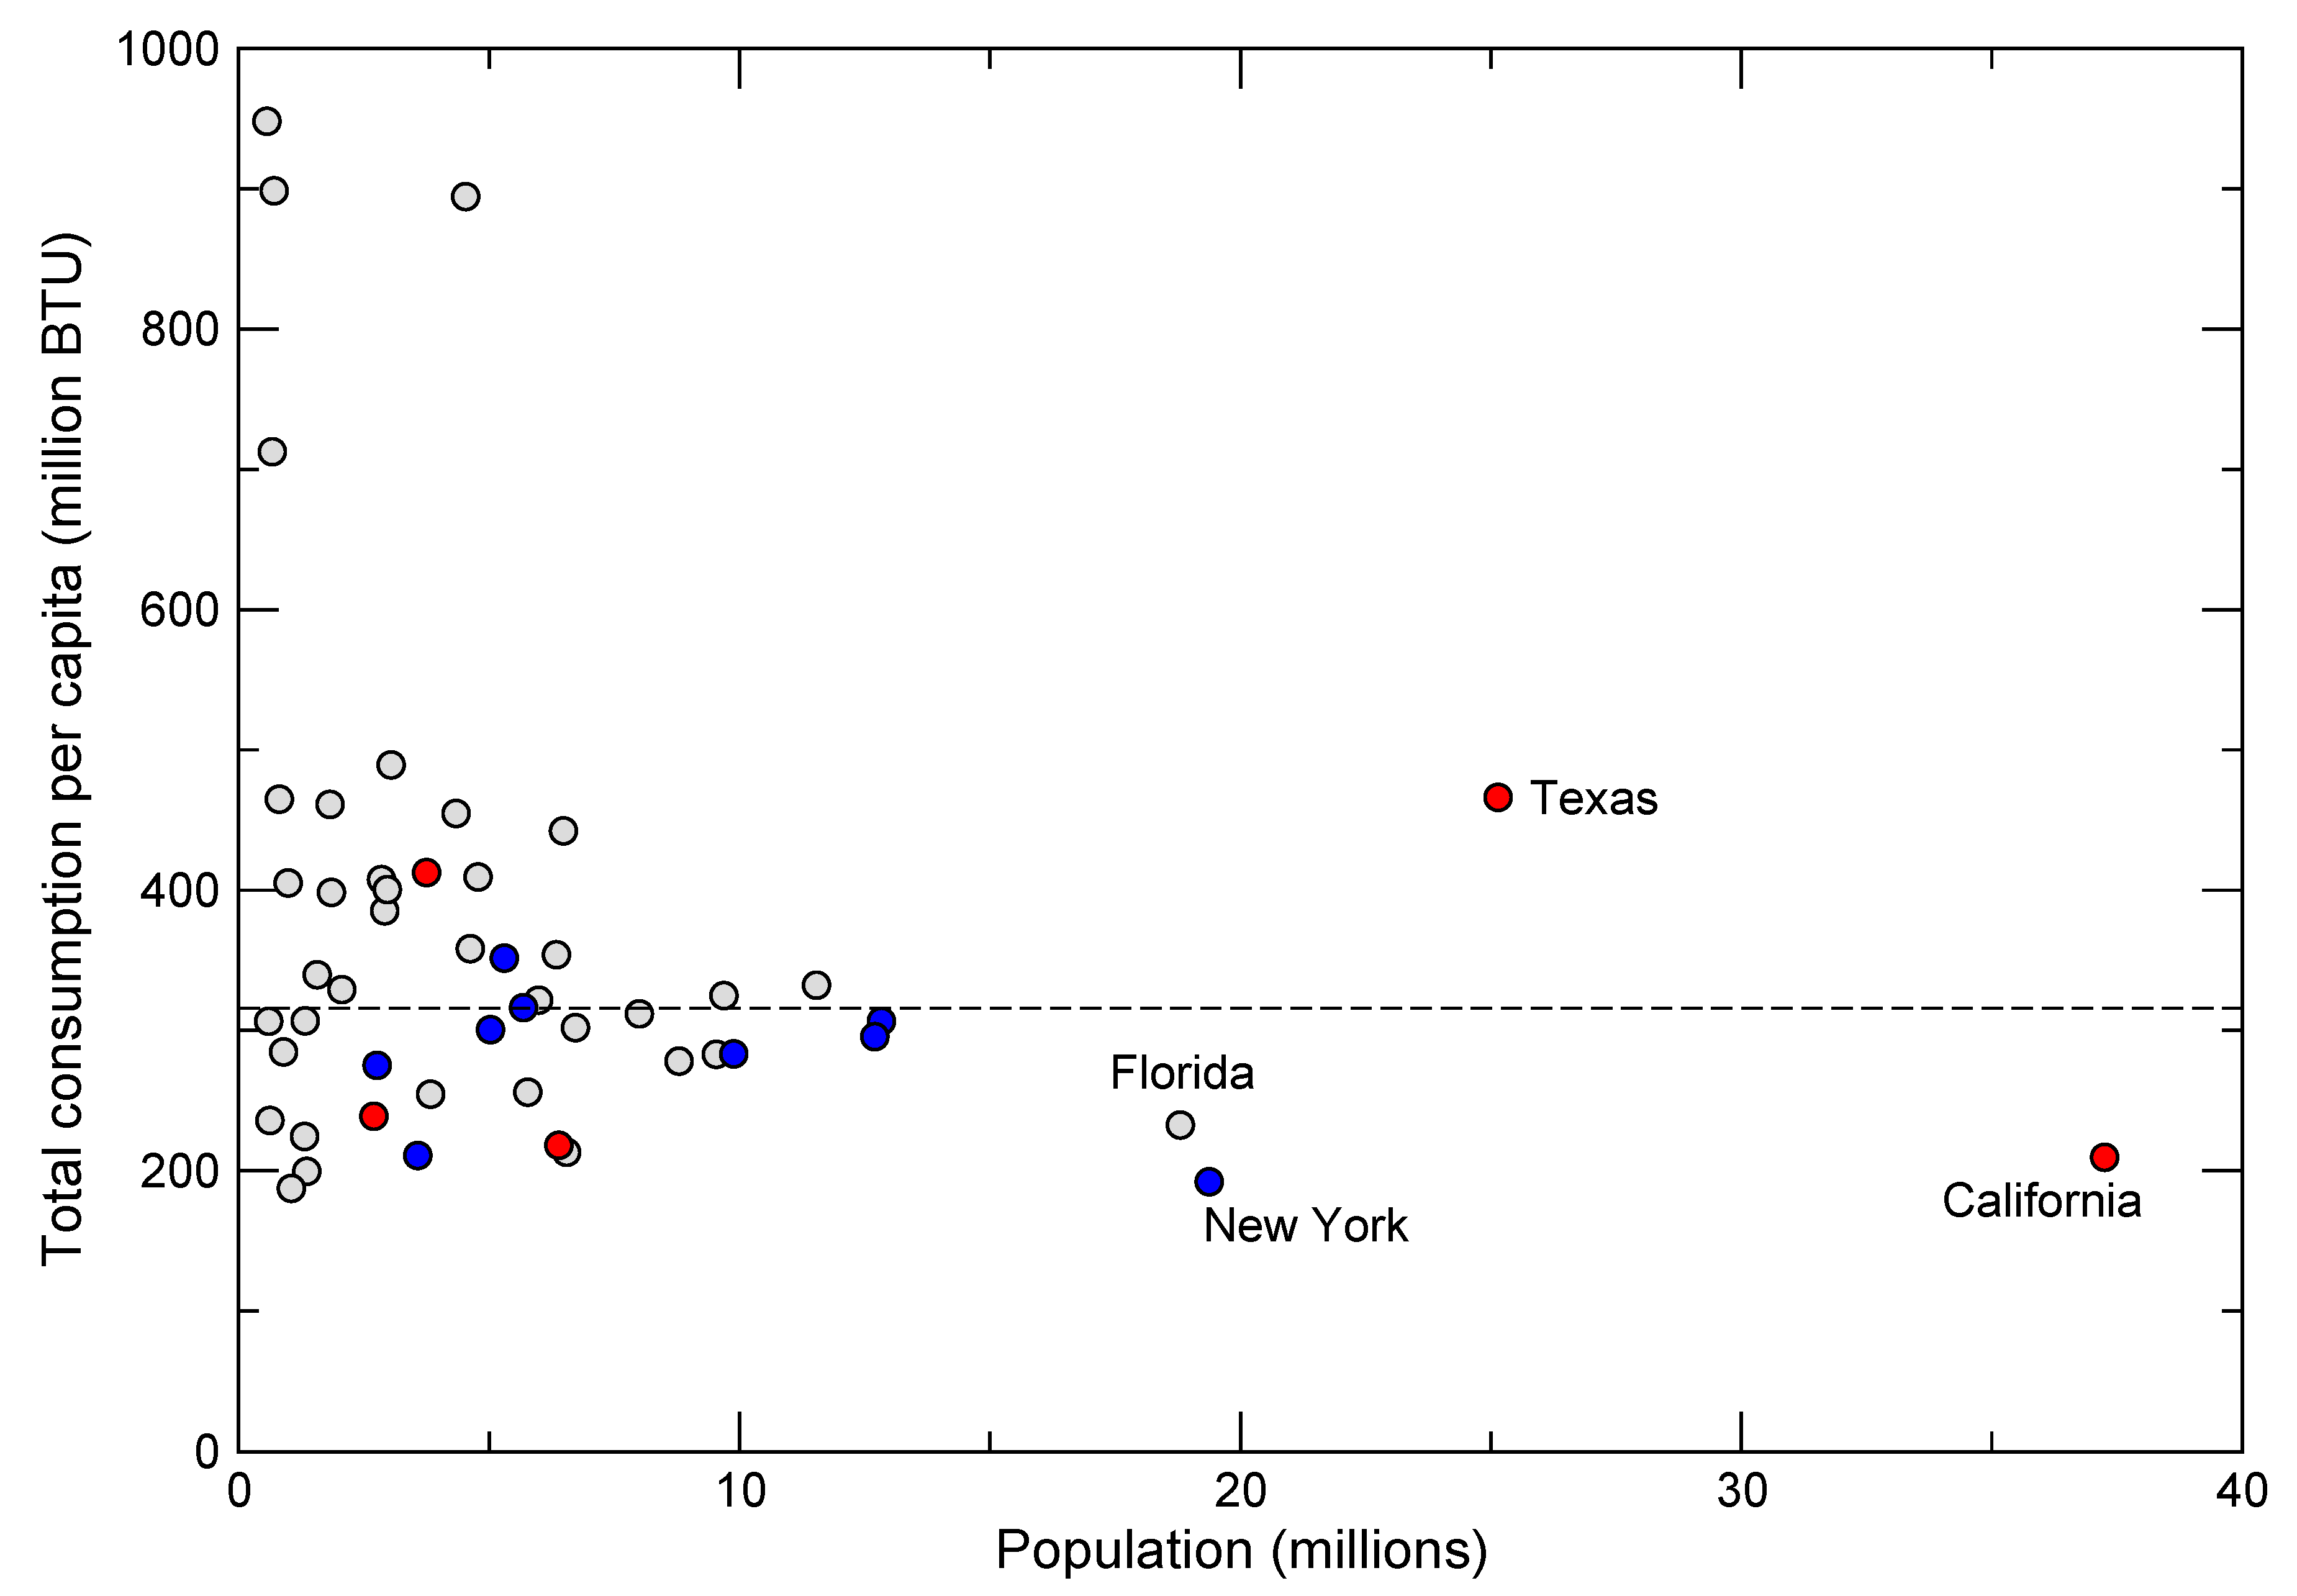
Many of the ways in which the problem can be addressed are somewhat evident and already being applied. They include slowing population growth, reducing rates of consumption, increasing efforts of sustainable use where possible, managing the commons, and reducing human-caused perturbations to natural and human systems [43]. Rates of population growth have already slowed in many nations, seemingly in response to economic development, education, security, women’s access to birth control and the extension of equal rights to women. Unfortunately, while some developed countries are projected to fall off the list of the world’s top ten most populous nations by 2050, such as Russia and Japan, they will be replaced by developing nations such as the Philippines and the Democratic Republic of Congo [20]. Reducing rates of consumption presents a somewhat more hopeful picture because high rates are not correlated solely with population size, but also reflect factors such as the extent of urbanization, quality of infrastructure, types of transportation and lifestyle choices. For example, within the United States, which has the highest per capita energy consumption in the world, there is great disparity among states that cannot be explained by population size or differences in climate alone (Figure 8).
Perhaps the most pervasive drivers toward a system-wide tragedy are human activities whose impacts cut across the boundaries of separate resource consumption systems. Hardin discussed pollution, the activity with the greatest level of awareness in the 1960s, thanks in large part to scientists such as Rachel Carson. To that list should be added habitat alteration and destruction, invasive species, and anthropogenically driven global warming. All those activities affect multiple systems, resources and populations. They simultaneously reduce the options available for human activity, thereby rendering strategies such as N-limitation less feasible, perturb multiple components within the broader human system, and perhaps increase the difficulties of multinational decision-making and consensus [44]. For example, the massive greenhouse emissions by two of the world’s most populous nations, China and the United States, are major contributions to global warming that threaten coastal populations with sea level rise, fisheries because of warming and acidifying waters, and tourism of tropical coral reefs for the same reasons. The increased connectance of human systems also points, however, to mutual dependencies that do not necessarily consist of natural resources.
The mutualism model presented above could be interpreted verbally as a means of inverting a tragedy of the commons: incurring a small cost in the interest of a partner maintains benefits for all. Furthermore, the cost that is incurred is favourable to the paying partner in the sense that it is proportional to both the level of the payer’s utilization and the payee’s. If the levels of utilization are unequal, say we are comparing a major greenhouse emitter such as the United States to a minor one, the United States need incur a very small cost in order to maintain whatever benefit is of concern to the minor partner because the latter’s utilization is small. Conversely, the minor partner will also incur a very small cost in order to maintain the benefits of the United States because its impact on the resource (commons) is small to begin with! The total cost to the United States of course, when summed over all partners, is not insubstantial, as made clear by the recent climate change meeting in Doha. But neither are the benefits gained from the activities responsible for the major emissions. It is impossible to say at this point whether models of this sort could be extended in any way to be realistically useful, but they do nevertheless convey a useful message: Realizing the utility of mutualistic relationships to solutions of converging resource-consumption issues requires an adjustment of how those issues are thought of. The exploitation of commons and other types of resources are becoming increasingly more dependent on each other, and independent solutions to individual problems will become increasingly less feasible. Mutual interests are consequently becoming more important and valuable, as should their prominence in solving our problems of resources and commons.
Notes added in proofs
I added a sentence to the Acknowledgements to recognize and thank the reviewers.
Acknowledgements
I thank K. Angielczyk for endless conversations. J. Mitchell and K. Angielczyk kindly agreed to the use of Figure 5C. Tang pointed me toward many useful resources. I also thank E. Leigh and an anonymous reviewer for insightful comments.
References
- Hardi, G. The Tragedy of the Commons. Science 1968, 162, 1243–1248. [Google Scholar] [CrossRef] [PubMed]
- Dietz, T.; Dolsak, N.; Ostrom, E.; Stern, P. The drama of the commons. In The Drama of the Commons; Ostrom, E., Dietz, T., Dolsak, N., Stern, P., Stonich, S., Weber, E.U., Eds.; National Academies Press: Washington, DC, USA, 2002; pp. 3–36. [Google Scholar]
- Leal, D.R. Avoiding the “Tragedy of the Commons”. Technical Report 652; Property & Environment Research Center: Bozeman, MT, USA, 1996. [Google Scholar]
- Vermeij, G.J. Nature. An economic history; Princeton University Press: Princeton, NJ, USA, 2004; p. 445. [Google Scholar]
- Epstein, J.M. Why Model? J. Artificial Societies Social Simulation 2008, 11, 12. [Google Scholar]
- Lotka, A.J. Analytical Note on Certain Rhythmic Relations in Organic Systems. Proc. Natl. Acad. Sci. USA 1920, 6, 410–415. [Google Scholar] [CrossRef] [PubMed]
- Volterra, V. Fluctuations in the Abundance of a Species Considered Mathematically. Nature 1926, 118, 558–560. [Google Scholar] [CrossRef]
- May, R. Stability and Complexity in Model Ecosystems, 2. ed.; Number 6 in Monographs in population biology, Princeton University Press: Princeton, NJ, USA, 1973. [Google Scholar]
- Arditi, R.; Ginzburg, L. How species interact. Altering the Standard View of Trophic ecology; Oxford University Press: New York, NY, USA, 2012; p. 170. [Google Scholar]
- Rosenzweig, M.L.; MacArthur, R.H. Graphical representation and stability conditions of predator-prey interactions. Am. Nat. 1963, 97, 209–223. [Google Scholar] [CrossRef]
- Rosenzweig, M.L. Aspects of biological exploitation. Q. Rev. Biol. 1977, 52, 371–380. [Google Scholar] [CrossRef]
- MacArthur, R. Fluctuations of Animal Populations and a Measure of Community Stability. Ecology 1955, 36, 533–536. [Google Scholar] [CrossRef]
- Ricker, W.E. Fishery Science. Ecology 1954, 35, 104. [Google Scholar] [CrossRef]
- May, R.M. Simple mathematical models with very complicated dynamics. Nature 1976, 261, 459–467. [Google Scholar] [CrossRef]
- Wilson, J. Scientific uncertainty, complex systems, and the design of common-pool institutions. In The Drama of the Commons; Ostrom, E., Dietz, T., Dolsak, N., Stern, P., Stonich, S., Weber, E.U., Eds.; National Academies Press: Washington, DC, USA, 2002; pp. 327–360. [Google Scholar]
- Richerson, P.J.; Boyd, R.; Paciotti, B. An evolutionary theory of commons management. In The Drama of the Commons; Ostrom, E., Dietz, T., Dolsak, N., Stern, P., Stonich, S., Weber, E.U., Eds.; National Academies Press: Washington, DC, USA, 2002; pp. 403–442. [Google Scholar]
- Burger, J.R.; Allen, C.D.; Brown, J.H.; Burnside, W.R.; Davidson, A.D.; Fristoe, T.S.; Hamilton, M.J.; Mercado-Silva, N.; Nekola, J.C.; Okie, J.G.; Zuo, W. The Macroecology of Sustainability. PLoS Biol. 2012, 10, e1001345. [Google Scholar] [CrossRef] [PubMed]
- Mace, G.M. The Limits to Sustainability Science: Ecological Constraints or Endless Innovation? PLoS Biol. 2012, 10, e1001343. [Google Scholar] [CrossRef]
- Pauly, D.; Christensen, V.; Dalsgaard, J.; Rainer, F.; Torres, F, Jr. Fishing Down Marine Food Webs. Science 1998, 279, 860–863. [Google Scholar] [CrossRef] [PubMed]
- United Nations Department of Economic and Social Affairs Population Divison. World Population Prospects: The 2010 Revision, Volume I: Comprehensive Tables. ST/ESA/SER.A/313.. United Nations: New York, NY, USA, 2011.
- Vermeij, G.J. From phenomenology to first principles: Toward a theory of diversity. Proc. Calif. Acad. Sci. 2005, 56, 12–23. [Google Scholar]
- Smith, A. The Wealth of Nations. The Glasgow edition of the Works and Correspondence of Adam Smith; Oxford University Press: New York, NY, USA, 1976. [Google Scholar]
- Vermeij, G.J.; Leigh, E. Natural and human economies compared. Ecosphere 2011, 2, 1–16. [Google Scholar] [CrossRef]
- Wardle, D.A.; Walker, L.R.; Bardgett, R.D. Ecosystem properties and forest decline in contrasting long-term chronosequences. Science 2004, 305, 509–513. [Google Scholar] [CrossRef]
- Barnosky, A.D. Megafauna biomass tradeoff as a driver of Quaternary and future extinctions. Proc. Natl. Acad. Sci. USA 2008, 105, 11543–11548. [Google Scholar] [CrossRef]
- Roopnarine, P.D.; Angielczyk, K.D. The evolutionary palaeoecology of species and the tragedy of the commons. Biol. Lett. 2012, 8, 147–50. [Google Scholar] [CrossRef]
- Roopnarine, P.D.; Hertog, R. Detailed Food Web Networks of Three Greater Antillean Coral Reef Systems: The Cayman Islands, Cuba, and Jamaica. Dataset Papers in Ecology 2012, 2013, 9p. [Google Scholar] [CrossRef]
- Dunne, J.A.; Williams, R.J.; Martinez, N.D. Food-web structure and network theory: The role of connectance and size. Proc. Natl. Acad. Sci. USA 2002, 99, 12917–12922. [Google Scholar] [CrossRef]
- Roopnarine, P.D. Networks, extinction and paleocommunity food webs. In Quantitative Methods in Paleobiology; Alroy, J., Hunt, G., Eds.; Paleontological Society, Yale Printing Service: New Haven, CT, USA, 2010; pp. 143–161. [Google Scholar]
- Barabási, A.L.; Albert, R.; Jeong, H. Scale-free characteristics of random networks: the topology of the world-wide web. Physica A 2000, 281, 69–77. [Google Scholar] [CrossRef]
- Strogatz, S.H. Exploring complex networks. Nature 2001, 410, 268–276. [Google Scholar] [CrossRef]
- Barabasi, A.L.; Jeong, H.; Neda, Z.; Ravasz, E.; Schubert, A.; Vicsek, T. Evolution of the social network of scientific collaborations. Physica A 2002, 311, 590–614. [Google Scholar] [CrossRef]
- West, B.J.; Grigolini, P. Complex Webs: Anticipating the Improbable; Cambridge University Press: New York, NY, USA, 2011. [Google Scholar]
- Roopnarine, P.D.; Angielczyk, K.D.; Wang, S.C.; Hertog, R. Trophic network models explain instability of Early Triassic terrestrial communities. Proc. Roy. Soc. B 2007, 274, 2077–2086. [Google Scholar] [CrossRef]
- Roopnarine, P.D. Ecological modeling of paleocommunity food webs. In Conservation Paleobiology; Dietl, G.D., Flessa, K., Eds.; Paleontological Society, Yale Printing Service: New Haven, CT, USA, 2010; pp. 195–220. [Google Scholar]
- Roopnarine, P.D. Red queen for a day: models of symmetry and selection in paleoecology. Evolutionary Ecology 2012, 26, 1–10. [Google Scholar] [CrossRef]
- Mitchell, J.S.; Roopnarine, P.D.; Angielczyk, K.D. Late Cretaceous restructuring of terrestrial communities facilitated the end-Cretaceous mass extinction in North America. Proc. Natl. Acad. Sci. USA 2012, 109, 18857–18861. [Google Scholar] [CrossRef] [PubMed]
- Schulte, P.; Alegret, L.; Arenillas, I.; Arz, J.A.; Barton, P.J.; Bown, P.R.; Bralower, T.J.; Christeson, G.L.; Claeys, P.; Cockell, C.S.; et al. The Chicxulub Asteroid Impact and Mass Extinction at the Cretaceous-Paleogene Boundary. Science 2010, 327, 1214–1218. [Google Scholar] [CrossRef]
- Galfetti, T.; Bucher, H.; Brayard, A.; Hochuli, P.A.; Weissert, H.; Guodun, K.; Atudorei, V.; Guex, J. Late Early Triassic climate change: Insights from carbonate carbon isotopes, sedimentary evolution and ammonoid paleobiogeography. Palaeogeogr. Palaeocl. 2007, 243, 394–411. [Google Scholar] [CrossRef]
- Irmis, R.B.; Whiteside, J.H. Delayed recovery of non-marine tetrapods after the end-Permian mass extinction tracks global carbon cycle. Proc. Roy. Soc. B 2011. [Google Scholar] [CrossRef]
- Leigh, E.G. The evolution of mutualism. J. Evolution. Biol. 2010, 23, 2507–2528. [Google Scholar] [CrossRef] [PubMed]
- Hardin, G. The tragedy of the unmanaged commons. TREE 1994, 9, 199. [Google Scholar] [CrossRef]
- Barnosky, A.D.; Hadly, E.A.; Bascompte, J.; Berlow, E.L.; Brown, J.H.; Fortelius, M.; Getz, W.M.; Harte, J.; Hastings, A.; Marquet, P.A.; et al. Approaching a state shift in Earth’s biosphere. Nature 2012, 486, 52–58. [Google Scholar] [CrossRef] [PubMed]
- Shah, A.K.; Mullainathan, S.; Shafir, E. Some consequences of having too little. Science 2012, 338, 682–685. [Google Scholar] [CrossRef] [PubMed]
Figure 1.
Population dynamics of natural and human resource–consumer relationships. (A) Logistic growth of a natural, renewable biological resource. Parameters for this simulation: , . The simulation was run for 15 generations. (B) Equivalent Ricker model of system shown in (A). (C) Comparison of resource (R, blue) and utilization benefits (B, red). Two users with equal rates of utilization () and acceleration of utilization () begin to use the resource at time . Benefits gained per unit time are shown in red, peaking at , and declining thereafter. The resource begins to decline at , immediately upon the initiation of utilization. (D) Comparison of production of new resource (blue) and rate of utilization (red). Resource production increases as utilization does because of the resource’s decline below carrying capacity K.

Figure 2.
Repetition of the simulation illustrated in Figure 1, but here users increase their rates of utilization in order to maintain benefits as the level of the resource decline. The result is an acceleration of the rate at which benefits actually decline (benefits from simulation in Figure 1 shown as dotted line). Blue - resource; red - benefits. , the rate at which utilization is accelerated, is shown in green. Its nonlinearity and rapid increase reflect the increase in effort to maintain benefits as the resource declines.

Figure 3.
Resource level (blue) and total benefit (red) when resource is a managed commons, that is, resource utilization is limited. Parameters are the same as in Figure 1, with new parameter .
Figure 3.
Resource level (blue) and total benefit (red) when resource is a managed commons, that is, resource utilization is limited. Parameters are the same as in Figure 1, with new parameter .

Figure 4.
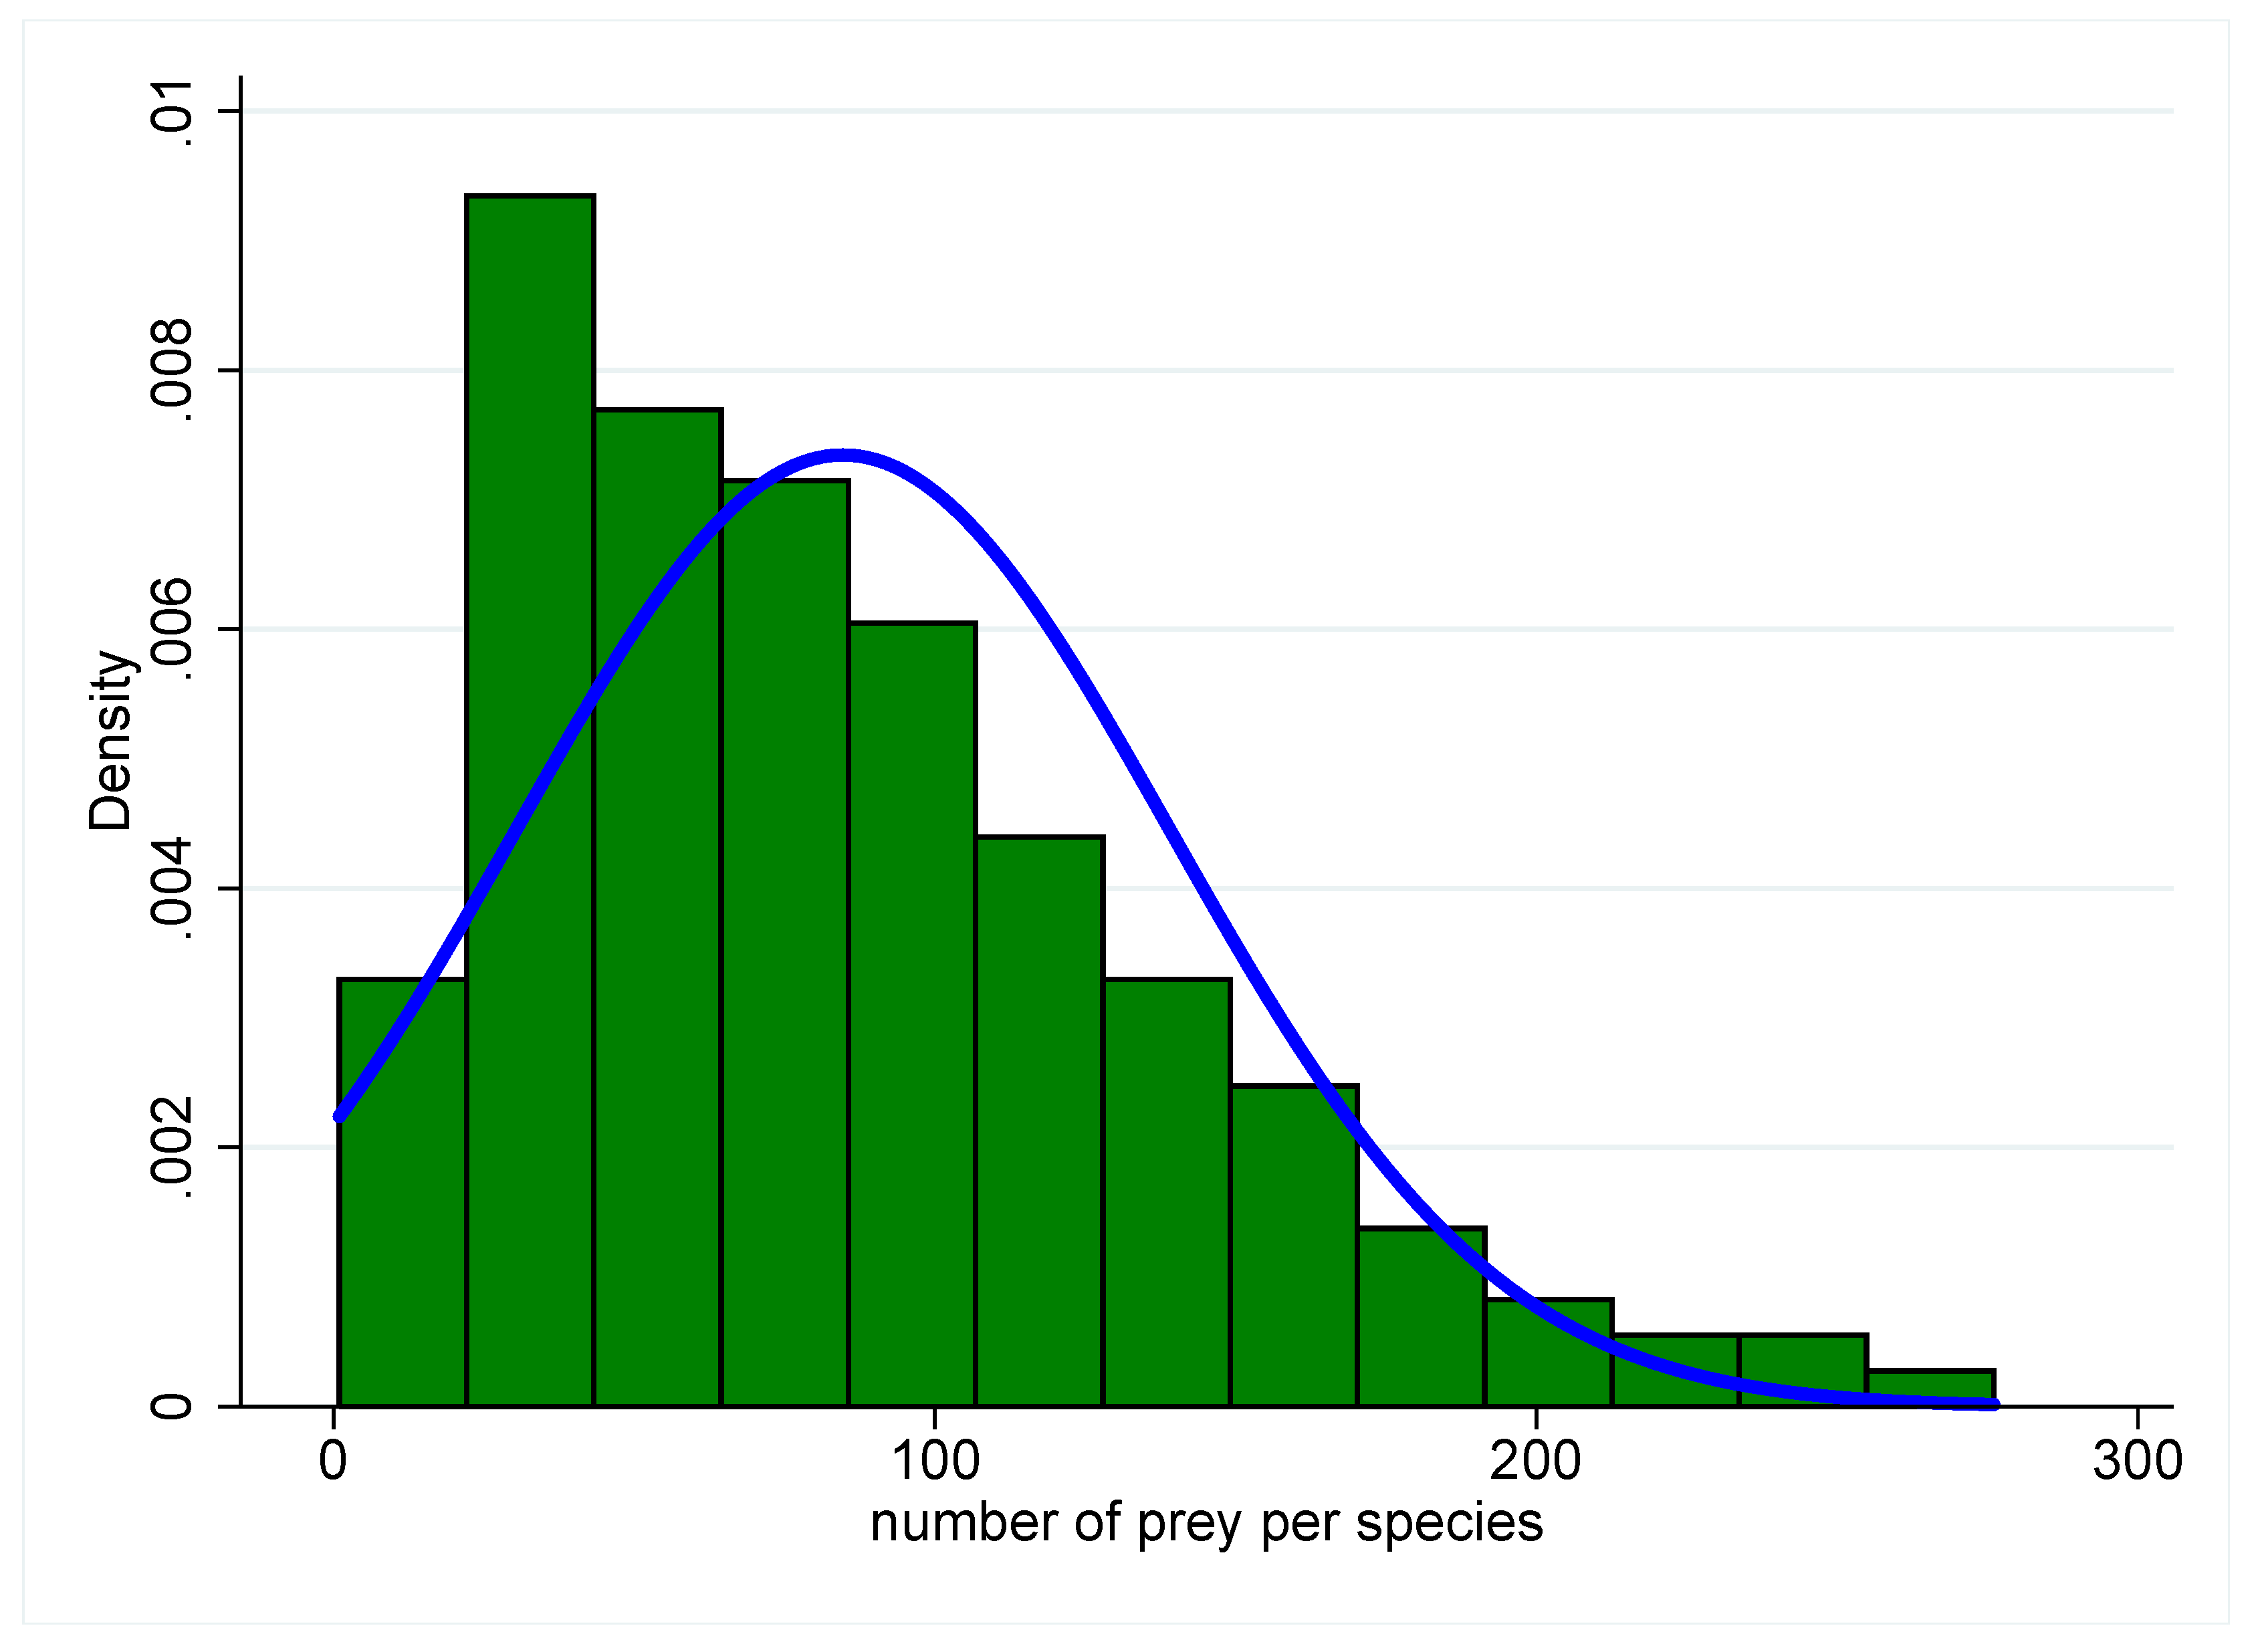
Consumer in-degree distribution of vertebrates in a Cuban coral reef community. The x-axis shows the number of prey species per consumer (in-degree), with the density or relative frequency measured on the y-axis. The distribution is distinctly non-normal, with most species having fewer prey than the distribution’s mean (35). The distribution is also very long-tailed, however, with several species having numbers of prey far greater than the mean. The expected Gaussian distribution given the observed mean and variance is overlaid in blue [27].
Figure 4.
Consumer in-degree distribution of vertebrates in a Cuban coral reef community. The x-axis shows the number of prey species per consumer (in-degree), with the density or relative frequency measured on the y-axis. The distribution is distinctly non-normal, with most species having fewer prey than the distribution’s mean (35). The distribution is also very long-tailed, however, with several species having numbers of prey far greater than the mean. The expected Gaussian distribution given the observed mean and variance is overlaid in blue [27].

Figure 6.
Simulated perturbations of model communities representing the late Permian Dicynodon Assemblage Zone (DAZ) and earliest Triassic Lystrosaurus Assemblage Zone (LAZ) ecosystems of the Karoo Basin, South Africa. The magnitude of perturbation (x-axis) is the amount of photosynthetic energy removed from the system per simulation. The level of secondary extinction (y-axis) is the fraction of the community that becomes extinct as a consequence of the perturbation. One hundred model networks were simulated and perturbed, and results for each network at each level of perturbation are shown as individual circles on each plot. The robust, pre-extinction DAZ ecosystem is plotted on the left (blue), while the highly variable, aftermath LAZ community is plotted on the right (red) [26,34,36].

Figure 7.
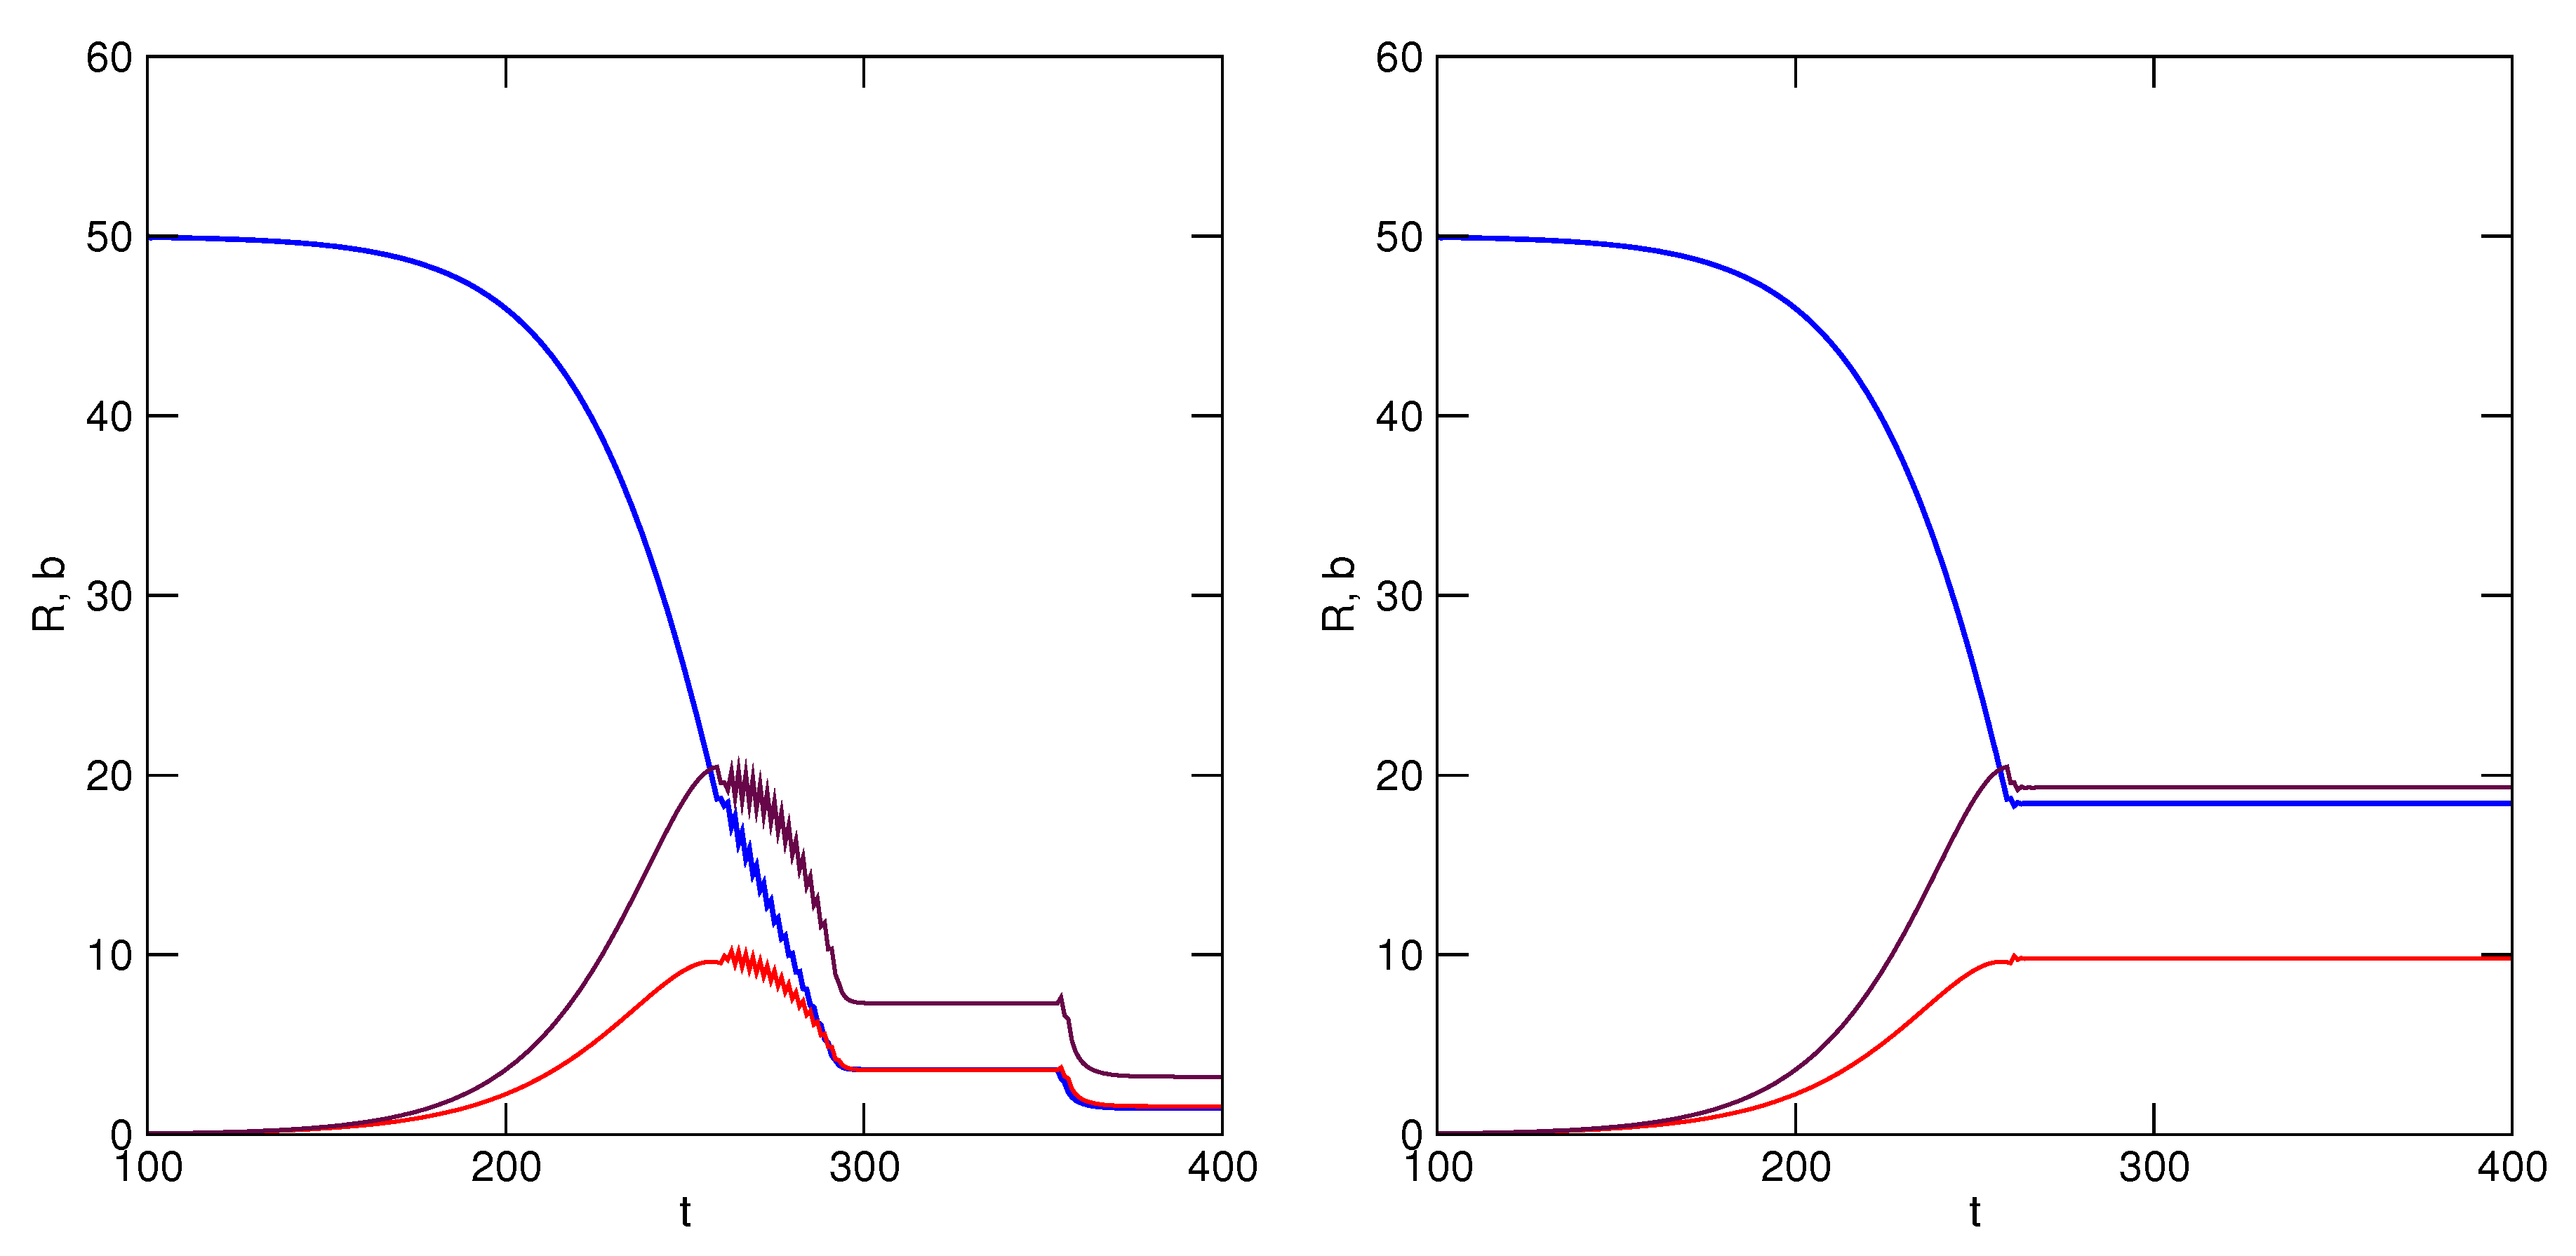
Mutualism solution to a tragedy of the commons. Simulation parameters are as in Figure 1 and Figure 2, but users now control their utilization according to the consequential costs to other users. Unlike previous simulations, two users now differ in their utilization rates. Red and maroon lines are user benefits: red, ; maroon, . Blue indicates resource level. In the simulation shown on the left, users maintain a reduced rate of utilization after modification, whereas on the right users will revert to original rates of acceleration if benefits increase or remain steady.
Figure 7.
Mutualism solution to a tragedy of the commons. Simulation parameters are as in Figure 1 and Figure 2, but users now control their utilization according to the consequential costs to other users. Unlike previous simulations, two users now differ in their utilization rates. Red and maroon lines are user benefits: red, ; maroon, . Blue indicates resource level. In the simulation shown on the left, users maintain a reduced rate of utilization after modification, whereas on the right users will revert to original rates of acceleration if benefits increase or remain steady.

Figure 8.
Total per capita energy consumption in the United States, by state. Red symbols are states with the 10 hottest cities in the country, and blue symbols have the ten coldest cities (United States Energy Information Administration). Dashed line is the national mean per capita consumption.
Figure 8.
Total per capita energy consumption in the United States, by state. Red symbols are states with the 10 hottest cities in the country, and blue symbols have the ten coldest cities (United States Energy Information Administration). Dashed line is the national mean per capita consumption.

Publisher’s Note: MDPI stays neutral with regard to jurisdictional claims in published maps and institutional affiliations. |
© 2013 by the author; licensee MDPI, Basel, Switzerland. This article is an open access article distributed under the terms and conditions of the Creative Commons Attribution license (http://creativecommons.org/licenses/by/3.0/).
Share and Cite
MDPI and ACS Style
Roopnarine, P. Ecology and the Tragedy of the Commons. Sustainability 2013, 5, 749-773. https://0-doi-org.brum.beds.ac.uk/10.3390/su5020749
AMA Style
Roopnarine P. Ecology and the Tragedy of the Commons. Sustainability. 2013; 5(2):749-773. https://0-doi-org.brum.beds.ac.uk/10.3390/su5020749
Chicago/Turabian StyleRoopnarine, Peter. 2013. "Ecology and the Tragedy of the Commons" Sustainability 5, no. 2: 749-773. https://0-doi-org.brum.beds.ac.uk/10.3390/su5020749