1. Introduction
The current biodiversity crisis [
1] involves not only accelerating rates of species extinction, but also includes intraspecific population losses, fragmentation, isolation, and size reductions [
2]. With such population decline and attenuation of interpopulation gene flow, populations can suffer increased losses of fitness due to elevated inbreeding and reduction of evolutionary potential due to the loss of genetic variation via random genetic drift, both potentially hastening the demise of local stands [
3].
If these anthropogenic trends continue, efforts to sustain species and their population diversity will increasingly include the establishment of
in situ and
ex situ rescue and conservation populations [
4]. The establishment and management of such plant populations can be costly and often involves extensive investments of labor. For example, rescue population establishment includes the collection of appropriate propagules, the preserve restoration sites must be identified, acquired, prepared, and planted, followed by various maintenance, monitoring, manipulation, and harvesting activities [
5]. Thus, there is a need to develop technologies that facilitate the success of such rescue-conservation projects.
There is a sizeable body of literature concerning the population genetics of newly establishing and restoration populations [
3,
4,
5], and numerous computer programs have been developed to model different aspects of developing and standing plant populations (briefly reviewed in [
5]), but NEWGARDEN offers a unique suite of input parameters designed to model newly founded, isolated plant populations. One aspect of plant population restoration that has been little studied is how the number and geometric placement of founders interact to affect the growth and genetic diversity of the ensuing population. Making this issue more complex is the vast range of life history characteristics across plant species (e.g., annuals
versus perennials, gene dispersal distances, mating systems,
etc.). In the establishment of rescue or fragmented populations, it must be questioned whether or not the interactions of varying founder numbers, geometric placements, and life history characteristics are trivial, or if variation in these features can have major consequences as the resultant population develops. For example, suppose only 400 propagules of an endangered species are available. Should they be planted in one clump or in subgroupings? Are some establishment densities or geometric patterns favored over others? Does the spationumeric founding pattern that is optimal for one species also apply to species with different seed or pollen dispersal distances? Can founding patterns be manipulated differently for different species to realize improved population size and genetic diversity maintenance outcomes?
For most endangered species, especially those that are long lived, conducting sufficiently replicated experiments employing contrasting altered patterns of founding to investigate such questions would be cost prohibitive. Another way to explore this issue is through the use of computer modeling. To that end, we have developed a computer program, NEWGARDEN [
5], which allows users to create virtual populations that develop from matings through generations conditioned by initial input specifications regarding the nature and structure of the preserve, founder number, geometric placement, genetic diversity, and life history characteristics. The remainder of this article presents examples of a series of comparative virtual populations generated with NEWGARDEN to demonstrate how the program can be used to explore the complex of issues raised above regarding the founding or fragmentation ofplant populations.
2. Methods
2.1. Overview
NEWGARDEN is designed in such a way that numerous input parameters can be modified to reflect the conditions of different plant restoration projects (see below). The example used here is not meant to model a specific species or restoration situation exhaustively, but rather, to demonstrate how various input conditions can be modified to model plausible alternative comparative situations, thereby providing information that may be of use in planning more efficient restoration projects.
An analysis for a virtual population created using NEWGARDEN begins with the user constructing an input file that lists values for several parameters, including information on the preserve (shape, size, etc.), the founders (number, placement, genetics, age, sex), and life history characteristics of the species (age-specific mortality, age-specific reproduction rates, gene dispersal distances, etc.). One such set of input conditions submitted for NEWGARDEN analysis is called a “trial” The user can designate how many repeated “runs” of these conditions are to be carried out by NEWGARDEN to create replicate populations stemming from the same initial trial input conditions. After all replicate runs of one set of trial conditions have been completed, the results from all of these runs are averaged to give mean values, with standard deviations, for the output statistics outlined below. Thus, output from two different trials that differ as to one or more input characteristics can be statistically compared.
In the trials compared below we investigate the founding of rescue populations (or the initiation of a new population due to the sudden establishment of a newly created fragment) of a short-lived herb-shrub that lives a maximum of three years (biennial to triennial). In the state of Ohio (USA), there are over 20 such species that are rare or endangered [
6]. The central issue investigated is whether the geometric placement of the founders interacts with gene dispersal distances to bring about differences in population growth or changes in population genetics. While some input conditions, as described below more or less in the order in which the parameters appear in the input file, are held constant across all trials, spatial positioning and gene dispersal distances vary among trials. First, we will discuss the arbitrarily selected preserve system used (users may design preserves to their specifications).
2.2. The Preserve System
NEWGARDEN uses positioning of individuals on a grid system (the inhabitable preserve or fragment) where each grid point represents an inhabitable location. Grid point density is meant to represent the average maximum density that two mature individuals of the species can occupy at local carrying capacity. In all of the analyses here, the preserve (
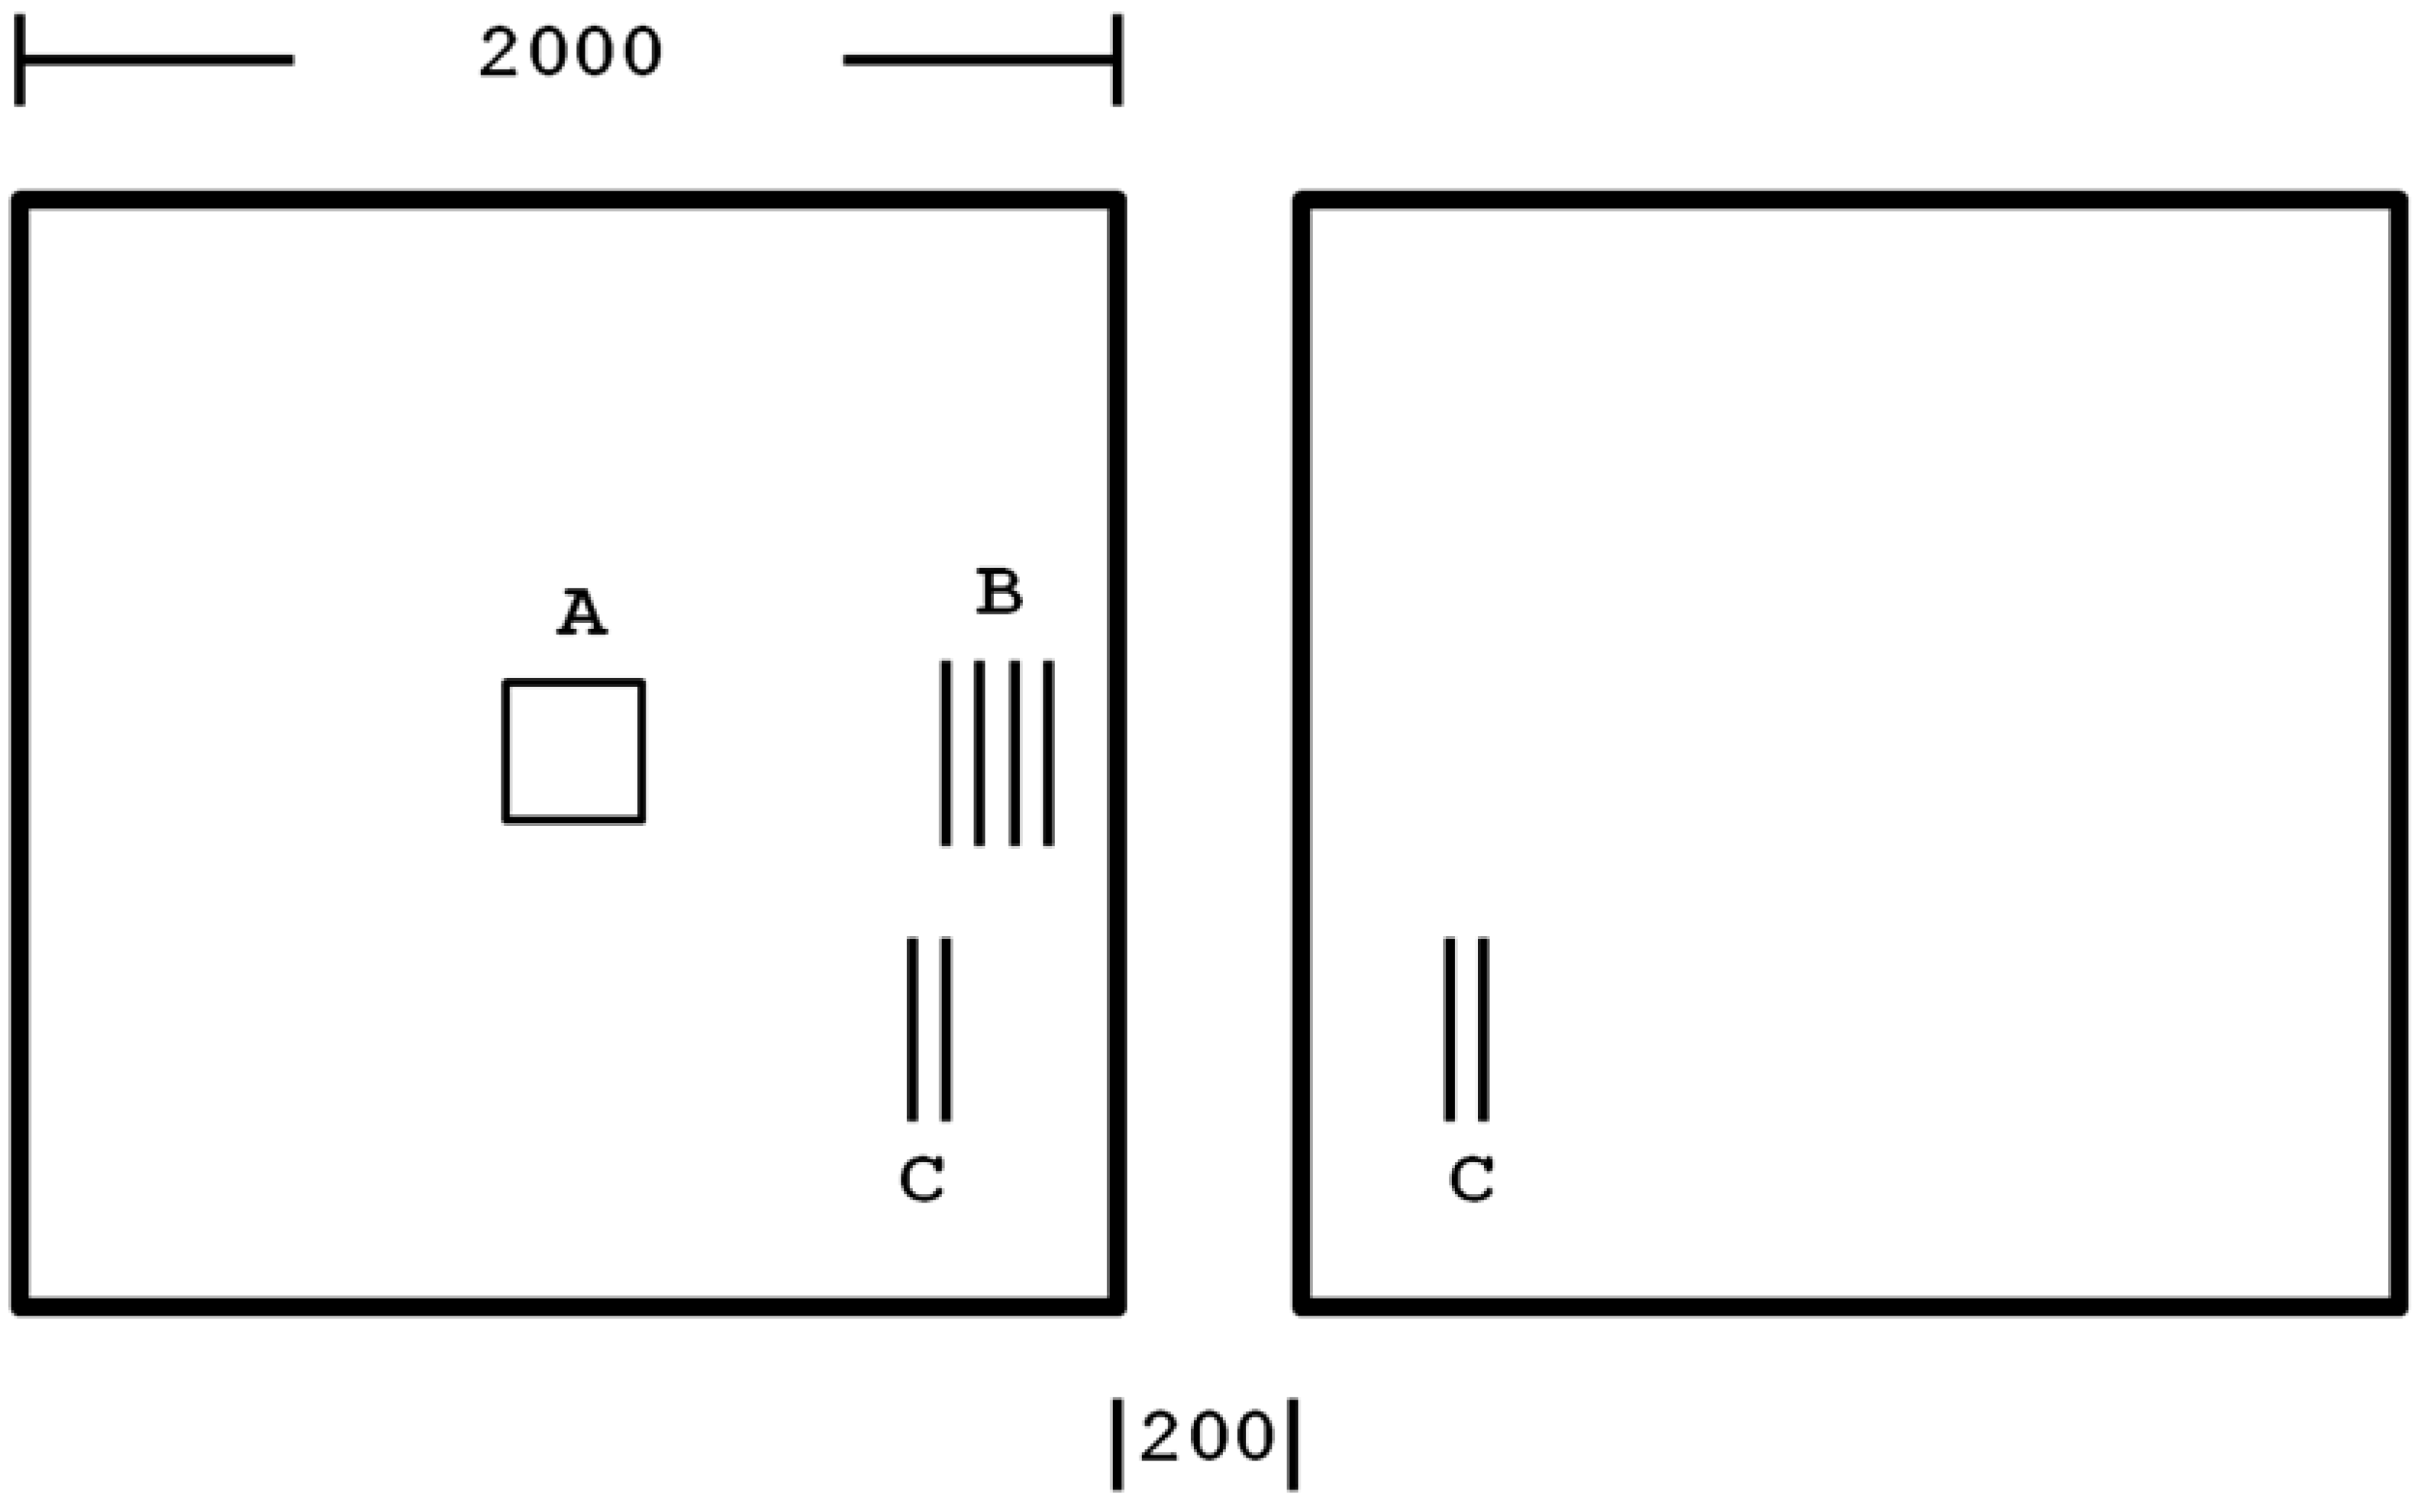
Figure 1) is comprised of two inhabitable square areas (the left
versus the right square) completely separated by an uninhabitable feature (e.g., a water feature, different ecological community type, or different soil substrate,
etc.). Individuals dispersed outside the preserve, including into this uninhabitable central feature, die immediately and are removed from further analysis. Each square is 2,000 by 2,000 grid points (8 million individuals can occupy the preserve), and if the average minimum distance between two individuals is 1 m, then each square is 2 km on a side. The feature separating the two inhabitable squares is 200 grid points (m) wide, and runs the full height of the preserve (2,000 grid points).
Figure 1.
The preserve system is divided into two habitable squares of 2,000 grid points on a side (all other regions are uninhabitable: dispersal outside the habitable squares results in immediate “death”) with an intervening 200 grid point wide uninhabitable region. Letters show the placement of the 172 founders in comparative trials: A = founders placed centrally in 13 lines; B = founders placed in four longer lines centered on the vertical preserve axis but founders never being less than 40 grid points from a border; C = founders placed in two lines in a corner of each square as shown, founders never being less than 80 grid points from a border. See text for more details.
2.3. Conditions Held Constant across All Trials
In all of the trials here, 172 founders are used since this is the approximate number of founding individuals needed to ensure that most of the moderately low frequency alleles from the source population are represented at least once among the founders [
7,
8] (but see also [
9]). Founders are always separated by two grid points.
These founders are randomly drawn from a “source” population, each being randomly assigned alleles for 20 loci (two per each of the 20 loci), each locus having 100 alleles at equal frequencies (0.01) available. Thus, there are 2,000 alleles available in the source population. The source population is at Hardy–Weinberg equilibrium. All individuals are hermaphroditic. There is no offspring production in the first year of establishment, but for individuals in their second year, 60% produce one offspring on average, while all individuals living into their third year will produce one offspring on average. Offspring production in each round of mating is distributed among eligible individuals according to the Poisson distribution. Twenty percent of the individuals aged one year are selected at random to be eligible to contribute pollen, this number climbing to 60% in their second year, reaching 100% in the third year. Twenty percent of the individuals after their first year of establishment perish at random before their second-year mating bout, with 40% random loss of the remaining individuals in the third year. The individuals that remain after that third year of mating remain on the grid for one additional year, but do not reproduce again. Thus these individuals occupy space preventing establishment at those points for one year, and in year four, all individuals remaining for that cohort are removed. This convention reflects the scenario that when some individuals die, some of their dead biomass remains, or they have consumed all local resources, such that establishment is not possible at that point for one year after reproductive death. There is no reproduction via self-pollination.
2.4. Conditions That Vary among Trials
2.4.1. Founder Placement
The position of each founder is designated by the user in the NEWGARDEN input file for a trial. In the examples here, three different geometric patterns of found placement are employed in comparative trials. While these patterns have been arbitrarily selected, they reflect plausible planting options that might be available in a given restoration project (e.g., trails to the indicated sites are already available). Users can thus compare how planting founders in different available geometric options may affect population growth and population genetic diversity. The founding patterns used in the comparative trials here are:
Trials A and D. All founders are placed in an approximate square (13 lines with 13 individuals each, except for 3 lines which have 14 individuals), the square being placed at the center of the left square of the preserve system (for all founder placement geometries, see
Figure 1).
Trials B and E. The founders are placed in 4 parallel lines of 43 founders each. The line closest to the right internal border of the left square (closest to the uninhabitable central feature) is placed 40 grid points to the left of that border. The four lines are centered relative to the top and the bottom borders of the preserve.
Trials C and F. Two vertical, parallel lines of 43 founders each are placed in each side of the preserve (the bottommost founder in each line has the same y coordinate). The lines run parallel to the interior borders of the uninhabitable central feature, with the line closest to the border being inset into the habitable square preserve by 80 points. The founders at the bottom of each line which are thus closest to the bottom preserve borders are inset by 80 points from those borders.
2.4.2. Offspring and Pollen Dispersal Distances
In each round of mating, the program randomly selects individuals to be the ovulate plants as constrained by the input conditions. The user designates the percentage of offspring dispersed to different distances from the selected ovulate plants, and the percentage of pollen donors selected from different distances to ovulate plants, across all such matings. The convention used is to establish a series of nested distance “frames,” and, for the ovulate plant in each mating, a dispersal establishment point for offspring and an eligible pollen donor are selected at random from within the frames according to the probability assigned to each frame. If for a given mating event offspring are dispersed off of the grid, or in a selected pollen donor frame no eligible pollen donor exists, the mating is included in the tally of mating events, but no offspring establishes.
One issue investigated in the trial comparisons described here is to determine whether gene flow distance affects population growth and genetic diversity in different ways for populations founded in differing geometric patterns. We have thus arbitrarily specified two different gene dispersal regimens, these being called “long-distance” versus “short-distance” gene dispersal as outlined below. The probabilities of offspring being dispersed to, or pollen arriving from, given frames used in the trial results discussed below are:
Long-Distance Gene Dispersal for Trials A, B, and C. Offspring dispersal: 50% of the offspring are dispersed from the maternal plant in the x and y directions (chosen separately at random) from 0 to 60 grid points; 30% are dispersed from 61 to 120 grid points; 10% are dispersed from 121 to 180 grid points; 6% are dispersed from 181 to 240 grid points; and 4% are dispersed from 241 to 300 grid points. There is no dispersal beyond 300 grid points.
Pollen dispersal: 50% of the pollen comes from an eligible donor selected from within 60 grid points; 30% is selected from within 61 to 120 grid points; 10% arrives from within 121 to 180 grid points; 6% from within 181 to 240 grid points; and 4% from 241 to 301 grid points. Potential pollen donors at greater distances from a selected offspring producing individual are not eligible for a given mating event.
Short-Distance Gene Dispersal for Trials D, E, and F. Offspring dispersal: 60% of the offspring are dispersed from the maternal plant in the x and y directions (chosen separately at random) from 0 to 7 grid points; 20% are dispersed from 8 to 21 grid points; 13% are dispersed from 22 to 42 grid points; 4% are dispersed from 43 to 200 grid points; and 3% are dispersed from 201 to 300 grid points. There is no dispersal beyond 300 grid points.
Pollen dispersal: 60% of the pollen comes from an eligible donor selected from within 7 grid points; 20% is selected from within 8 to 21 grid points; 13% arrives from within 22 to 42 grid points; 4% from within 43 to 200 grid points; and 3% from 201 to 300 grid points. Potential pollen donors at greater distances from a selected offspring-producing individual are not eligible for a given mating event.
2.5. Output Statistics
For each generation, NEWGARDEN provides output as means across replicate runs (100 replicate runs were designated for all trials here) for a given trial for population size, founding alleles retained, observed heterozygosity, expected heterozygosity, and F
IT. These statistics are reported for the entire population and for the individuals in each new cohort (only the former are reported here). More details on how these statistics are calculated may be found in Rogstad and Pelikan [
5]. A standard deviation for each mean value is also provided. Below, comparative mean values that vary are considered significantly different (
p-value < 0.05 with Bonferroni corrected t-test of means) unless stated otherwise.
3. Results and Discussion
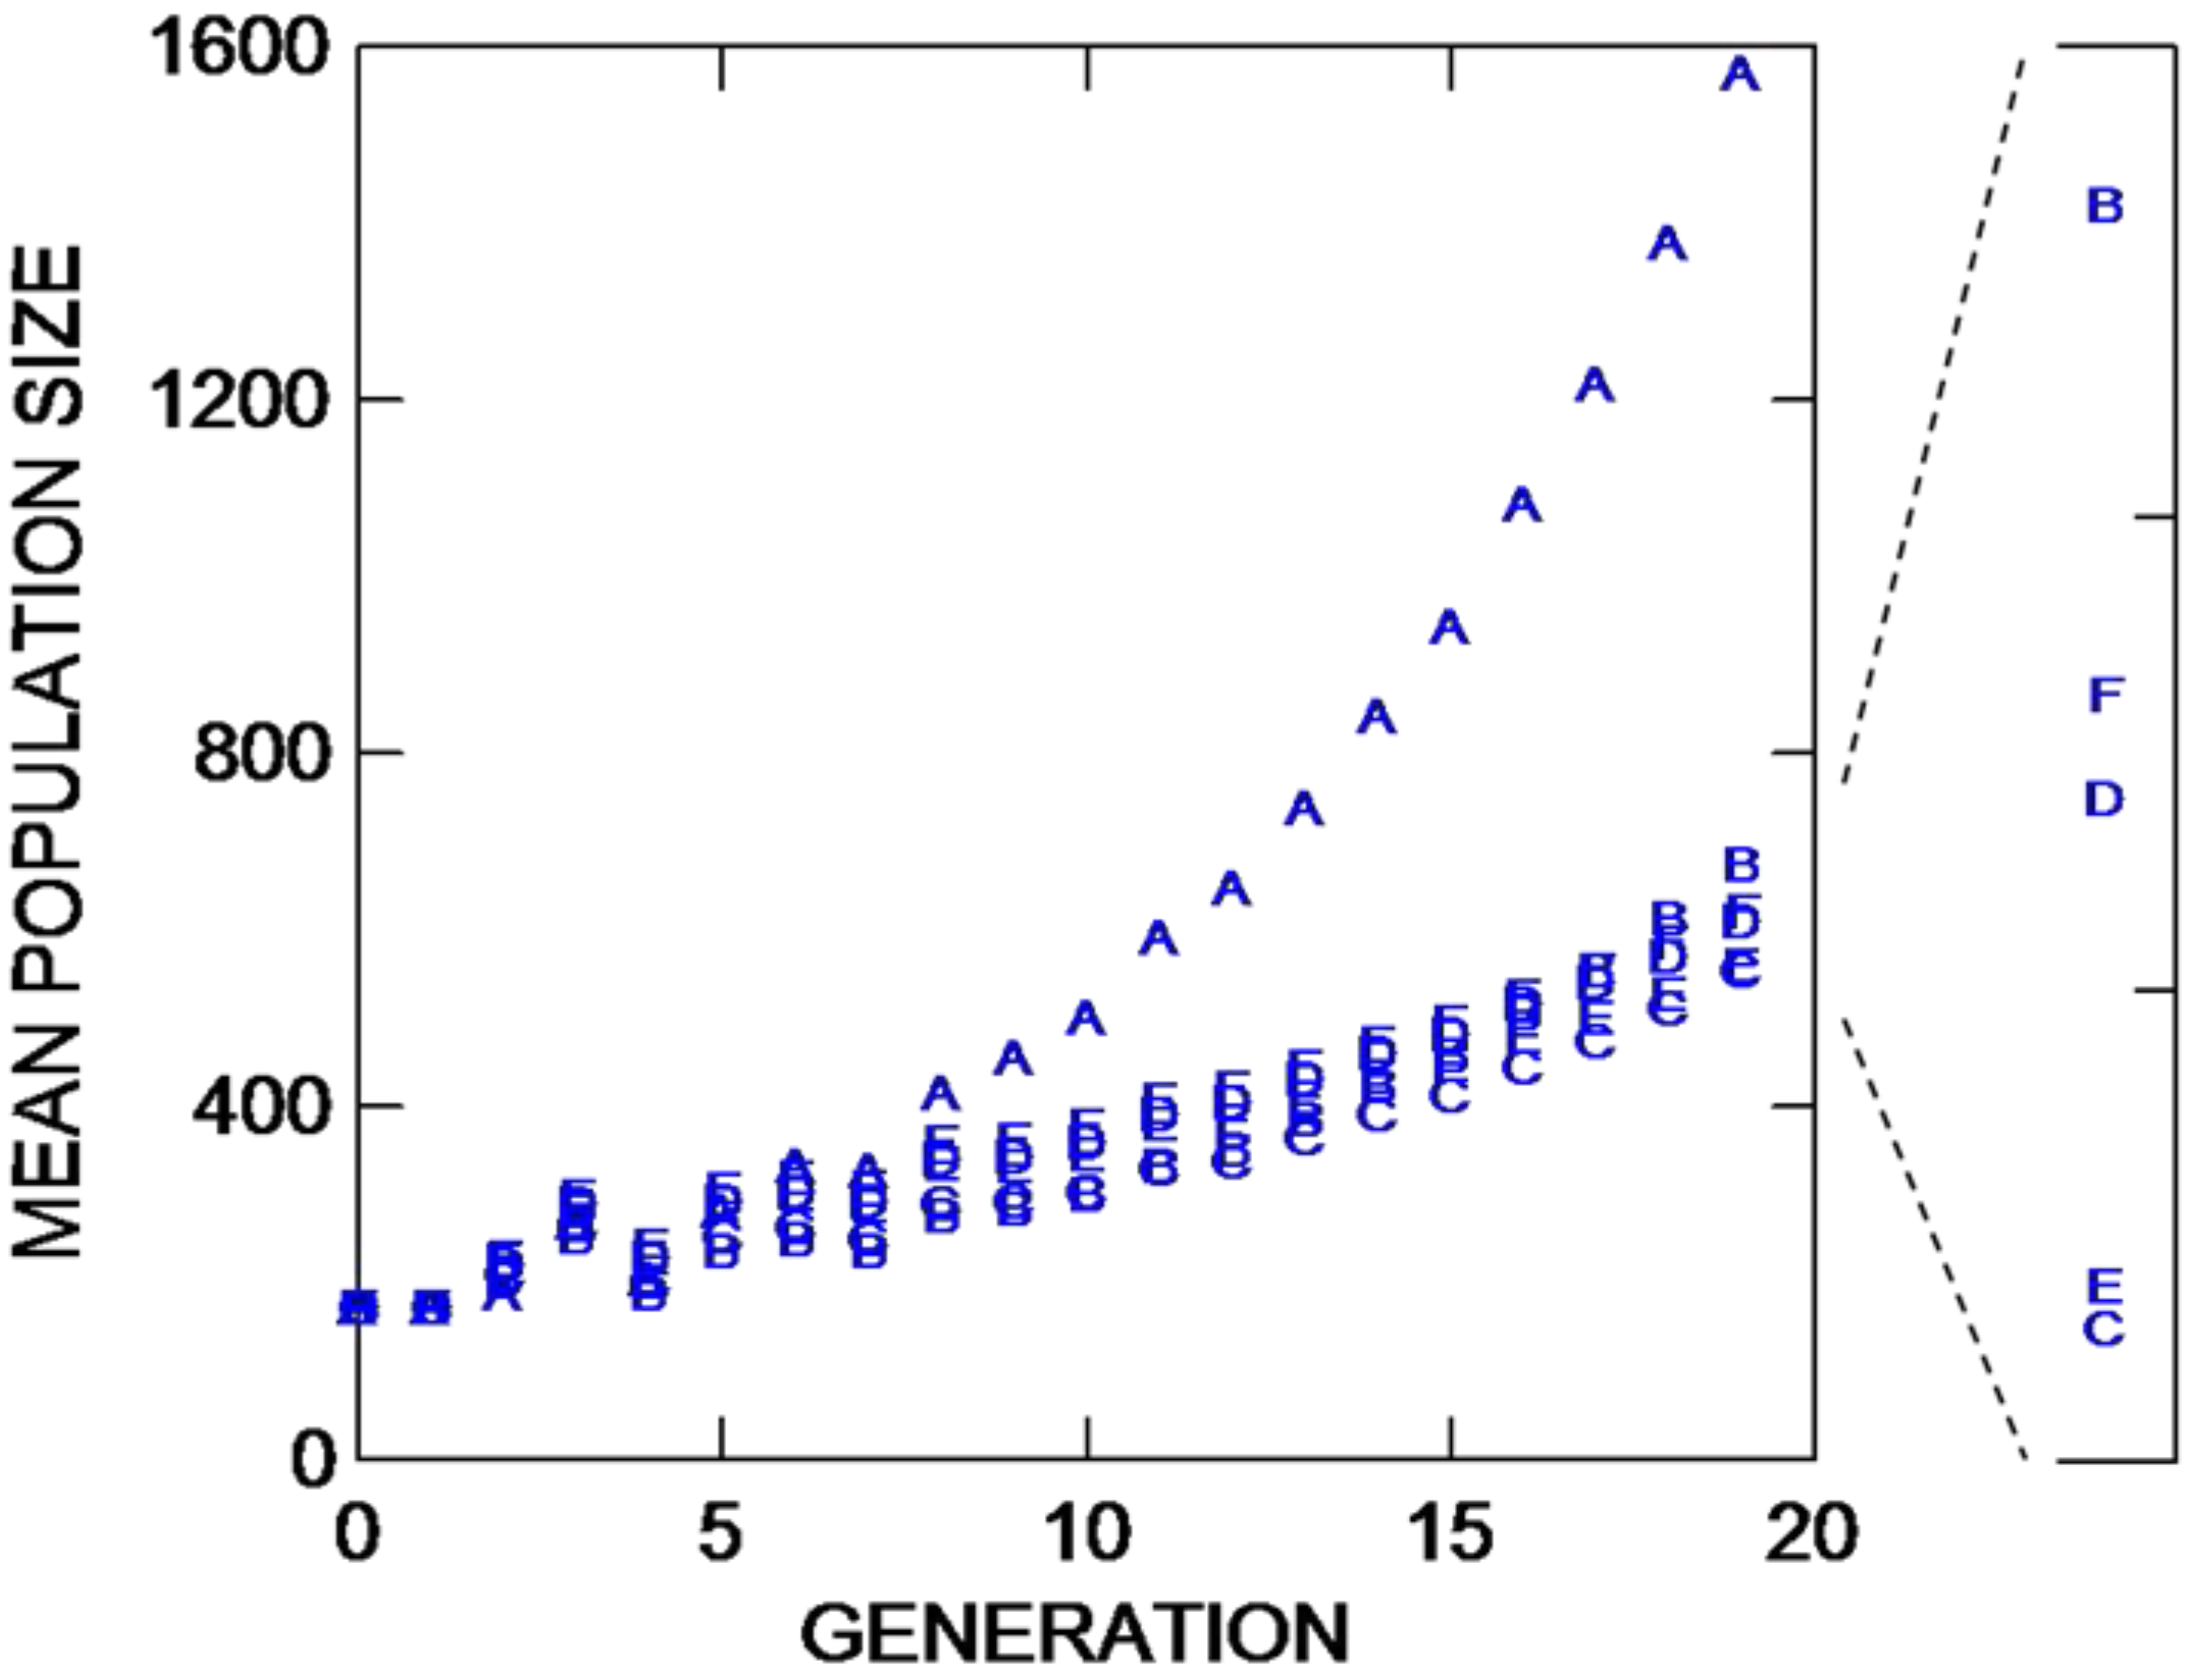
In discussing most of the results below, differences described between trials usually refer to values for generation 19 (chosen arbitrarily; users can choose to examine any number of generations of mating). Mean population sizes through 19 rounds of mating for these six comparative trials are depicted in
Figure 2. When gene dispersal is long distance, there is a substantial increase in population growth if the founders are placed in a square in the center of the preserve (trial A,
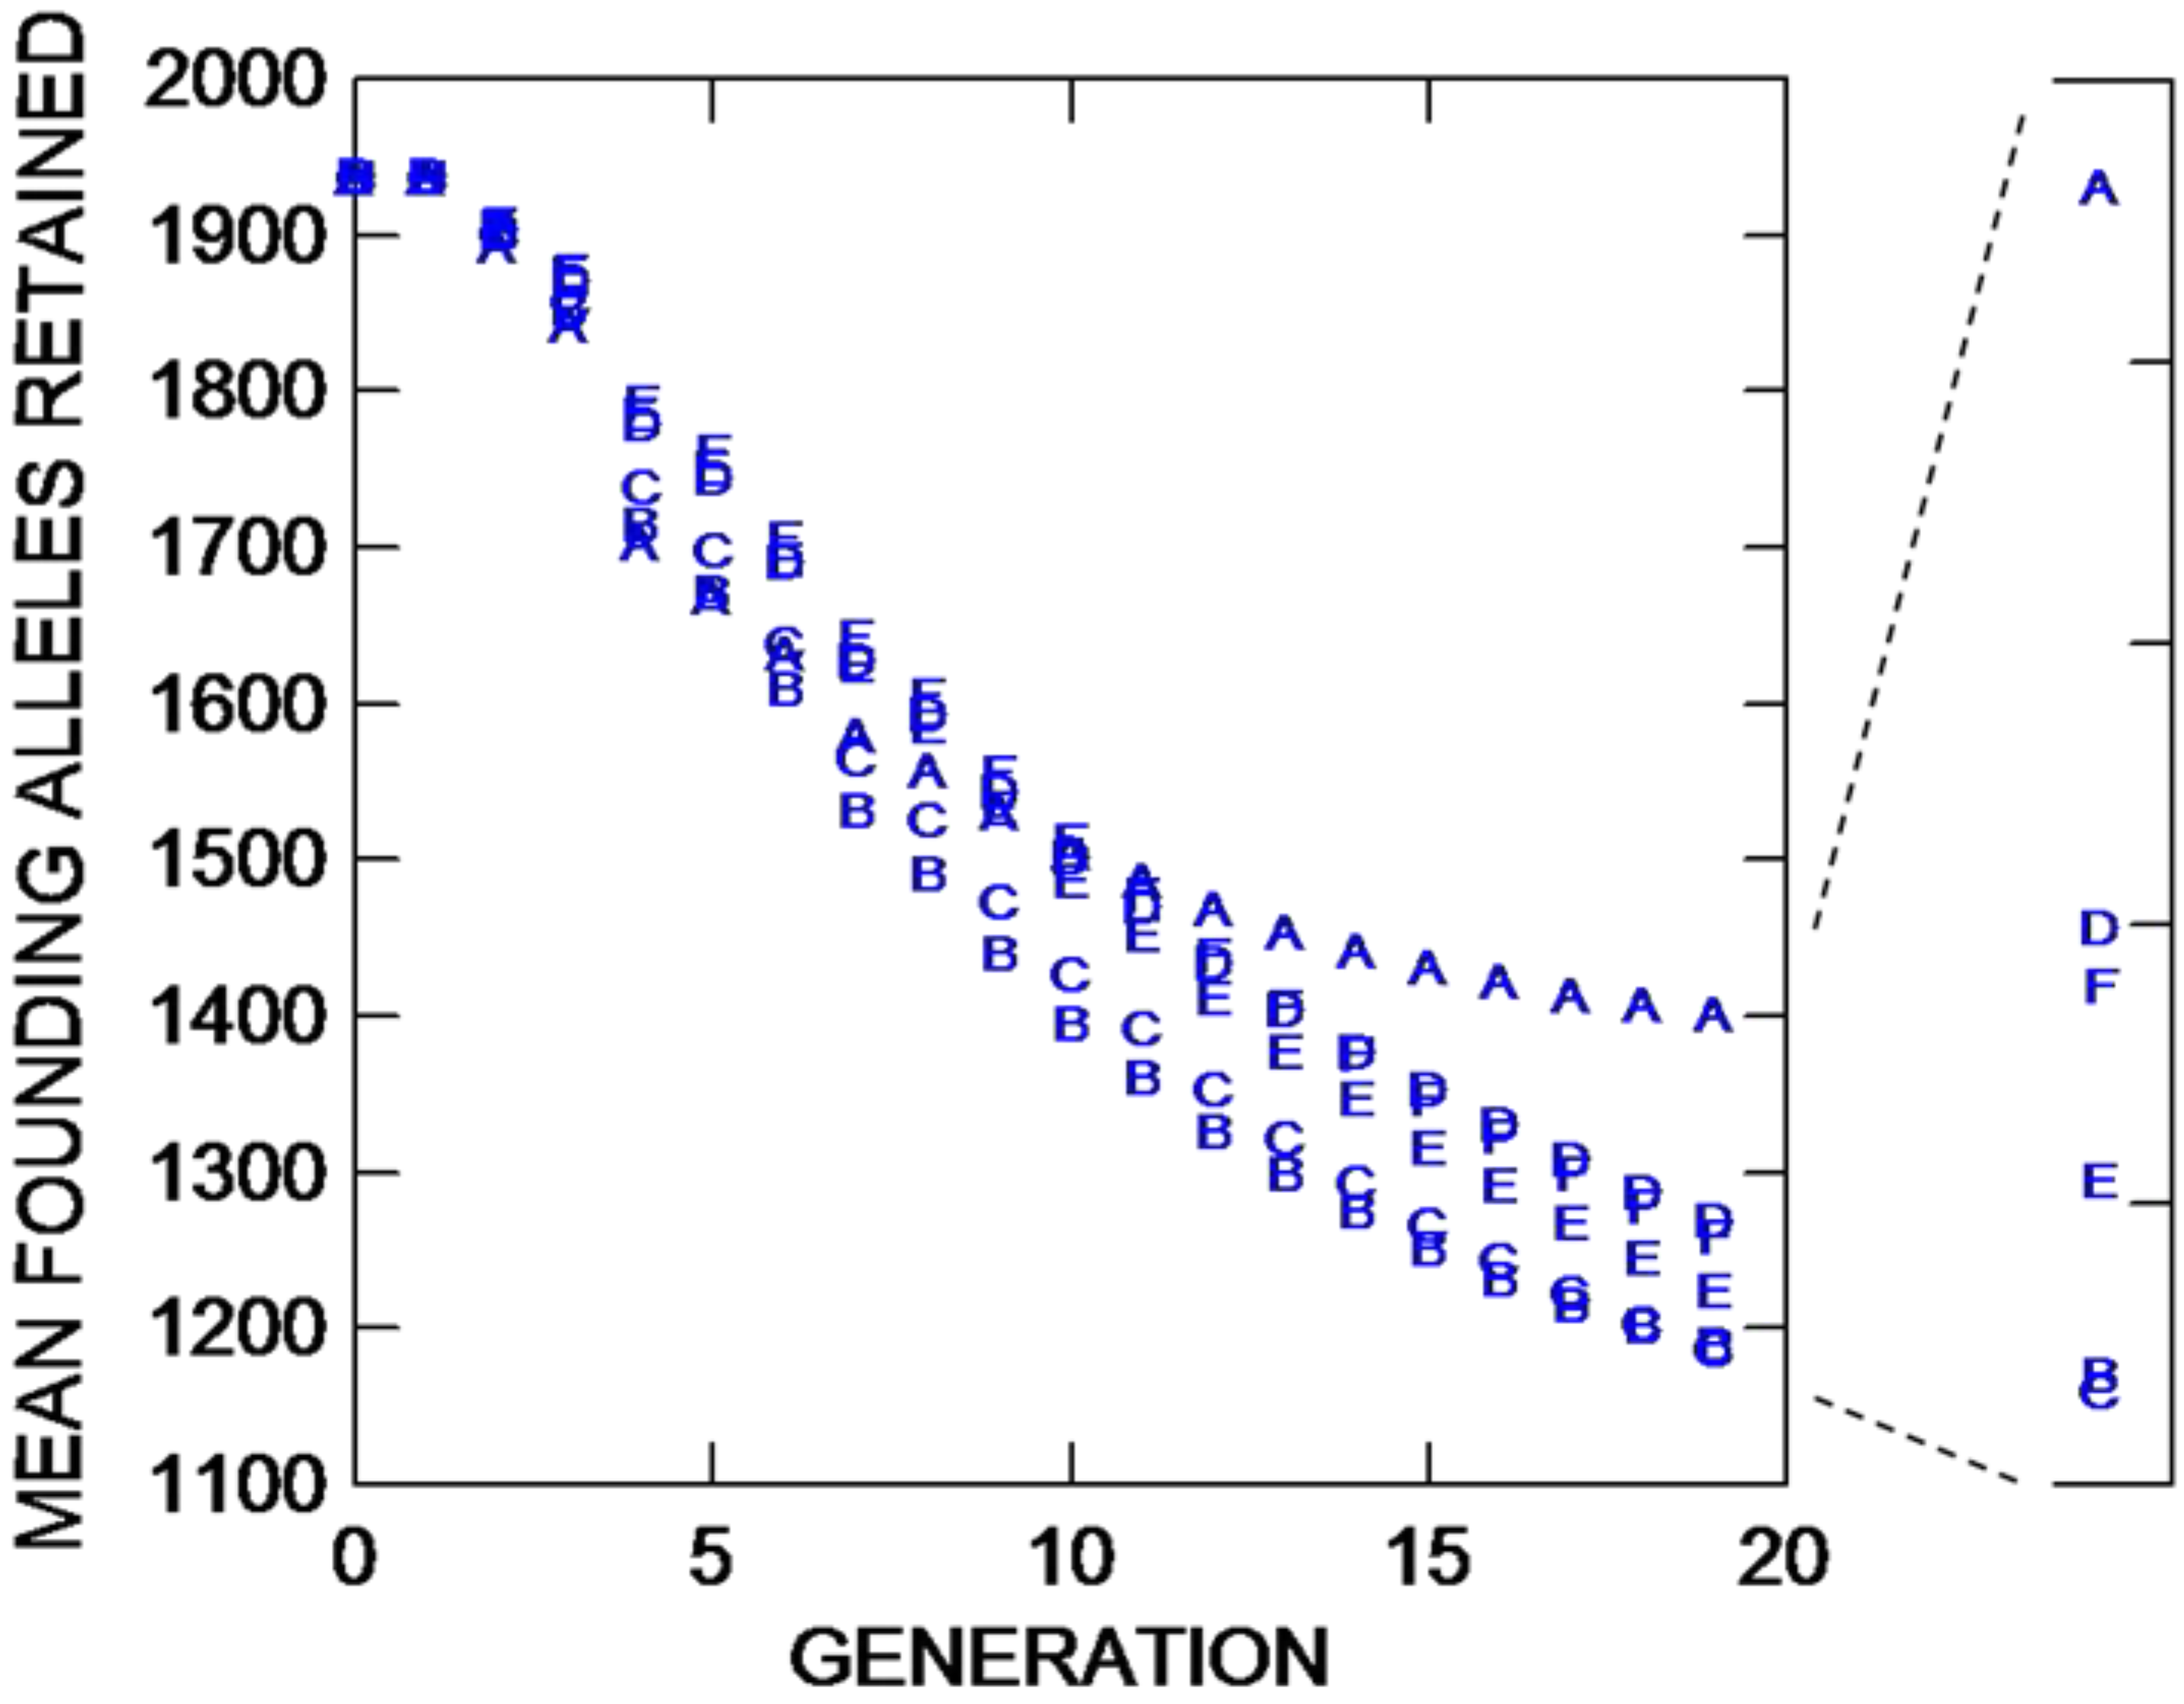
Figure 2), compared to placing the founders in four longer parallel lines near the borders (trials B and C). In the latter cases, maintaining all founders in one centralized group 40 grid points from an internal border along the subdividing feature results in a 21.5% increase in population growth compared to splitting those lines with two in both preserves with founders at least 80 units from the internal and bottom borders. The accelerated population growth for Trial A results in an 18% increase in the retention of founding alleles compared to trials B and C, which do not differ statistically (
Figure 3). Thus, if one is making a choice between planting restoration introducees in pattern B
versus C, if the only concern is maintaining genetic diversity rather than also rate of population growth, pattern C offers the advantage of “bet hedging” [
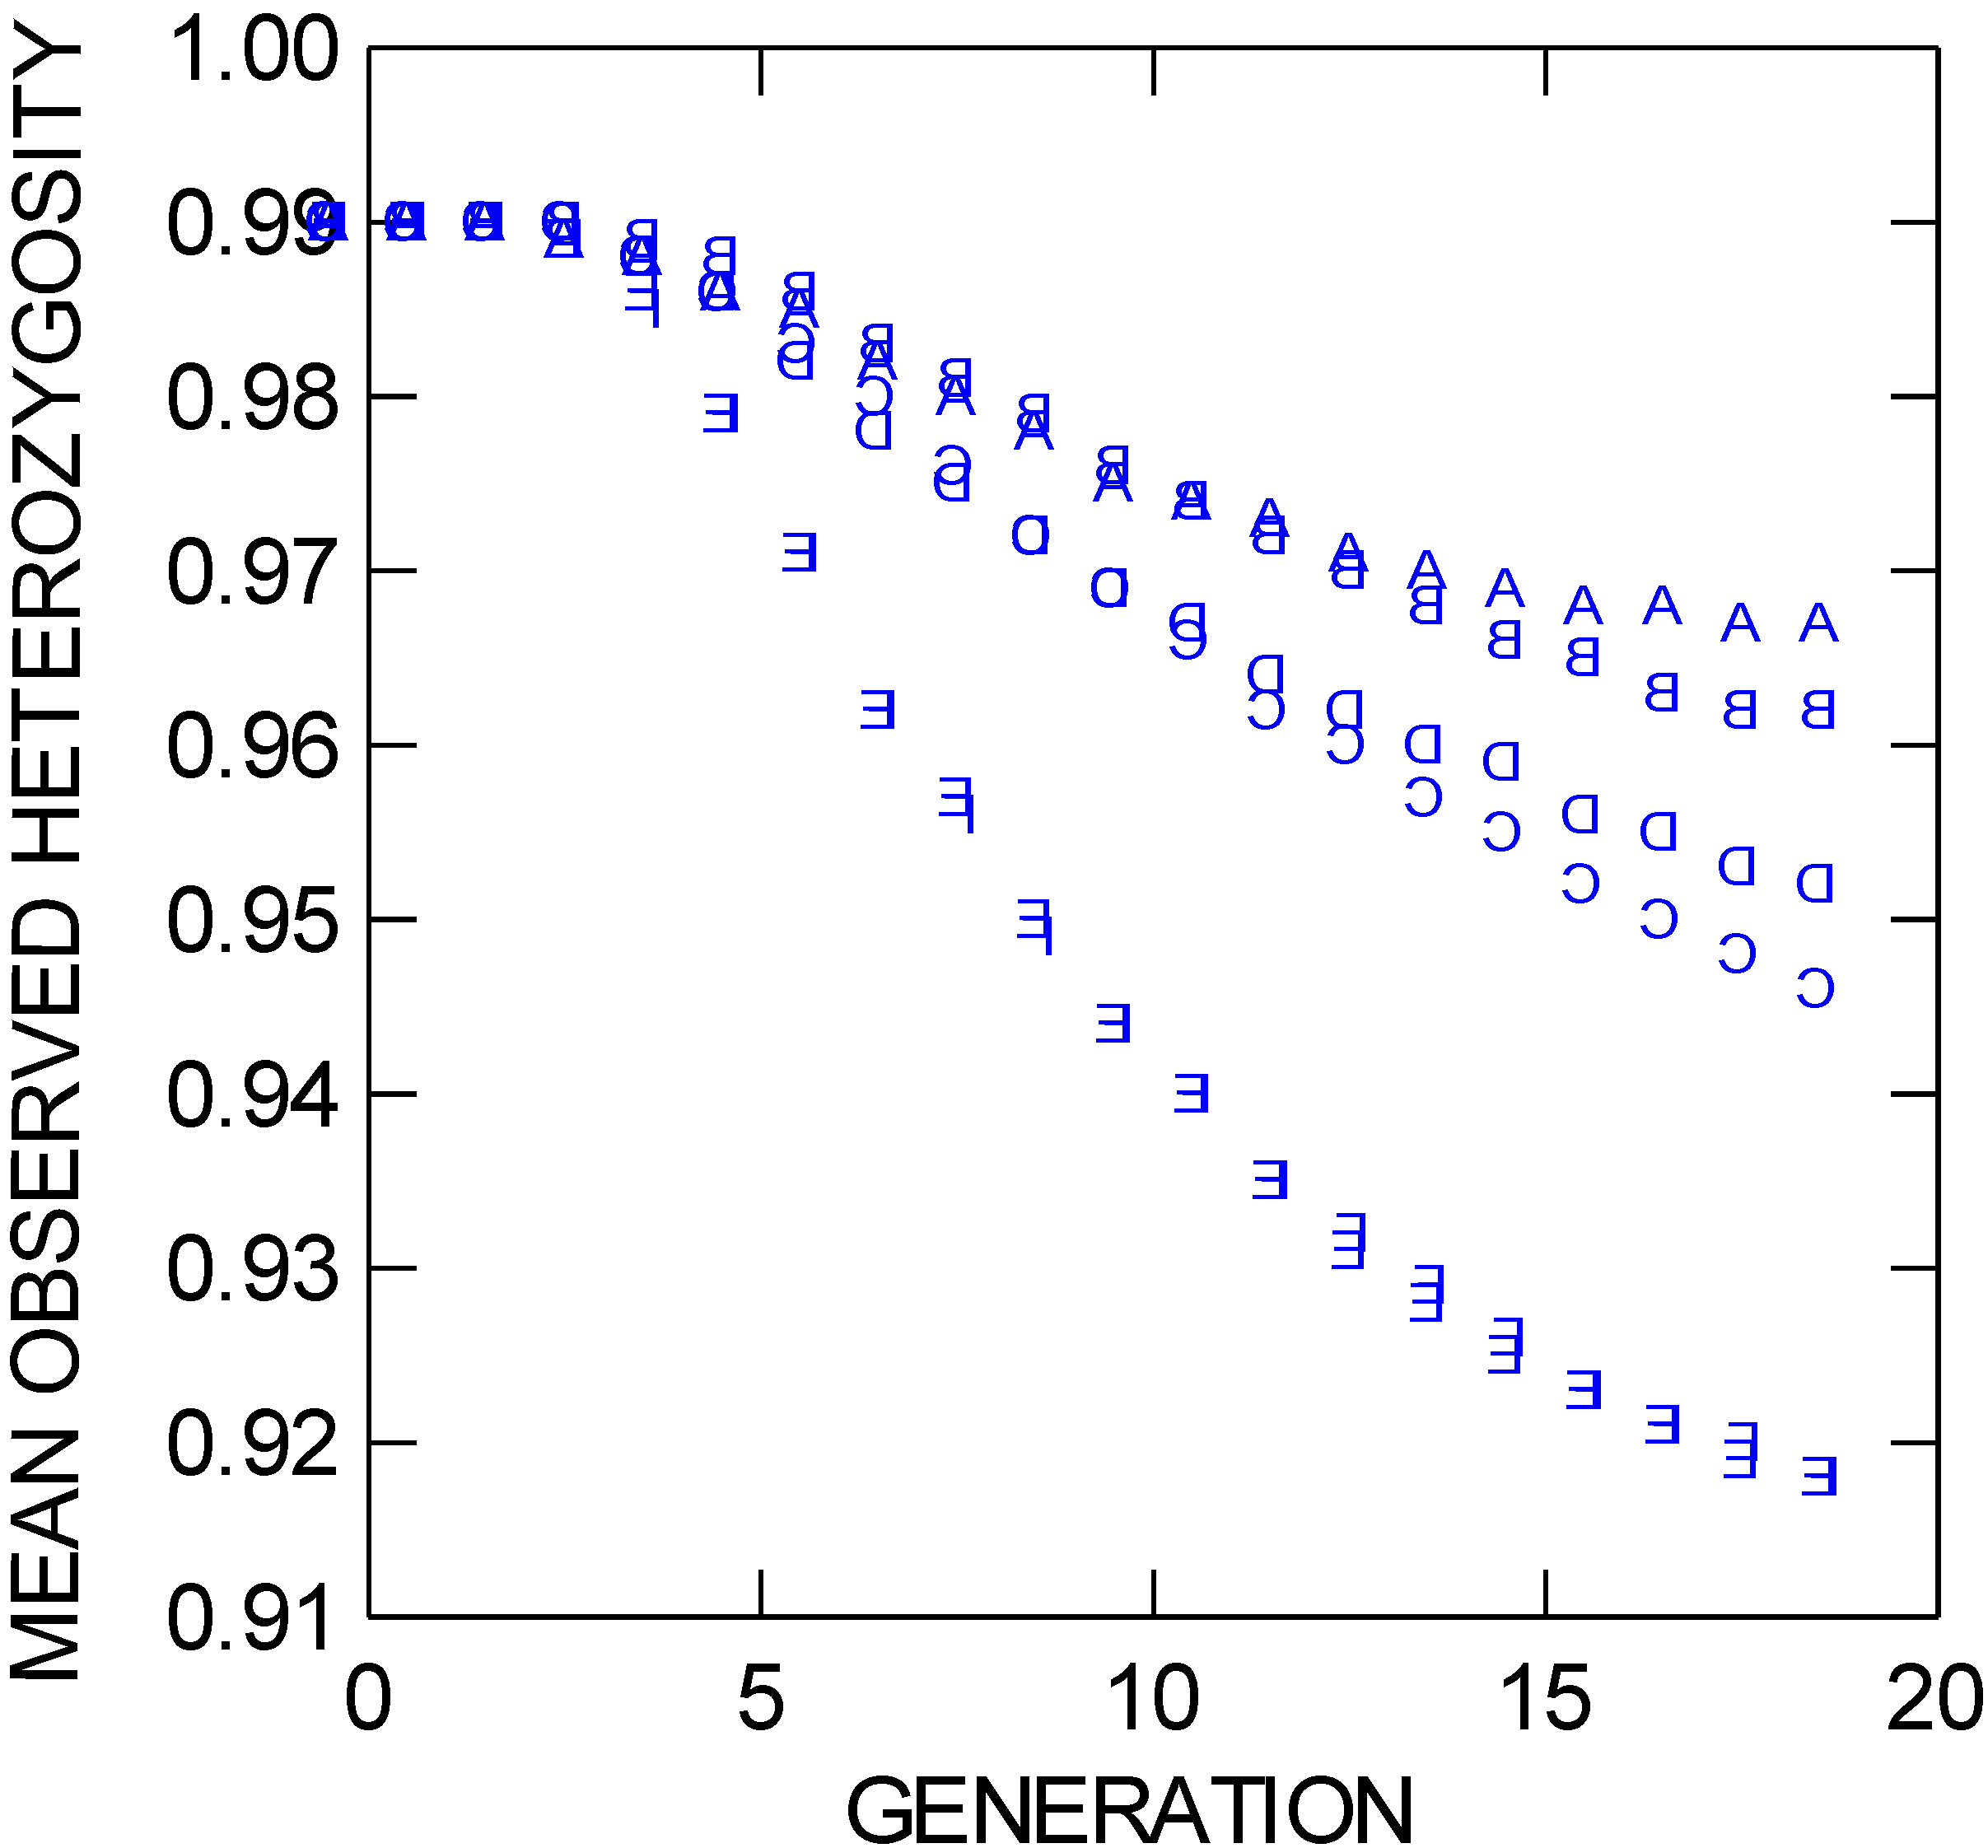
5], whereby one population might persist if the other is attacked by a pathogen, is destroyed by fire, or is otherwise locally negatively affected. However, although trial C statistically loses approximately 2.2% more observed heterozygosity (
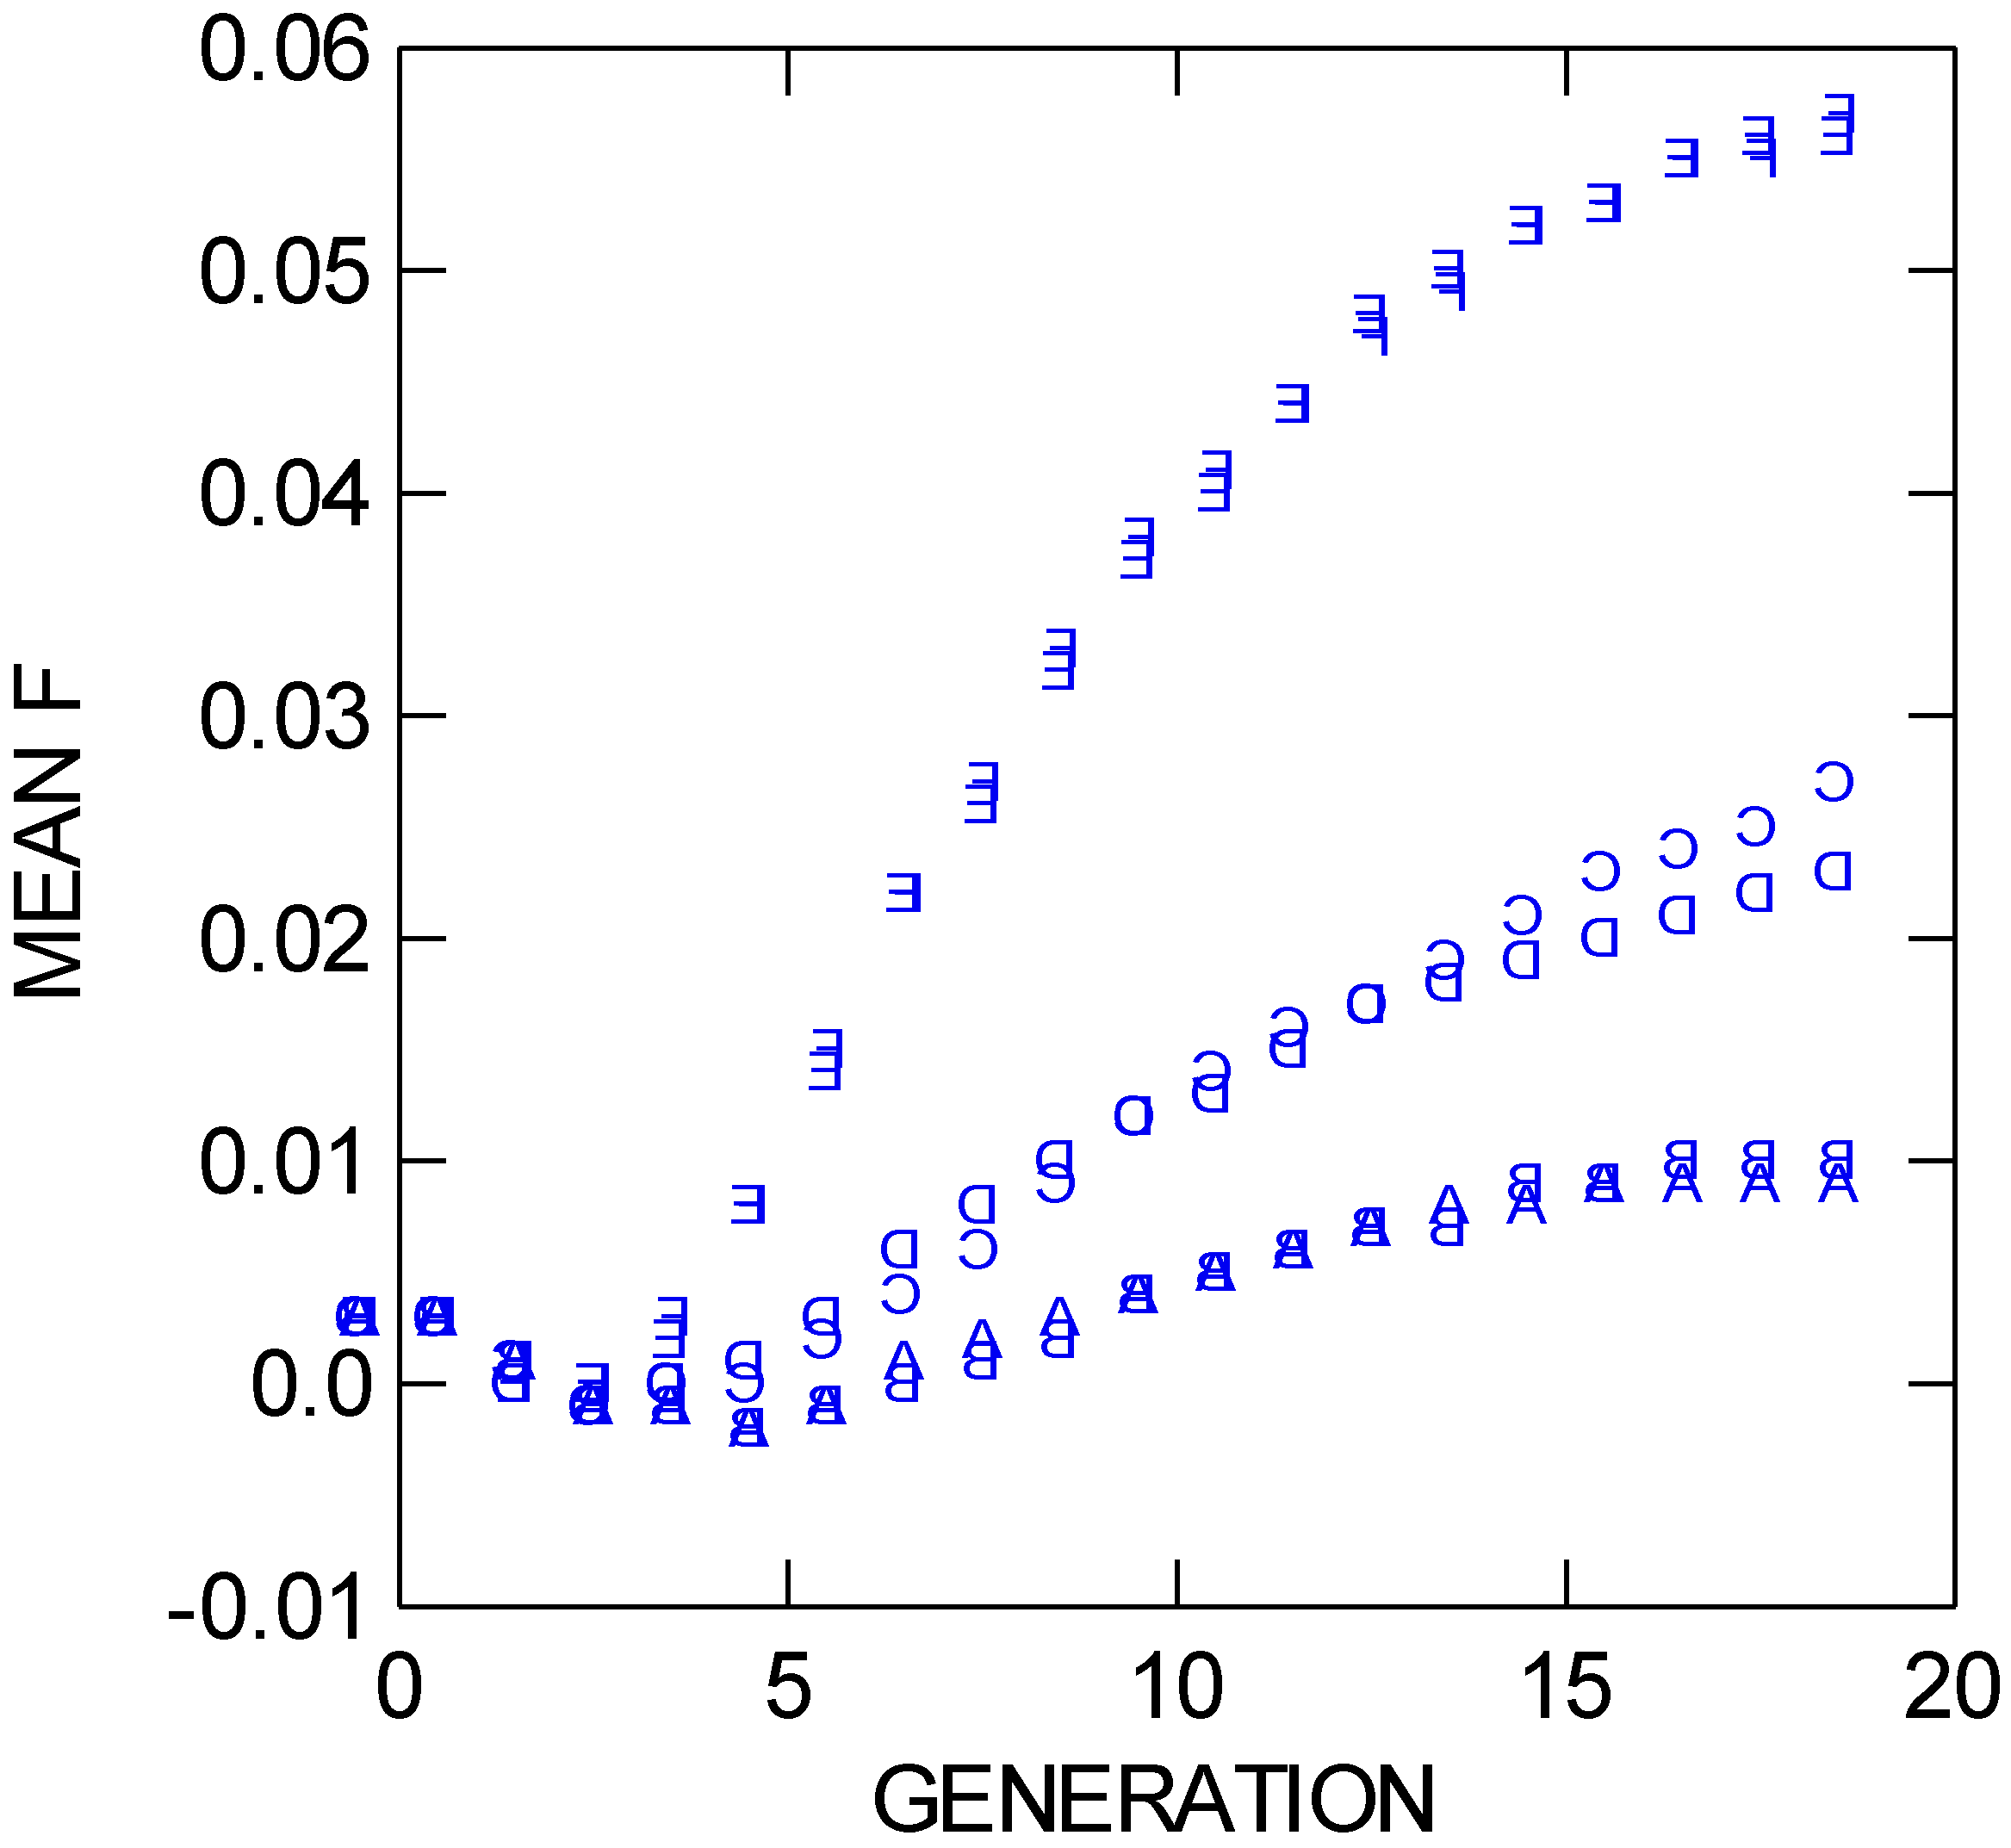
Figure 4), after 19 bouts of mating compared to trials A and B (which also differ statistically from one another by 0.5% in heterozygosity), and trial C differs from trials A and B (which do not differ) in F
IT (
Figure 5), neither the heterozygosity value nor the F value for trial C suggest that even moderate inbreeding or genetic subdivision (F would then be above 0.05 [
11]) is occurring when the founders are split to both sides of the preserve.
For a species with the aforementioned life history characteristics (including long-distance gene dispersal), there is clearly a substantial advantage, in terms of both population growth and genetic diversity retention, if the founders are placed in a square in the center of the preserve compared to nearer to the edges. However, there are circumstances where traveling to the center of the preserve to plant, maintain, monitor, or manipulate a rescue population is much more costly than planting closer to borders. Previously, we have shown that there might be intermediate founding distances at which population growth and diversity preservation is approximately equal to founding in the center [
5,
11]. NEWGARDEN modeling can be used to search for such alternate, equally effective solutions to suit the particular nature of the restoration project and preserve the system at hand. The above three comparative trials were all conducted under long-distance dispersal conditions. Are the results similar when gene dispersal is short distance, either due to differing environmental conditions or the focus being on a different species?
Figure 2.
Mean population size through 19 population bouts of mating (generations) for six different NEWGARDEN “restoration” populations that differ in the geometric placement of the 172 founders, and in gene dispersal distance. See text for more details.
Figure 2.
Mean population size through 19 population bouts of mating (generations) for six different NEWGARDEN “restoration” populations that differ in the geometric placement of the 172 founders, and in gene dispersal distance. See text for more details.
Figure 3.
The mean number of founding alleles retained through 19 population bouts of mating (generations) for six different NEWGARDEN “restoration” populations that differ in the geometric placement of the 172 founders, and in gene dispersal distance. See text for more details.
Figure 3.
The mean number of founding alleles retained through 19 population bouts of mating (generations) for six different NEWGARDEN “restoration” populations that differ in the geometric placement of the 172 founders, and in gene dispersal distance. See text for more details.
Figure 4.
Mean observed heterozygosity through 19 population bouts of mating (generations) for six different NEWGARDEN “restoration” populations that differ in the geometric placement of the 172 founders, and in gene dispersal distance. See text for more details.
Figure 4.
Mean observed heterozygosity through 19 population bouts of mating (generations) for six different NEWGARDEN “restoration” populations that differ in the geometric placement of the 172 founders, and in gene dispersal distance. See text for more details.
Figure 5.
Mean FIT values through 19 population bouts of mating (generations) for six different NEWGARDEN “restoration” populations that differ in the geometric placement of the 172 founders, and in gene dispersal distance. See text for more details.
Figure 5.
Mean FIT values through 19 population bouts of mating (generations) for six different NEWGARDEN “restoration” populations that differ in the geometric placement of the 172 founders, and in gene dispersal distance. See text for more details.
Figure 2,
Figure 3,
Figure 4,
Figure 5 also depict population growth, alleles retained, observed heterozygosity, and F
IT for trials D, E, and F, which have founders placed exactly as in comparative trials A, B, and C, respectively, but in the former three trials, gene dispersal is short distance. When gene dispersal distance is reduced, there is no statistical difference in population growth between trial D with founders in a central square on one side of the preserve, and trial F with founders split to two lines at least 80 grid points from the internal bottom corners placed in both inhabitable sides of the preserve. Placing the founders in four lines placed centrally in the left square of the preserve 40 grid points internally from the uninhabitable central area (trial E) reduces population growth by approximately 10 percent from either of the other two placement patterns. Trial E appears to experience the greatest population losses being nearer to the border under short-distance dispersal, while being placed only twice that distance from a border (trial F) essentially eliminates losses to the degree that population growth is not affected compared to placing founders centrally (trial D). Although placement of founders in trials A with long-distance gene dispersal and trial D with short distance gene dispersal is the same, the former trial experiences a 257% increase in population growth through 19 bouts of mating. The shorter dispersal distance induces greater density-dependent mortality for trial D (and presumably trials E and F). This suggests that population growth for species with limited gene dispersal as found in trials D, E, and F could be greatly increased by manipulative increases in offspring movement. While allele retention (
Figure 3) when placing the founders in a central square (trial D) does not differ from placing founders in two lines in each of the separated preserve squares (trial F), both differ from placing founders in four longer lines centrally 40 grid points from the internal vertical border of the left square of the preserve (trial E), although the latter placement increases the loss of founding alleles by only approximately 3.3%. Under more limited gene dispersal, all trials lose heterozygosity (
Figure 4) at increased rates relative to their long-distance dispersal, same-founding-pattern counterparts due to less extensive mixis. Trials E and F, with founders placed in four longer lines but the latter having the lines split between the two preserves, have identical levels of observed heterozygosity at generation 19 (and standard deviations of 0.009). These two trials also have nearly identical F
IT values (
Figure 5), and across all trials, they are the only two trials to rise above an F
IT value of 0.05, indicative of moderate inbreeding and/or subdivision after 19 bouts of mating. If a preserve manager is worried about loss of fitness due to inbreeding or subdivision for a restoration short-distance dispersal species, the founding pattern in trial D would be preferred over either trial patterns E or F. Note, however, that trial D has a higher level of F
IT relative to its counterpart trial A due to more limited gene dispersal in the former.
Interestingly, comparing trials with the same founder placement but contrasting long- versus short-distance dispersal, for trials A versus D, and B versus E, in both comparisons population growth is greater when dispersal is long-distance (trials A and B) compared to their counterparts. But when founders are split to two lines placed on both sides of the uninhabitable region, population growth is increased by 12.1% at generation 19 under short- versus long-distance conditions (compare trials F versus C, respectively). For these same trial comparisons, but considering founding alleles retained at generation 19, more alleles are retained when dispersal is long distance only when founders are placed in the center of the preserve (trial A retains more than trial D). Trials with short-distance dispersal retain more founding alleles compared to long-distance dispersal when founders are placed in four longer lines centrally at 40 grid points internally from the central uninhabitable region (trials E versus B; but the difference is only an increase of 2.9% more alleles), and when the founders are placed two lines in each preserve (trials F versus C; trial F shows a 6.1% increase). Such comparative patterns need to be considered in restoration projects where allele preservation is considered more important than the rate of population growth.
It should be noted that the examples used here to demonstrate differences in allele retention use alleles at relatively low frequencies (frequency = 0.01). We use this convention for several reasons. Such analyses facilitate comparisons regarding how drift is occurring across comparative trials. In the preservation of species, the conservationist should also be acutely interested in preserving the rarer alleles to maintain future evolutionary potential. The most comprehensive surveys of allelic variation to date in several organisms are revealing that low frequency alleles within and among populations are common [
12,
13], and such alleles can become established at founding in several ways (e.g., see discussion in [
5]). Recent studies have also shown that low-frequency alleles can be involved in altering evolutionary trajectories [
14,
15]. Further, we have discovered that founding conditions that promote greater losses of low-frequency alleles likewise promote greater variances in the frequencies of high frequency alleles [
5], and thus evolution by natural selection becomes less effective, and random evolution of allele frequencies is enhanced under such conditions. Restoration projects should be designed to facilitate evolution by natural selection over by random processes.
4. Conclusions
As humans increase their perturbations of natural ecosystems, there are increasing calls for the establishment of sustainable populations that preserve species diversity to the greatest degree. The preservation of some species is, and will likely continue to be, based on the creation or preservation of rescue populations, which will often occur in isolated fragments. Central goals in the management of such populations should be to maximize population growth and genetic diversity, including rare alleles, of the threatened species. We have demonstrated in this paper that the geometric pattern of the establishment of rescue populations can affect both the rate of population increase and the retention of founding genetic diversity in a mixed biennial
—triennial growing in a divided preserve system, and that these characteristics of population development can be affected by life history characteristics such as gene dispersal distance. Previously, we have shown that variation in other life history characteristics, patterns of founding, and preserve system design can have varied, but often pronounced, effects on population growth and diversity trajectories [
5,
11].
Obviously, numerous factors not modeled using the NEWGARDEN program may influence the growth processes of newly initiated populations to varying degrees, and thus NEWGARDEN modeling is not meant to provide all-inclusive predictions of the development of populations. Still, plant rescue project managers can use NEWGARDEN modeling to explore, at least tentatively, patterns of founding that may be the least costly in terms of establishment, monitoring, manipulation, and harvesting expenditures [
5], while maximizing population growth and genetic diversity maintenance objectives. NEWGARDEN analyses can also be used to attempt to best “mimic” what has happened in the development of a recently founded population to obtain consequent genetic diversity estimates with the aim of manipulating (e.g., supplementing) the population as needed. We further note that NEWGARDEN can be used to investigate founding effects in natural populations. Given the complex historical nature of the development of populations, NEWGARDEN analyses will not yield perfect projections of population trajectories. However, they can be used to gain insight into population processes and explore for restoration plans that have a greater likelihood of producing superior outcomes. Complete descriptions on how to use NEWGARDEN, numerous example applications, and a utilizable copy of the program, can be found in Rogstad and Pelikan [
5], and at [
16].


