1. Introduction
Energy represents a cornerstone of most aspects of life. Energy is “the golden thread that connects economic growth, increased social equity, and an environment that allows to the world to strive” [
1]. The access to clean and affordable modern energy services is central to socio-economic emancipation. Energy services refer to the utility of energy, or the application of useful energy to tasks desired by the consumer such as transportation, a warm room, or light; and “modern” refers to a relatively high degree of convenience in obtaining those services,
i.e., energy services that are rendered through the use of energy sources which are other than so-called traditional (e.g., fuelwood, animal dung, shrub and grass) transportation, a warm room, or light.
Those energy services (e.g., lighting, heating and cooking energy, motive power, energy for telecommunication and entertainment), although taken for granted in industrialized countries, remain unavailable to a large share of the world’s population. The lack of access to energy represents a major barrier to human development and the achievement of objectives set forth by the international community, such as the Millennium Development Goals [
2].
Despite notable progress in some regions and countries, the International Energy Agency (IEA) reports that there are 1.3 billion people without access to electricity, and 2.7 billion without clean cooking facilities [
3], with a large share located in sub-Saharan Africa and developing Asia. Without dedicated action, there is a risk that the absolute number of energy poor will increase in some regions.
A number of countries have taken decisive action and achieved remarkable results in addressing the issue. Swift progress in electrification is reported, for instance, in Mauritius, Mexico, Thailand, and South Africa [
4]. The international community and other stakeholders are also gearing up to make energy poverty history in the foreseeable future. Noteworthy in this context is the fact that 2012 was declared as the
International Year of Sustainable Energy for All by the United Nations General Assembly. It reflects a clear recognition of the predominant role of energy in dealing with contemporary global challenges.
With this momentum, numerous commitments are being made, be it at policy level or with concrete programs and projects. But with the magnitude of the challenge of tackling energy poverty at hand, it is necessary to go beyond piece-meal approaches and foster strategies that bring about transformative, quantum changes [
5]. There is a clear need to develop appropriate tools to inform the development of interventions, as well as to keep track of progress. It is against this backdrop that the Multidimensional Energy Poverty Index (MEPI) was developed.
This paper presents an updated version of the MEPI methodology and showcases the results of expanding the analysis to all developing countries with available data. To this end,
Section 2 defines the analytical framework and
Section 3 presents the methodology used to assess energy poverty.
Section 4 features the results and the discussion, and
Section 5 concludes.
2. Analytical Framework
The means to quantifying socio-economic well-being is a well discussed topic in the literature. A number of metrics are commonly used, and sometimes misused or misinterpreted, to gauge economic performance and social progress A report commissioned by the French government [
6] discusses the adequacy and shortcomings of current measures.
The debate on the limitations of the predominant commodity-focused perspective—such as measuring developmental progress with wealth-related indicators—gave rise to the recognition that socio-economic development is a complex, multifaceted process. Indeed, development scholars have repeatedly underlined the fact that poverty alleviation goes well beyond the necessities of material well-being [
7]. Based on that premise, quantification tools need to reflect that multi-dimensional nature, and thus a multi-criteria framework intuitively seems ideally suited.
However, quantifying a concept that is intangible and multifaceted in nature is rather challenging. However, lack of a common unit of measurement between the dimensions does not necessarily imply incomparability. Weak comparability is well documented in the realm of multi-criteria theory and a number of tools exist to deal with incommensurability [
8].
Another well debated issue is that of aggregation in the context of composite indices. Two schools of thought clash, that of the “aggregators”
versus that of the “non-aggregators” [
9]. Proponents of the former argue for the value of a single numeral to capture a broad, often elusive concept, whilst advocates of the latter underline the risk of reductionism and note the flaws of aggregation methods. A number of scholars have highlighted the lack of theoretical underpinnings of a number of composite indices [
10,
11,
12,
13,
14,
15,
16].
There are a number of indicators and composite indices [
17], both within and outside of the energy space, from which to draw lessons when designing and applying a new metric to measure energy poverty. The proliferation of composite indicators is a clear indication of their importance in policy-making [
12]. In fact, aggregating information into single indexes can make many analyses convenient and possible; e.g., as is the case with benchmarking performances analysis among countries [
17]. Yet, the loss of information in the process of aggregating indicators is not to be underestimated, as underlined by numerous scholars. Therefore, a hybrid approach with a composite index complemented by an assessment of the underlying indicators captures the essence concisely without compromising the opportunities to derive rich insights.
In this research, importance is given to both the composite MEPI index for cross-country high-level comparisons, as well as the indicators composing the index. The detailed analysis yields valuable information on the nature of energy poverty in a country, and helps determine its structure. For instance, some countries might have effective electrification schemes in place while clean cooking facilities might be lacking, or vice versa.
In addition, it is important to underline the analytical value of the single indicators composing the MEPI. The indicators derive from Demographic and Health Surveys (DHS) databases. Those are the outcomes of extended sample surveys in numerous countries, with comparable methodologies. The MEPI represents a valuable complement to commonly used datasets on energy poverty.
As opposed to many other metrics to measure energy poverty or access, the MEPI focuses on the energy services that people ultimately want and need. We argue that to generate information of direct relevance to policy formulation and to develop interventions to address energy poverty, one should evaluate energy deprivations directly as opposed to indirectly deriving information through variables that are presumably correlated (e.g., level of energy consumption). The deprivation perspective places the emphasis specifically on the poor [
7].
Furthermore, the MEPI captures the multidimensionality of energy poverty. Also, it goes beyond the notion of headcount and integrates the degree of energy poverty, thus moving away from the simplification many quantifications make on assuming a binary state, i.e., having or not energy. Finally, the MEPI as a tool, due to its design, is flexible and allows for decomposability and numerous analyses.
3. Methodology
The methodology applied for the research is a slight adaptation of previous work on measuring energy poverty [
18,
19], which in turn was inspired by research on multidimensional poverty measures from scholars at the Oxford Poverty and Human Development Initiative (OPHI) [
20,
21,
22]. This school of thought is influenced by Amartya Sen’s seminal contribution to the discussion of deprivations and capabilities with the cornerstone of the thesis being the argument that human poverty should be considered as the absence of opportunities and choices for living a basic human life [
23].
The MEPI is designed to capture and evaluate a set of energy deprivations that affect a person or household. In line with the recognition of the multidimensional nature of energy poverty, the MEPI is composed of five dimensions representing basic energy services and six indicators of these dimensions (see
Table 1). Essentially, a person or household is identified as energy poor if the respective set of deprivation exceeds a pre-defined threshold. The algorithm produces the share of people considered as energy poor (headcount ratio), as well as the average intensity of energy poverty.
Table 1.
Dimensions and respective indicators with cut-offs, including relative weights in parentheses.
Table 1.
Dimensions and respective indicators with cut-offs, including relative weights in parentheses.
| Dimension | Indicator
(weight) | Variables | Deprivation cut-off (energy poor if…) |
|---|
| Cooking | Modern Cooking fuel
(0.2) | Type of cooking fuel | any fuel use besides electricity, LPG, kerosene, natural gas, or biogas |
Indoor pollution
(0.2) | Food cooked on stove or open fire (no hood/chimney), indoor, if using any fuel beside electricity, LPG, natural gas or biogas | true |
| Lighting | Electricity access
(0.2) | Has access to electricity | false |
| Services provided by means of household appliances | Household appliance ownership
(0.13) | Has a fridge | false |
| Entertainment/education | Entertainment/education appliance ownership
(0.13) | Has a radio OR television | false |
| Communication | Telecommunication means
(0.13) | Has a phone land line OR mobile phone | false |
In terms of the weighting structure, more importance is given to the energy services deemed as essential. Indeed, 40% of the total weight is attributed to cooking, with the same share being distributed to the type of fuel used as proxy for convenience and to indoor pollution. Lighting is a critical energy service. Other services are receiving an equal share of the remaining weight. The sensitivity of the results to the weighting structure has been tested and discussed [
18,
19].
From a methodological viewpoint, the MEPI respects the condition of dimensional monotonicity. If an additional person becomes poor and/or if a person already considered as multi-dimensionally poor becomes poor in additional variable(s), it is reflected by an increase in the aggregated value. Another notable virtue of the methodology is the ability to produce detailed analysis based on the determinants. The micro-level input data (households or individuals) allows for a wide range of analyses by particular sub-groups (e.g., sub-national level, wealth classes), thereby providing additional richness to the analysis.
Formally, the MEPI measures energy poverty in
d variables across a population of
n individuals.
Y = [
yij] represents the
n x
d matrix of achievements for
i persons across
j variables.
yij > 0 therefore denotes the individual
i achievement in the variable
j. Thus, each row vector
yi = (
yi1,
yi2, …,
yid) represents the individual
i achievements in the different variables, and each column vector
yj = (
y1j,
y2j, …,
ynj) gives the distribution of achievements in the variable
j across individuals. The methodology allows weighting the indicators unevenly, if desired. A weighting vector
w is composed of the elements
wj corresponding to the weight that is applied to the variable
j. We define
![Sustainability 05 02060 i001]()
.
We define
zj as the deprivation cut-off in variable
j, and then identify all individuals deprived in any variables. Let
g = [
gij] be the deprivation matrix, whose typical element
gij is defined by
gij =
wj when
yij <
zj and
gij = 0 when
yij ≥
zj. In the case of the MEPI, the element of the achievement matrix being strictly non-numeric in nature, the cut-off is defined as a set of conditions to be met (see also
Table 2). The entry
ij of the matrix is equivalent to the variable weight
wj when a person
i is deprived in variable
j, and zero when the person is not deprived. Following this, we construct a column vector
c of deprivation counts, where the
ith entry
![Sustainability 05 02060 i002]()
represents the sum of weighted deprivations suffered by person
i.
We then identify the persons multi-dimensionally energy poor by defining a cut-off k > 0 and applying it across the column vector, and consider a person as energy poor if her weighted deprivation count ci exceeds k. Therefore, ci(k) is set to zero when ci ≤ k and equals ci when ci > k. Thus, c(k) represents the censored vector of deprivation counts, and it is different to c in that it counts zero deprivation for those not identified as multi-dimensionally energy poor.
Finally, we compute the headcount ratio
H, which represents the proportion of people that are considered energy poor. With
q as the number of energy poor people (where
ci >
k) and n the total, we have
H =
q/
n, which represents the incidence of multidimensional energy poverty. The average of the censored weighted deprivation counts
ci(k) represents the intensity of multidimensional energy poverty
A. More formally, we calculate
![Sustainability 05 02060 i003]()
. The MEPI captures information on both the incidence and the intensity of energy poverty, and is defined as MEPI =
H ×
A.
As a slight modification from the original methodology [
18,
19], additional granularity is introduced to the indicator on indoor pollution by adding a variable indicating the location of the cooking. Indeed, the impact in terms of health would be different if the cooking is taking place indoors or out. This was made possible due to the availability of the variable in the latest generation of datasets.
More importantly, this paper presents an extended version of the analysis by producing results for other world regions (the methodology had previously only been tested with African countries [
18]). The availability of new datasets also allows for a more extensive analysis of the evolution over time of the MEPI for some selected countries.
Data Availability and Treatment of Missing Data
Data paucity constrains quantitative analysis and in particular, composite indices. The issue is particularly acute with regard to energy poverty. Ravallion [
13] underlines the common gap between the theoretical ideal and practical measurement. The analysis presented herein is no exception, and missing data presents a hurdle.
This notwithstanding, additional and more comprehensive data have permitted methodological refinements and more comprehensive analyses with the MEPI. One can reasonably expect this positive trend with respect the information base to continue as initiatives to gather data, through surveys and other means, are constantly improving in terms of quality, reliability and coverage.
In order to maximize comparability of the results, missing data (see
Appendix B) were handled with common techniques: (i) case deletion, (ii) single imputation or (iii) multiple imputation [
24]. Mean substitution of missing data, correction factors, or replacement of missing data from other countries with similar MEPI values were tried by data imputation, yet without yielding sufficiently robust results.
The cooking dimension is composed of two elements, i.e., cooking fuel and indoor pollution. Older datasets include only the elements characterizing types of fuel, whereby the more recent surveys include information pertaining to indoor pollution. In such cases, missing data are treated with case deletion with the corresponding adjustments in the weighting structure of the index, as the best possible approximation.
The MEPI is computed with the maximal granularity to exploit the richness of data available. In instances where information on indoor pollution is not available, the data on the fuel type is used as the sole, and arguably imperfect, proxy for the cooking dimension. Countries for which both elements are missing or incomplete are excluded from the analysis. The bias introduced through this manipulation has been tested to ensure that the distortion remains minor. To this purpose, the MEPI was calculated with both cooking elements, as well as with only the element about the fuel and the adjusted weighting structure, for countries with the complete dataset. The difference in the MEPI score ranged between 5% and 15 % (see
Appendix C).
Similarly, the indicator for mobile phones is unavailable in certain cases, mostly in datasets prior to 2005, thus potentially affecting the time series analysis. However, the literature on the subject indicates that mobile phone penetration in 2004 and before was relatively low,
i.e., only 10%, in sub-Saharan Africa [
25]. Therefore, the indicator on landlines alone is considered as valid proxy for the dimension on communication in those specific cases.
4. Results and Discussion
The MEPI was calculated for countries for which data was available and deemed reliable. The results were calculated arbitrarily setting the multidimensional energy poverty cut-off k to 0.3 [
18]. The numerical results of the MEPI, including details on the headcount ratio and intensity for the countries considered, can be found in
Appendix A.
Figure 1 presents an overview of the results.
Figure 1.
Multidimensional Energy Poverty Index (MEPI).
Figure 1.
Multidimensional Energy Poverty Index (MEPI).
The countries are classified according to the degree of energy poverty, ranging from countries with acute energy poverty (MEPI > 0.7), to countries with low degree of energy poverty (MEPI < 0.3). Countries suffering more severely from energy poverty are located in sub-Saharan Africa (listed in chronologically): Kenya, Sierra Leone, Timor-Leste, Uganda, Guinea, Malawi, Rwanda, Madagascar, Tanzania, Mozambique, Benin, Mali, Liberia, Democratic Republic of Congo, Ethiopia, Burundi, Niger), and South-East Asia: Bangladesh, Timor-Leste.
The results also show low to moderate energy poverty levels in Latin America and the Caribbean, as well as low in Northern Africa.
4.1. The Determinants
A more detailed analysis is undertaken for selected countries. We focus on Africa, where energy poverty is critical, and select countries with comparable datasets (see
Section 2 for details) with the objective of deriving insights from the structure and selected determinants of energy poverty in those countries.
Table 2 presents the results of the MEPI and its two main components,
i.e., the headcount ratio and intensity, as well as the electrification rate and the rate of modern cooking fuel, which are derived from the respective indicators.
Looking at these individual indicators provides additional insight. We select Zambia, which has the median MEPI value of the sub-set of countries, as the benchmark for the comparison. We note that in the case of Namibia, whilst the MEPI is significantly lower (colored dark blue), the difference with the benchmark is primarily due to a much lower headcount ratio, i.e., fewer energy poor in relative terms, whereas the intensity of energy poverty is not significantly lower. Interesting is the case of Sierra Leone, where the ratio of energy poor (headcount) is significantly higher (colored dark red), whereas the intensity is actually lower than the benchmark. This means that a very large share of the population in Sierra Leone is considered to be energy poor under this framework of analysis as energy poor, but that segment of energy poor is not quite as adversely affected, on average, than the energy poor in Zambia.
Table 2.
Comparison of energy poverty and selected indicators(Color code: light blue: better; dark blue: much better; light red: worse; dark red: much worse).
Table 2.
Comparison of energy poverty and selected indicators(Color code: light blue: better; dark blue: much better; light red: worse; dark red: much worse).
| Country | Year | H | A | MEPI | Electrification rate | Use of modern cooking fuels rate |
|---|
| Namibia | 2006-2007 | 0.66 | 0.72 | 0.47 | 39% | 35% |
| Lesotho | 2009 | 0.84 | 0.64 | 0.54 | 16% | 34% |
| Nigeria | 2008 | 0.79 | 0.71 | 0.56 | 48% | 21% |
| Zambia | 2007 | 0.87 | 0.78 | 0.66 | 21% | 16% |
| Sierra Leone | 2008 | 0.97 | 0.75 | 0.73 | 11% | 0% |
| Malawi | 2010 | 0.97 | 0.79 | 0.77 | 9% | 2% |
| Madagascar | 2008-2009 | 0.98 | 0.81 | 0.8 | 17% | 1% |
In Madagascar, despite the fact that the overall MEPI is much higher than in Zambia, the electrification rate is comparable; however, Madagascar performs much worse in other indicators, such as in that of modern cooking facilities. In a similar manner, while Lesotho is significantly better off than Zambia in terms of the overall energy poverty according to the MEPI, the proportion of its population with access to electricity is notably lower than the benchmark. Nevertheless, the proportion of its population with access to modern cooking fuels is more than double that of Zambia.
This sort of analysis enables the exploration of some of multiple facets that constitute the inherently intricate concept of energy poverty. Unlike many other tools designed to evaluate energy access, the MEPI allows for detailed analysis and sheds light on various aspects of energy poverty. It allows for exhaustive cross-country analysis on the individual factors taken into consideration. The additional insight generated from such analyses is rather powerful and potentially very useful in adequately positioning and focusing interventions. It is equally valuable for project/program monitoring and evaluation purposes as it also allows identification of successful and less successful strategies with respect to particular aspects of energy access.
4.2. Trend over Time
To track energy poverty over time, the MEPI is computed with datasets from various versions of the household surveys, when available. The trends for the headcount ratio and the intensity are plotted separately.
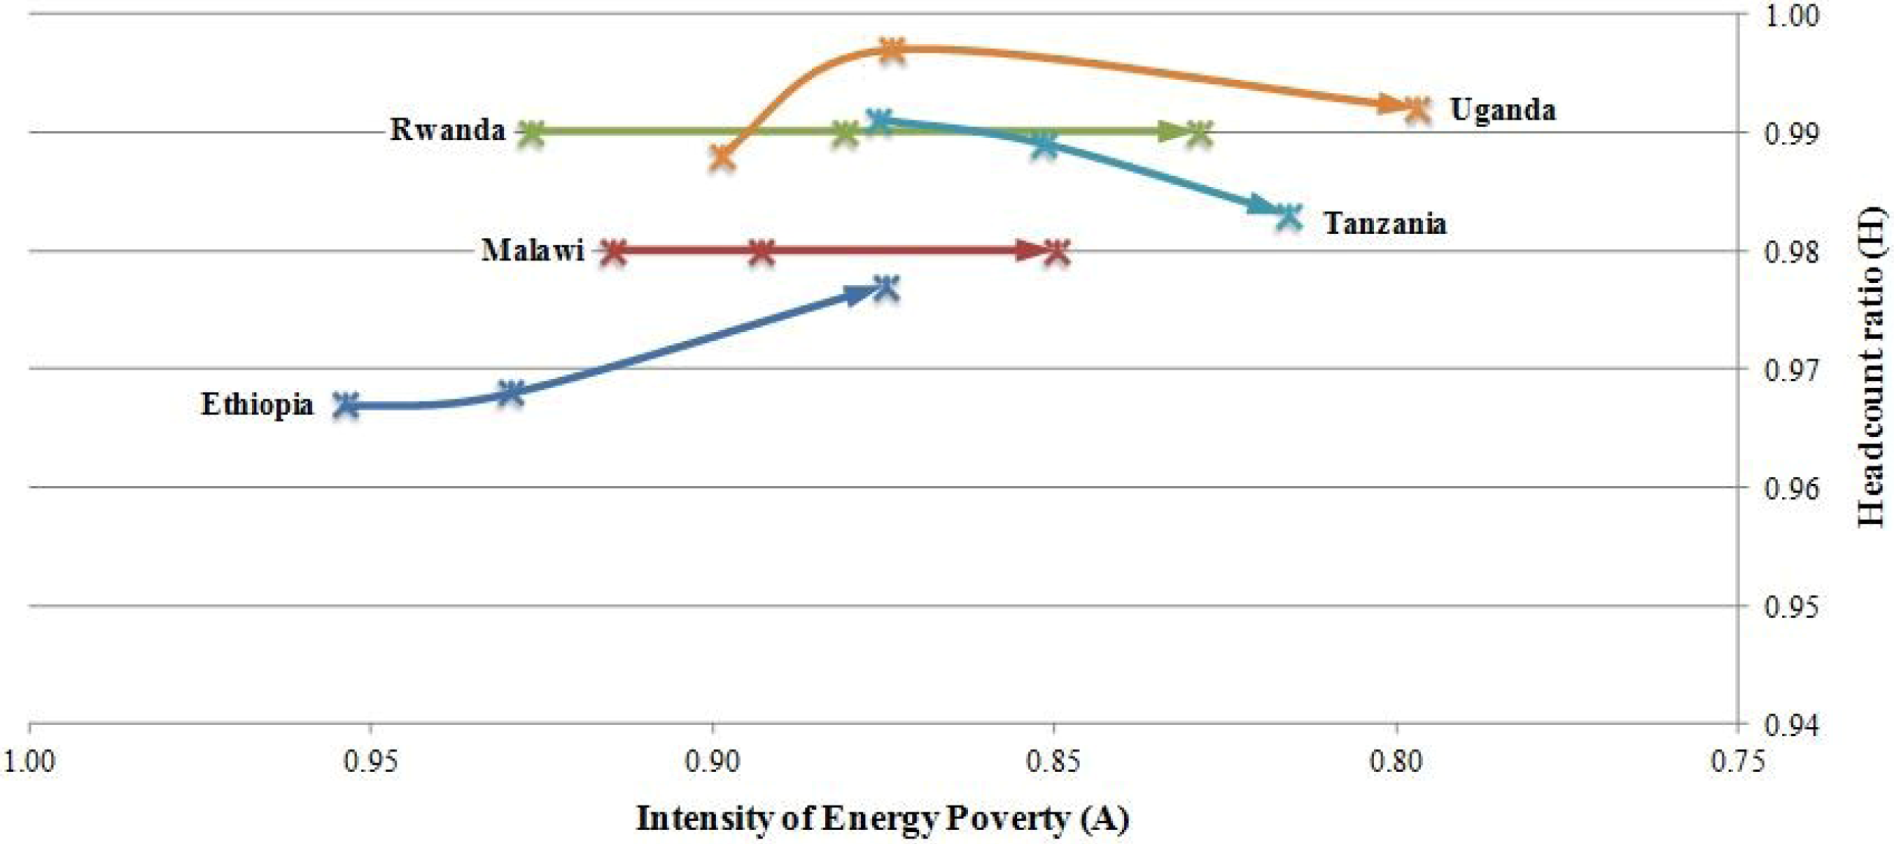
Figure 2 thus shows the H-A values for countries with three consecutive DHS datasets, specifically IV, V and IV(datasets IV: years 2000–2005; datasets V: years 2004–2008; datasets VI: years 2008–2011).
The trends consistently indicate that the bulk of the change in the MEPI is imputable to changes in the intensity of energy poverty, as opposed to a modification of the headcount ratio. Even for countries featuring a slight improvement in the headcount (e.g., Burkina Faso and Lesotho), the bulk of the change in the MEPI is imputable to the change in the intensity.
Figure 2.
Evolution over time of Headcount Ratio (H) and Intensity of Energy Poverty (A) for selected countries.
Figure 2.
Evolution over time of Headcount Ratio (H) and Intensity of Energy Poverty (A) for selected countries.
Concretely, it indicates that in line with existing literature in the subject, the number of energy poor, if considered in aggregated and relative terms, tends to remain constant or almost constant in a number of sub-Saharan countries. In fact, considering population growth, more people are energy poor nowadays than 10 years ago in those countries; the reason being that, while electrification efforts are put in place, they often result in electrification rates falling below population growth rates.
The novel insight here is that the intensity of energy poverty consistently decreases over time in all countries considered, i.e., the energy poor segments of population have obtained more and more access to modern energy services over the past couple of years. This is even the case in Ethiopia, where the trend indicates an increase of the overall share of energy poor. This finding is significant in that it demonstrates some progress with regard to alleviating energy poverty in sub-Saharan countries. The tools commonly used to assess energy access focus on the number of people, in absolute or relative terms, being afflicted and thus fail to capture this positive trend.
To ensure that this positive trend is not an artifact of the methodology, we vary the cut-off, k between 0.2 and 0.5 as sensitivity analysis. However, regardless of the k coefficient, the pattern observed clearly remains.
As an aside, we also note that previous analysis [
18] indicated that the improvement in the MEPI over a given timeframe is greater in countries where the starting level of energy poverty is lower.
5. Conclusions
The value addition to the literature in the field of the analysis presented herein is twofold. Firstly, the MEPI methodology, a tool designed to capture and evaluate a set of energy deprivations that affects a person or household, is further developed and refined. Secondly, the tool is applied to all developing countries around the world for which data are available, thus extending the analysis. We showcase illustrative examples of the detailed analyses that can be carried out.
The results include a cross-country analysis of energy poverty at aggregated level. We also discuss findings at the level of the indicators forming the composite index in order to demonstrate the diversity of the energy poverty landscape between countries. We also look at the evolution of energy poverty over time, making use of the latest generation of data made available.
Consisting of both an element reflecting the relative number of energy poor and another representing the intensity of that energy poverty, the MEPI allows generation of new insights. Particularly noteworthy is the positive trend in the reduction of energy poverty intensity we find over the recent years in selected sub-Saharan countries.
Indeed, the metrics commonly used in assessing energy access focus on the headcount, that is the number of people, in absolute or relative terms, afflicted by a particular dimension of energy poverty. By virtue of its construction and underlying data, the MEPI can be used to generate information on the intensity of energy poverty, in addition to its incidence. It is in this particular dimension that we consistently observe improvements in all five countries analyzed.
This finding is of high relevance to policy makers and indicates that past and current efforts to promote access to modern energy services are may be paying off; in those countries, the energy poor are, on average, less energy deprived now when compared with 10 years ago. In other words, the population has, on average, increased access to specific basic (modern) energy services and/or access to an increased number of basic (modern) energy services.
A detailed understanding of the energy poverty situation is required for the development of effective policy interventions. Exploratory work on attempting to link the results of the MEPI with policy analysis is introduced. We believe that research on this deserves additional attention and has the potential to assist in identifying effective (and ineffective) policies and strategies.
Further, it would be useful to develop systems models to understand the techno-economic requirements for changing MEPI values. This could be used to help inform trade-offs necessary as well as the costs associated with the challenge of reducing energy poverty, both in terms of the number of people affected as well as the intensity of energy poverty.
Finally, while useful in overcoming key challenges associated with simplistic consumption or access indicators, detailed analysis on energy poverty is constrained by data paucity. There is a strong need to map out data gaps, potential other proxies, as well as to orientate future data gathering activities.


 .
.  represents the sum of weighted deprivations suffered by person i.
  . The MEPI captures information on both the incidence and the intensity of energy poverty, and is defined as MEPI = H × A.
