Article

Infrared Thermography Assessment of Thermal Bridges in Building Envelope: Experimental Validation in a Test Room Setup

by
Francesco Bianchi
*,
Anna Laura Pisello
,
Giorgio Baldinelli
and
Francesco Asdrubali
CIRIAF, University of Perugia, Via G. Duranti, 67, Perugia 06125, Italy
*
Author to whom correspondence should be addressed.
Sustainability 2014, 6(10), 7107-7120; https://0-doi-org.brum.beds.ac.uk/10.3390/su6107107
Submission received: 26 June 2014 / Revised: 2 October 2014 / Accepted: 9 October 2014 / Published: 16 October 2014

Abstract

:
Thermal infrared imaging is a valuable tool to perform non-destructive qualitative tests and to investigate buildings envelope thermal-energy behavior. The assessment of envelope thermal insulation, ventilation, air leakages, and HVAC performance can be implemented through the analysis of each thermogram corresponding to an object surface temperature. Thermography also allows the identification of thermal bridges in buildings’ envelope that, together with windows and doors, constitute one of the weakest component increasing thermal losses. A quantitative methodology was proposed in previous researches by the authors in order to evaluate the effect of such weak point on the energy balance of the whole building. In the present work, in-field experimental measurements were carried out with the purpose of evaluating the energy losses through the envelope of a test room experimental field. In-situ thermal transmittance of walls, ceiling and roof were continuously monitored and each element was characterized by its own thermal insulation capability. Infrared thermography and the proposed quantitative methodology were applied to assess the energy losses due to thermal bridges. The main results show that the procedure confirms to be a reliable tool to quantify the incidence of thermal bridges in the envelope thermal losses.

1. Introduction

The energy requirement for buildings heating is progressively decreasing in the European Union thanks to the implementation of the new directives driving energy efficiency in construction [1]. The growing interest in energy saving in the building sector is producing increasingly sophisticated investigation methods [2,3,4,5,6,7,8] and solutions consisting of new techniques [9] and materials for building envelope [10,11,12,13,14,15]. Despite the application of highly insulating materials for building envelope, the overall building thermal performance could still be affected by local phenomena, e.g., thermal bridges, responsible for significant thermal losses [16]. In fact, thermal bridges are those elements or areas that are characterized by higher thermal conductance with respect to the homogeneous multilayer envelope structure, where the heat flux is supposed to be perpendicular to the surface, e.g., wall or ceiling [16]. Several studies showed that thermal bridges may cause up to 30% of the extra-thermal losses through the envelope in winter, so increasing the energy requirement for heating [17]. Other effects of these local weak spots is the presence of differentially cooled areas around thermal bridges and the consequent development of molds and fungi, also producing bad indoor air quality conditions [18,19,20]. In order to investigate these phenomena through in-field assessment, the IR thermography analysis represents one of the most reliable qualitative tools currently applied in existing buildings [21]. Nevertheless, the reliability of this tool is influenced by many factors related to operators’ awareness and other external environment conditions [20,21]. Therefore, this work makes use of the results of a previous quantitative study, aimed at defining the Incidence factor of the thermal bridges and its numerical validation, with the purpose to quantify the effect of thermal bridges in a continuous monitored dedicated full-scale building experimental setup.

2. Motivation and Purpose of the Work

The development of innovative high performance materials for buildings envelopes indirectly increases the influence of local weaknesses such as geometrical and physical thermal bridges, where the continuity of these systems is compromised [22]. In particular, the effect of windows and doors [23] and the presence of structural elements affect the homogeneity of the thermal characteristics of walls and ceilings insulation [24]. IR thermography represents an effective diagnosis method to detect these non-homogeneous elements [25]. Nevertheless, to be used as quantitative tool as the purpose of this work, several variables should be taken into account. For instance, the effect of reflected radiation, the influence of emissivity estimation, and an overall sensitivity analysis about the influencing parameters have to be considered in this analysis [26,27,28]. For the presence of many variables affecting the reliability of the infrared thermography procedure, it is difficult to operate a quantitative analysis by means of this method. In addition, the quality of the results are also affected by key operator’s choices such as, for instance, the infrared camera exposure time. Previous contributions successfully evaluated the heat losses imputable to thermal bridges by means of thermography applied to buildings’ external surfaces. Interesting results were reached through the integration within numerical simulation environment [28,29,30]. Asdrubali et al. in [31] introduced a new quantitative parameter aimed at expressing the thermal bridge effect starting from the analysis of thermography images in buildings. In this way, the authors calculated the incidence factor of thermal bridges Itb and they proposed a methodology of image analysis in order to investigate the flux within the thermal bridge area and the so called undisturbed flux, in the perpendicular direction with respect to the envelope surface. The only measured required parameters consist of the indoor air temperature and the local heat flows in the zones of the envelope far from the thermal bridges. Therefore, they validated the proposed method by mean of a finite volume analysis and an in-lab setup. Starting from these results, the purpose of this work consists of a complete investigation of the combined effect of different types of thermal bridges located within a full-scale continuously monitored construction, dedicated to this research [32,33]. In order to investigate the correspondence between the proposed numerical procedure with respect to real data at building scale, a prototype building facility was continuously monitored in winter period by collecting weather conditions, microclimate behavior and heating energy consumption.

3. Methodology

The research methodology consists of the integration of (i) in-field thermography; (ii) continuous monitoring of indoor-outdoor conditions; (iii) data post-processing and (iv) final quantitative analysis. To this purpose, a continuous monitoring setup consisting of one prototype building with a couple indoor-outdoor monitoring stations was dedicated to the study. Section 3.1 deals with the description of the test room dedicated building. Section 3.2 reports the thermal bridges investigation procedures applied to the prototype building.

3.1. Test-Room Setup

The monitored building consists of a 10 m2 ground surface with one window on the South oriented façade (Figure 1b) and a door in the North oriented façade (Figure 1a). The roof structure is horizontal with bitumen waterproof membrane finishing. The opaque envelope presents a continuous insulation layer, positioned on the external side of the structural reinforced concrete frame. The multilayer envelope information is reported in Table 1 along with the calculated transmittance values. The indoor-outdoor monitored parameters are reported in Table 2.
Figure 1. Pictures of the test-room facilities used in the experiment.
Sustainability 06 07107 g001
Table 1. Characteristics of the test-room.
EXTERNAL WALL
ThicknessConductivity
1. Plaster dense0.020 m0.50 W/mKThermal transmittance
(surface-to-surface)
0.29 W/m2K
2. EPS insulation0.090 m0.04 W/mK
3. Brickwork, inner leaf0.300 m0.27 W/mK
4. Gypsum plastering0.020 m0.40 W/mK
ROOF
ThicknessConductivity
1. Bitumen sheet0.010 m0.23 W/mKThermal transmittance
(surface-to-surface)
0.25 W/m2K
2. Mineral wool insulation0.100 m0.04 W/mK
5. Aerated concrete slab0.200 m0.16 W/mK
5. Gypsum plastering0.015 m0.40 W/mK
GROUND FLOOR
ThicknessConductivity
1. Linoleum0.004 m0.17 W/mKThermal transmittance
(surface-to-surface)
0.30 W/m2K
2. Glass fiber slab0.100 m0.04 W/mK
5. Cast concrete0.300 m1.13 W/mK
Table 2. Indoor-outdoor monitored parameters.
INDOOR MONITORING STATION
Air velocity [m/s]
Turbulence intensity [%]
Mean radiant Temperature [°C]
Air temperature [°C]
Air relative humidity [%]
Surface temperature of internal and external side of the façade [°C]
Surface temperature of internal and external side of the roof [°C]
Thermal flux through the north external wall and through the roof [W/m2]
Global radiation reflected by the roof [W/m2]
Energy consumption [kWh]
OUTDOOR MONITORING STATION
Wind velocity [m/s]
Prevailing wind direction, wind direction [°]
Dry bulb temperature, Tout [°C]
Air relative humidity [%]
Sunshine duration (referred to a certain threshold) [0–1]
Direct radiation from the sun [W/m2]
Global solar irradiance [W/m2]
Rain fall [mm]

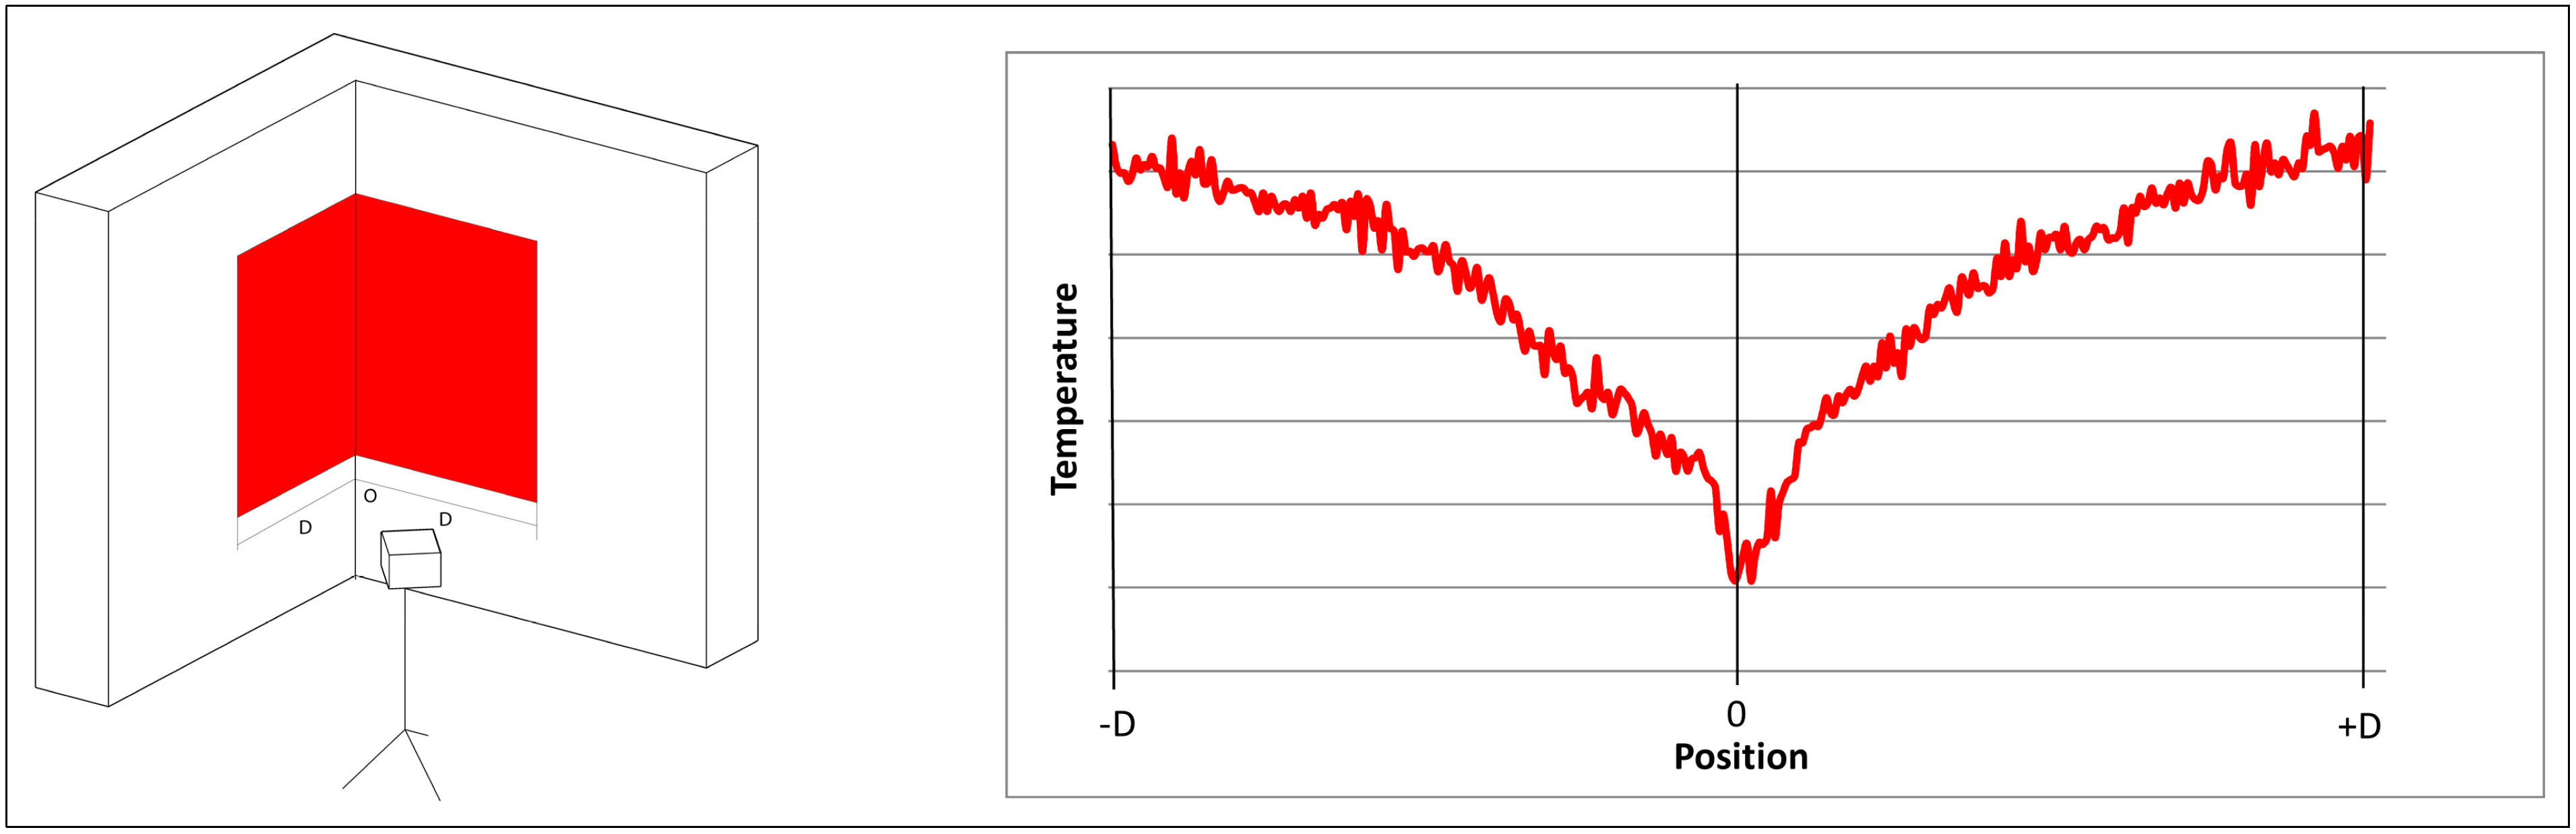
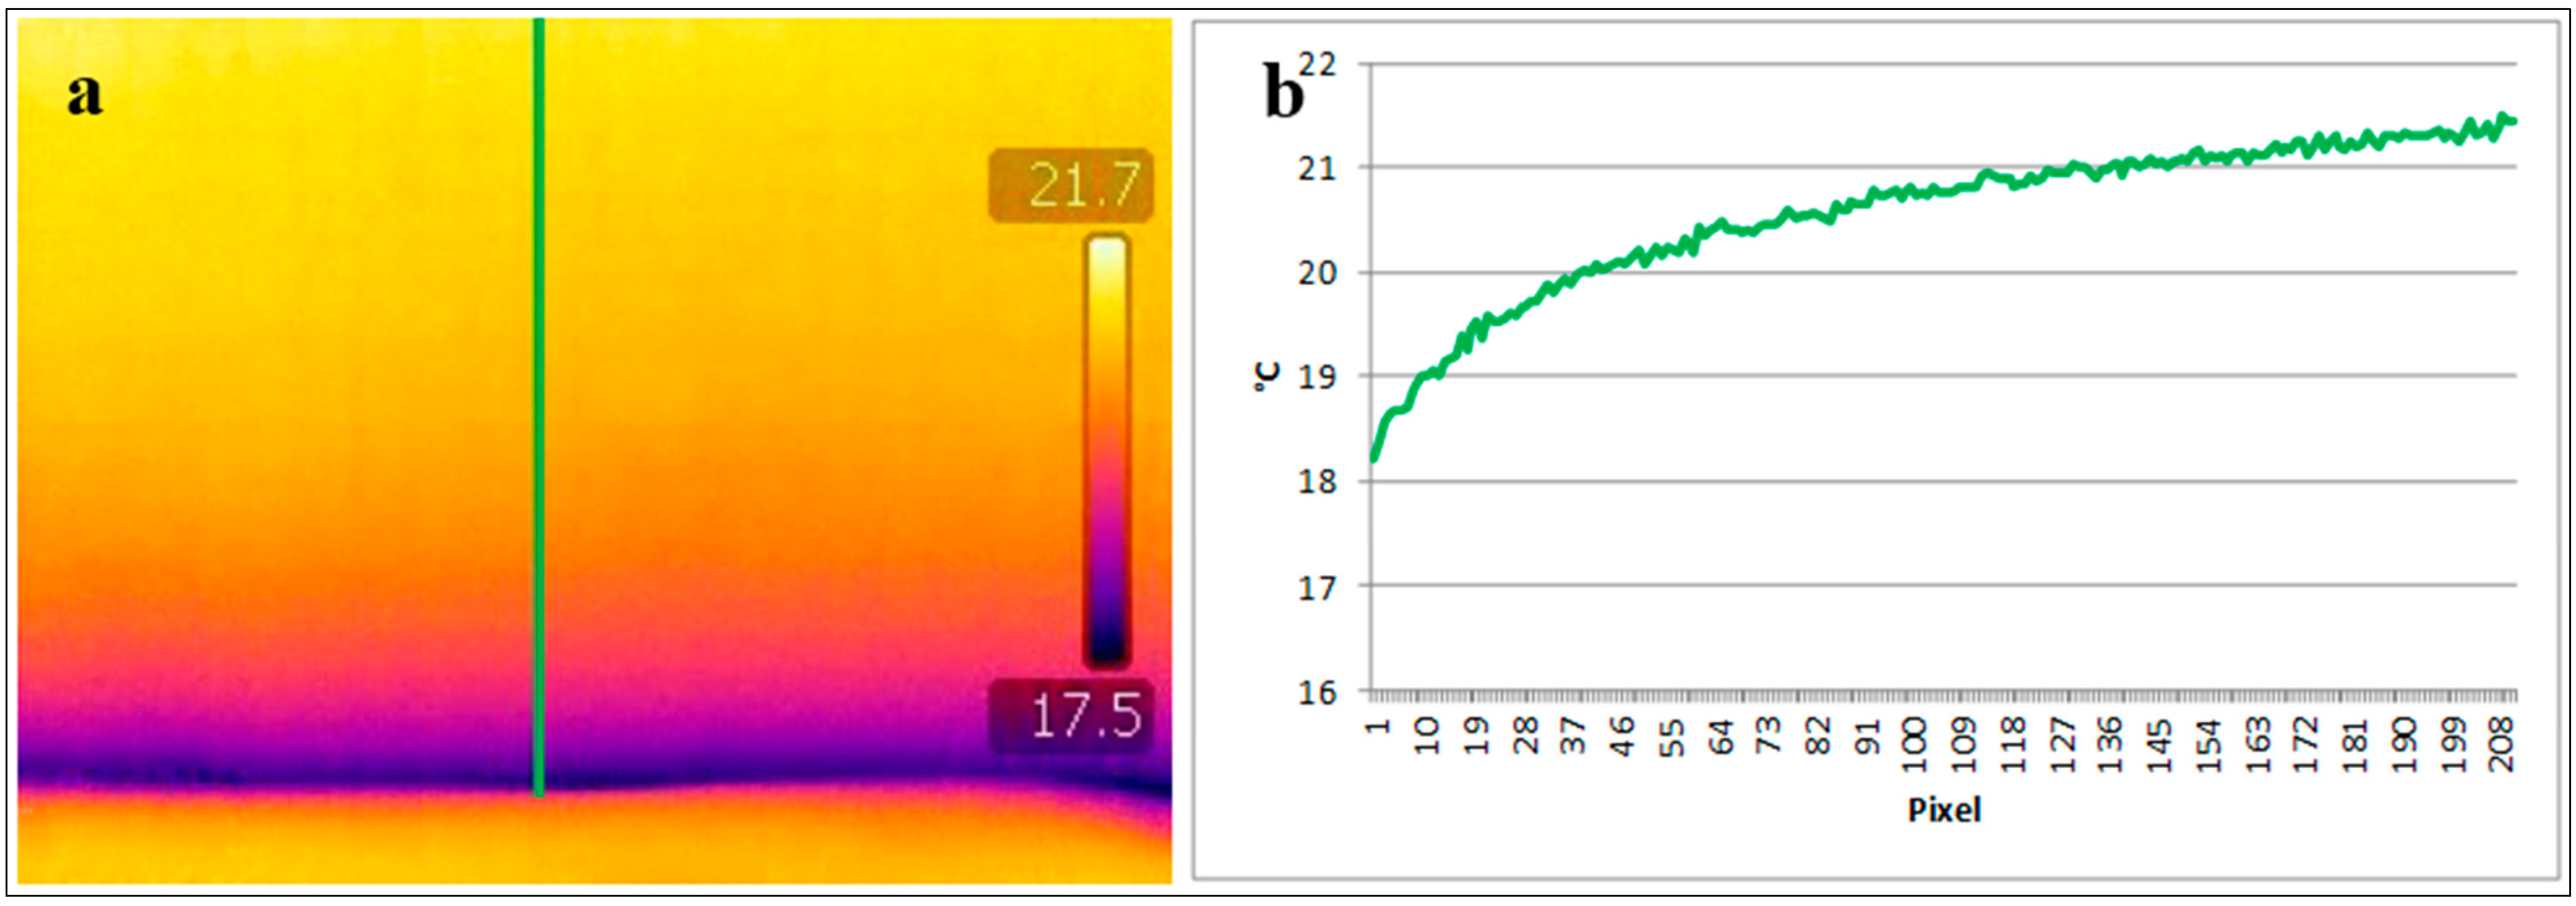
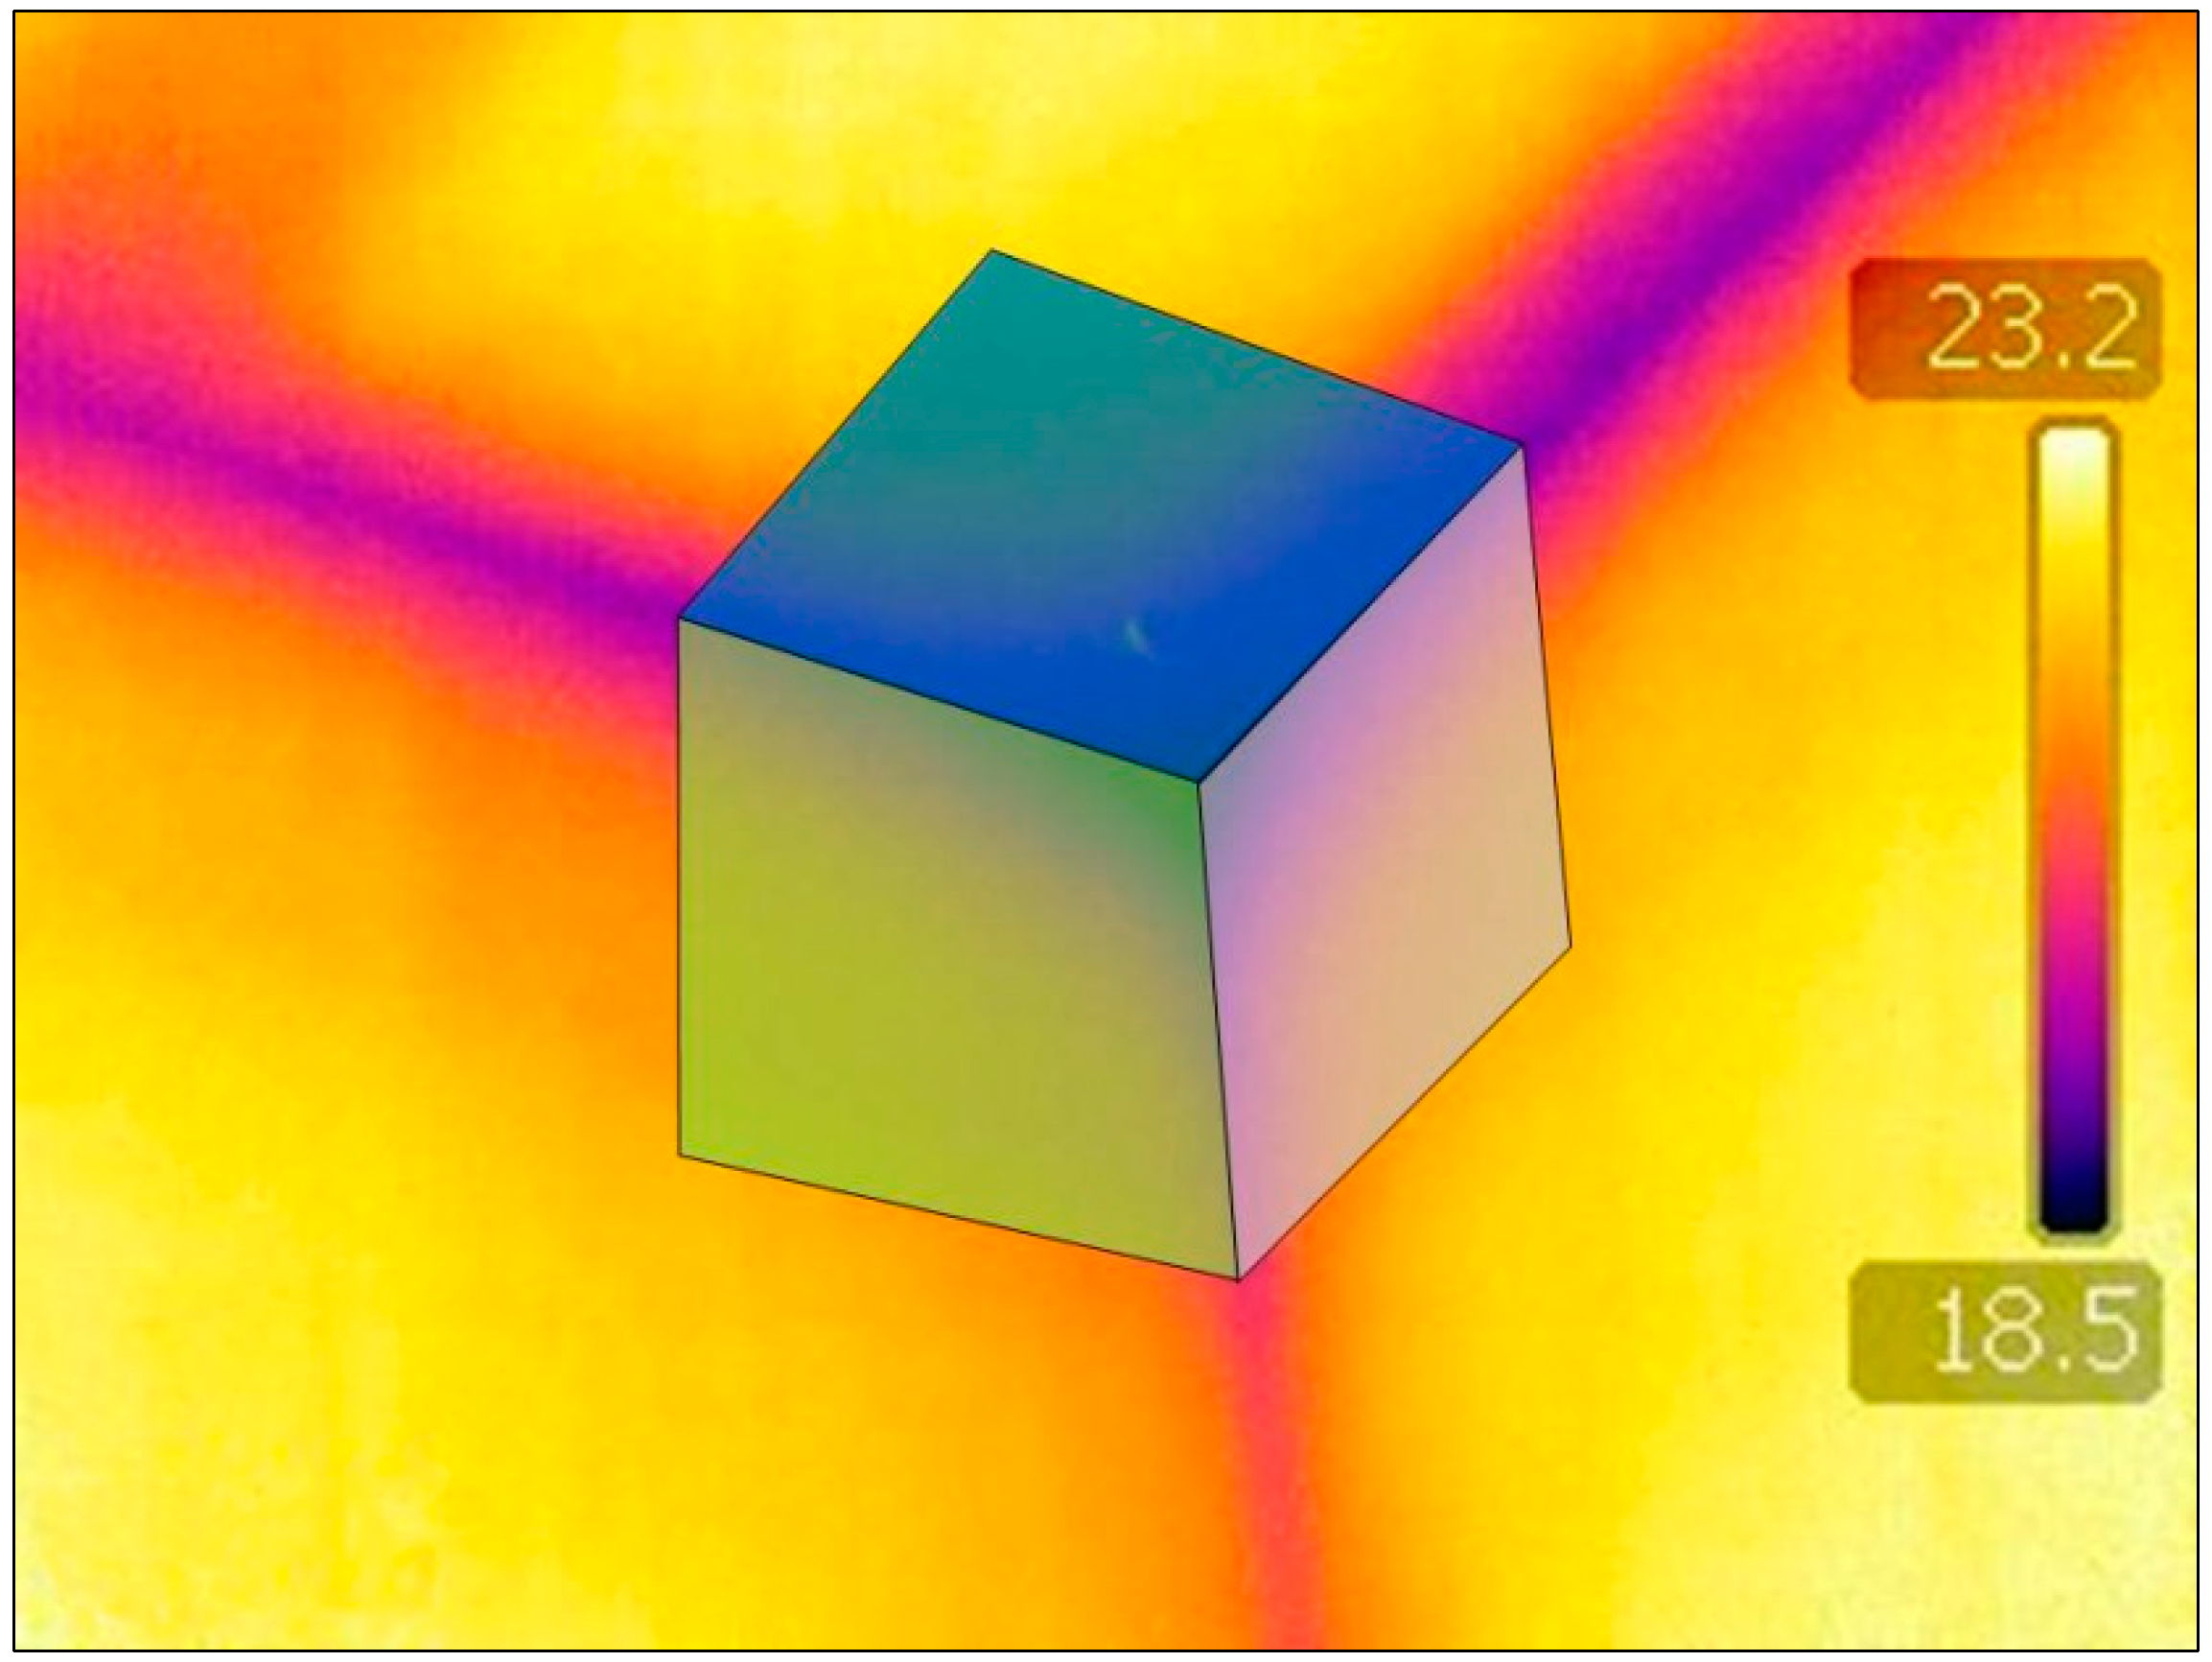
3.2. Thermal Bridges Evaluation by Means of Infrared Thermography

Starting from the application of the methodology proposed in [31], a quantitative evaluation was carried out on the thermal bridges of the full scale prototype building, through the definition of the index Incidence factor of the thermal bridge Itb.
Each IR image shows the surface temperature of every pixel by taking into account the radiation emitted from each examined surface. Therefore, the entire thermal field of the area covered by the detector optic is detailed.
The definition itself of a thermal bridge [34] highlights that it represents a zone whose thermal properties are significantly different from the ones of the rest of the envelope. As a consequence, the temperature of the internal side of the building envelope is characterized by considerable thermal discontinuities, while, in the part of the structure where the heat flux can be considered as one-dimensional, the same superficial temperature is supposed to be almost homogeneous. In this “undisturbed” zone, the temperature is a function of the thickness and thermal conductivity of the layers in the wall. For example, considering a structural thermal bridge constituted by an infinitely high wall right-angle, the pertinent thermogram shows a minimum temperature level in correspondence of the angle. Moving towards the homogeneous zone of the wall, the temperature profile progressively describes an asymptote, until the effect of the thermal bridge is supposed to be negligible (Figure 2).
Figure 2. Example of an angular thermal bridge and relative thermogram output.
Sustainability 06 07107 g002
Itb is strongly linked to the temperature profile as it defines higher thermal losses in the pertinent zone of the building with respect to other homogeneous areas.
Equation (1) shows the mathematical meaning of the proposed index, describing the ratio between the thermal loss calculated from the measured temperature in the IR images and the hypothetical thermal loss of the same area in the wall, when calculated without considering the effect of thermal bridges.
Sustainability 06 07107 i001
With the hypothesis of steady-state conditions and constant convective coefficient (htb_i = h1D_i), the index is the ratio between the temperature difference in the real case and in the hypothetical scenario where the thermal bridge effects are neglected.
The benefit of having both the temperature values in the two considered areas in one same IR image, i.e., the thermal bridge area and the homogeneous one, allows to minimize further sources of error related to non-contemporary measurements and to the influence produced by different viewed angles by the IR camera. Moreover, the capture of an only one IR image avoids the influence of the emissivity dependence from surface distance and angle of view. The ratio between the two fluxes considered in the definition of Itb, and in particular the direct definition of T1D_is from the thermogram, results useful to normalize the analysis, further simplifying experimental evaluations.
This quantitative phenomenon could also be described as a sort of increase in the thermal transmittance U1D of the undisturbed zone. Therefore, considering the thermal bridge effect, in the hypothesis of stationary conditions, the value of the thermal transmittance Utb can be written as follows (2):
Utb = U1D × Itb

4. Discussion of the Results

4.1. Envelope Thermal Performance

A hypothetical specific heat loss through the test-room envelope was firstly assumed by neglecting the effect of thermal bridges. The thermal transmittance values were experimentally measured through the continuous monitored data. Non negligible differences between calculated and measured values were found, even if good thermal properties of the construction were observed.
The opaque envelope was divided in five areas with different thermal performance characteristics, without considering the effect of thermal bridges in the first phase of the analysis. The five areas consist of (i) vertical walls; (ii) roof; (iii) ground floor; (iv) door; and (v) window. The overall heat losses through the test-room resulted equal to 27.34 W/K. A time interval with relatively constant conditions, i.e., with relatively low effect of solar radiation and indoor thermal discontinuities, was chosen as reported in Figure 3. The overall heat losses parameter previously showed and the internal and external temperatures acquired during that period (10 h long interval) were useful to calculate the total energy heat losses value that corresponded to 4.349 kWh. Regarding the air infiltration losses, the standard exchange rate for natural ventilation of 0.3 volumes per hour was considered [35]. Therefore, the total thermal losses raised up to 30.11 W/K.
Figure 3. Thermal-energy profiles in the monitored period.
Sustainability 06 07107 g003

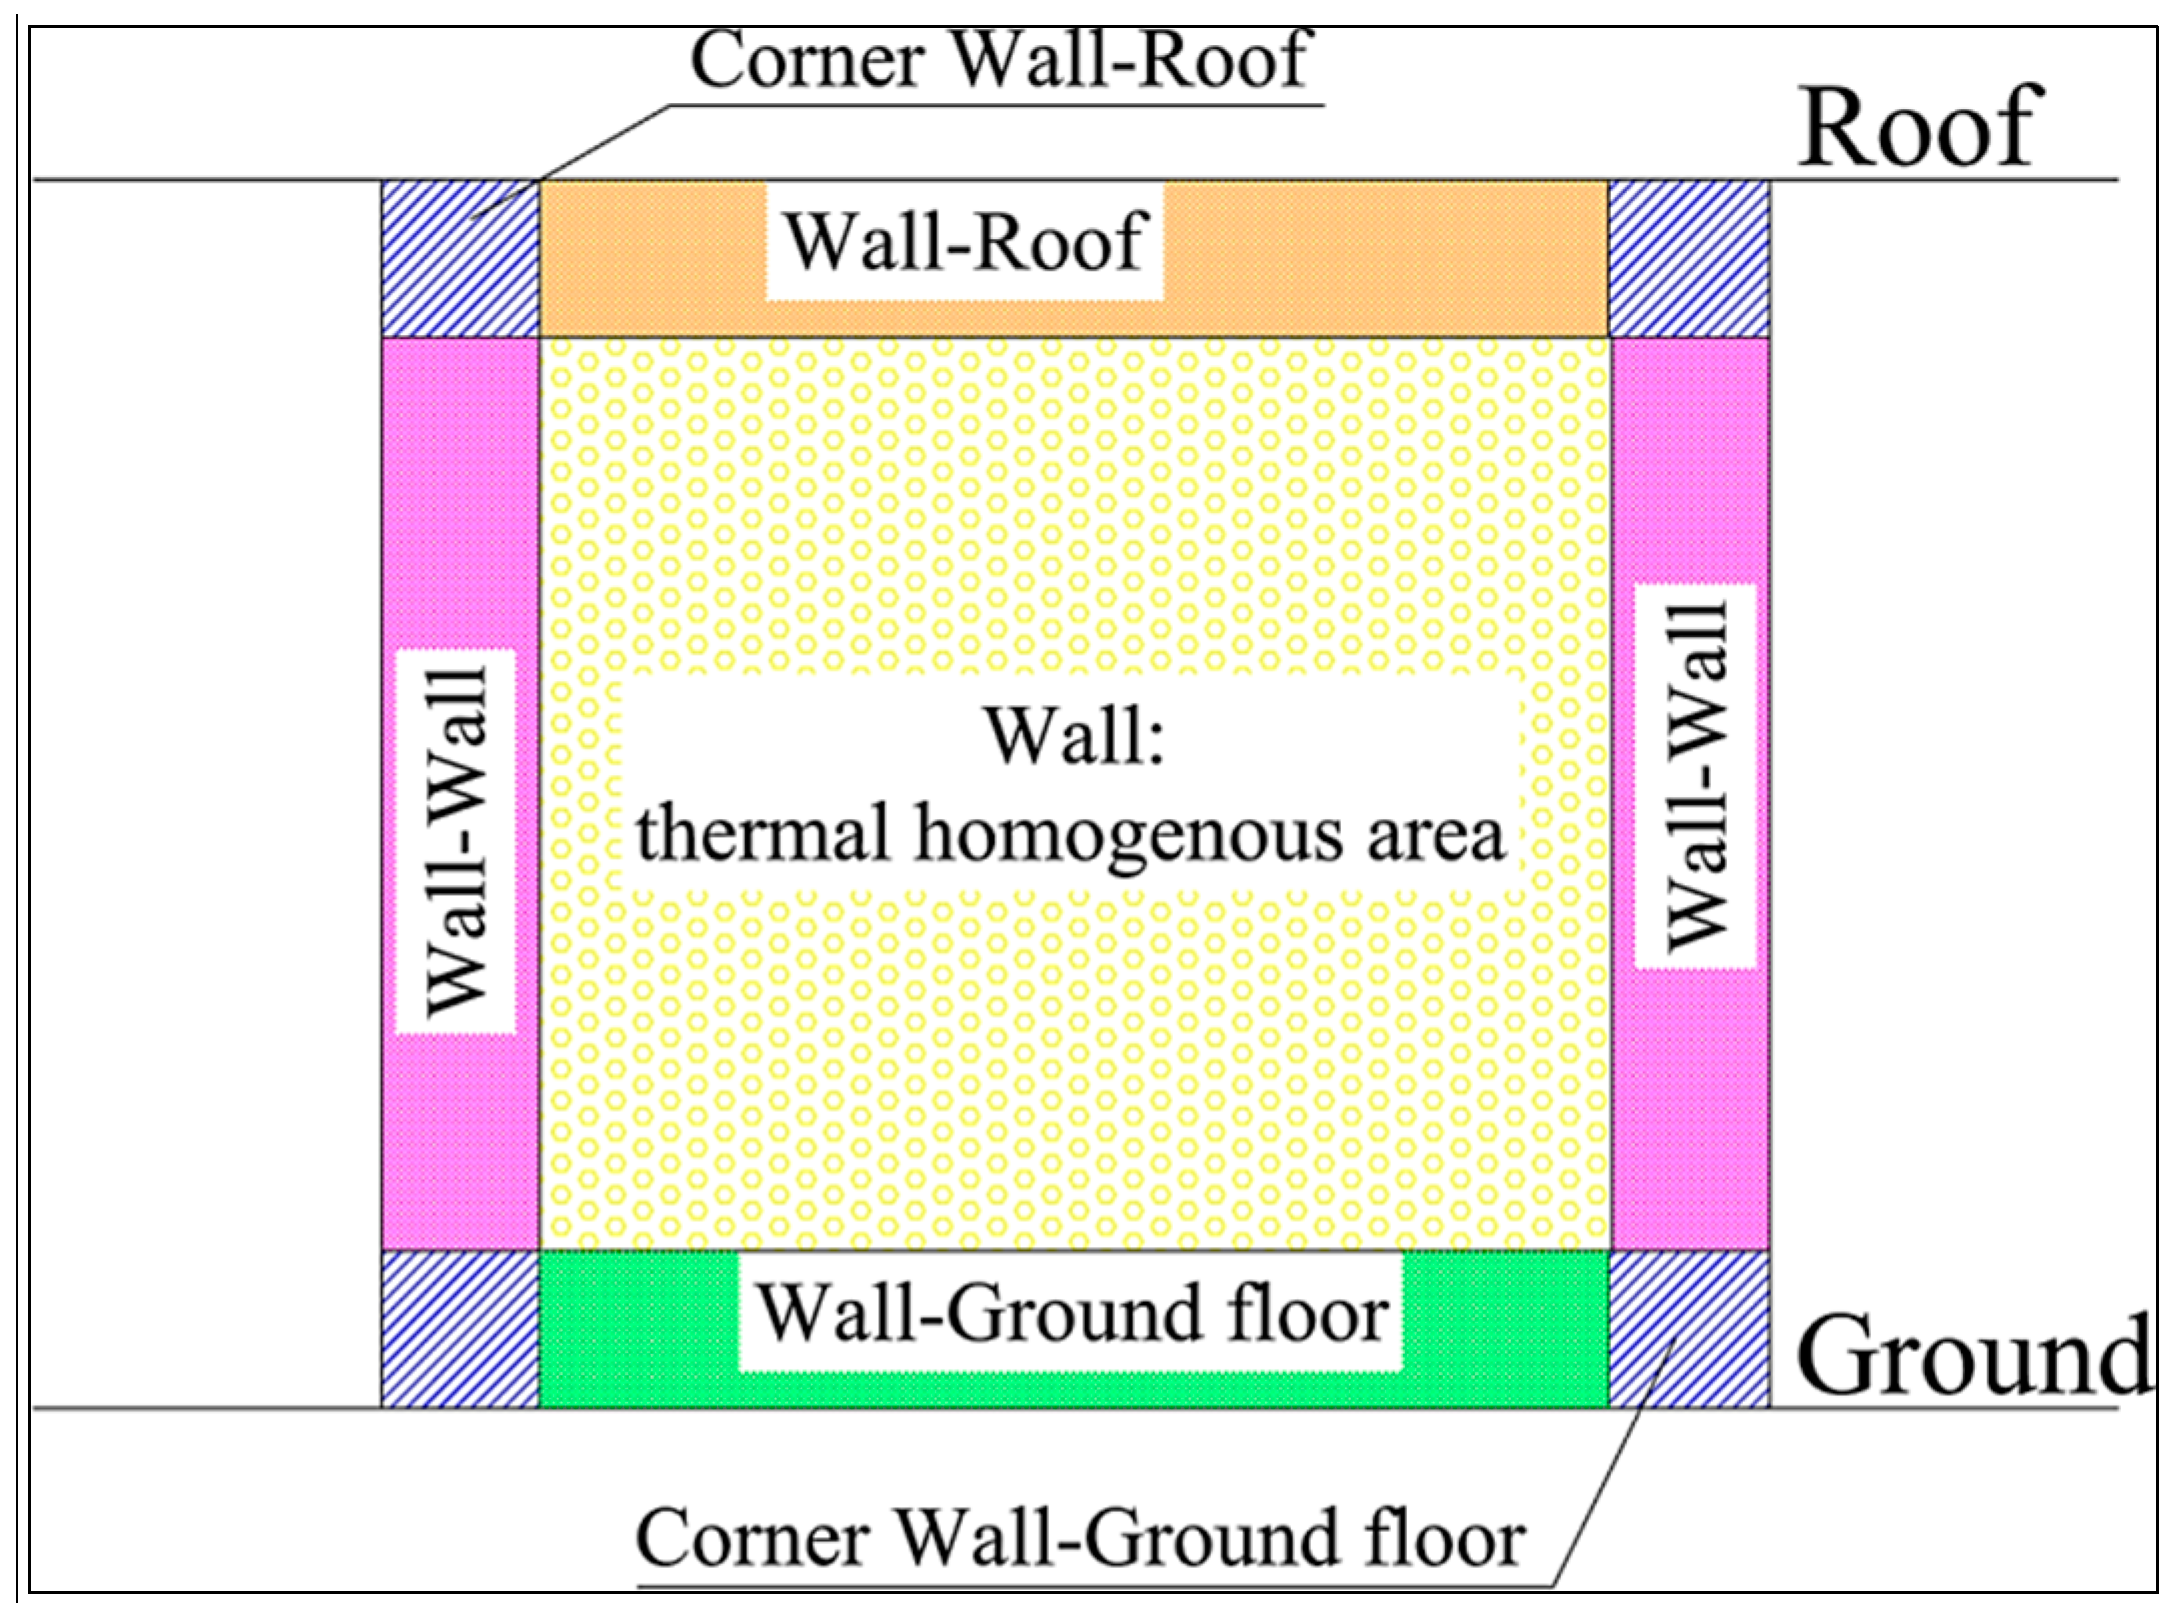
4.2. Analysis of Each Thermal Bridge Contribution

Firstly, each thermal bridge in the test-room building was classified and analyzed through IR imaging. The IR analyses allowed to identify the geometry and the area affected by the thermal bridge with respect to the homogeneous zone. The identified thermal bridge typologies are reported as follows:
(1)
Line between two walls (L-WW);
(2)
Corner between wall and roof (C-WR);
(3)
Corner between wall and ground floor (C-WG);
(4)
Line between wall and ground floor (L-WG);
(5)
Lines between clay elements and concrete elements in the roof ceiling structure (L-PT);
(6)
Line between wall and roof (L-WR);
(7)
Line between roof and wall (L-RW);
(8)
Lines between wall and door (L-WD);
(9)
Lines between wall and window (L-WI);
The evaluations of two thermal bridge typologies are reported in Figure 4 and Figure 5. Figure 4 represents the temperature profile defining the horizontal thermal bridge between the ground floor and the wall. The thermal profile along the line where the incidence factor of the thermal bridge is calculated is reported in Figure 4b.
Figure 4. IR thermography and thermal profile of the thermal bridge between ground floor and wall [36].
Sustainability 06 07107 g004
The IR analysis showed an average indoor air temperature of 23 °C (Ti), while the temperature in the homogeneous areas of walls was around 21.4 °C (T1D_is). Equation 1 was used to calculate the proposed index, resulting equal to 1.52 in a 0.290 m long line between the wall and the ground floor. This index was then multiplied by the interested area of the wall and by the measured wall transmittance in the areas with no thermal bridge, in order to evaluate the total thermal loss by taking into account the thermal bridge effect.
Regarding the second thermal bridge, i.e., the corner between two walls and the roof ceiling, the increase of heat loss was identified in the influenced areas of every structural element affected by C-WR. Figure 5 reports the considered areas.
Figure 5. IR thermography of the C-WR thermal bridge and the relative area of influence.
Sustainability 06 07107 g005
In this case, the Incidence factor of the thermal bridge refers to the overall area, and not only to the line length. Table 3 reports the incidence factor values of the nine identified thermal bridges.
Table 3. Values of Incidence factor of the thermal bridge of each identified thermal bridge.
Thermal BridgeItb
L-WW1.28
C-WR2.15
C-WG1.79
L-WG1.52
L-PT1.23
L-WR1.53
L-RW1.48
L-WD1.44
L-WI-
The nine incidence factors of the thermal bridge show the strong relation between the geometry and the thermal performance of the structures. Analyzing the L-type thermal bridges, the low value of the indexes becomes evident when the discontinuity is just created by a geometrical thermal bridge (L-WW) or a change of the layer materials (L-PT). On the contrary, the effect of the thermal bridge is amplified where both the conditions are verified (i.e., L-WG, L-WR). The C-type thermal bridges show different values due to the elements that define the corner: the ground presents less thermal losses thanks to the different boundary conditions, therefore, the temperature values in the pertinent area of the floor show a lower temperature decrease and the index for the C-WR thermal bridge results higher than the C-WG thermal bridge. The thermal bridge L-WI was considered to be negligible, since the IR analysis showed a good quality of the execution of these technical elements, with non-significant thermal deviations between the window and the wall along the line.

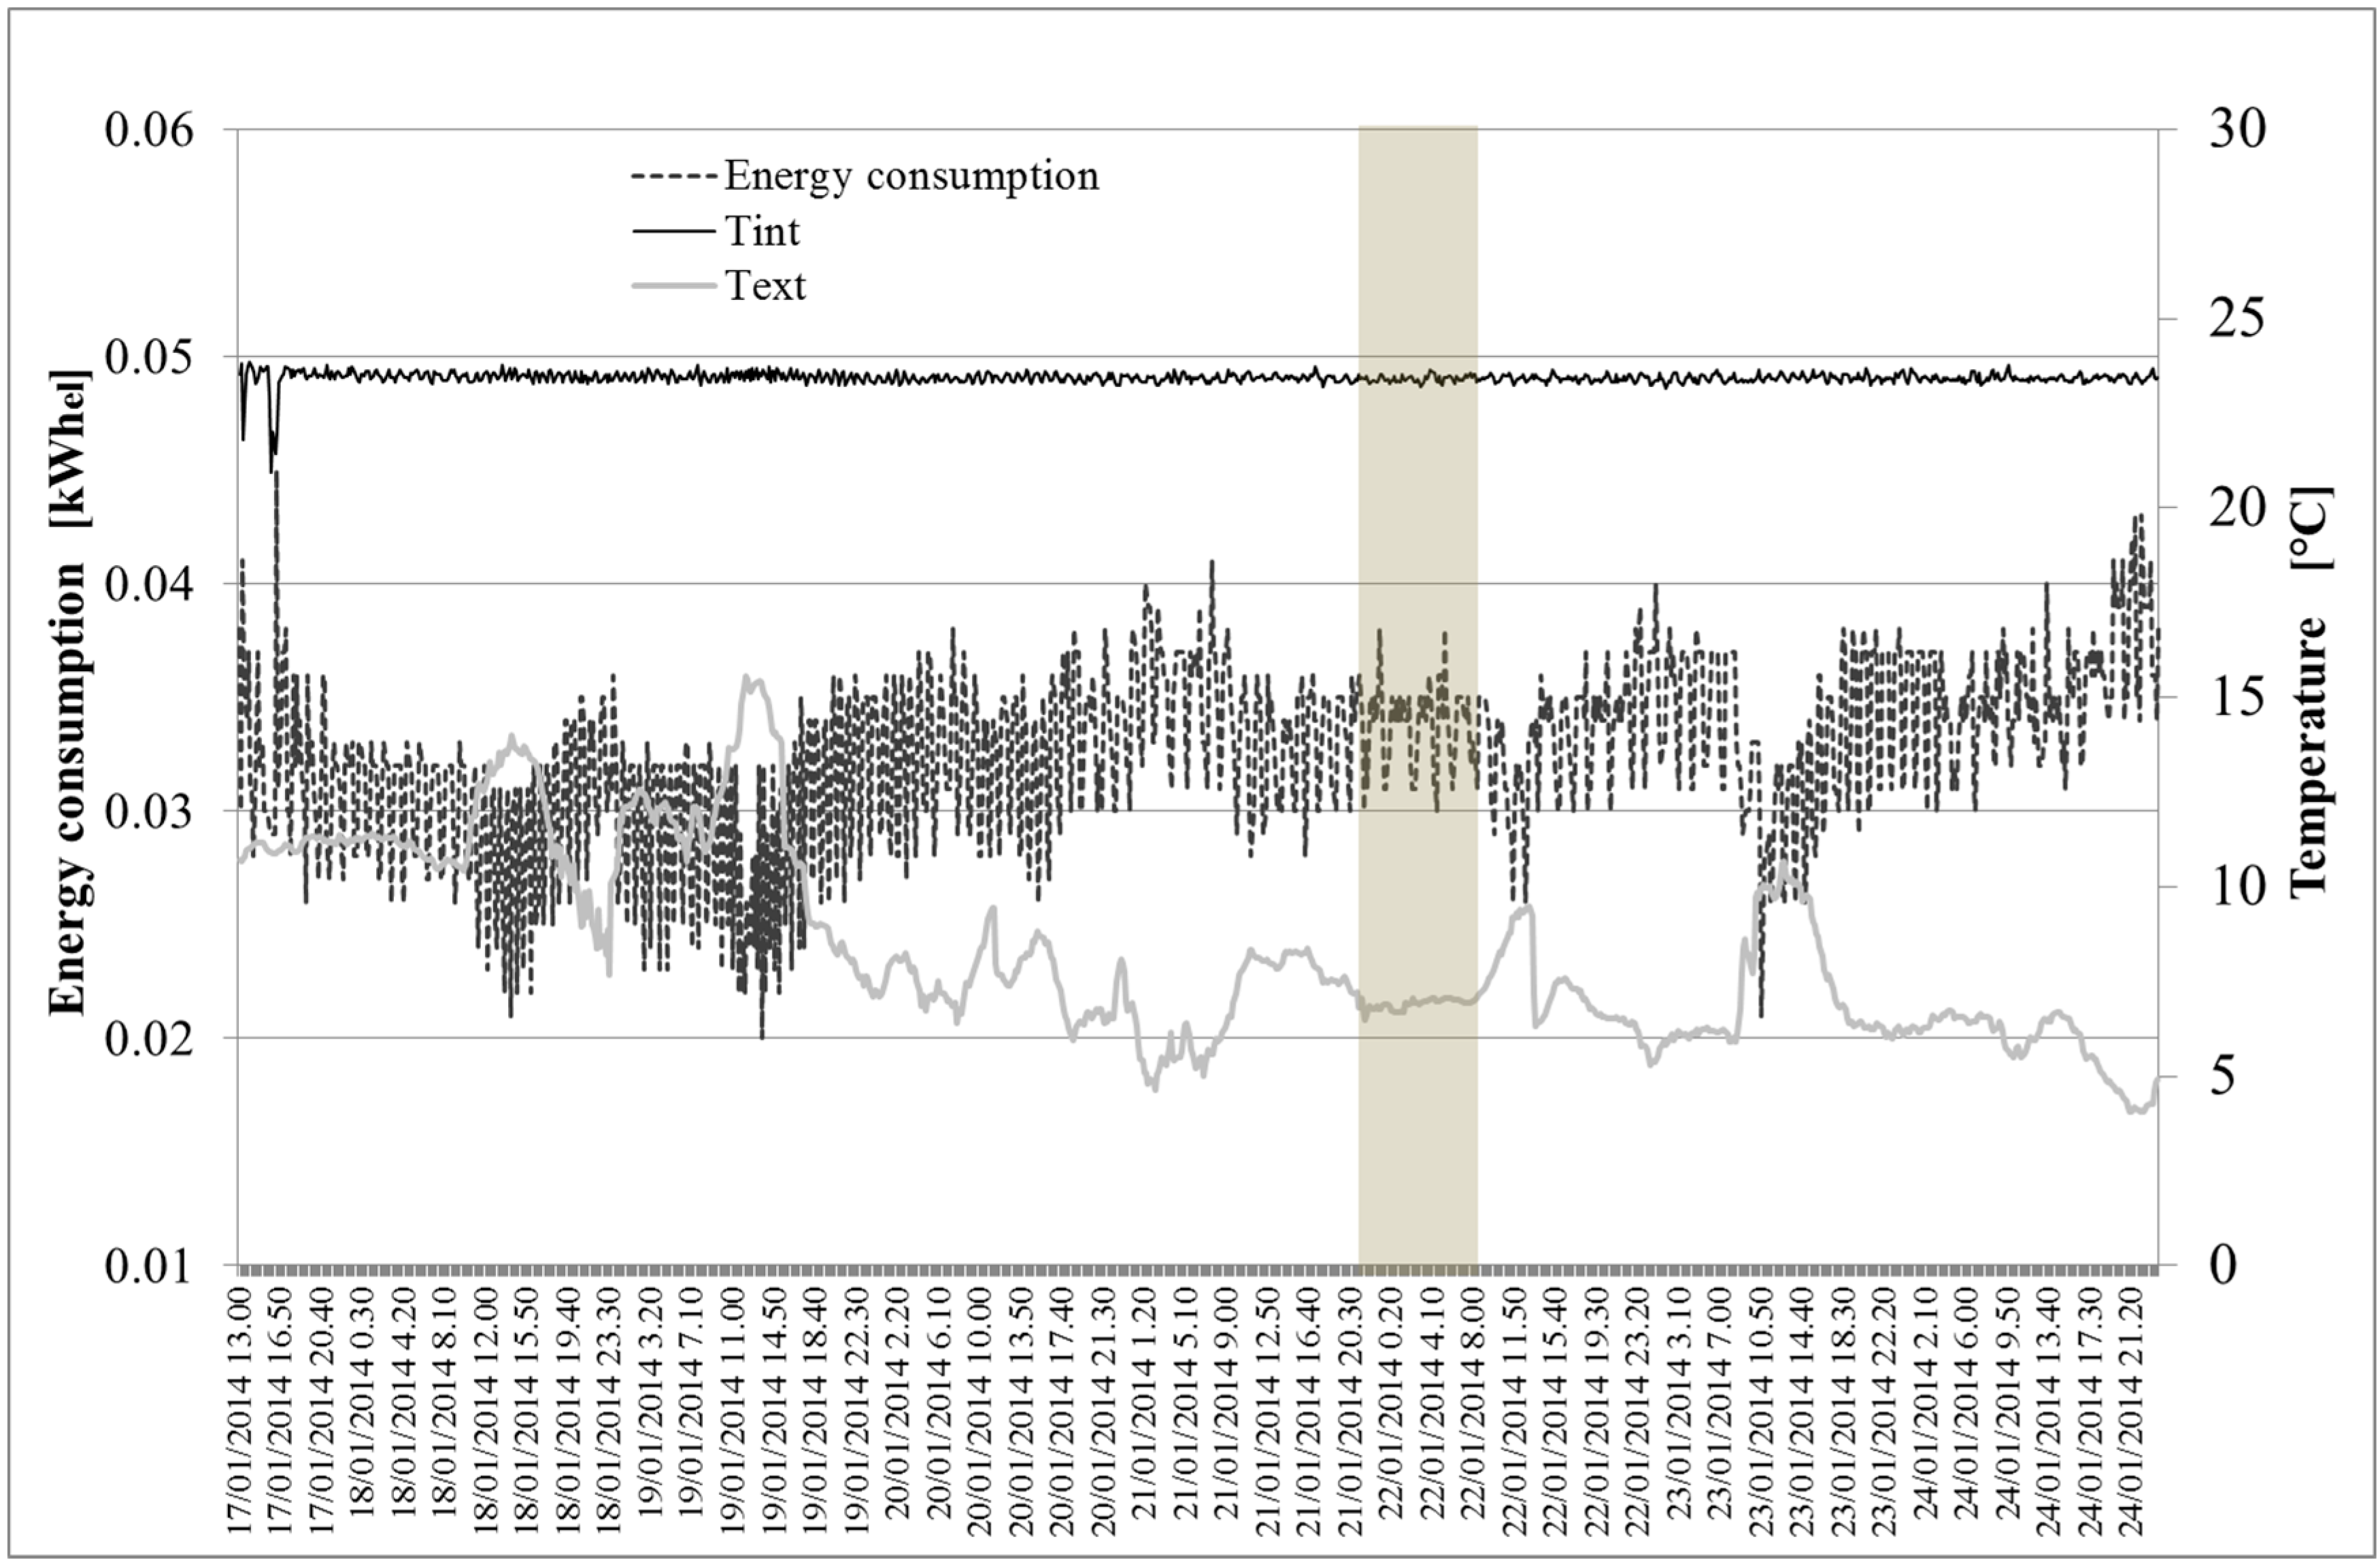
4.3. Combined Assessment of in-Field Thermal-Energy Performance

The Itb calculation for each thermal bridge of the prototype building allowed to evaluate the overall conductance of the envelope. An influence area was assigned to each thermal bridge in order to identify an extra transmittance value to each of these areas. Figure 6 reports the example of the wall area influence by the thermal bridges. The same method was applied to the others surfaces of the test-room to assign each Itb previous showed in Table 3.
Figure 6. Thermal bridges influence scheme (section of the test-room).
Sustainability 06 07107 g006
The total thermal losses through the envelope of the prototype building, including the thermal bridges correspond to 32.73 W/K, where the heat transfer directly imputable to the thermal bridges presence is about 9%.
These values were compared to the energy consumption of the heat pump system operating in the test-room. In particular, the Coefficient of Performance of the system was calculated according to EN 14825 [37] in partial load conditions, and it corresponded to 2.6. In the selected period (Figure 3) the heat pump consumed 2.058 kWhel, corresponding to 5.272 kWhth.
Table 4 reports the heat pump energy consumption with and without considering the effect of thermal bridges, and the real measured consumption. The measured values show the substantial reliability of the proposed index. In fact, after a laboratory validation reported in previous works of the authors [31], the Incidence factor of the thermal bridge seems to be valid also in a real full-scale environment like the analyzed test-room. Table 4 reports the uncertainty values analyzed for each calculation and measurement according to [38].
Table 4. Comparison between energy consumption values in different approaches.
Energy Consumption without Thermal Bridges [kWh]Energy Consumption with Thermal Bridges [kWh]Measured Energy Consumption of the Heat Pump System [kWh]
4.816 ± 0.0825.258 ± 0.1005.272 ± 0.527
Difference (%)9.2%0.3%
In particular, the uncertainty of the energy consumption in the configuration with thermal bridges takes into account the singular error due to the analysis of every thermal bridge. For matter of safety, each temperature pixel corresponds to an accuracy level of ±2 °C, in order to take into account of all possible uncertainties in the measurement procedures. Moreover, the results of this evaluation show that the quantitative thermography analysis lead to a reliable assessment of the real behavior of thermal bridges. In general, the effect of these particular building elements is evaluated through numerical calculations and dedicated software [17,39], producing results often far from the ones obtained experimentally. The whole technique is simple to use thanks to the thermographic survey that allows one to acquire images in a relatively easy and quick manner. As shown before, the calculation of the proposed index has to be carried out with the elaboration of one single thermographic image for each thermal bridge. The sole recommendation is that the IR image has to include both the thermal bridge area and the thermally homogeneous wall. Finally the elaboration of the temperature data of the thermogram, and the calculation of the Itb, is generally possible by means of common worksheets because the output of the thermo camera is a simple vector or matrix of temperature data. In this view, the proposed methodology could constitute a relatively easy to be applied and reliable analysis tool, with the purpose to evaluate the increase of thermal losses imputable to thermal bridges by means of in-situ measurements.

5. Conclusions

IR thermography represents an acknowledged qualitative methodology aimed at investigating thermal discontinuities throughout buildings envelope and the presence-positioning of thermal bridges. In this view, recent research efforts were aimed at developing quantitative techniques to analyze the effect of thermal bridges on building thermal-energy behavior. A quantitative index, i.e., the Incidence factor of the thermal bridge, was proposed in a previous work by the authors in order to quantify thermal losses through building envelopes. Starting from previous results, this work concerned the application and a further experimental in-field validation of the proposed index methodology in a full-scale continuously monitored building. Thermal bridges within the prototype building were identified and assessed through the proposed procedure. Continuous monitoring of indoor air temperature, surface temperature and thermal fluxes throughout the wall, the ground floor and the roof, allowed to compare the thermography results to quantitative monitored data. The analysis showed that the overall effect of thermal bridges in increasing thermal losses through the building envelope corresponded to about 9%. Moreover, the evaluation of the energy consumption of the operating heat pump system in heating mode and the survey of the overall thermal losses through the building envelope by means of the proposed index have been compared and the variation between these two approaches resulted lower than 1%. The geometrical simplicity of the case study building could be considered as a simplifying factor for the comparison between measured and calculated values. Future developments of this research will deal with a real operating building. Nevertheless, the proposed Incidence factor of the thermal bridge methodology confirmed to be an useful and relatively simple tool even in realistic in-field conditions, thanks to the reliable estimation of each thermal bridge correction factor.

Nomenclature

Itb
Incidence factor of the thermal bridge [-]
htb_i
Convective coefficient of the thermal bridge zone [W/m2K]
h1D_i
Convective coefficient of the undisturbed zone [W/m2K]
Apixel
Surface of the single pixel [m2]
A1D
Surface of the entire thermografic image [m2]
Ti
Temperature of the inner air [K]
Tpixel_is
Temperature of the single pixel on the surface [K]
T1D_is
Temperature of the surface on undisturbed zone defined by thermogram [K]
N
Total number of pixels
T1D
Thermal transmittance of the undisturbed zone [W/m2K]
Utb
Thermal transmittance of the zone influenced by thermal bridge [W/m2K]

Acknowledgments

The authors acknowledge “Fondazione Cassa di Risparmio Perugia” for funding the construction of the test room within the BAIO project.

Author Contributions

The authors contributed equally to this work.

Conflicts of Interest

The authors declare no conflict of interest.

References

  1. Pikas, E.; Thalfeldt, M.; Kurnitski, J. Cost optimal and nearly zero energy building solutions for office buildings. Energy Build. 2014, 74, 30–42. [Google Scholar] [CrossRef]
  2. Asdrubali, F.; Baldassarri, C.; Fthenakis, V. Life cycle analysis in the construction sector: Guiding the optimization of conventional Italian buildings. Energy Build. 2013, 64, 73–89. [Google Scholar] [CrossRef]
  3. Franzitta, V.; Milone, A.; Milone, D.; Pitruzzella, S.; Trapanese, M.; Viola, A. Experimental evidence on the thermal performance of opaque surfaces in Mediterranean climate. Adv. Mater. Res. 2014, 860–863, 1227–1231. [Google Scholar]
  4. Carletti, C.; Gallo, P.; Gargari, C.; Sciurpi, F. Building regulations based on sustainable principles in Italy: State of the art and trends. WIT Trans. Ecol. Environ. 2005, 84, 193–200. [Google Scholar]
  5. Fantozzi, F.; Leccese, F.; Salvadori, G.; Tuoni, G. Energy demand analysis and energy labelling of new residential buildings in Tuscany (Italy). WIT Trans. Ecol. Environ. 2009, 122, 217–229. [Google Scholar]
  6. De Lieto Vollaro, R.; Demegni, G.; Carnielo, E.; Botta, F.; de Lieto Vollaro, E. Determination of photometric properties of materials for energy purposes through the experimental study of a two-axis goniophotometer. Int. J. Eng. Technol. 2013, 5, 4465–4471. [Google Scholar]
  7. Bottillo, S.; de Lieto Vollaro, A.; Galli, G.; Vallati, A. CFD modeling of the impact of solar radiation in a tridimensional urban canyon at different wind conditions. Sol. Energy 2014, 102, 212–222. [Google Scholar] [CrossRef]
  8. Carletti, C.; Cellai, G.; Sciurpi, F. Adapting prescriptions for energy saving technologies to historical buildings. In Proceedings of the 2nd Rebuild European Conference, Florence, Italy, 1–3 April 1998; pp. 290–293.
  9. Pisello, A.L.; Asdrubali, F. Human-based energy retrofits in residential buildings: A cost-effective alternative to traditional physical strategies. Appl. Energy 2014, 133, 224–235. [Google Scholar] [CrossRef]
  10. Dutil, Y.; Rousse, D.; Quesada, G. Sustainable buildings: An ever evolving target. Sustainability 2011, 3, 443–464. [Google Scholar] [CrossRef]
  11. Cotana, F.; Rossi, F.; Filipponi, M.; Coccia, V.; Pisello, A.L.; Bonamente, E.; Petrozzi, A.; Cavalaglio, G. Albedo control as an effective strategy to tackle Global Warming: A case study. Appl. Energy 2014. [Google Scholar] [CrossRef]
  12. De Lieto Vollaro, R.; Calvesi, M.; Battista, G.; Evangelisti, L.; Gori, P.; Guattari, C. A new method of technical analysis to optimise the design of low impact energy systems for buildings. Int. J. Eng. Technol. Innov. 2013, 3, 241–250. [Google Scholar]
  13. Franzitta, V.; Milone, D.; Trapanese, M.; Viola, A.; Di Dio, V.; Pitruzzella, S. Energy and economic comparison of different conditioning system among traditional and eco-sustainable building. Appl. Mech. Mater. 2013, 394, 289–295. [Google Scholar] [CrossRef]
  14. Galli, G.; Vallati, A.; Recchiuti, C.; de Lieto Vollaro, R.; Botta, F. Passive cooling design options to improve thermal comfort in an Urban District of Rome, under hot summer conditions. Int. J. Eng. Technol. 2013, 5, 4495–4500. [Google Scholar]
  15. Ciampi, M.; Leccese, F.; Tuoni, G. Multi-layered walls design to optimize building-plant interaction. Int. J. Therm. Sci. 2004, 43, 417–429. [Google Scholar] [CrossRef]
  16. Brás, A.; Gonçalves, F.; Faustino, P. Cork-based mortars for thermal bridges correction in a dwelling: Thermal performance and cost evaluation. Energy Build. 2014, 72, 296–308. [Google Scholar] [CrossRef]
  17. Theodosiou, T.G.; Papadopoulos, A.M. The impact of thermal bridges on the energy demand of buildings with double brick wall constructions. Energy Build. 2008, 40, 2083–2089. [Google Scholar]
  18. Ascione, F.; Bianco, N.; de Masi, R.F.; Vanoli, G.P. Rehabilitation of the building envelope of hospitals: Achievable energy savings and microclimatic control on varying the HVAC systems in Mediterranean climates. Energy Build. 2013, 60, 125–138. [Google Scholar] [CrossRef]
  19. Ghaffarianhoseini, A.; Dahlan, N.D.; Berardi, U.; Ghaffarianhoseini, A.; Makaremi, N.; Ghaffarianhoseini, M. Sustainable energy performances of green buildings: A review of current theories, implementations and challenges. Renew. Sustain. Energy Rev. 2013, 25, 1–17. [Google Scholar] [CrossRef]
  20. Rossi, F.; Pisello, A.L.; Nicolini, A.; Filipponi, M.; Palombo, M. Analysis of retro-reflective surfaces for urban heat island mitigation: A new analytical model. Appl. Energy 2014, 114, 621–631. [Google Scholar] [CrossRef]
  21. Asdrubali, F.; Baldinelli, G.; Bianchi, F. Influence of cavities geometric and emissivity properties on the overall thermal performance of aluminum frames for windows. Energy Build. 2013, 60, 298–309. [Google Scholar] [CrossRef]
  22. La Rosa, A.D.; Recca, A.; Gagliano, A.; Summerscales, J.; Latteri, A.; Cozzo, G.; Cicala, G. Environmental impacts and thermal insulation performance of innovative composite solutions for building applications. Constr. Build. Mater. 2014, 55, 406–414. [Google Scholar] [CrossRef]
  23. Baldinelli, G.; Asdrubali, F.; Baldassarri, C.; Bianchi, F.; D’Alessandro, F.; Schiavoni, S.; Basilicata, C. Energy and environmental performance optimization of a wooden window: A holistic approach. Energy Build. 2014, 79, 114–131. [Google Scholar] [CrossRef]
  24. Corgnati, S.P.; D’Oca, S.; Fabi, V.; Andersen, R.K. Leverage of behavioural patterns of window opening and heating set point adjustments on energy consumption and thermal comfort in residential buildings. Lect. Notes Electr. Eng. 2014, 261, 23–31. [Google Scholar]
  25. Balaras, C.A.; Argiriou, A.A. Infrared thermography for building diagnostics. Energy Build. 2002, 34, 171–183. [Google Scholar] [CrossRef]
  26. Barreira, E.; de Freitas, V.P. Evaluation of building materials using infrared thermography. Constr. Build. Mater. 2007, 21, 218–224. [Google Scholar] [CrossRef]
  27. Avdelidis, N.P.; Moropoulou, A. Emissivity considerations in building thermography. Energy Build. 2002, 35, 663–667. [Google Scholar] [CrossRef]
  28. Datcu, S.; Ibos, L.; Candau, Y.; Matteï, S. Improvement of building wall surface temperature measurements by infrared thermography. Infrared Phys. Technol. 2005, 46, 451–467. [Google Scholar] [CrossRef]
  29. Zalewski, L.; Lassue, S.; Rousse, D.; Boukhalfa, K. Experimental and numerical characterization of thermal bridges in prefabricated building walls. Energy Convers. Manag. 2010, 51, 2869–2877. [Google Scholar] [CrossRef]
  30. Déqué, F.; Ollivier, F.; Roux, J.J. Effect of 2D modelling of thermal bridges on the energy performance of buildings—Numerical application on the Matisse apartment. Energy Build. 2001, 33, 583–587. [Google Scholar] [CrossRef]
  31. Asdrubali, F.; Baldinelli, G.; Bianchi, F. A quantitative methodology to evaluate thermal bridges in buildings. Appl. Energy 2012, 97, 365–373. [Google Scholar] [CrossRef]
  32. Pisello, A.L.; Cotana, F.; Nicolini, A.; Buratti, C. Effect of dynamic characteristics of building envelope on thermal-energy performance in winter conditions: In field experiment. Energy Build. 2014. [Google Scholar] [CrossRef]
  33. Barreneche, C.; de Gracia, A.; Serrano, S.; Navarro, M.E.; Borreguero, A.M.; Fernández, A.I.; Carmona, M.; Rodriguez, J.F.; Cabeza, L.F. Comparison of three different devices available in Spain to test thermal properties of building materials including phase change materials. Appl. Energy 2013, 109, 421–427. [Google Scholar] [CrossRef]
  34. International Organization for Standardization (ISO). Thermal Bridges in Building Construction—Linear Thermal Transmittance—Simplified Methods and Default Values; EN ISO 14683: 2008; ISO: Geneva, Switzerland, 2008. [Google Scholar]
  35. Ente Nazionale Italiano di Unificazione (UNI). Prestazioni Energetiche Degli Edifici—Parte 1: Determinazione del Fabbisogno di Energia Termica dell’Edificio per la Climatizzazione Estiva ed Invernale; UNI/TS 11300–1: 2008; UNI: Milano, Italy, 2008. [Google Scholar]
  36. Flir System. In User’s Manual; Flir System: Wilsonville, OR, USA, 2008.
  37. Air Conditioners, Liquid Chilling Packages and Heat Pumps, with Electrically Driven Compressors, for Space Heating and Cooling—Testing and Rating at Part Load Conditions and Calculation of Seasonal Performance; UNI EN 14825: 2012; BSI: London, UK, 2012.
  38. International Organization for Standardization (ISO). Guide to the Expression of Uncertainty in Measurement; ENV 13005: 2008; ISO: Geneva, Switzerland, 2008. [Google Scholar]
  39. Evola, G.; Margani, G.; Marletta, L. Energy and cost evaluation of thermal bridge correction in Mediterranean climate. Energy Build. 2011, 43, 2385–2393. [Google Scholar] [CrossRef]

