Wireless Sensor Network Powered by a Terrestrial Microbial Fuel Cell as a Sustainable Land Monitoring Energy System


Abstract
:
1. Introduction
1.1. Microbial Fuel Cell
1.2. Different Types of Microbial Fuel Cells
2. Experimental Section
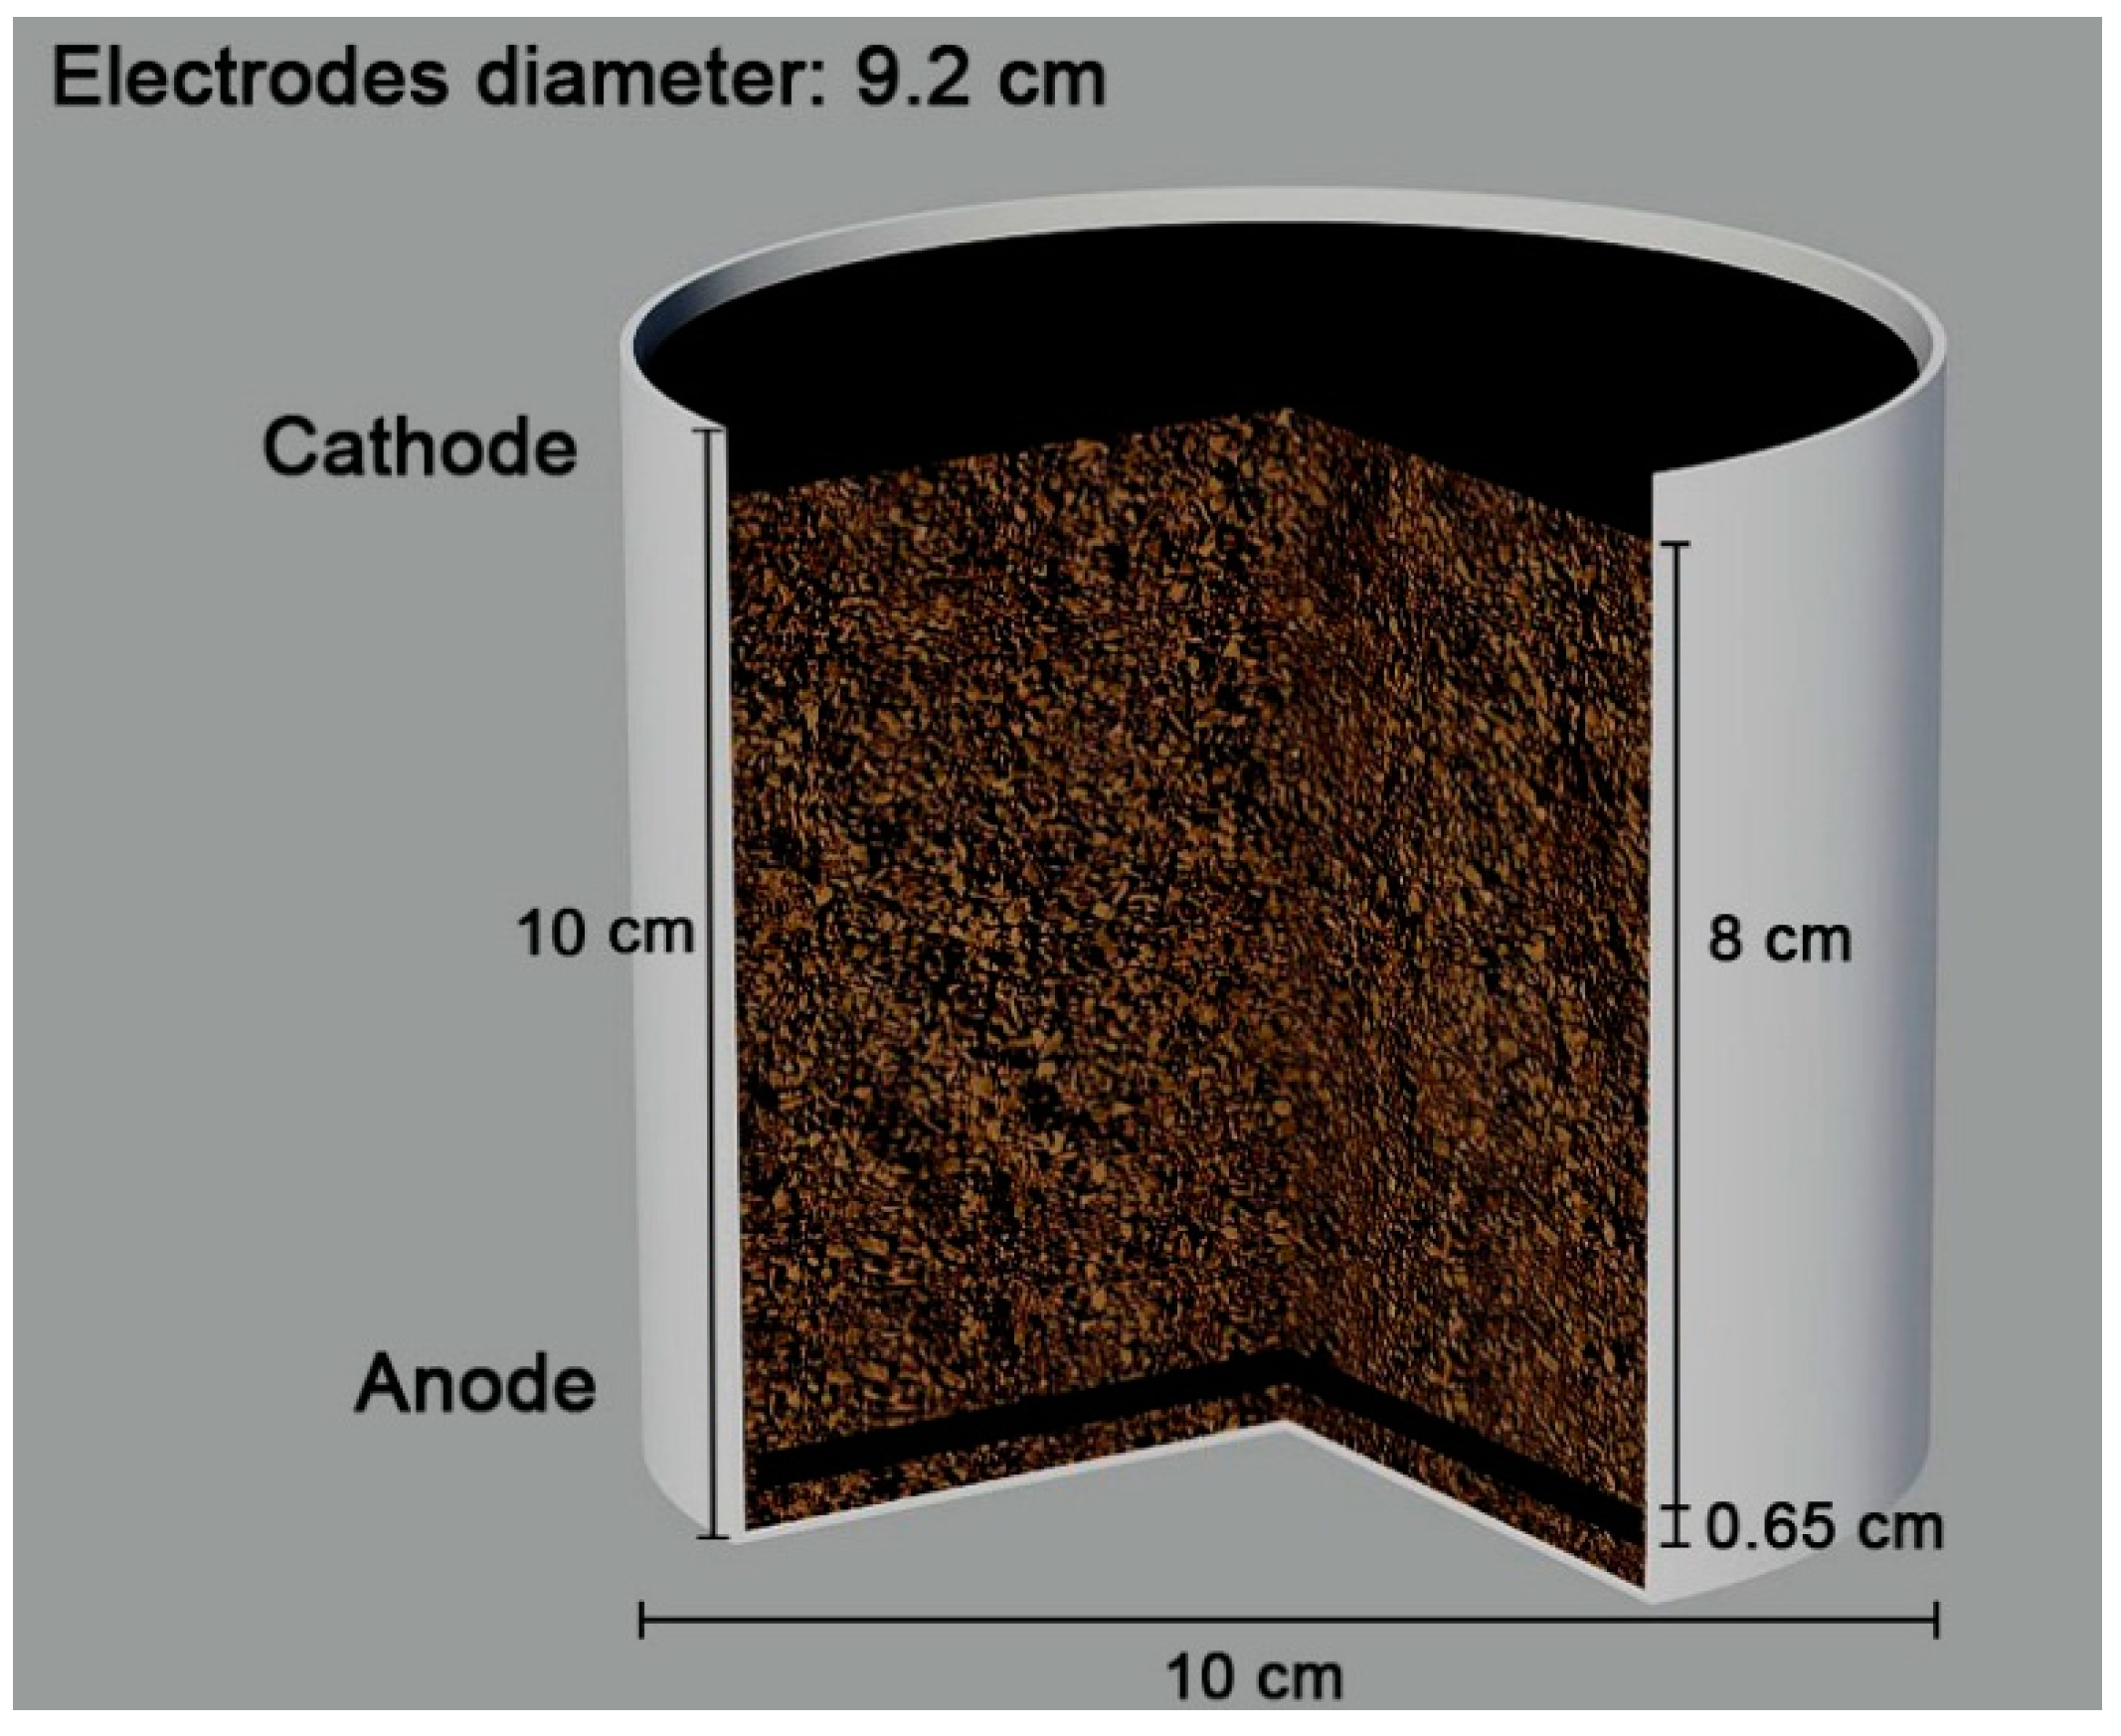
2.1. Construction of Terrestrial Microbial Fuel Cells

2.2. Temperature, Humidity and pH Analysis
2.3. Voltage Produced and Power Generated
2.4. Wireless Node Configuration
3. Results and Discussion
3.1. Description of the Experimental Stages

| Specimens | Reactors Configuration | Soil Volume (g) | pH | Controlled Temperature | Initial Humidity (%) | Final Humidity (%) | |
|---|---|---|---|---|---|---|---|
| Phase 1 | A | Open | 260 | 5.3 | No | 34.62 | 33.57 |
| B | Open | 260 | 6.3 | No | 35.85 | 30.88 | |
| Phase 2 | C | Closed | 260 | 6.3 | Yes | 35.1 | 35.1 |
| D | Closed | 260 | 6.3 | Yes | 34.8 | 34.5 | |
| Phase 3 | E | Closed | 260 | 7.2 | Yes | 34.37 | 34.14 |
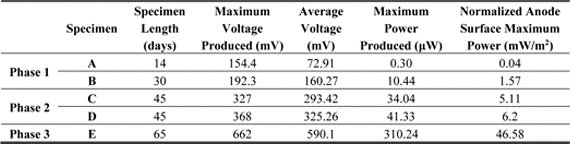
| Specimen | Specimen Length (Days) | Maximum Voltage Produced (mV) | Average Voltage (mV) | Maximum Power Produced (μW) | Normalized Anode Surface Maximum Power (mW/m2) | |
|---|---|---|---|---|---|---|
| Phase 1 | A | 14 | 154.4 | 72.91 | 0.30 | 0.04 |
| B | 30 | 192.3 | 160.27 | 10.44 | 1.57 | |
| Phase 2 | C | 45 | 327 | 293.42 | 34.04 | 5.11 |
| D | 45 | 368 | 325.26 | 41.33 | 6.2 | |
| Phase 3 | E | 65 | 662 | 590.1 | 310.24 | 46.58 |
3.1.1. First Experimental Cycle: Specimens A and B

3.1.2. Second Experimental Cycle: Specimens C and D
3.1.3. Third Experimental Cycle: Specimen E
| Resistance (Ohm) | Specimen Power A (µW) | Specimen Power B (µW) | Specimen Power C (µW) | Specimen Power D (µW) | Specimen Power E (µW) |
|---|---|---|---|---|---|
| 47 | 0.12 | 3.93 | 7.36 | 12.15 | 57.53 |
| 100 | 0.17 | 5.85 | 15.6 | 18.06 | 92.16 |
| 220 | 0.25 | 7.9 | 21.64 | 26.53 | 147.27 |
| 470 | 0.28 | 9.86 | 32.6 | 37.12 | 299.2 |
| 1000 | 0.30 | 10.44 | 34.04 | 41.33 | 310.24 |
| 10,000 | 0.07 | 1.36 | 6.82 | 12.6 | 53.87 |

3.2. Comparison between Different Configurations of a Node
| Configuration | C1: Xbee2 | C2: XbeePro S2B | C3: MRF24J40MA | C4: MRF24XA | C5: SN260 |
|---|---|---|---|---|---|
| Tx operating current (max power output) | 48 mA | 233 mA | 23.3 mA | 25.3 mA | 35.5 mA |
| Rx operating current | 38 mA | 62 mA | 19 mA | 13.5 mA | 35.3 mA |
| Standby current | 1.5 µA | 4 µA | 2.03 µA | 70 nA | 1 µA |
| Charge time (single bit transmitted) | 0.01728 s | 0.0842 s | 0.00839 s | 0.00908 s | 0.01276 s |
| Outdoor RF line-of-sight range | 120 m | 3200 m | 140 m | 140 m | 150 m |
4. Conclusions
Acknowledgments
Author Contributions
Conflicts of Interest
References
- Cooke, K.G.; Gay, M.O.; Radachowsky, S.E.; Guzman, J.J.; Chiu, M.A. BackyardNet™: Distributed Sensor Network Powered by Terrestrial Microbial Fuel Cell Technology. SPIE Proc. 2010, 7693. [Google Scholar] [CrossRef]
- Zhao, F.; Slade, R.C.T.; Varcoe, J.R. Techniques for the study and development of microbial fuel cells: An electrochemical perspective. Chem. Soc. Rev. 2009, 38, 1926–1939. [Google Scholar]
- Du, Z.; Li, H.; Gu, T. A state of the art review on microbial fuel cells: A promising technology for wastewater treatment and bioenergy. Biotechnol. Adv. 2007, 25, 464–482. [Google Scholar]
- Bond, D.R.; Lovley, D.R. Electricity Production by Geobacter sulfurreducens Attached to Electrodes. Appl. Environ. Microbiol. 2003, 69, 1548–1555. [Google Scholar]
- Kim, H.J.; Park, H.S.; Hyun, M.S.; Chang, I.S.; Kim, M.; Kim, B.H. A mediator-less microbial fuel cell using a metal reducing bacterium, Shewanella putrefaciens. Enzym. Microb. Technol. 2002, 30, 145–152. [Google Scholar]
- Gorby, Y.A.; Yanina, S.; McLean, J.S.; Rosso, K.M.; Moyles, D.; Dohnalkova, A.; Beveridge, T.J.; Chang, I.S.; Kim, B.H.; Kim, K.S.; et al. Electrically conductive bacterial nanowires produced by Shewanella oneidensis strain MR-1 and other microorganisms. Proc. Natl. Acad. Sci. USA 2006, 103, 11358–11363. [Google Scholar]
- Guzman, J.J.; Cooke, K.G.; Gay, M.O.; Radachowsky, S.E.; Girguis, P.R.; Chiu, M.A. Benthic Microbial Fuel Cells: Long-Term Power Sources for Wireless Marine Sensor Networks. SPIE Proc. 2010, 7666. [Google Scholar] [CrossRef]
- Schamphelaire, L.D.; van den Bossche, L.; Dang, H.S.; Höfte, M.; Boon, N.; Rabaey, K.; Verstraete, W. Microbial Fuel Cells Generating Electricity from Rhizodeposits of Rice Plants. Environ. Sci. Technol. 2008, 42, 3053–3058. [Google Scholar]
- Borello, D.; Corsini, A.; Delibra, G.; Evangelisti, S.; Micangeli, A. Experimental and computational investigation of a new solar integrated collector storage system. Appl. Energy 2012, 97, 982–989. [Google Scholar]
- Dell’Era, A.; Zuccari, F.; Santiangeli, A.; Fiori, C.; Micangeli, A.; Orecchini, F. Energy optimisation and layout of a membrane-free OSEC system for the hypochlorite self-production in Developing Countries. Energy Convers. Manag. 2013, 75, 446–452. [Google Scholar]
- Micangeli, A.; Cataldo, M. Micro Hydro in Emergency Situations: A Sustainable Energy Solution at La Realidad (Chiapas, Mexico). In Handbook of Sustainable Engineering; Kauffman, J., Lee, K.M., Eds.; Springer: Heidelberg/Berlin, Germany, 2013; pp. 163–179. [Google Scholar]
- Micangeli, A.; Michelangeli, E.; Naso, V. Sustainability after the thermal energy supply in emergency situations: The case study of Abruzzi Earthquake (Italy). Sustainability 2013, 5, 3513–3525. [Google Scholar]
- Grego, S.; Micangeli, A.; Esposto, S. Water purification in the Middle East crisis: A survey on WTP and CU in Basrah (Iraq) area within a research and development program. Desalination 2004, 165, 73–79. [Google Scholar]
- Micangeli, A.; Naso, V.; Michelangeli, E.; Matrisciano, A.; Farioli, F.; Belfiore, N.P. Attitudes toward Sustainability and Green Economy Issues Related to Some Students Learning Their Characteristics: A Preliminary Study. Sustainability 2014, 6, 3484–3503. [Google Scholar]
- Ringeisen, B.R.; Henderson, E.; Wu, P.K.; Pietron, J.; Ray, R.; Little, B.; Biffinger, J.C.; Jones-Meehan, J.M. High Power Density from a Miniature Microbial Fuel Cell Using Shewanella oneidensis DSP10. Environ. Sci. Technol. 2006, 40, 2629–2634. [Google Scholar]
- Donovan, C.; Dewan, A.; Heo, D.; Beyenal, H. Batteryless, Wireless Sensor Powered by a Sediment Microbial Fuel Cell. Environ. Sci. Technol. 2008, 42, 8591–8596. [Google Scholar]
- Logan, B.E.; Hamelers, B.; Rozendal, R.; Schröder, U.; Keller, J.; Freguia, S.; Aelterman, P.; Verstraete, W.; Rabaey, K. Microbial Fuel Cells: Methodology and Technology. Environ. Sci. Technol. 2006, 40, 5181–5192. [Google Scholar]
- Knight, C.; Cavanagh, K.; Munnings, C.; Moore, T.; Cheng, K.; Kaksonen, A. Application of Microbial Fuel Cells to Power Sensor Networks for Ecological Monitoring. In Wireless Sensor Networks and Ecological Monitoring; Mukhopadhyay, S.C., Jiang, J.A., Eds.; Springer: Heidelberg/Berlin, Germany, 2013; pp. 151–178. [Google Scholar]
- Degrenne, N.; Allard, B.; Buret, F.; Morel, F.; Adami, S.; Labrousse, D. Comparison of 3 Self-Starting Step-Up DC-DC Converter Topologies for Harvesting Energy from Low-Voltage and Low-Power Microbial Fuel Cells. In Proceedings of the 2011–2014th European Conference on Power Electronics and Applications (EPE 2011), Birmingham, AL, USA, 30 August–1 September 2011; pp. 1–10.
- Pollak, M.; Mateu, L.; Spies, P. Step-Up DC-DC-Converter with coupled inductors for low input voltages. In Proceedings of PowerMEMS 2008 + microEMS 2008, Sendai, Japan, 9–12 November 2008; pp. 145–148.
© 2014 by the authors; licensee MDPI, Basel, Switzerland. This article is an open access article distributed under the terms and conditions of the Creative Commons Attribution license (http://creativecommons.org/licenses/by/4.0/).
Share and Cite
Pietrelli, A.; Micangeli, A.; Ferrara, V.; Raffi, A. Wireless Sensor Network Powered by a Terrestrial Microbial Fuel Cell as a Sustainable Land Monitoring Energy System. Sustainability 2014, 6, 7263-7275. https://0-doi-org.brum.beds.ac.uk/10.3390/su6107263
Pietrelli A, Micangeli A, Ferrara V, Raffi A. Wireless Sensor Network Powered by a Terrestrial Microbial Fuel Cell as a Sustainable Land Monitoring Energy System. Sustainability. 2014; 6(10):7263-7275. https://0-doi-org.brum.beds.ac.uk/10.3390/su6107263
Chicago/Turabian StylePietrelli, Andrea, Andrea Micangeli, Vincenzo Ferrara, and Alessandro Raffi. 2014. "Wireless Sensor Network Powered by a Terrestrial Microbial Fuel Cell as a Sustainable Land Monitoring Energy System" Sustainability 6, no. 10: 7263-7275. https://0-doi-org.brum.beds.ac.uk/10.3390/su6107263