Thermal and Daylighting Performance of Energy-Efficient Windows in Highly Glazed Residential Buildings: Case Study in Korea

Abstract
:1. Introduction
2. Method
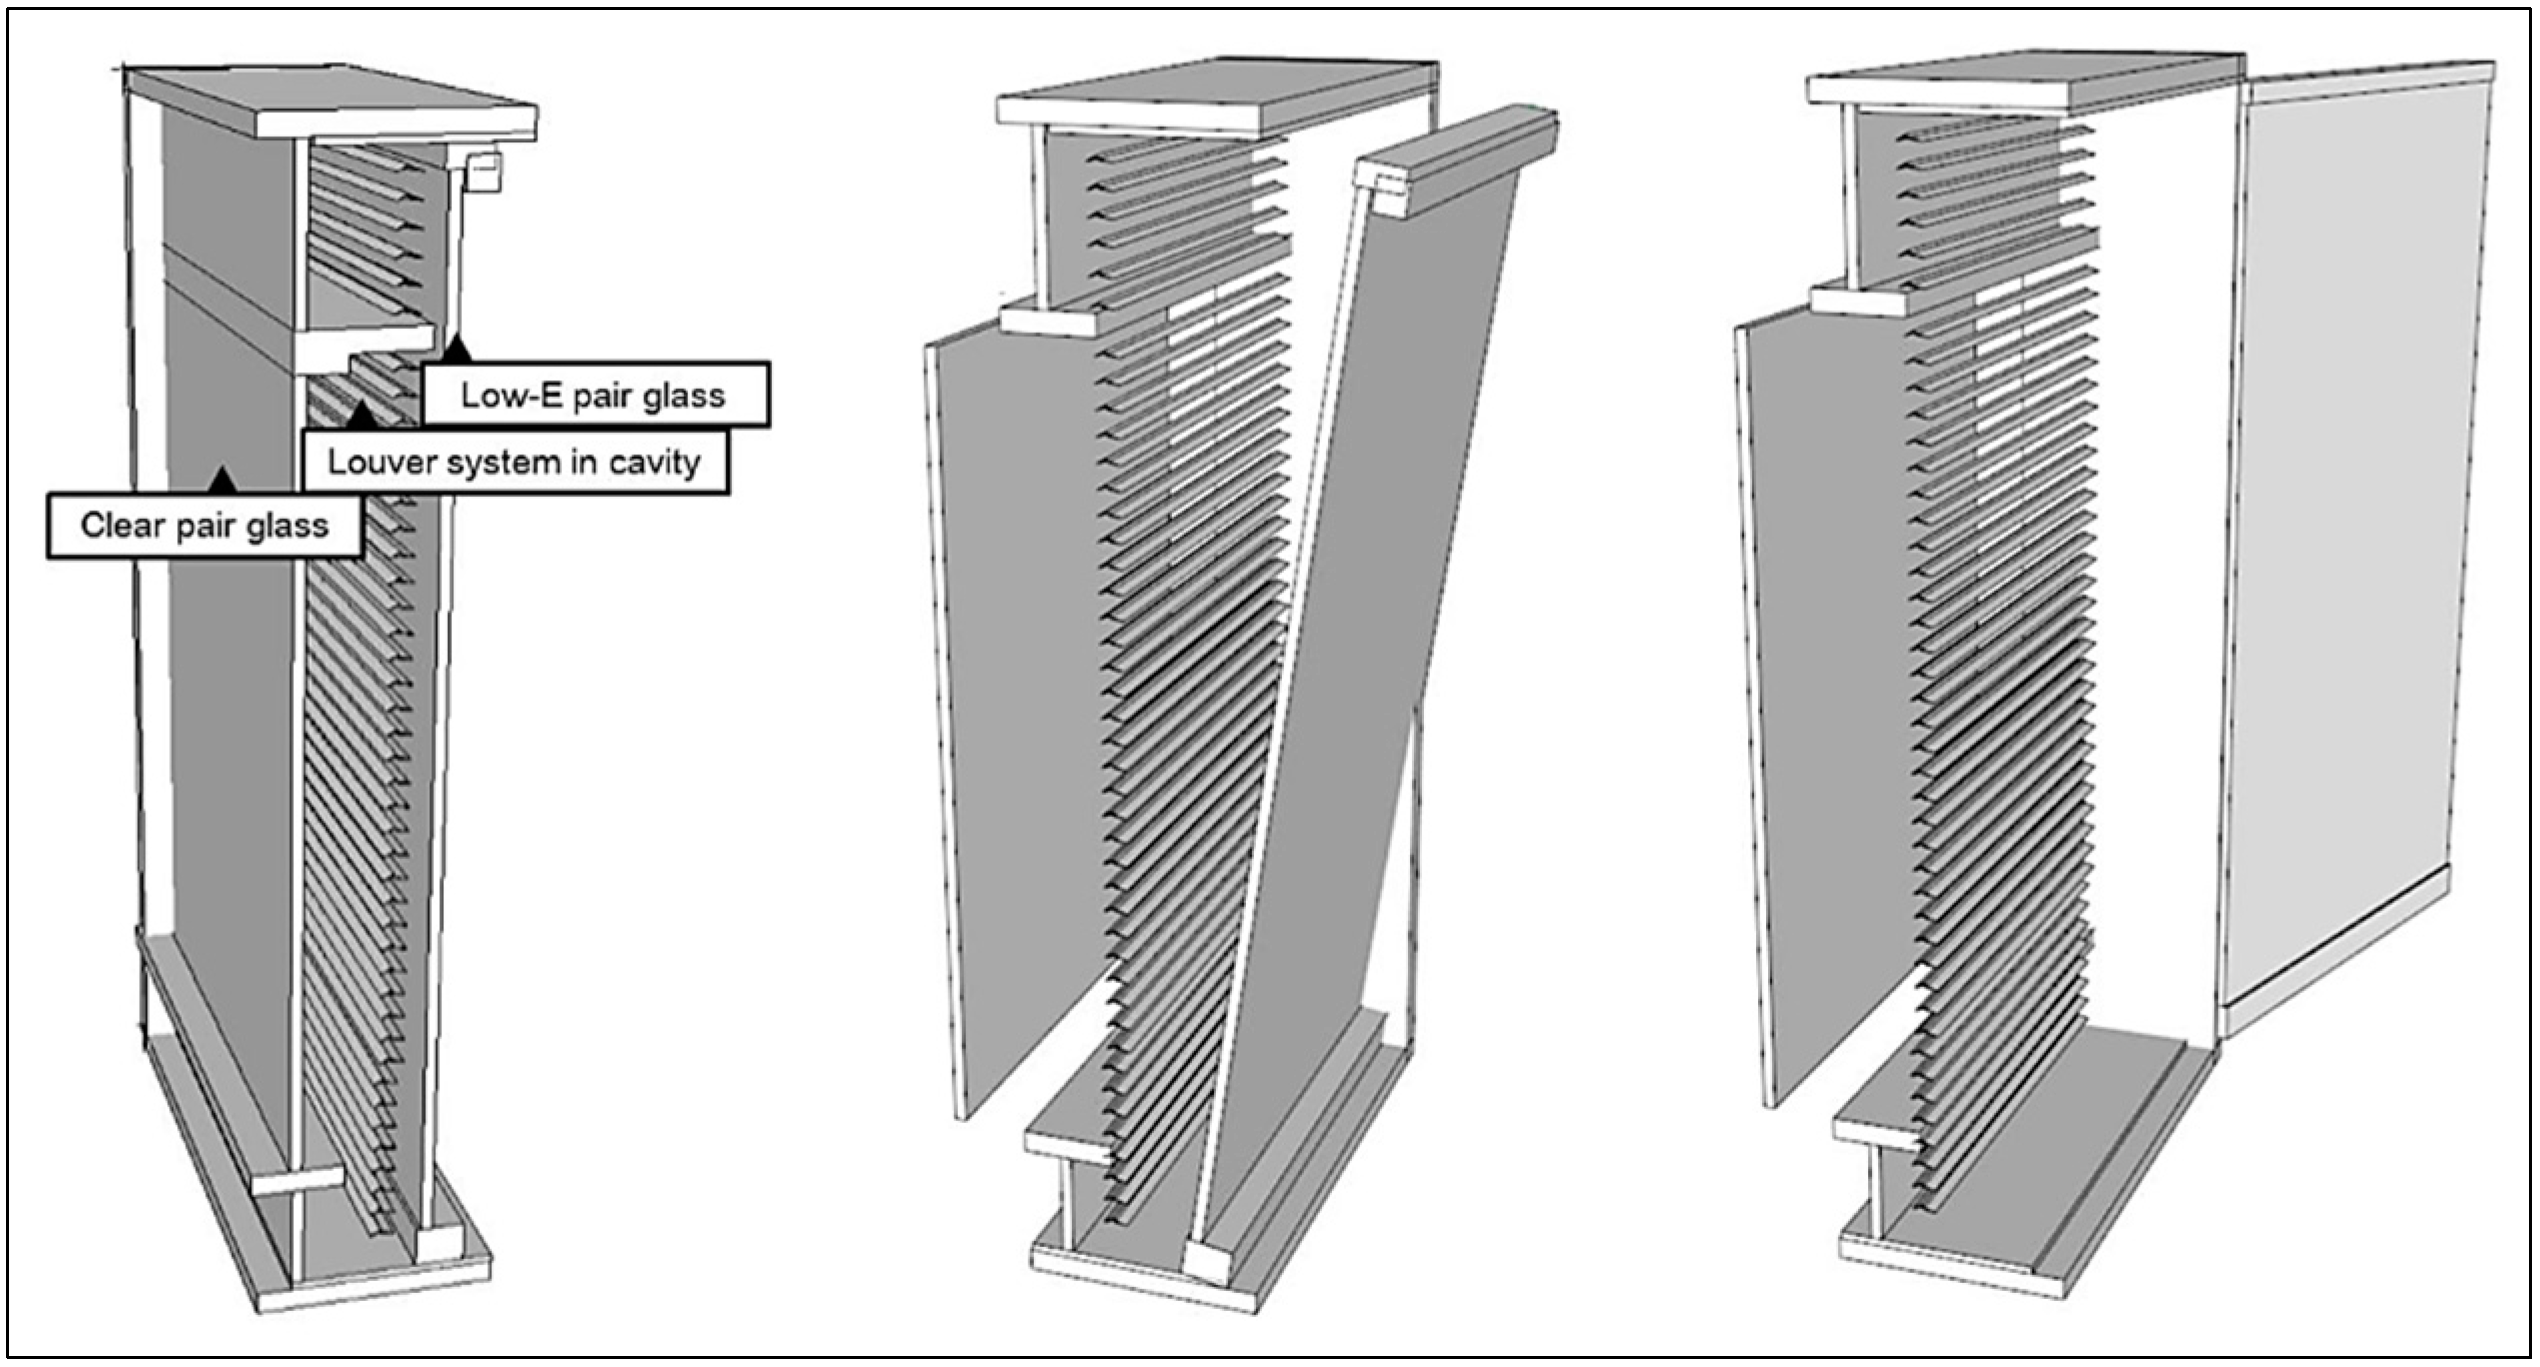
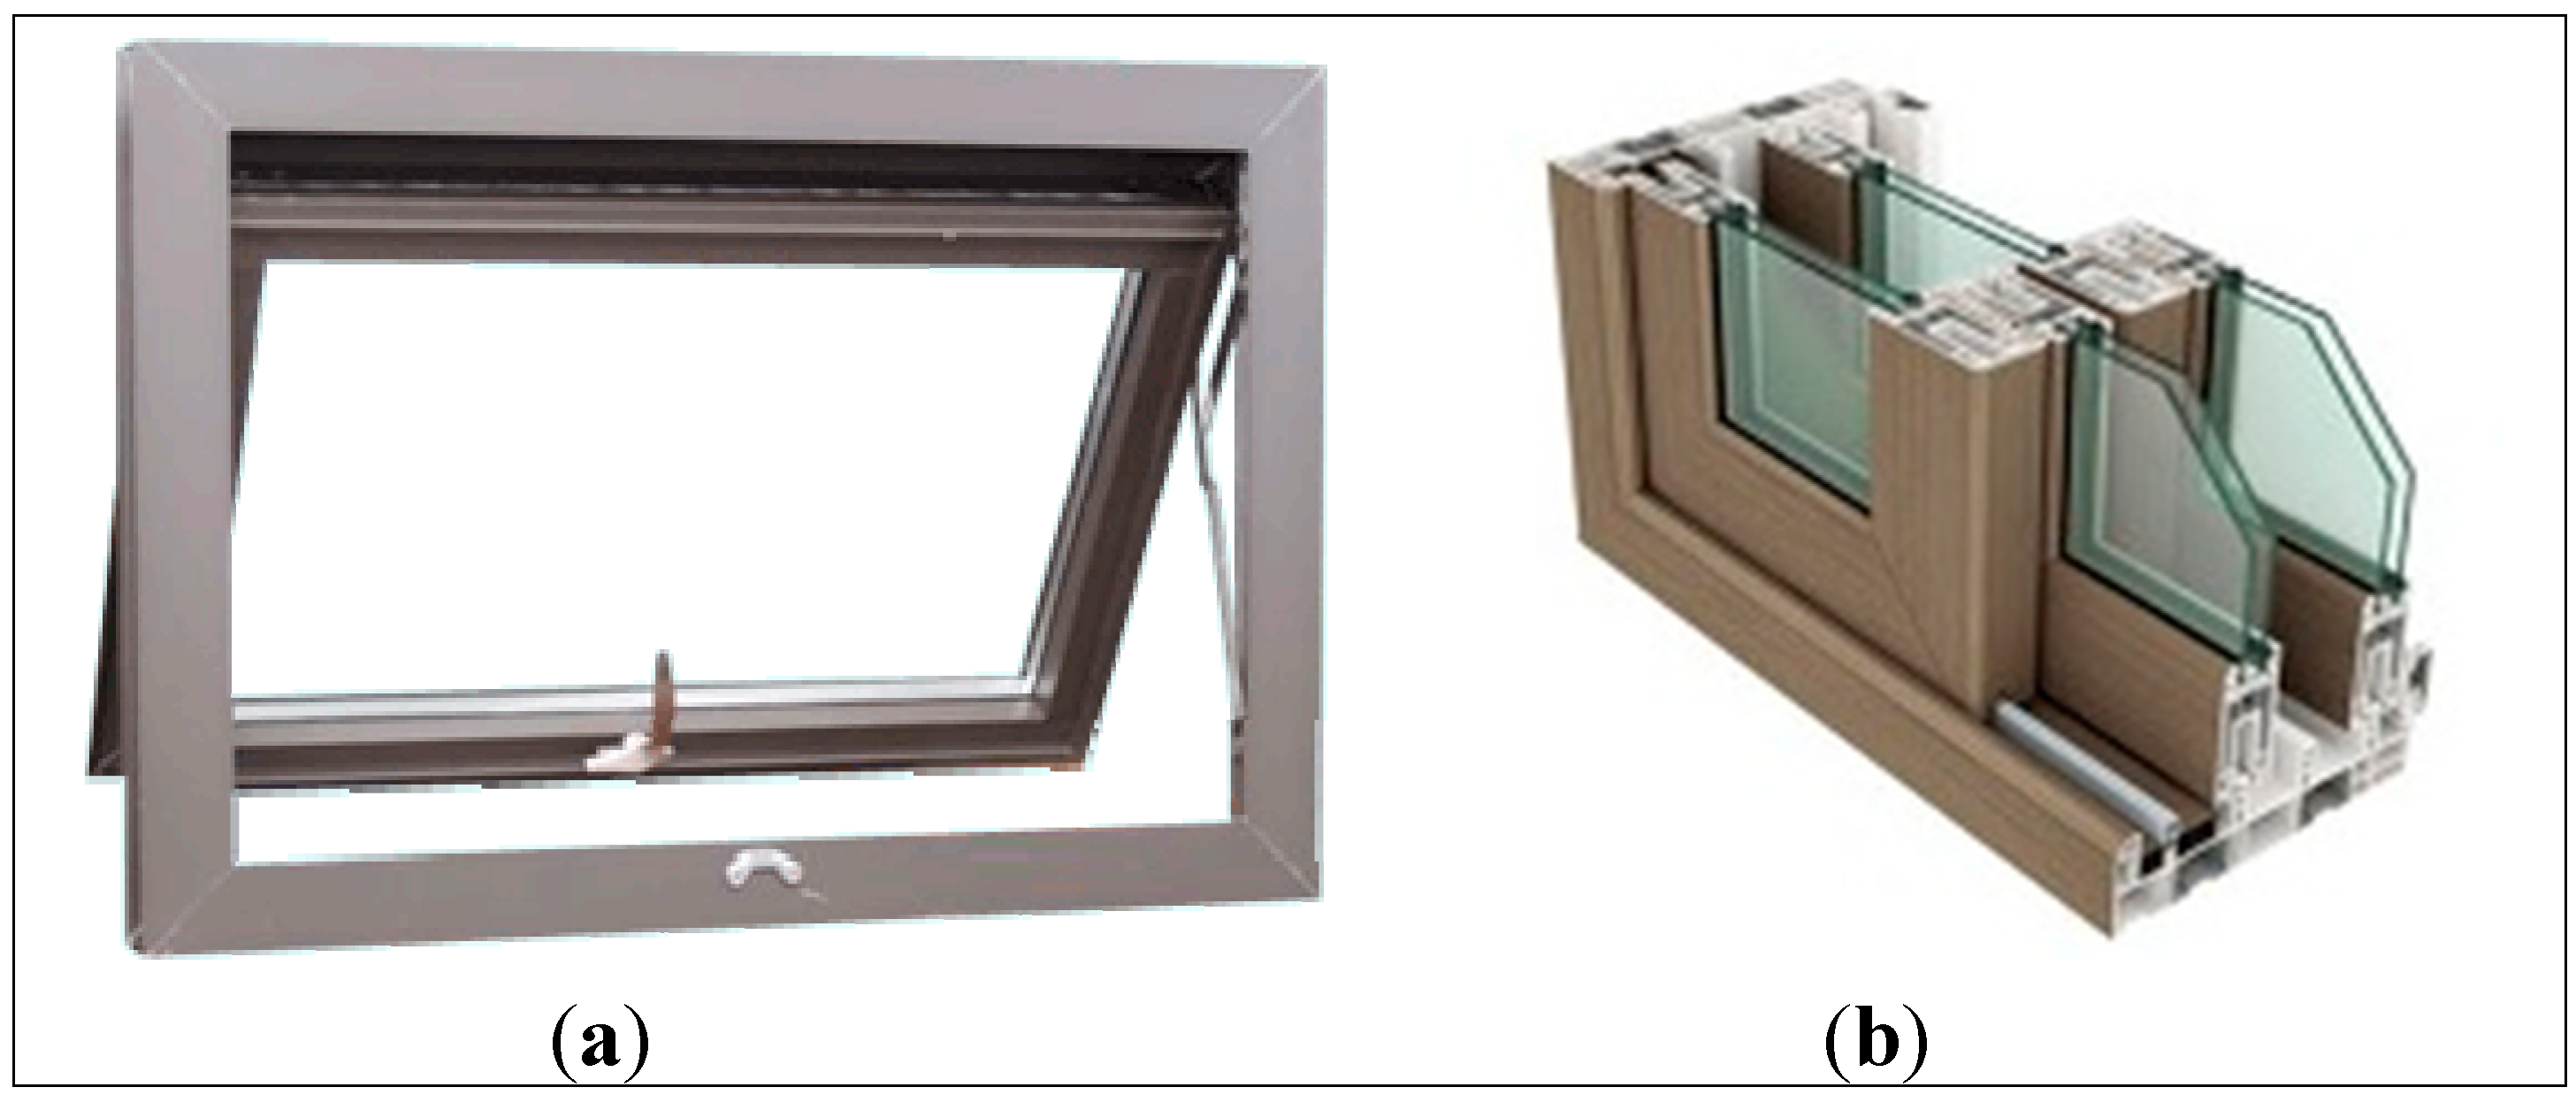
3. Window System


4. Baseline Model for Energy Simulation
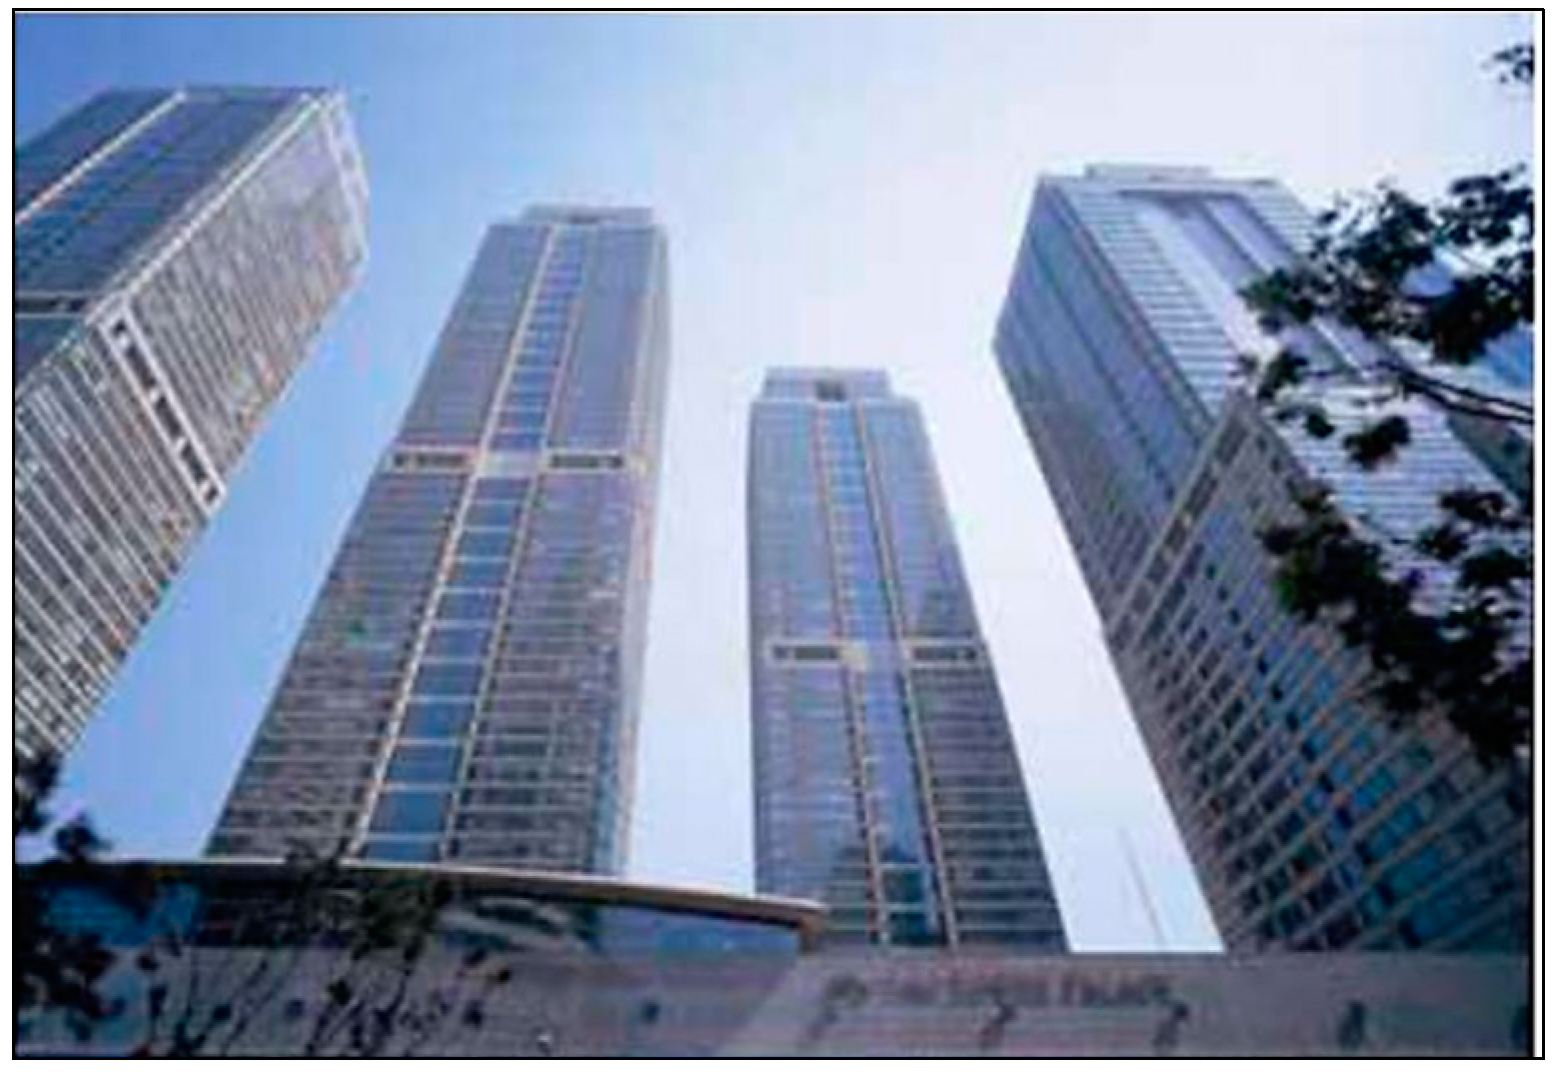
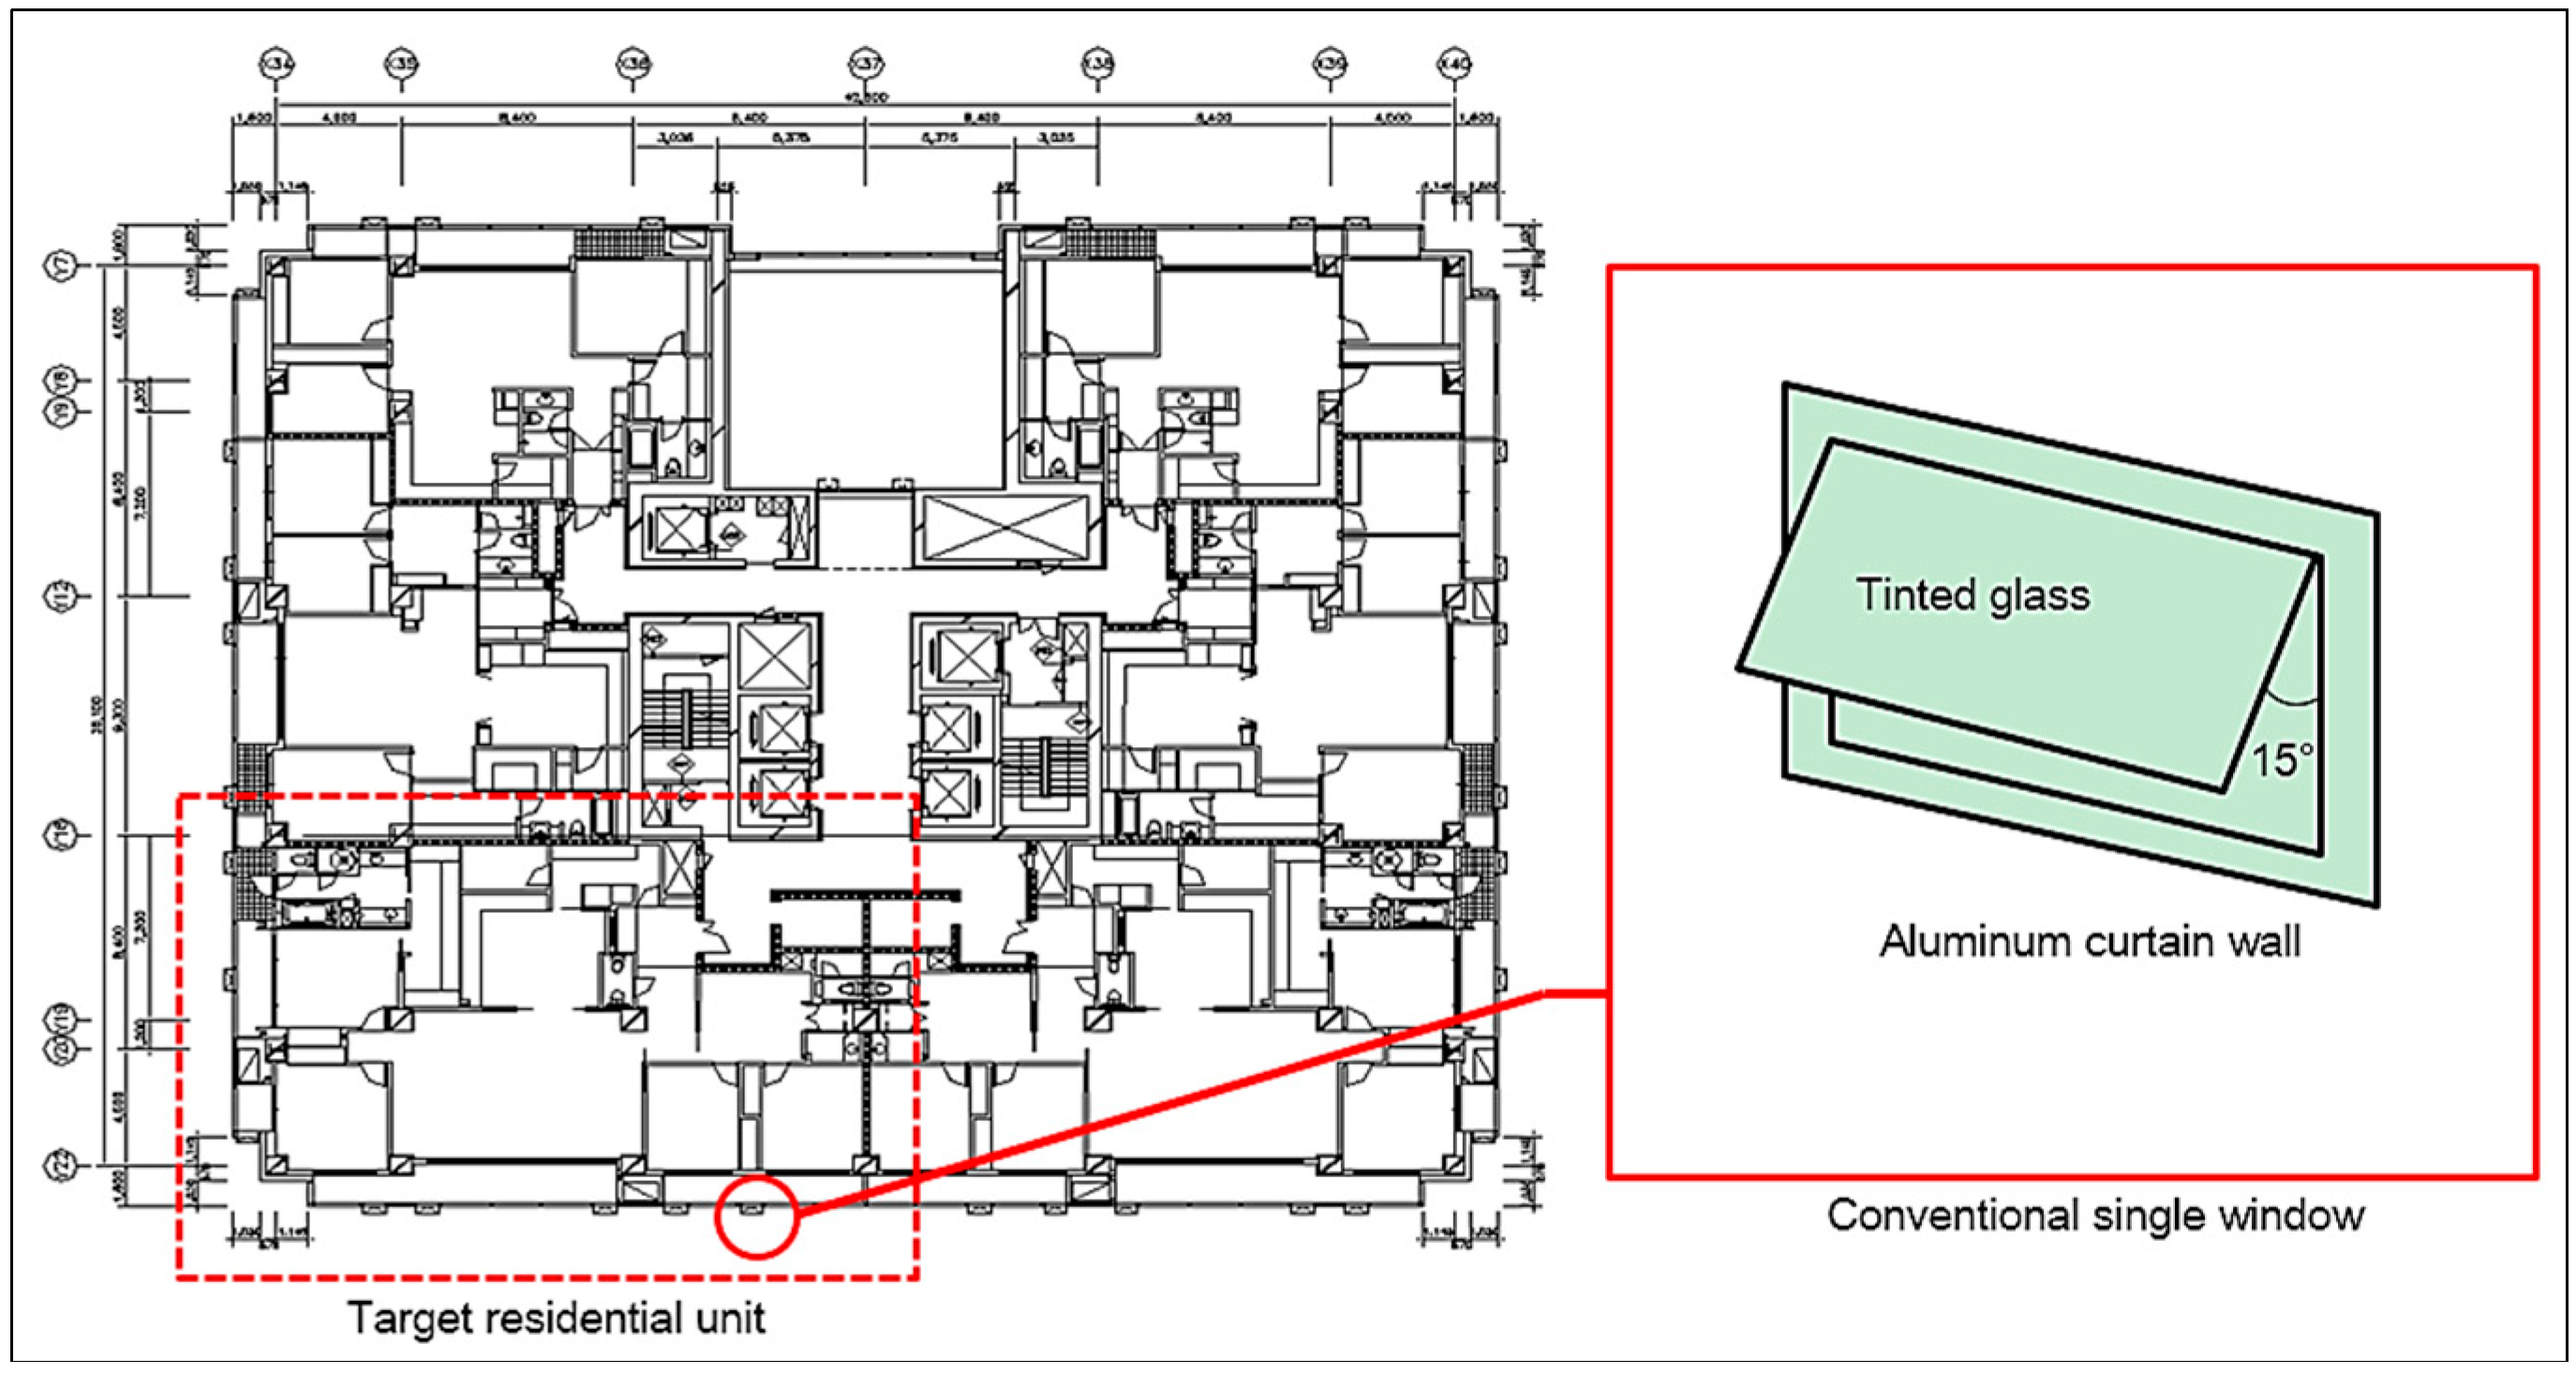
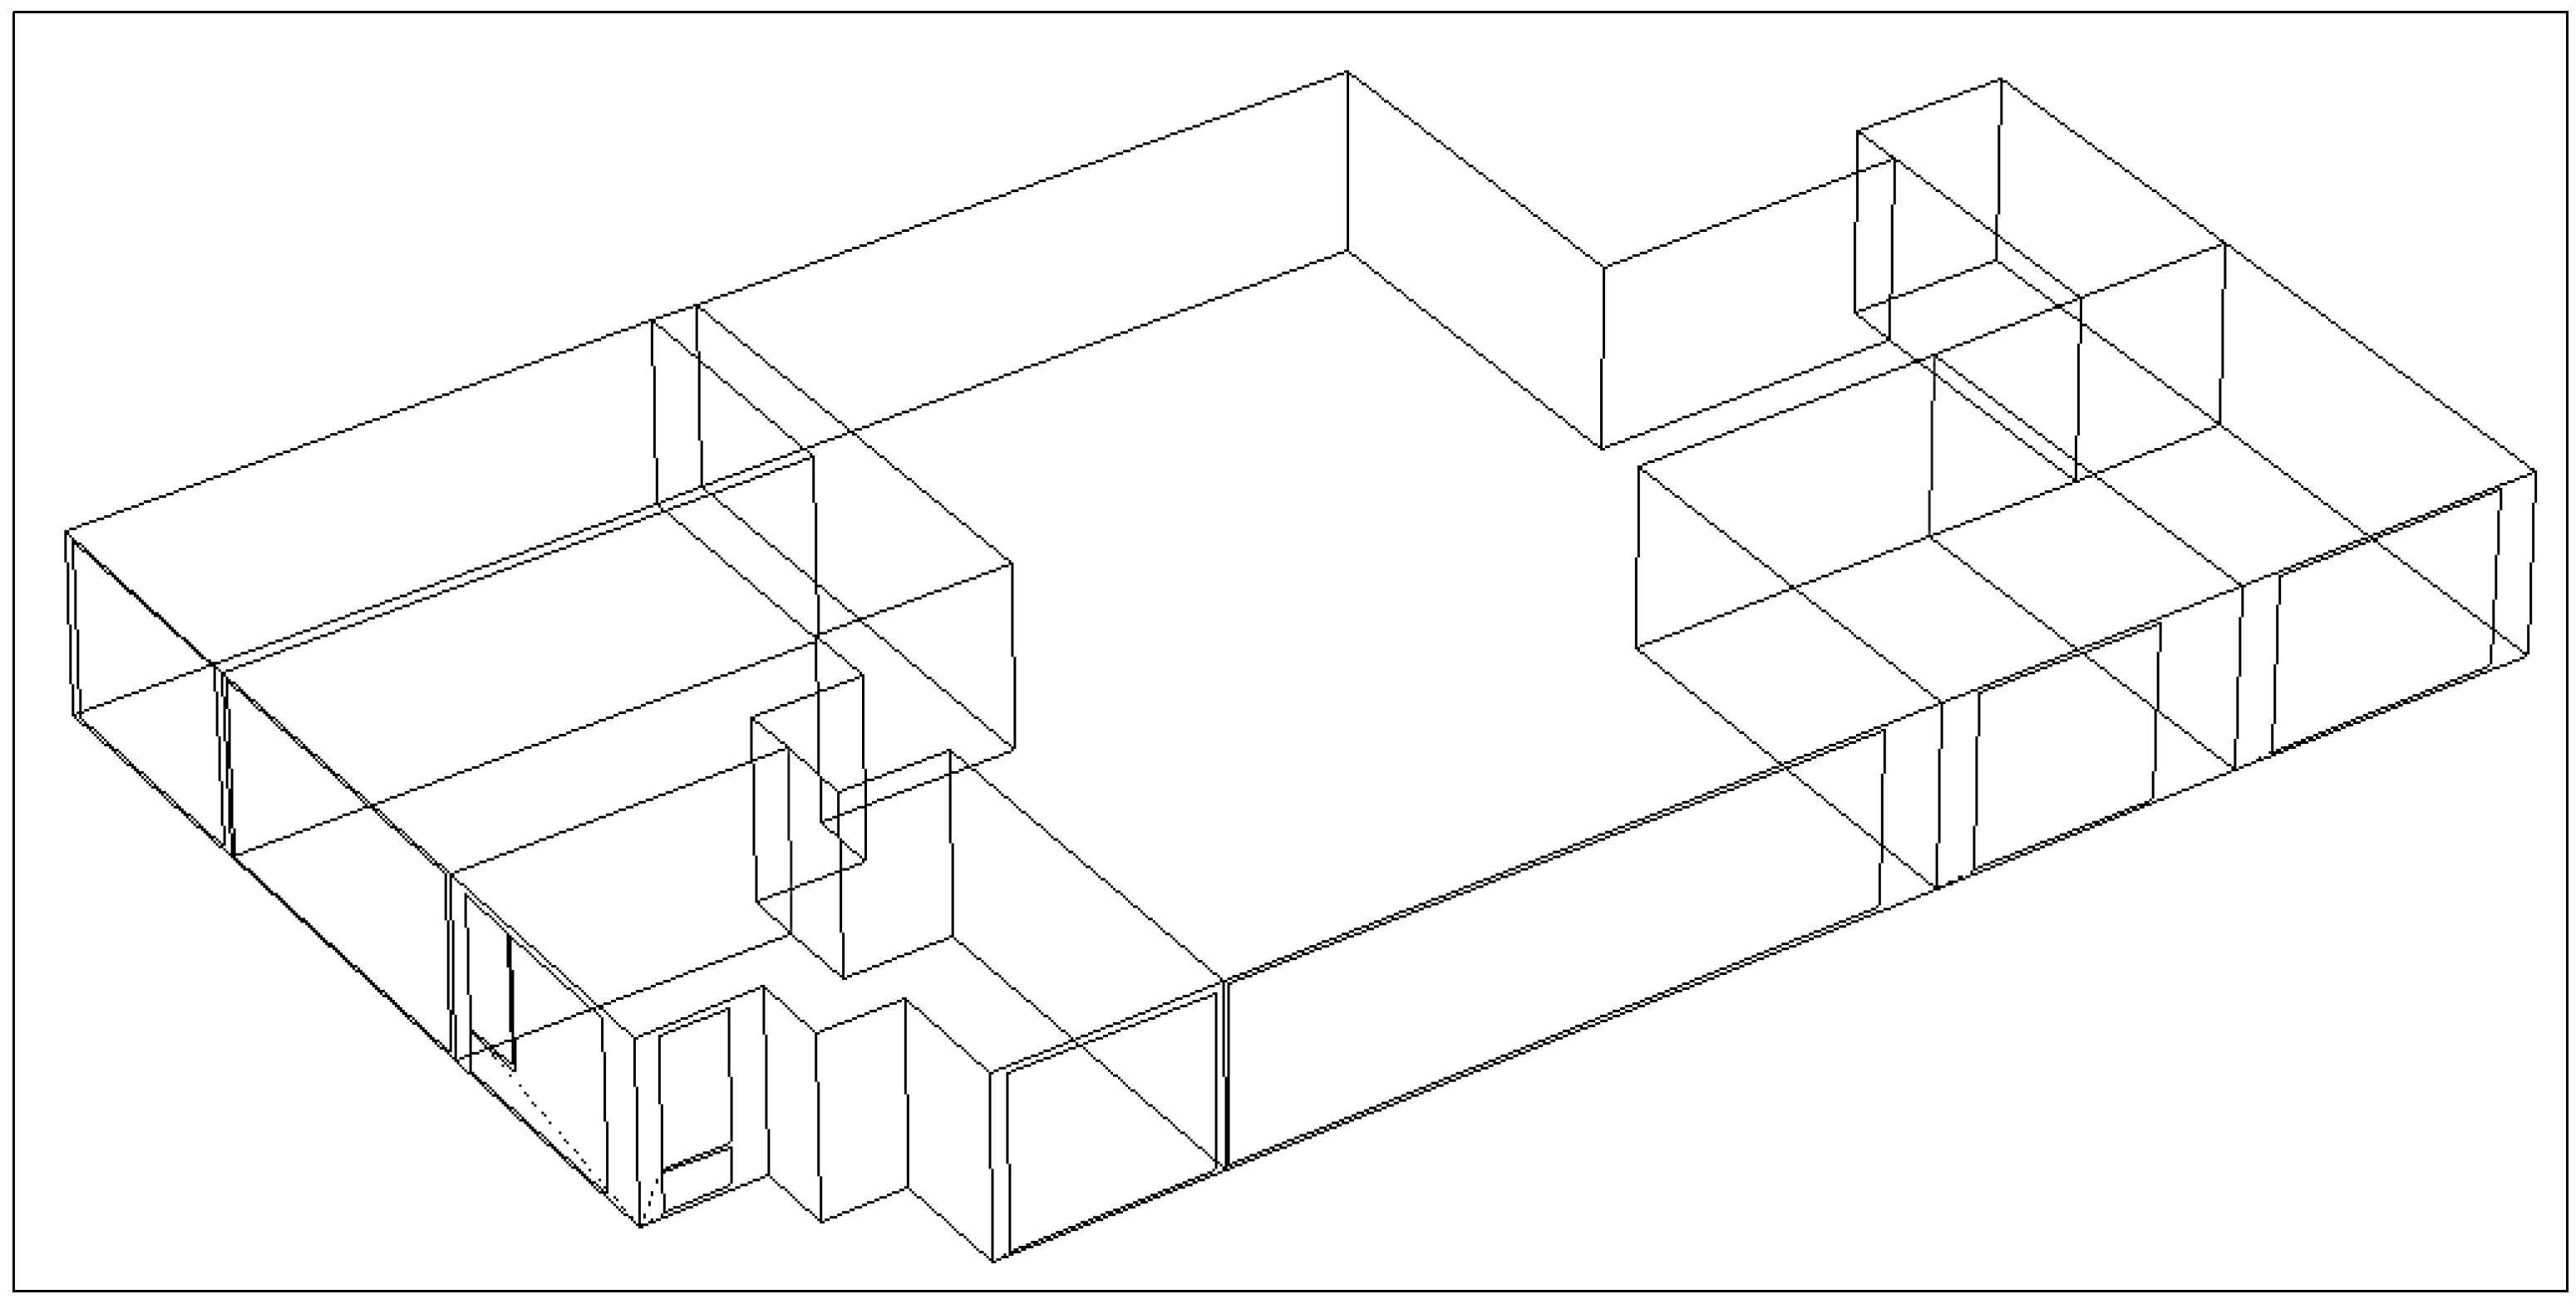
4.1. Target Building


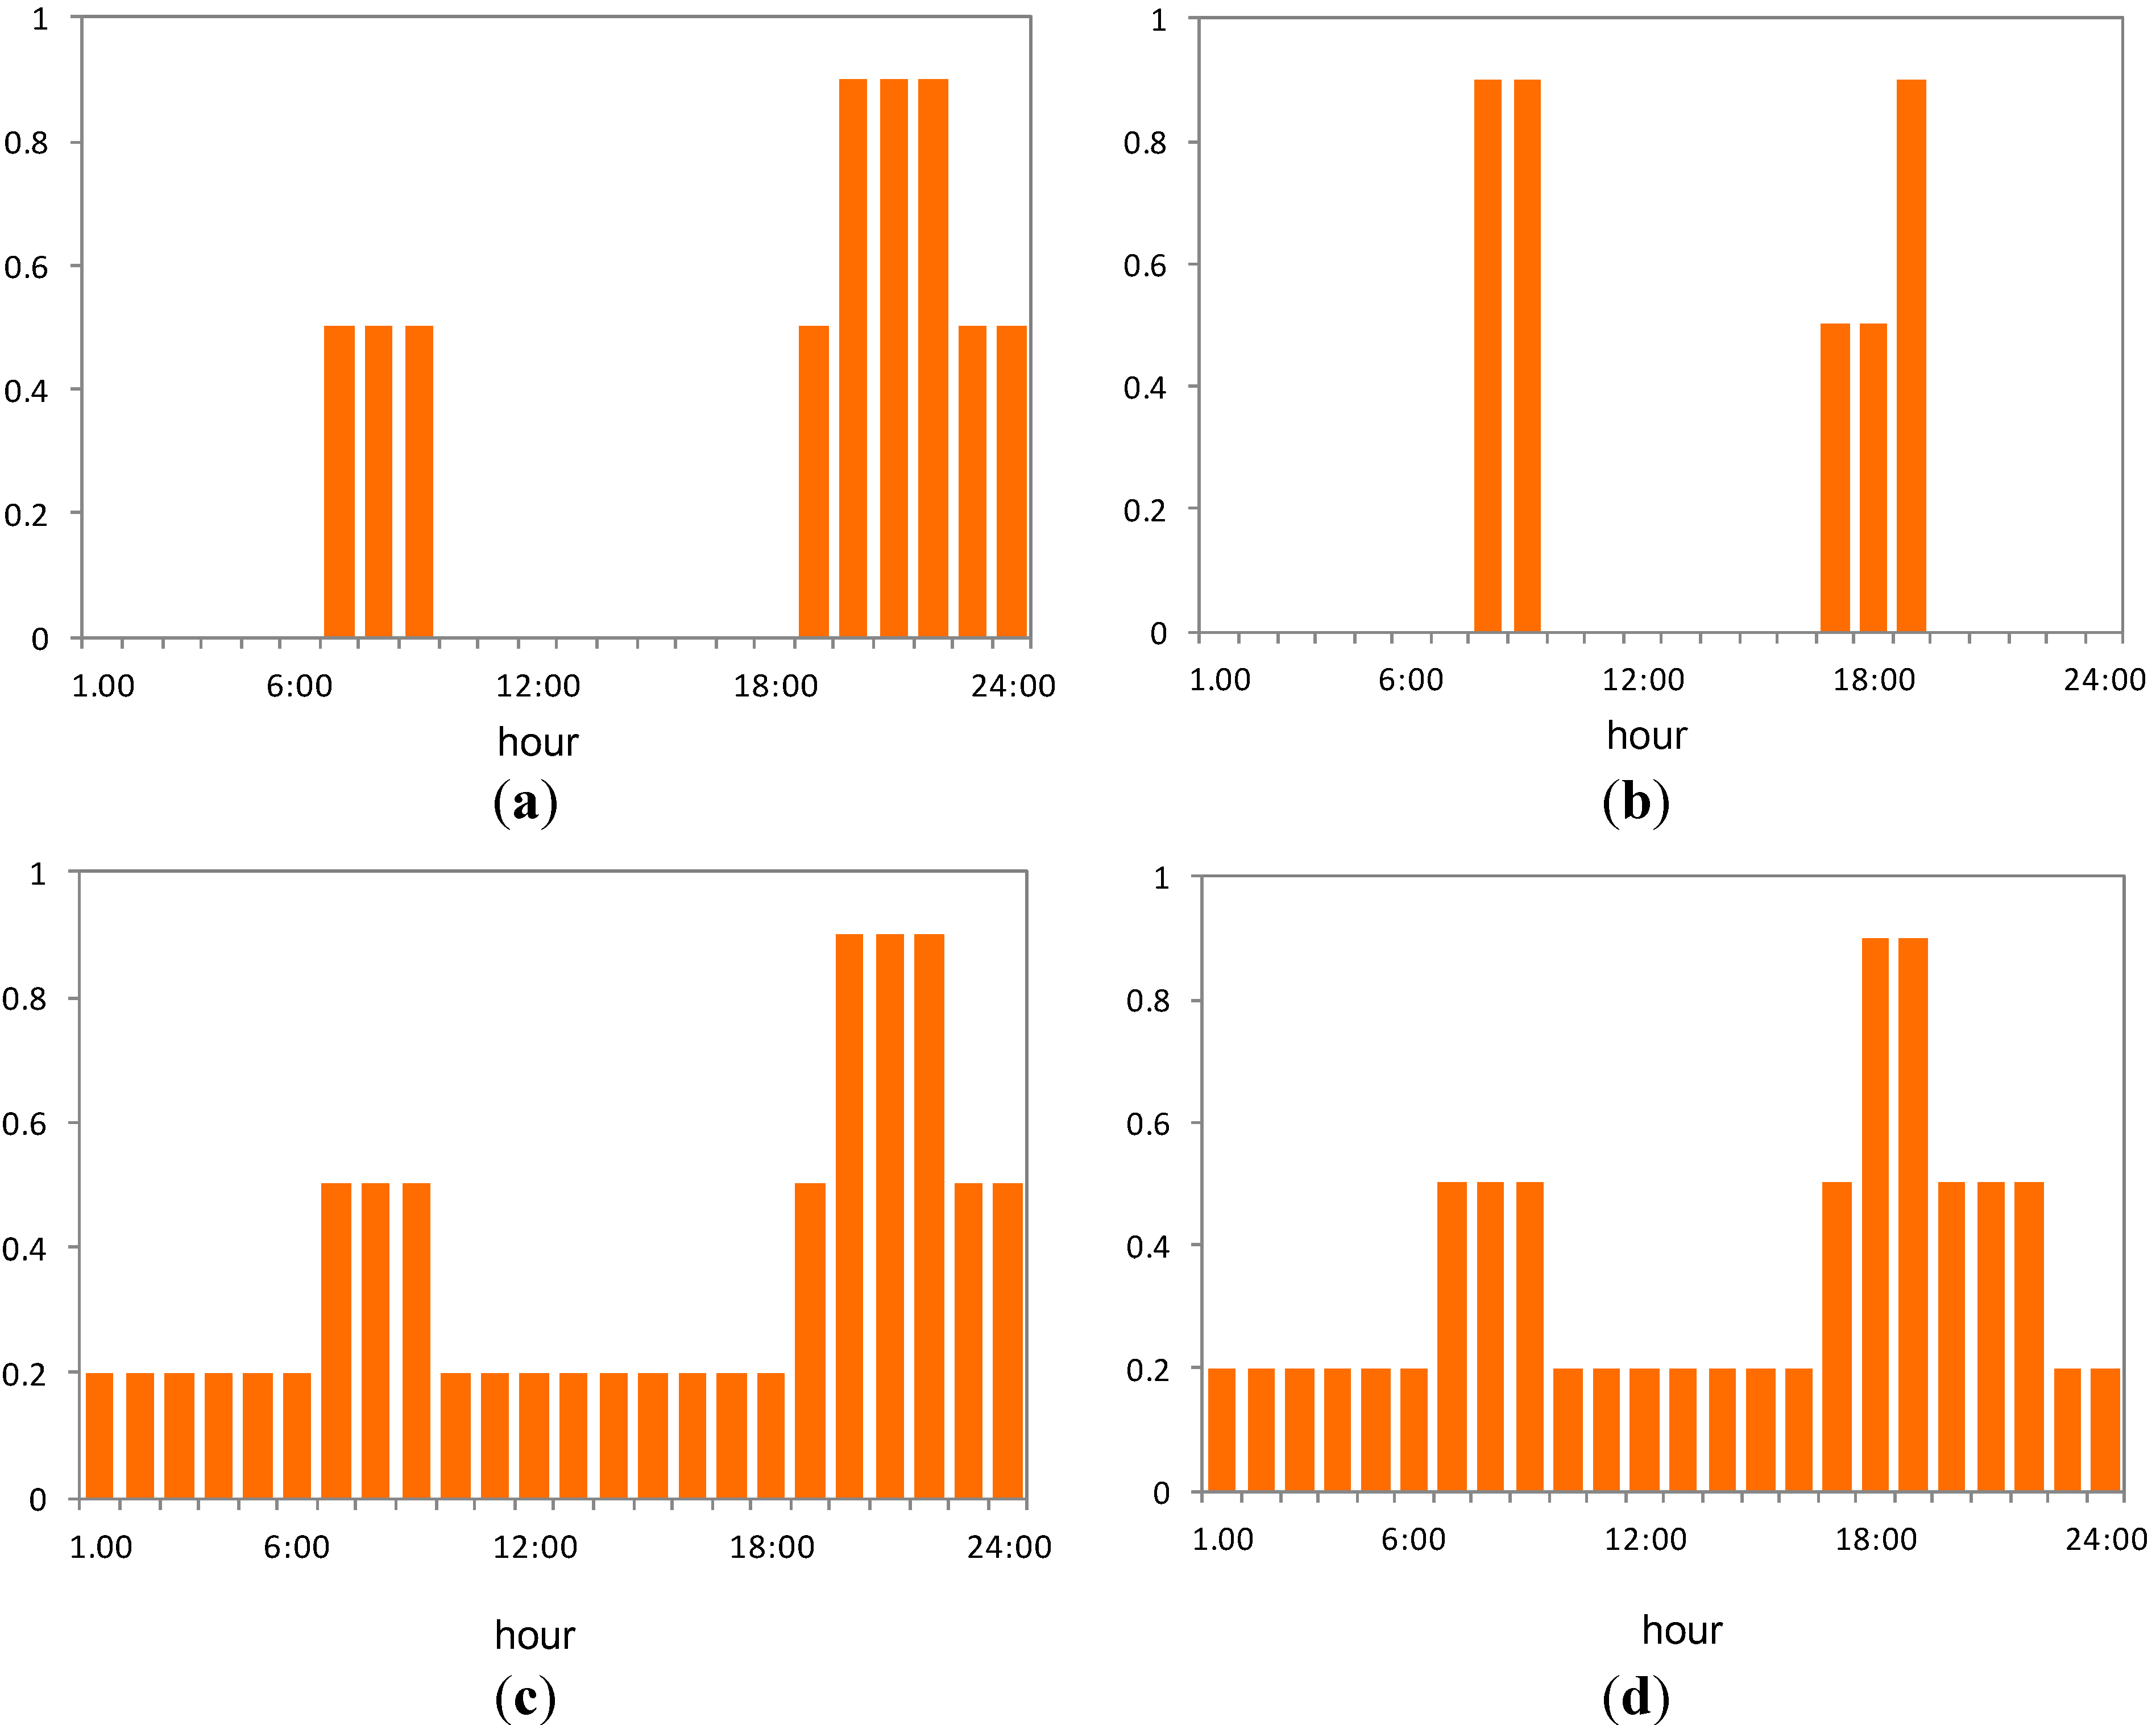
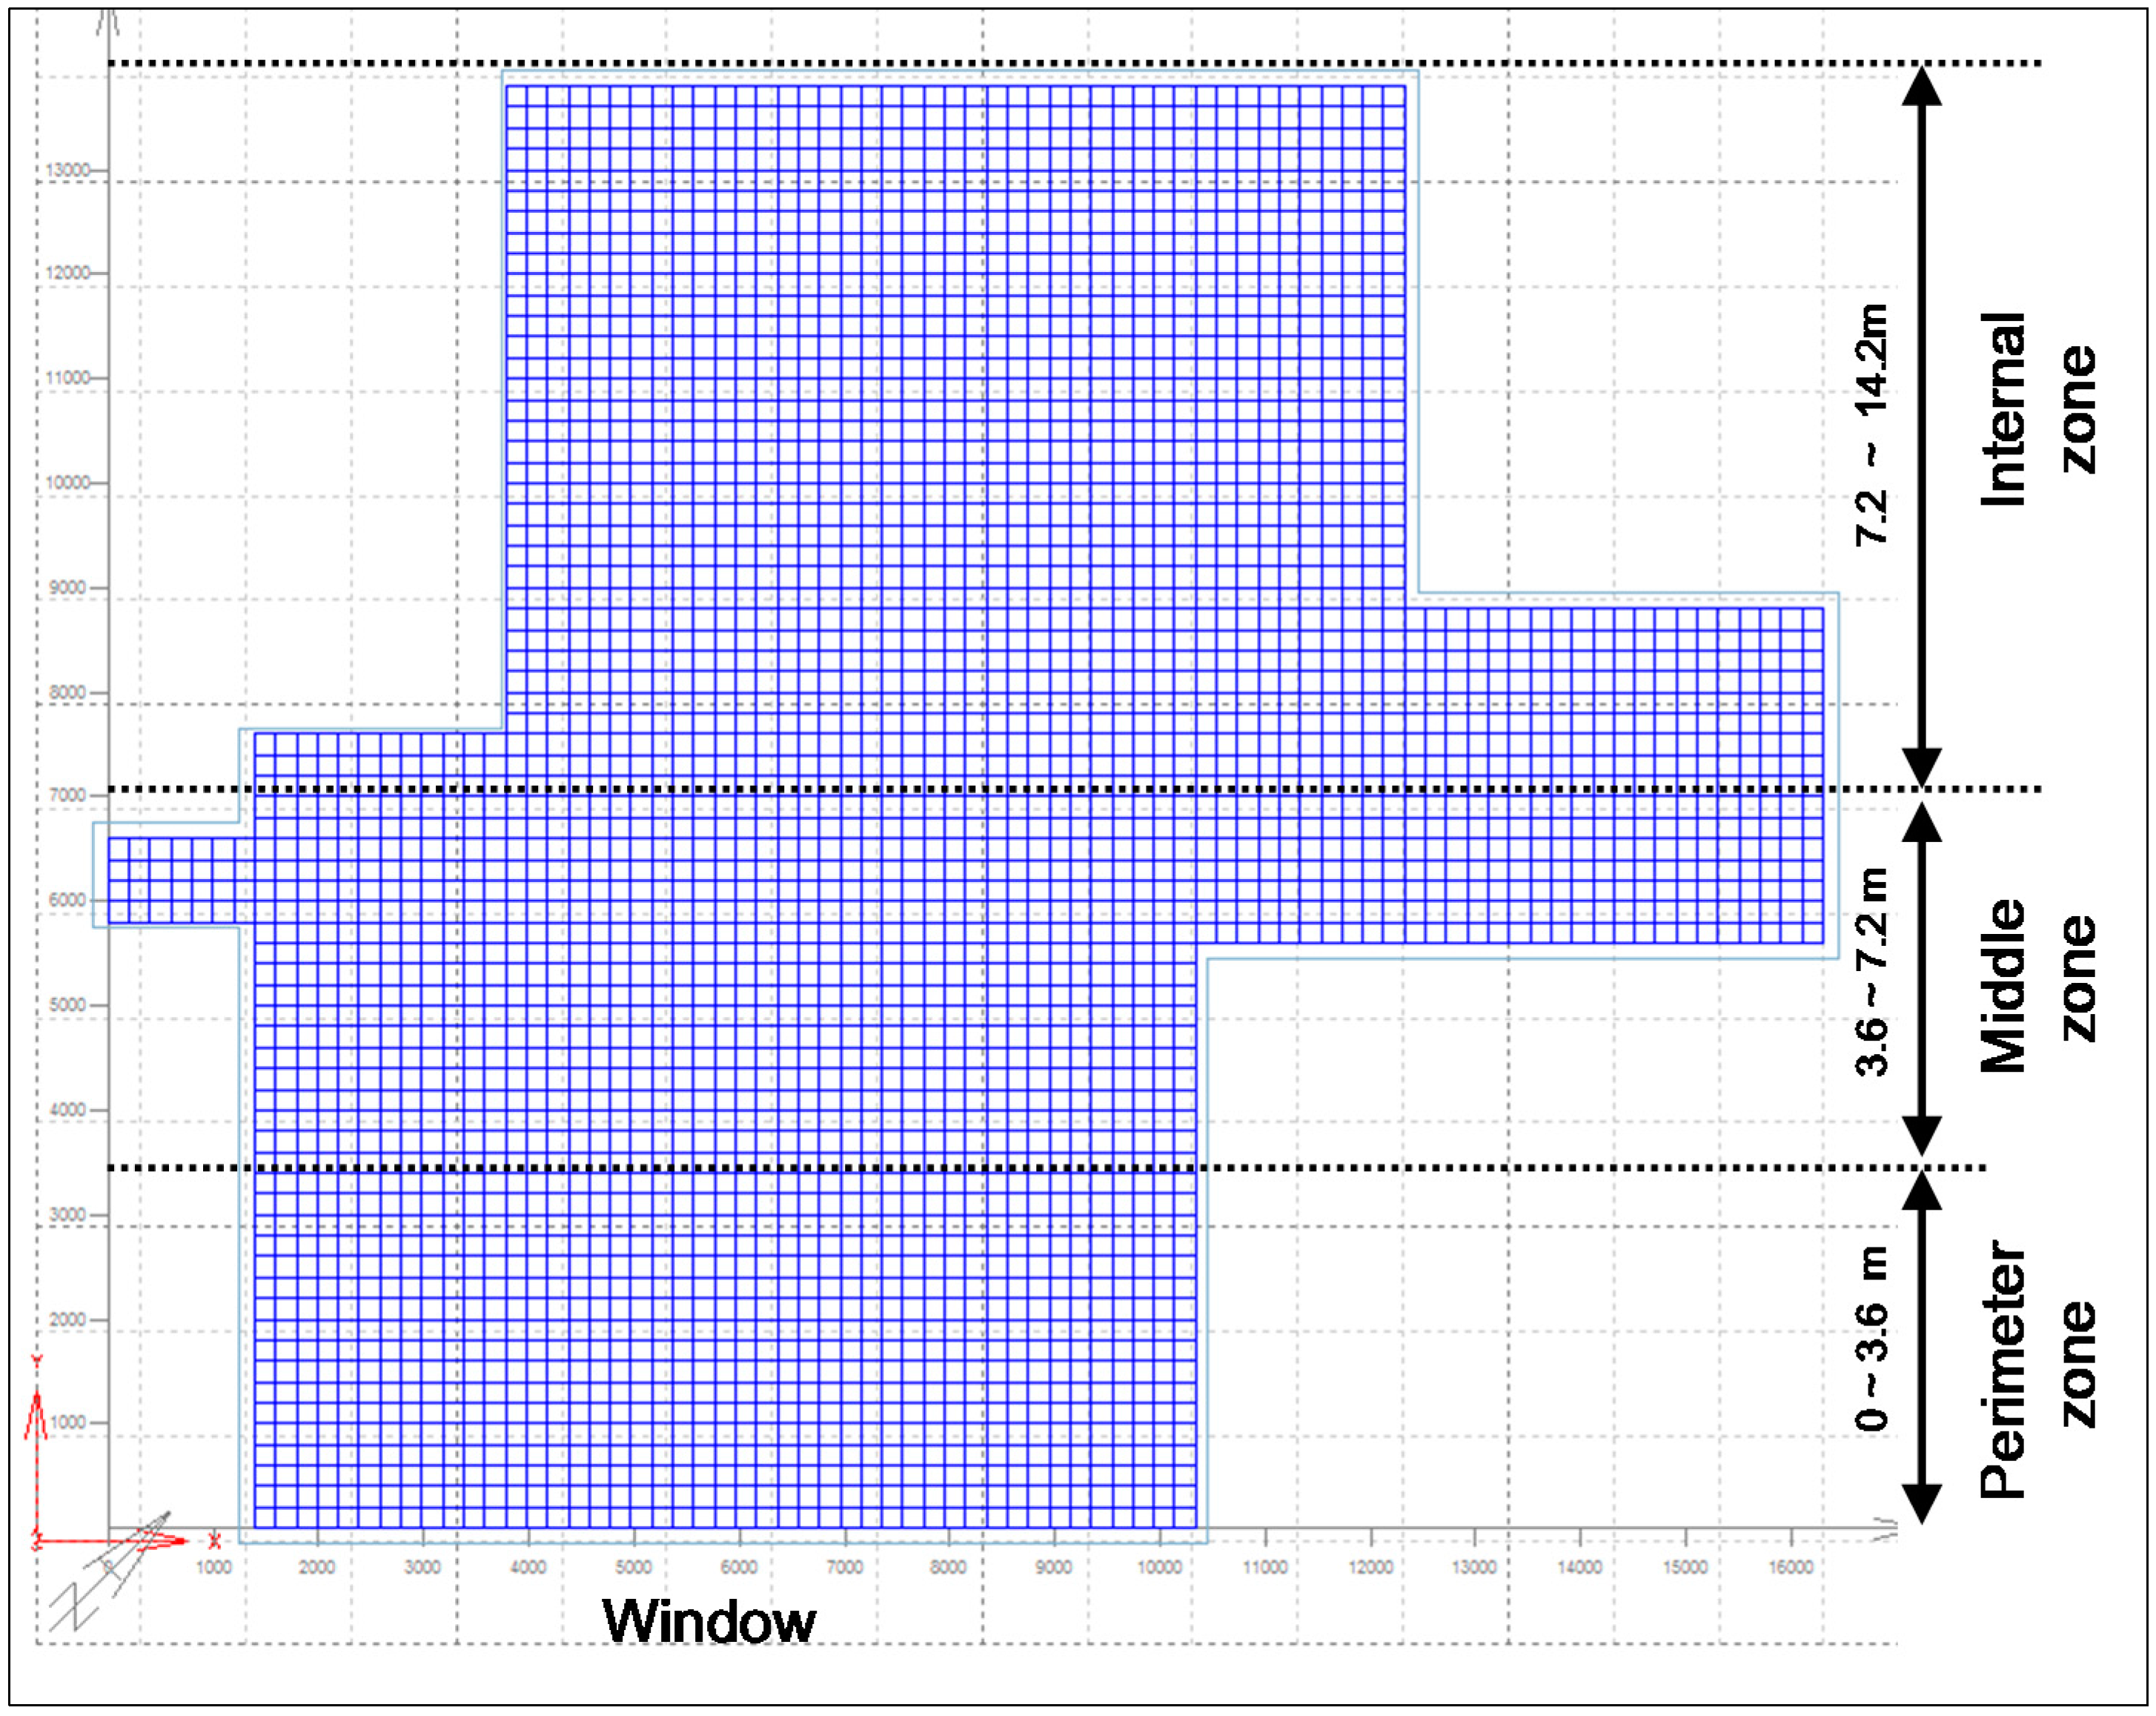
4.2. Simulation Modeling


| Composition | U-factor |
|---|---|
| External wall | 0.47 W/m2K |
| Internal wall | 0.6 W/m2K |
| Component | Properties |
|---|---|
| U-factor | 2.7 W/m2K–Al frame |
| Solar transmittance | 0.236 |
| Shading device | Internal shading device |

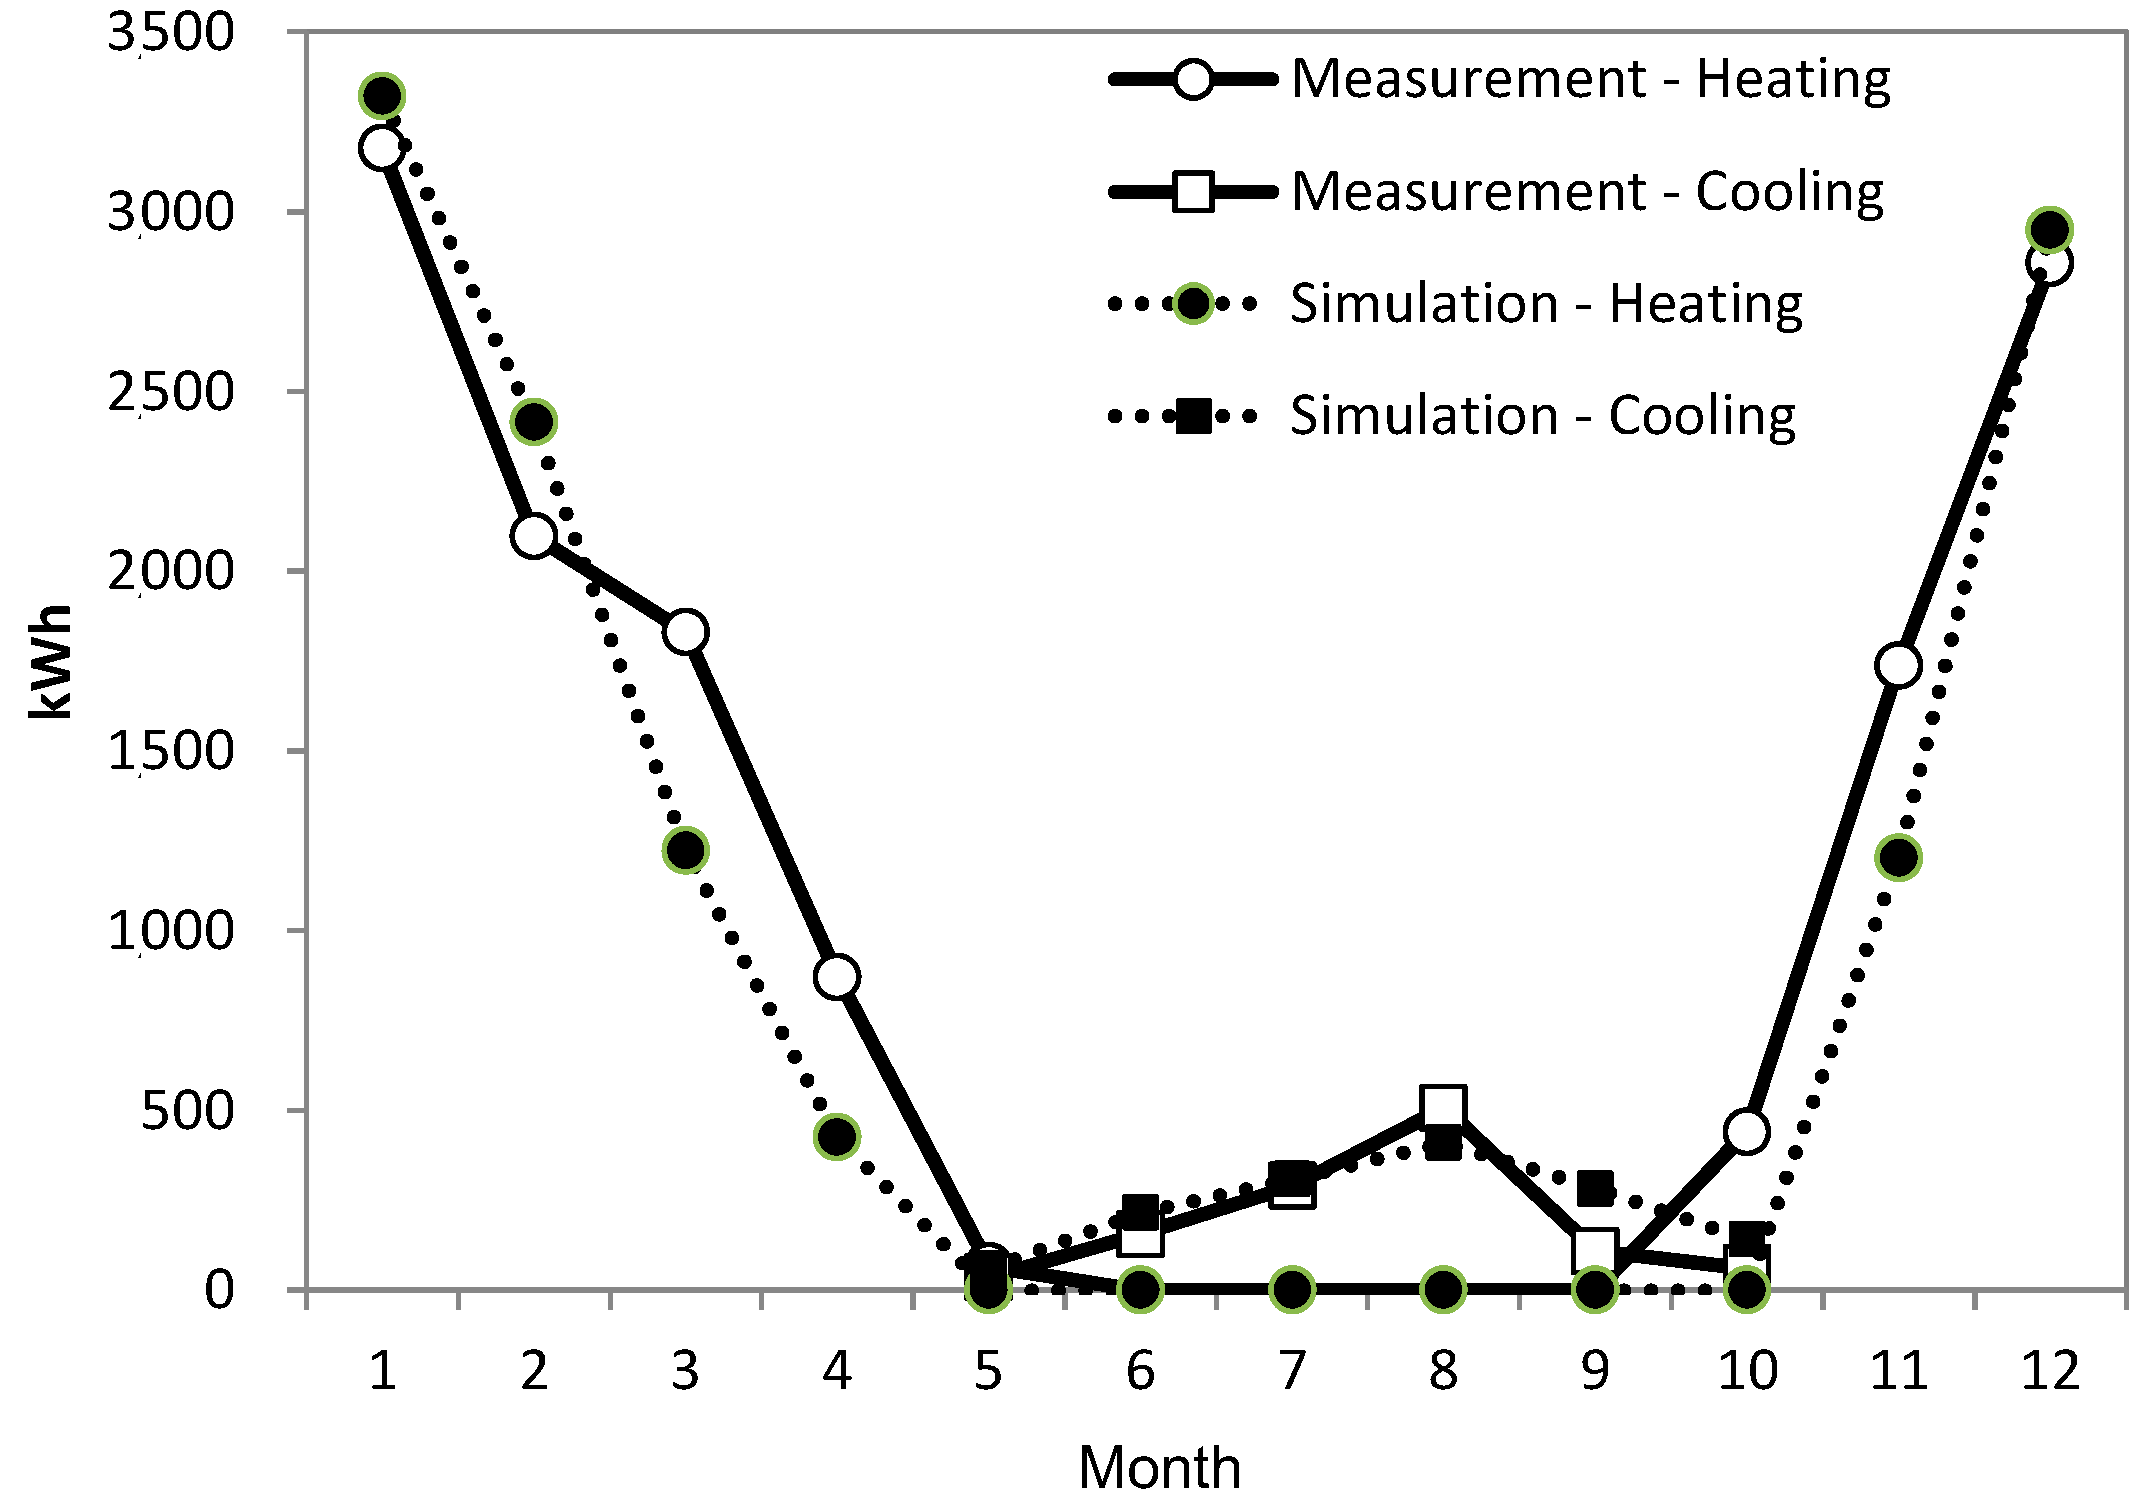
4.3. Results
= monthly consumption-monthly base consumption

| Month | Measurement (k Wh) | Simulation (k Wh) | ||
|---|---|---|---|---|
| Heating | Cooling | Heating | Cooling | |
| January | 3176 | 3321 | ||
| February | 2098 | 2414 | ||
| March | 1831 | 1223 | ||
| April | 872 | 425 | ||
| May | 67 | 35 | 61 | |
| June | 157 | 216 | ||
| July | 290 | 309 | ||
| August | 507 | 410 | ||
| September | 109 | 283 | ||
| October | 441 | 61 | 141 | |
| November | 1738 | 1203 | ||
| December | 2858 | 2948 | ||
| Sum | 13,081 | 1159 | 11,534 | 1420 |
| Difference | 11.8% | 22.6% | ||
5. Energy Simulations
5.1. Simulation Cases

| Case | Window | Shading device (outward reflectivity/inward reflectivity) | Ventilation mode |
|---|---|---|---|
| Case 1 | SW | Internal shading device (84%/84%) | Minimum ventilation mode (0.7 ACH) |
| Case 2 | DW | Internal shading device (84%/84%) | |
| Case 3 | DWS-1 | Shading in cavity (84%/84%) | |
| Case 4 | DWS-2 | Shading in cavity (84%/10%) | |
| Case 5 | SW | Internal shading device (84%/84%) | Natural ventilation + Minimum ventilation mode (0.7 ACH) |
| Case 6 | DW | Internal shading device (84%/84%) | |
| Case 7 | DWS-1 | Shading in cavity (84%/84%) | |
| Case 8 | DWS-2 | Shading in cavity (84%/10%) |

| Type | Properties of window system | Shading device |
|---|---|---|
| SW | - Glazing type: tinted glass panes |  |
| - U-factor: external window (2.7 W/m2K–Al frame) | ||
| - Solar transmission: 0.236 | ||
| - Operable area: 0.62 m2 (Cd: 0.13) | ||
| DW | - Glazing type: clear glass panes + low-E glass panes | |
| - U-factor: internal window (1.2 W/m2K–PVC frame) | ||
| external window (2.7 W/m2K–Al frame) | ||
| - Solar transmission: 0.266 | ||
| - Operable area: 0.62 m2 (Cd: 0.13) | ||
| DWS | - Glazing type: clear glass panes + low-E glass panes | |
| - U-factor: internal window (2.4 W/m2K–Al frame) | ||
| external window (2.7 W/m2K–Al frame) | ||
| - Solar transmission: 0.266 | ||
| - Operable area 1 (External window—cavity space): | ||
| Horizontal opening: 0.17 m2 (Cd: 0.64) | ||
| Vertical opening: 0.36 m2 (Cd: 0.24) | ||
| - Operable area 2 (Internal window): | ||
| Fully opened condition: 1.28 m2 (Cd: 0.64) | ||
| Partially opened condition: 0.60 m2 (Cd: 0.64) |
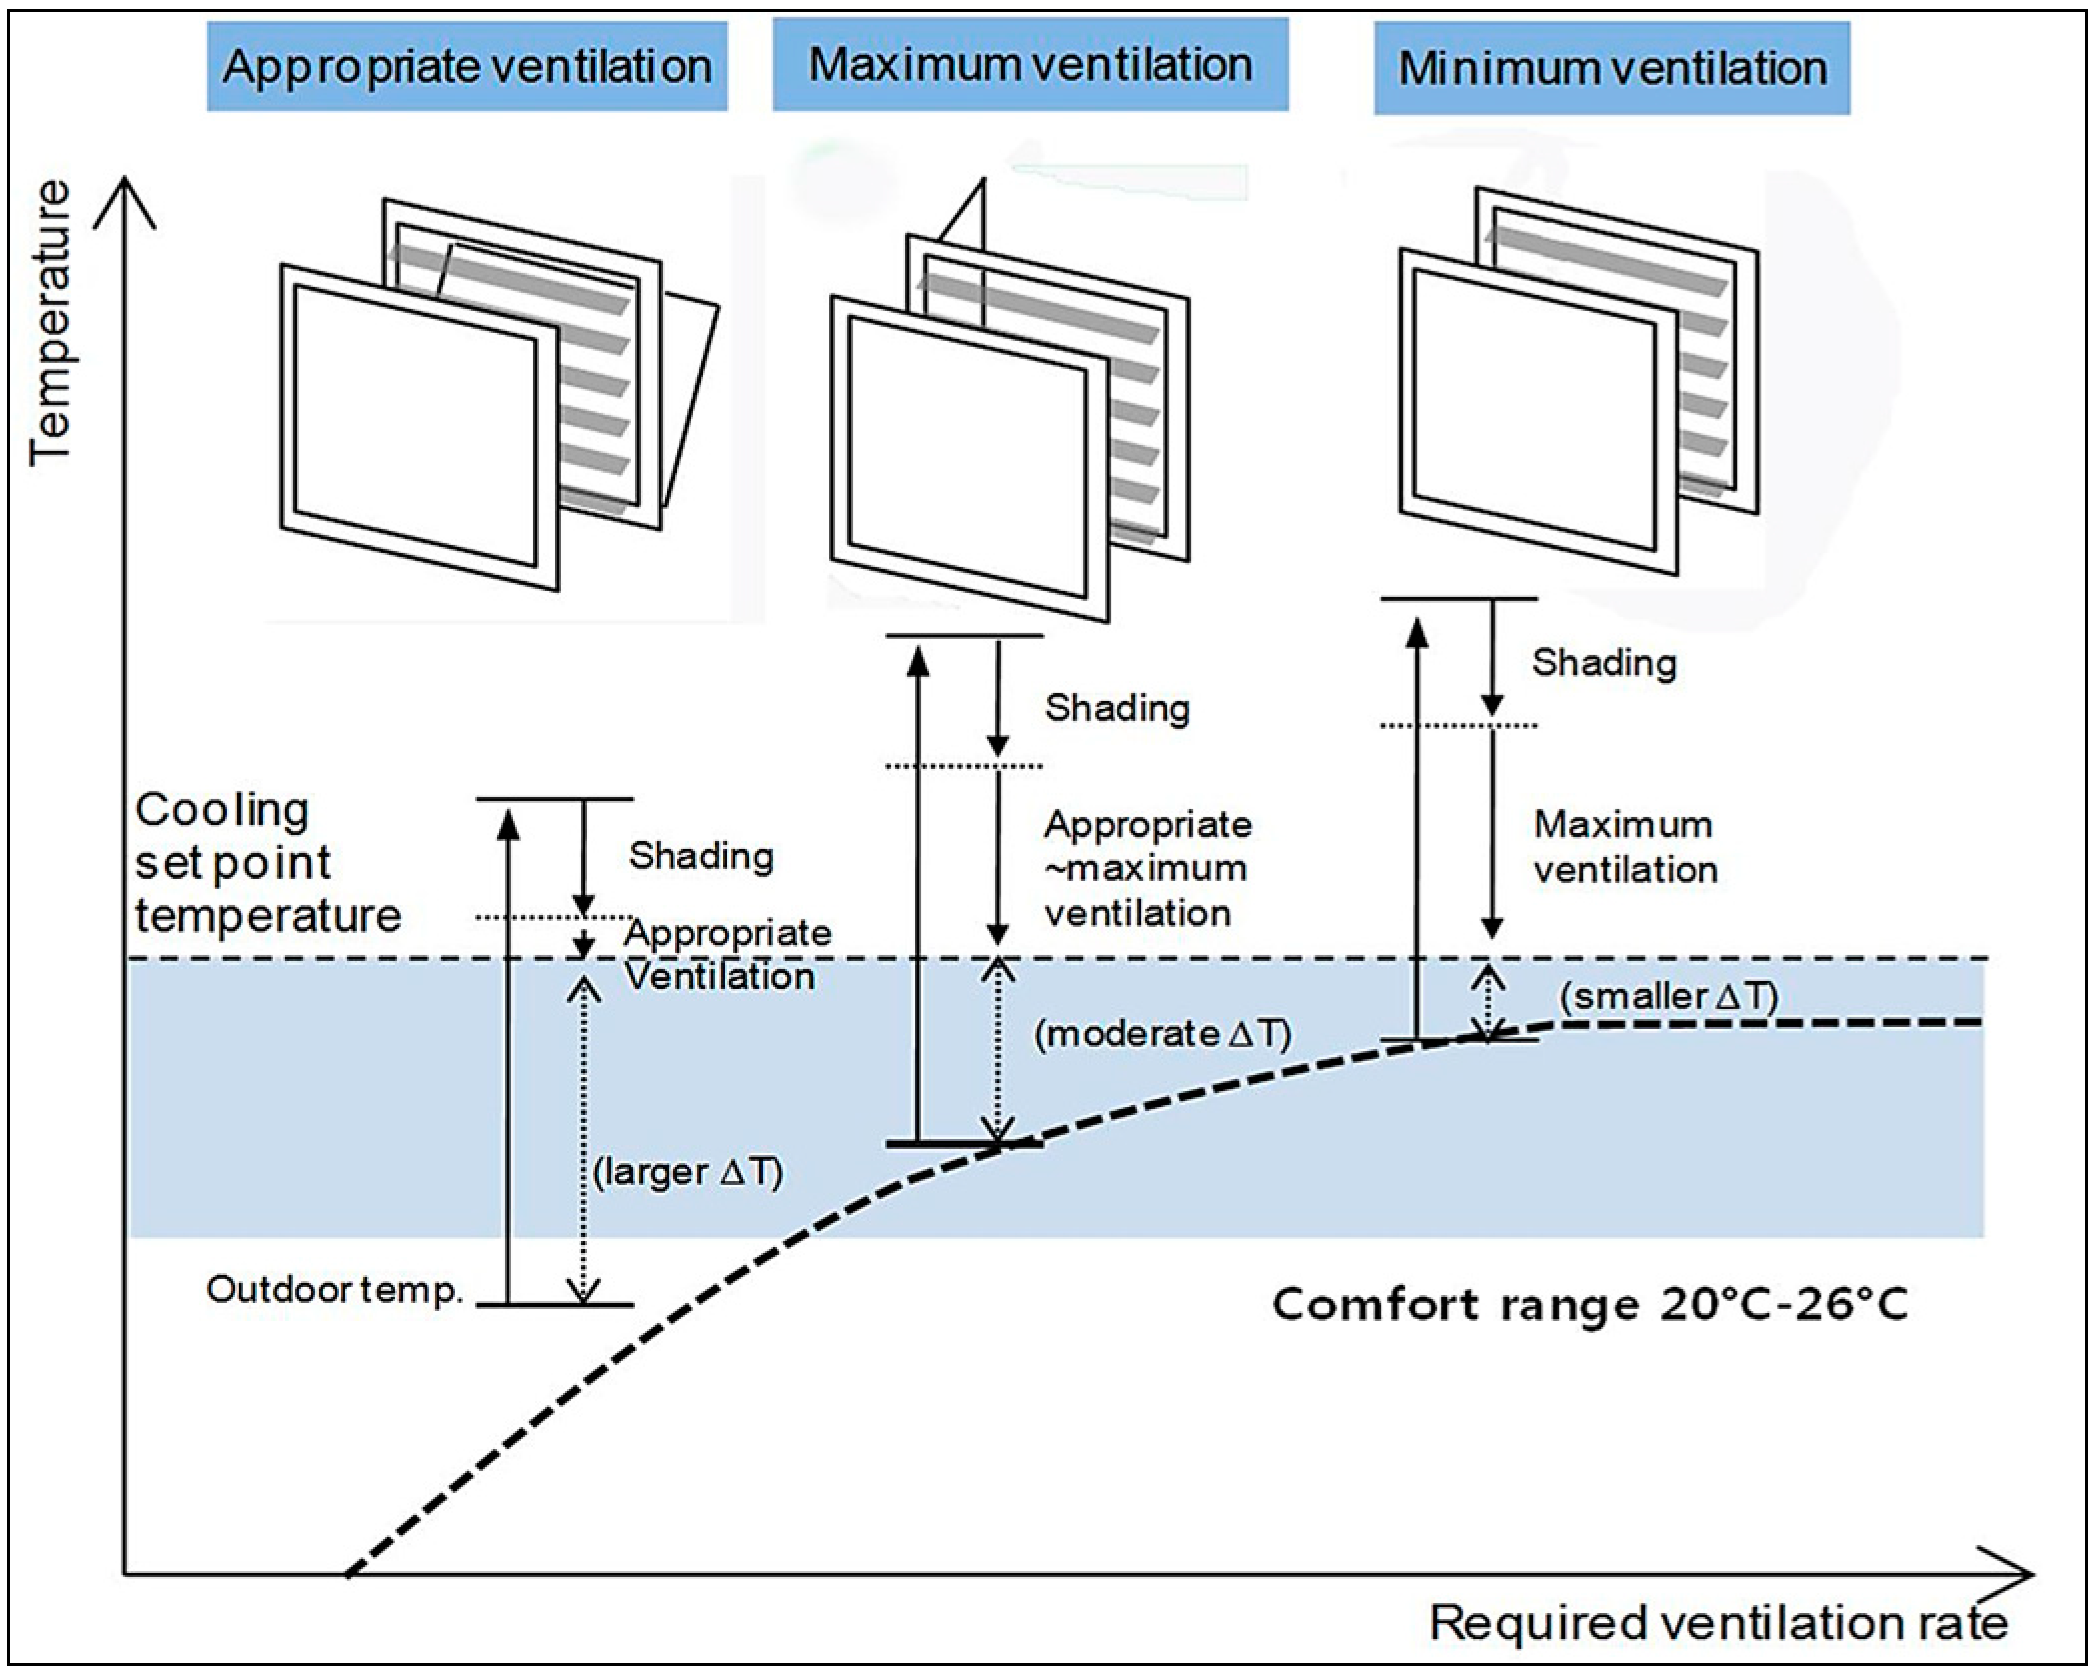
5.2. Natural Ventilation Strategy


5.3. Results and Discussion
5.3.1. Cooling Loads
| Category | Minimum ventilation mode (kWh) | Natural ventilation + Minimum ventilation mode (kWh) | ||||||
|---|---|---|---|---|---|---|---|---|
| SW | DW | DWS-1 | DWS-2 | SW | DW | DWS-1 | DWS-2 | |
| May | 180 | 144 | 24 | 17 | 50 | 28 | 0 | 0 |
| June | 686 | 676 | 438 | 396 | 377 | 292 | 121 | 103 |
| July | 989 | 956 | 802 | 763 | 624 | 546 | 397 | 366 |
| August | 1313 | 1223 | 1006 | 970 | 1001 | 886 | 613 | 577 |
| September | 905 | 835 | 387 | 359 | 511 | 378 | 75 | 65 |
| October | 453 | 382 | 83 | 77 | 315 | 251 | 22 | 19 |
| Total | 4527 | 4215 | 2739 | 2582 | 2879 | 2380 | 1228 | 1130 |
| Categories | SW | DW | DWS-1 | DWS-2 | |
|---|---|---|---|---|---|
| Cooling load (kWh) | Minimum ventilation mode | 4523 | 4215 | 2739 | 2582 |
| Reductions (%) | - | 7% | 39% | 43% | |
| Minimum ventilation + Natural ventilation mode | 2879 | 2380 | 1228 | 1130 | |
| Reductions (%) | - | 17% | 57% | 61% | |
| Reductions by ventilation modes (%) | 36% | 44% | 55% | 56% | |
| Window types | Minimum ventilation mode | Natural ventilation +Minimum ventilation mode |
|---|---|---|
| SW | 2911 | 1677 |
| DW | 3295 | 1882 |
| DWS-1 | 3030 | 1367 |
| DWS-2 | 2959 | 1299 |
| Window types | Outdoor temperature | |
|---|---|---|
| 15–20 °C | 20–25 °C | |
| SW | 4.1 | 12.7 |
| DW | 4.2 | 12.7 |
| DWS-1 | 4.4 | 13.5 |
| DWS-2 | 4.4 | 13.5 |

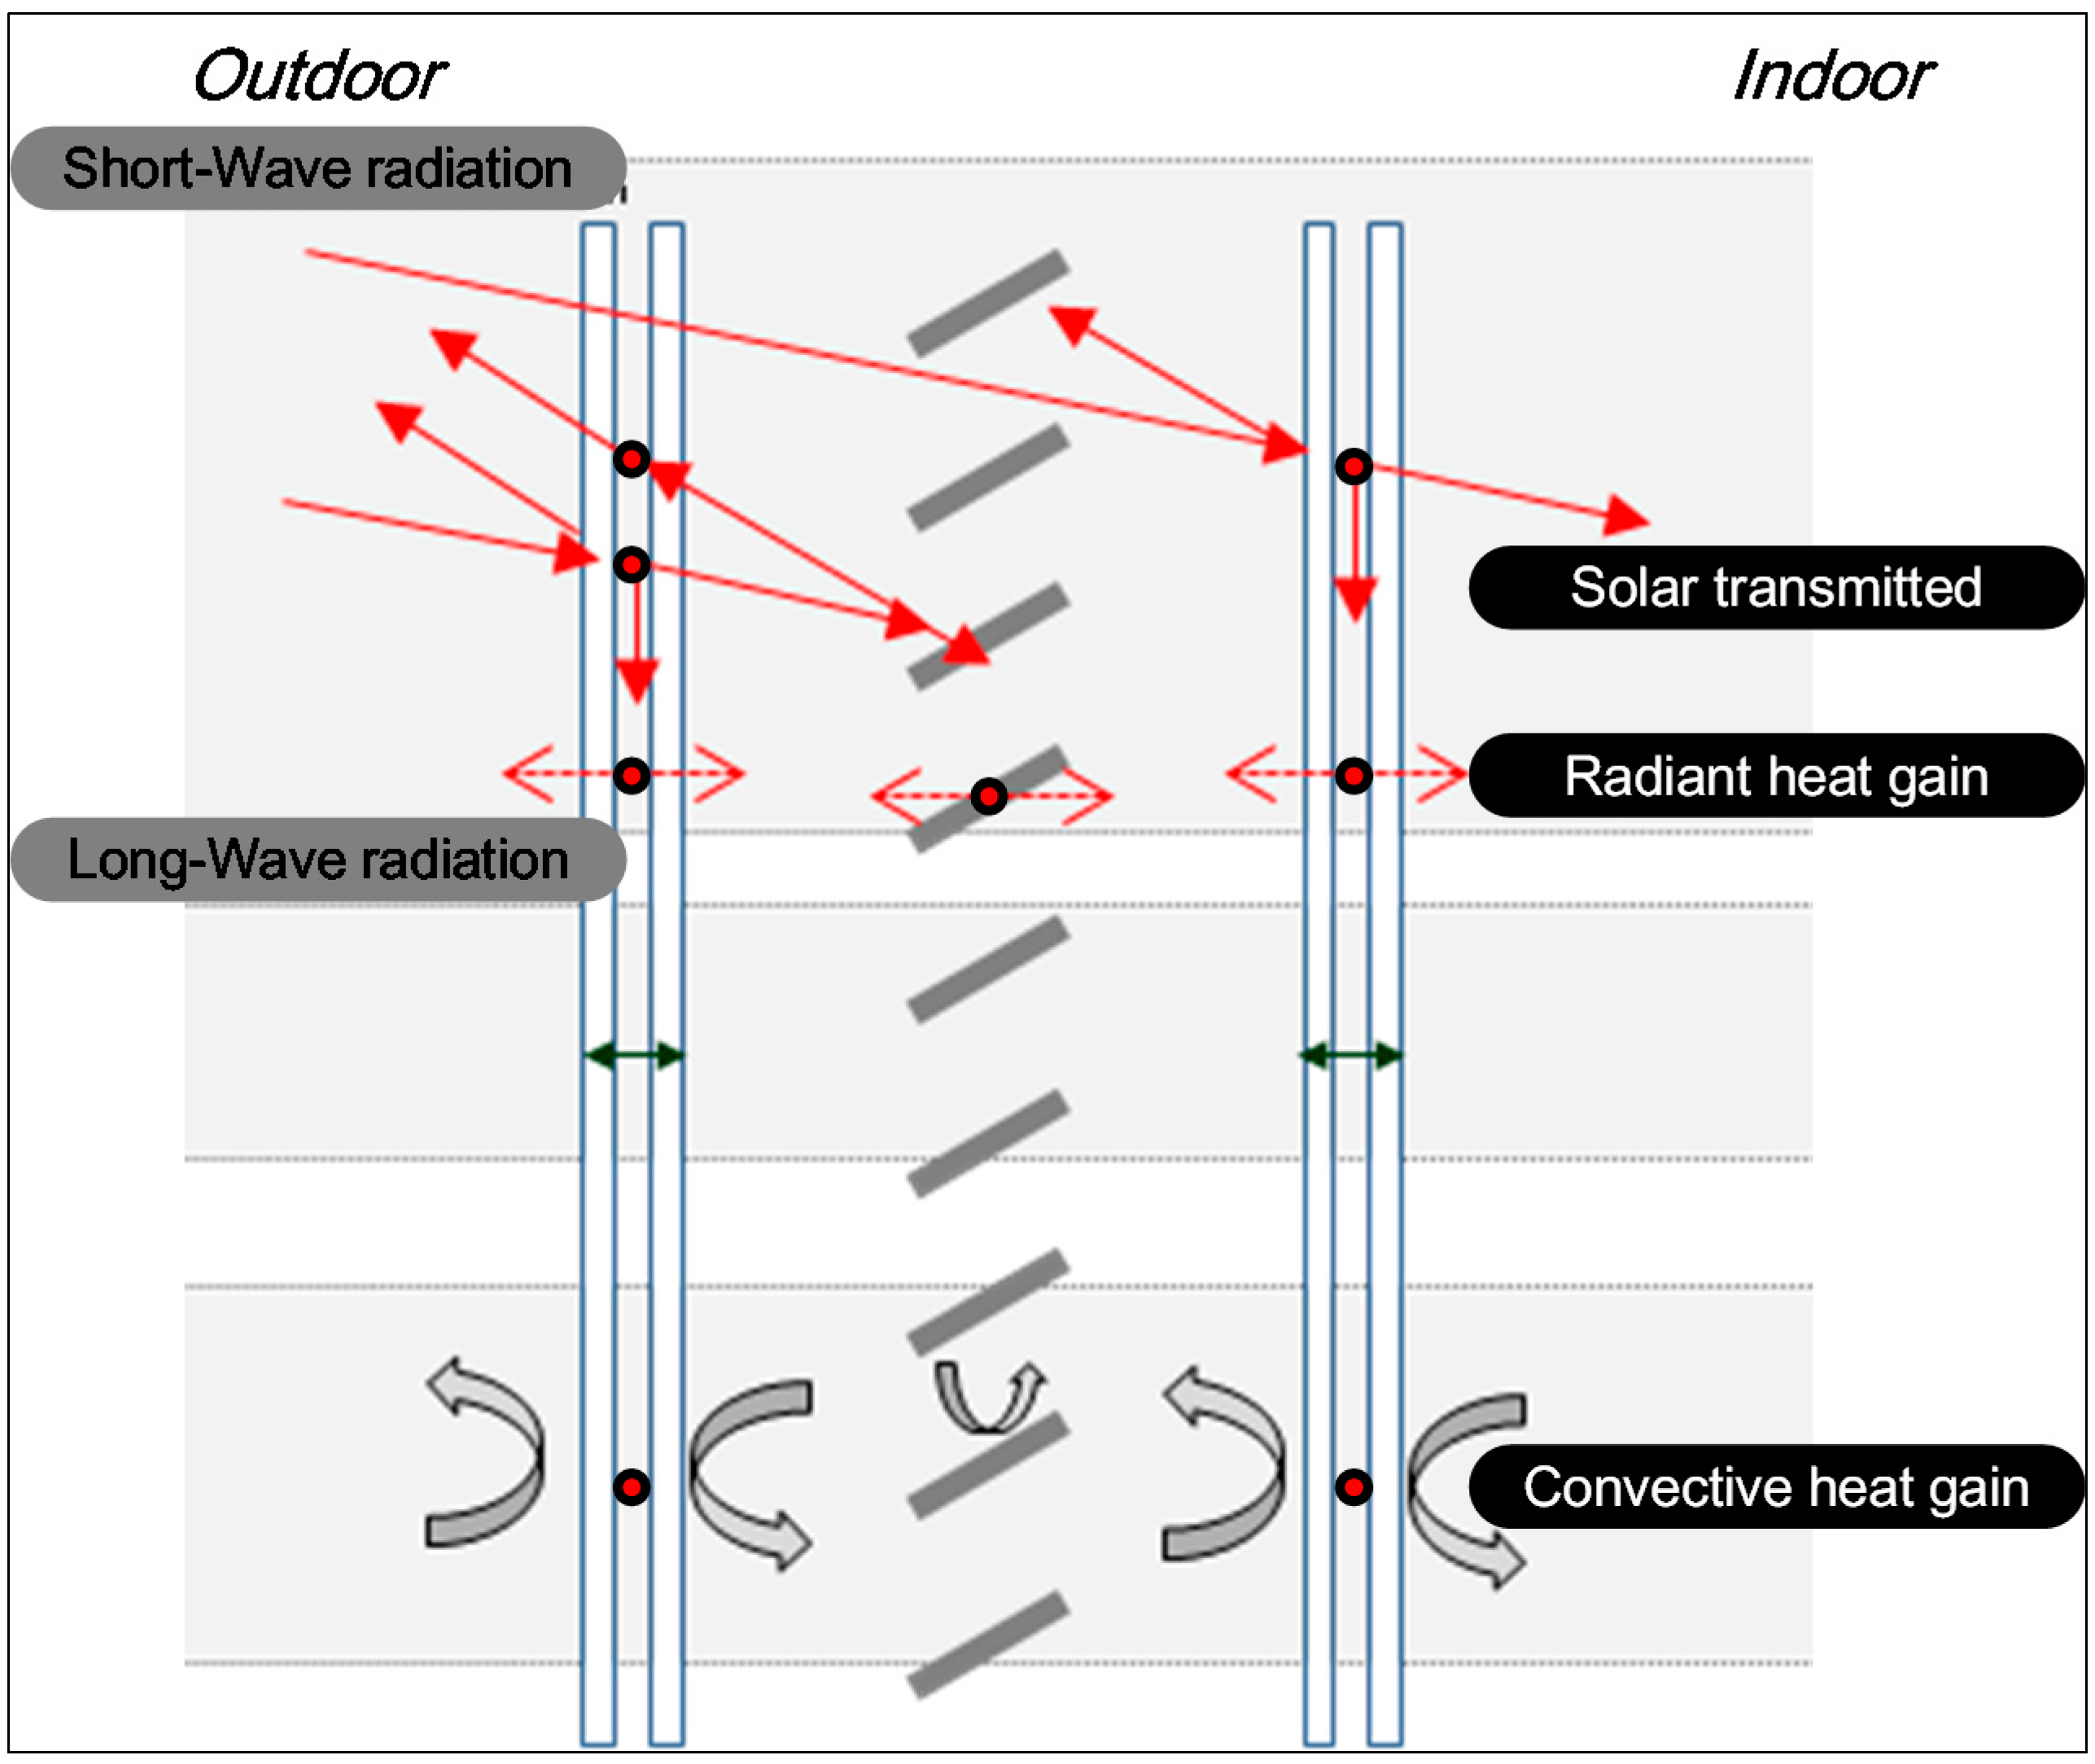
| Category | SW | DW | DWS-1 | DWS-2 | |
|---|---|---|---|---|---|
| Minimum ventilation mode | Radiant heat gain | 3000 | 2085 | 243 | 284 |
| Convective heat gain | 3337 | 2515 | 936 | 1035 | |
| Solar transmitted | 1282 | 1731 | 867 | 490 | |
| Natural ventilation + Minimum ventilation mode | Radiant heat gain | 3057 | 1504 | 160 | 168 |
| Convective heat gain | 2984 | 2693 | 527 | 538 | |
| Solar transmitted | 1050 | 137 | 499 | 278 | |
5.3.2. Electricity Cost

| Category | Minimum ventilation (kWh) | Natural ventilation + Minimum ventilation mode (kWh) | ||||||
|---|---|---|---|---|---|---|---|---|
| SW | DW | DWS-1 | DWS-2 | SW | DW | DWS-1 | DWS-2 | |
| May | 643 | 631 | 591 | 589 | 600 | 592 | 583 | 583 |
| June | 812 | 808 | 729 | 715 | 709 | 680 | 623 | 617 |
| July | 913 | 902 | 850 | 837 | 791 | 765 | 715 | 705 |
| August | 1021 | 991 | 918 | 906 | 917 | 878 | 787 | 775 |
| September | 885 | 861 | 712 | 703 | 753 | 709 | 608 | 605 |
| October | 734 | 710 | 611 | 609 | 688 | 667 | 590 | 589 |
| Total | 5007 | 4903 | 4411 | 4359 | 4458 | 4291 | 3907 | 3875 |
| Category | Minimum ventilation (Won) | Natural ventilation + Minimum ventilation mode (Won) | ||||||
|---|---|---|---|---|---|---|---|---|
| SW | DW | DWS-1 | DWS-2 | SW | DW | DWS-1 | DWS-2 | |
| May | 252,040 | 242,360 | 210,090 | 208,480 | 217,350 | 210,900 | 203,630 | 203,630 |
| June | 388,370 | 385,150 | 321,410 | 310,120 | 305,280 | 281,890 | 235,900 | 231,060 |
| July | 469,840 | 460,980 | 419,030 | 408,540 | 371,430 | 350,460 | 310,120 | 302,050 |
| August | 556,970 | 553,770 | 473,890 | 464,200 | 473,070 | 441,620 | 368,210 | 358,520 |
| September | 447,260 | 427,900 | 307,700 | 300,440 | 340,770 | 305,280 | 223,810 | 221,380 |
| October | 325,450 | 306,090 | 226,230 | 224,610 | 288,340 | 271,400 | 209,290 | 208,480 |
| Total (Won) | 2,439,930 | 2,376,250 | 1,958,350 | 1,916,390 | 1,996,240 | 1,861,550 | 1,550,960 | 1,525,120 |
| (US Dollar) | 2360 | 2298 | 1894 | 1853 | 1931 | 1800 | 1500 | 1475 |
| Reduction (%) | - | 3% | 20% | 21% | - | 7% | 22% | 24% |
6. Daylight Simulations
6.1. Daylighting Simulation Overview

| Building components | Reflectance | |
|---|---|---|
| Wall | 0.604 | |
| Floor | 0.299 | |
| Ceiling | 0.702 | |
| Window frame | 0.796 | |
| Glazing property | External window | 0.639 |
| (Visual transmittance) | Internal window | 0.611 |
| Room size | Depth | 14.2 m |
| Height | 2.4 m | |
| Cavity depth | DW | 5 cm |
| DWS | 20 cm | |
| Simulation time | (for illuminance) | 21 June (12:00 pm) |
6.2 Results and Discussion
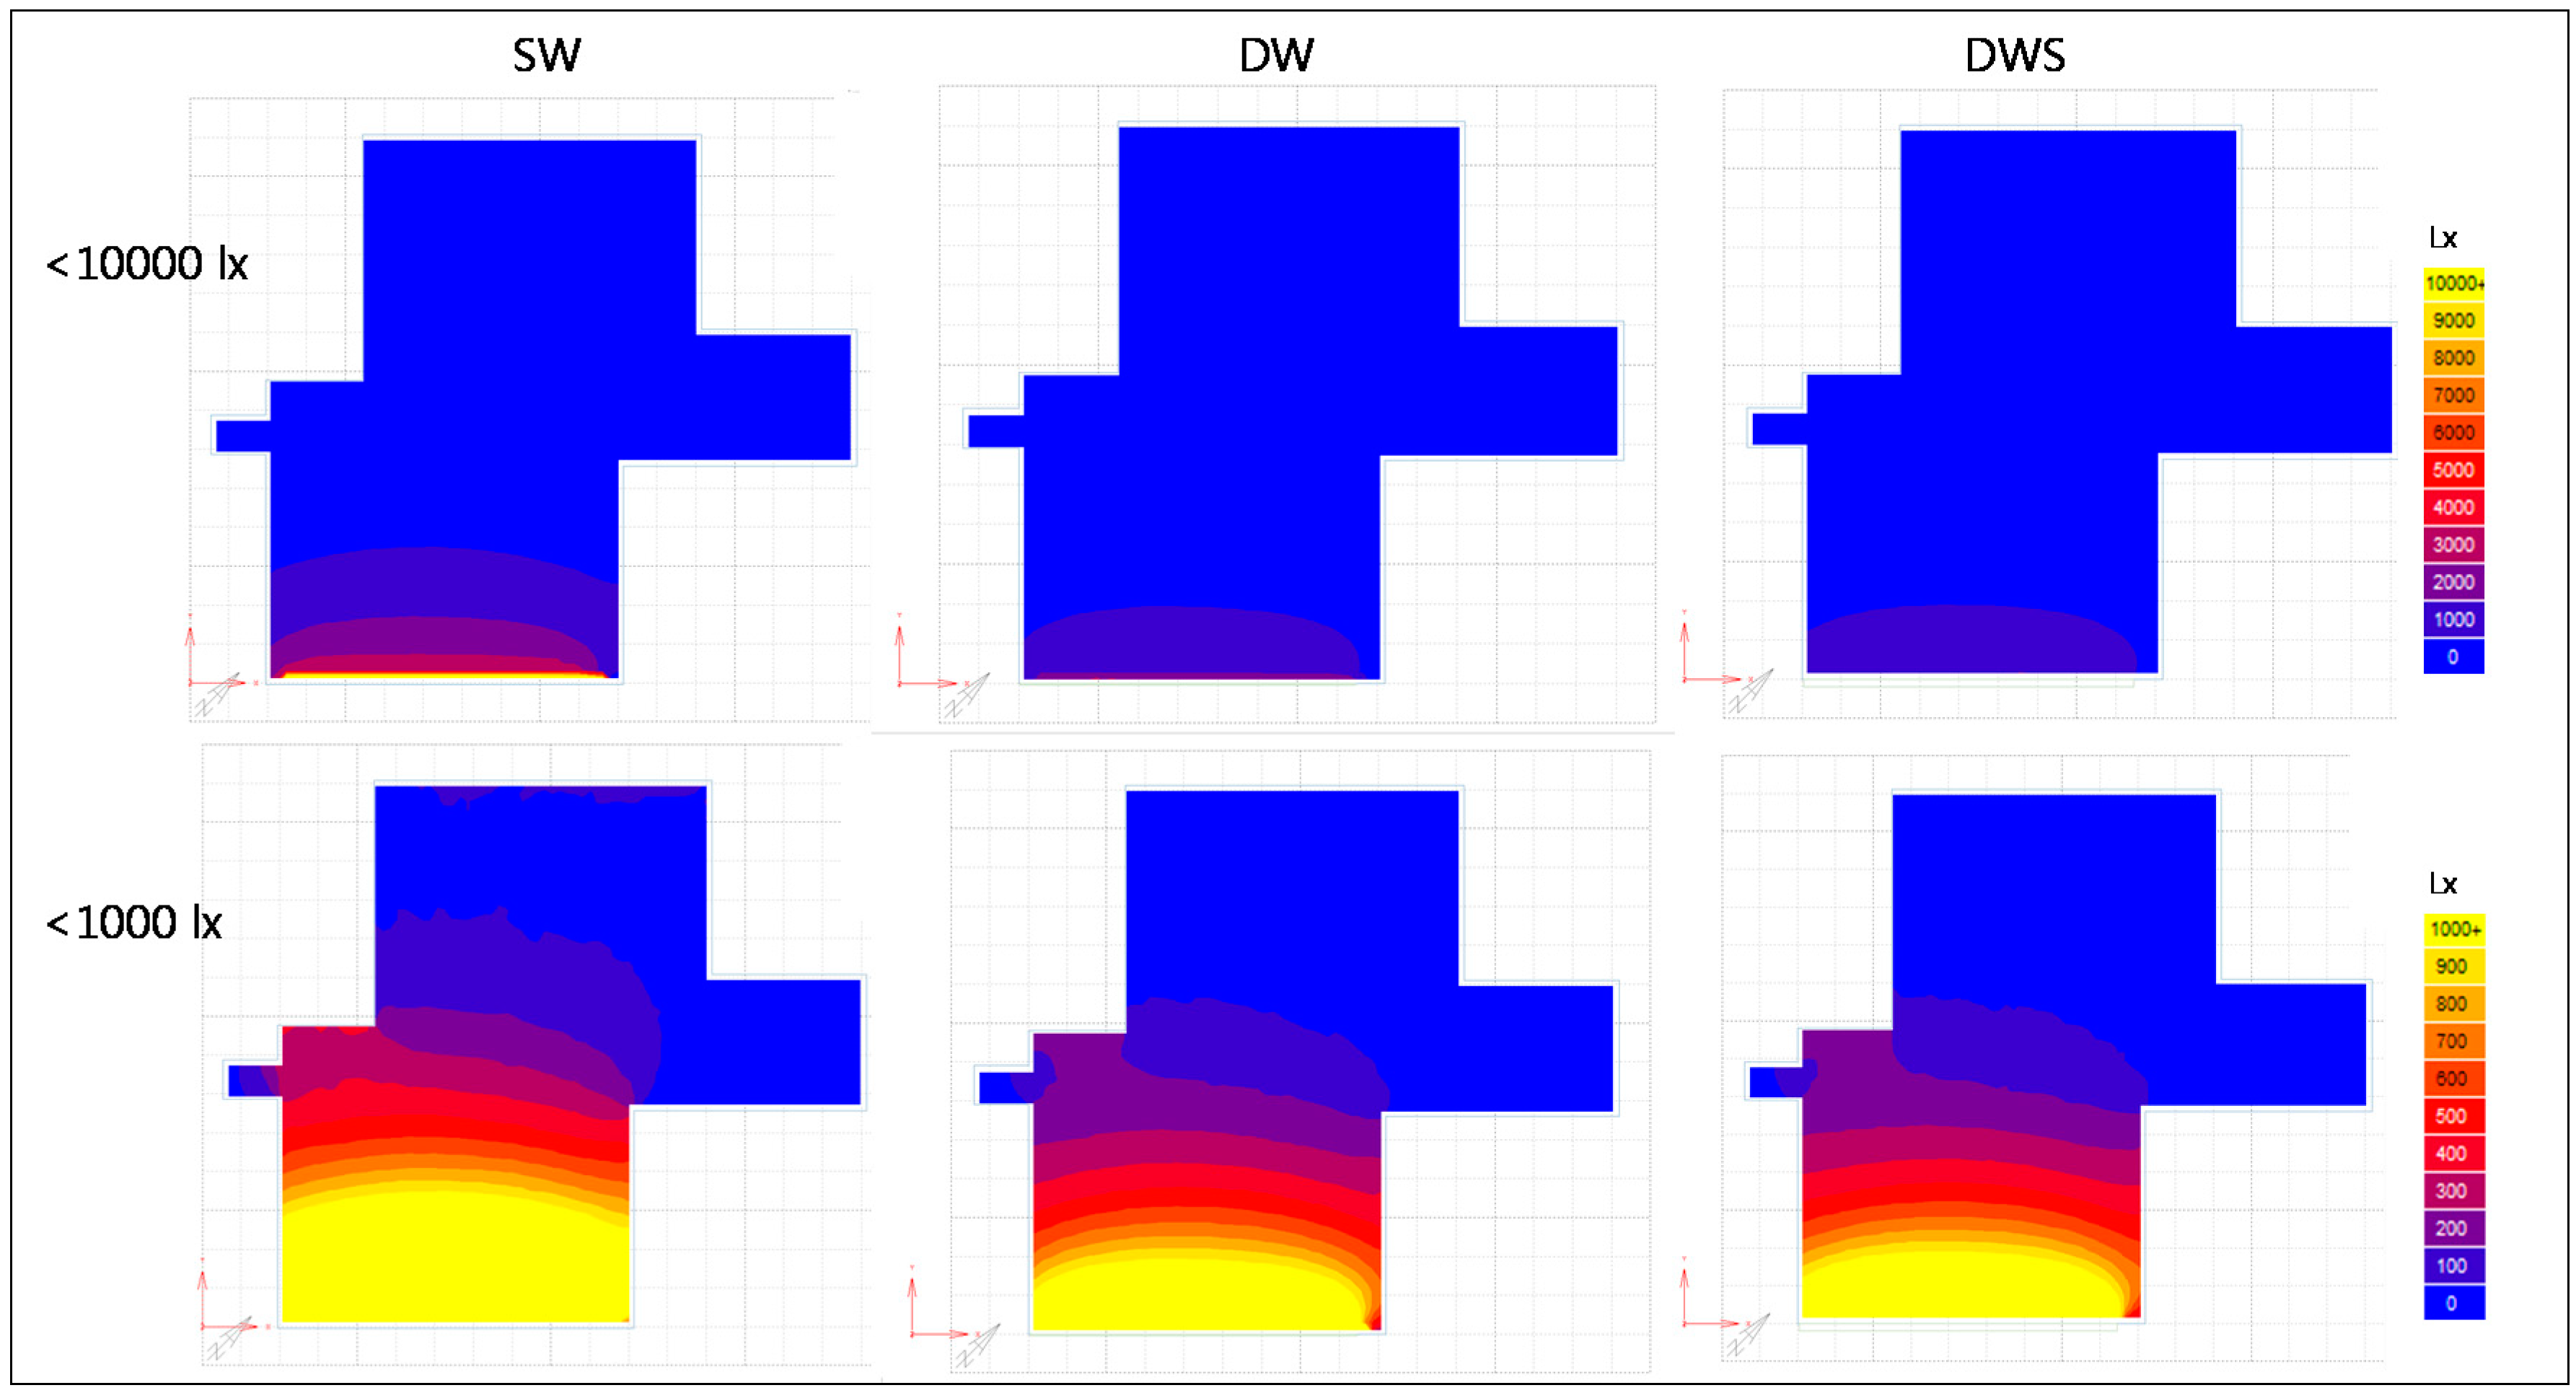
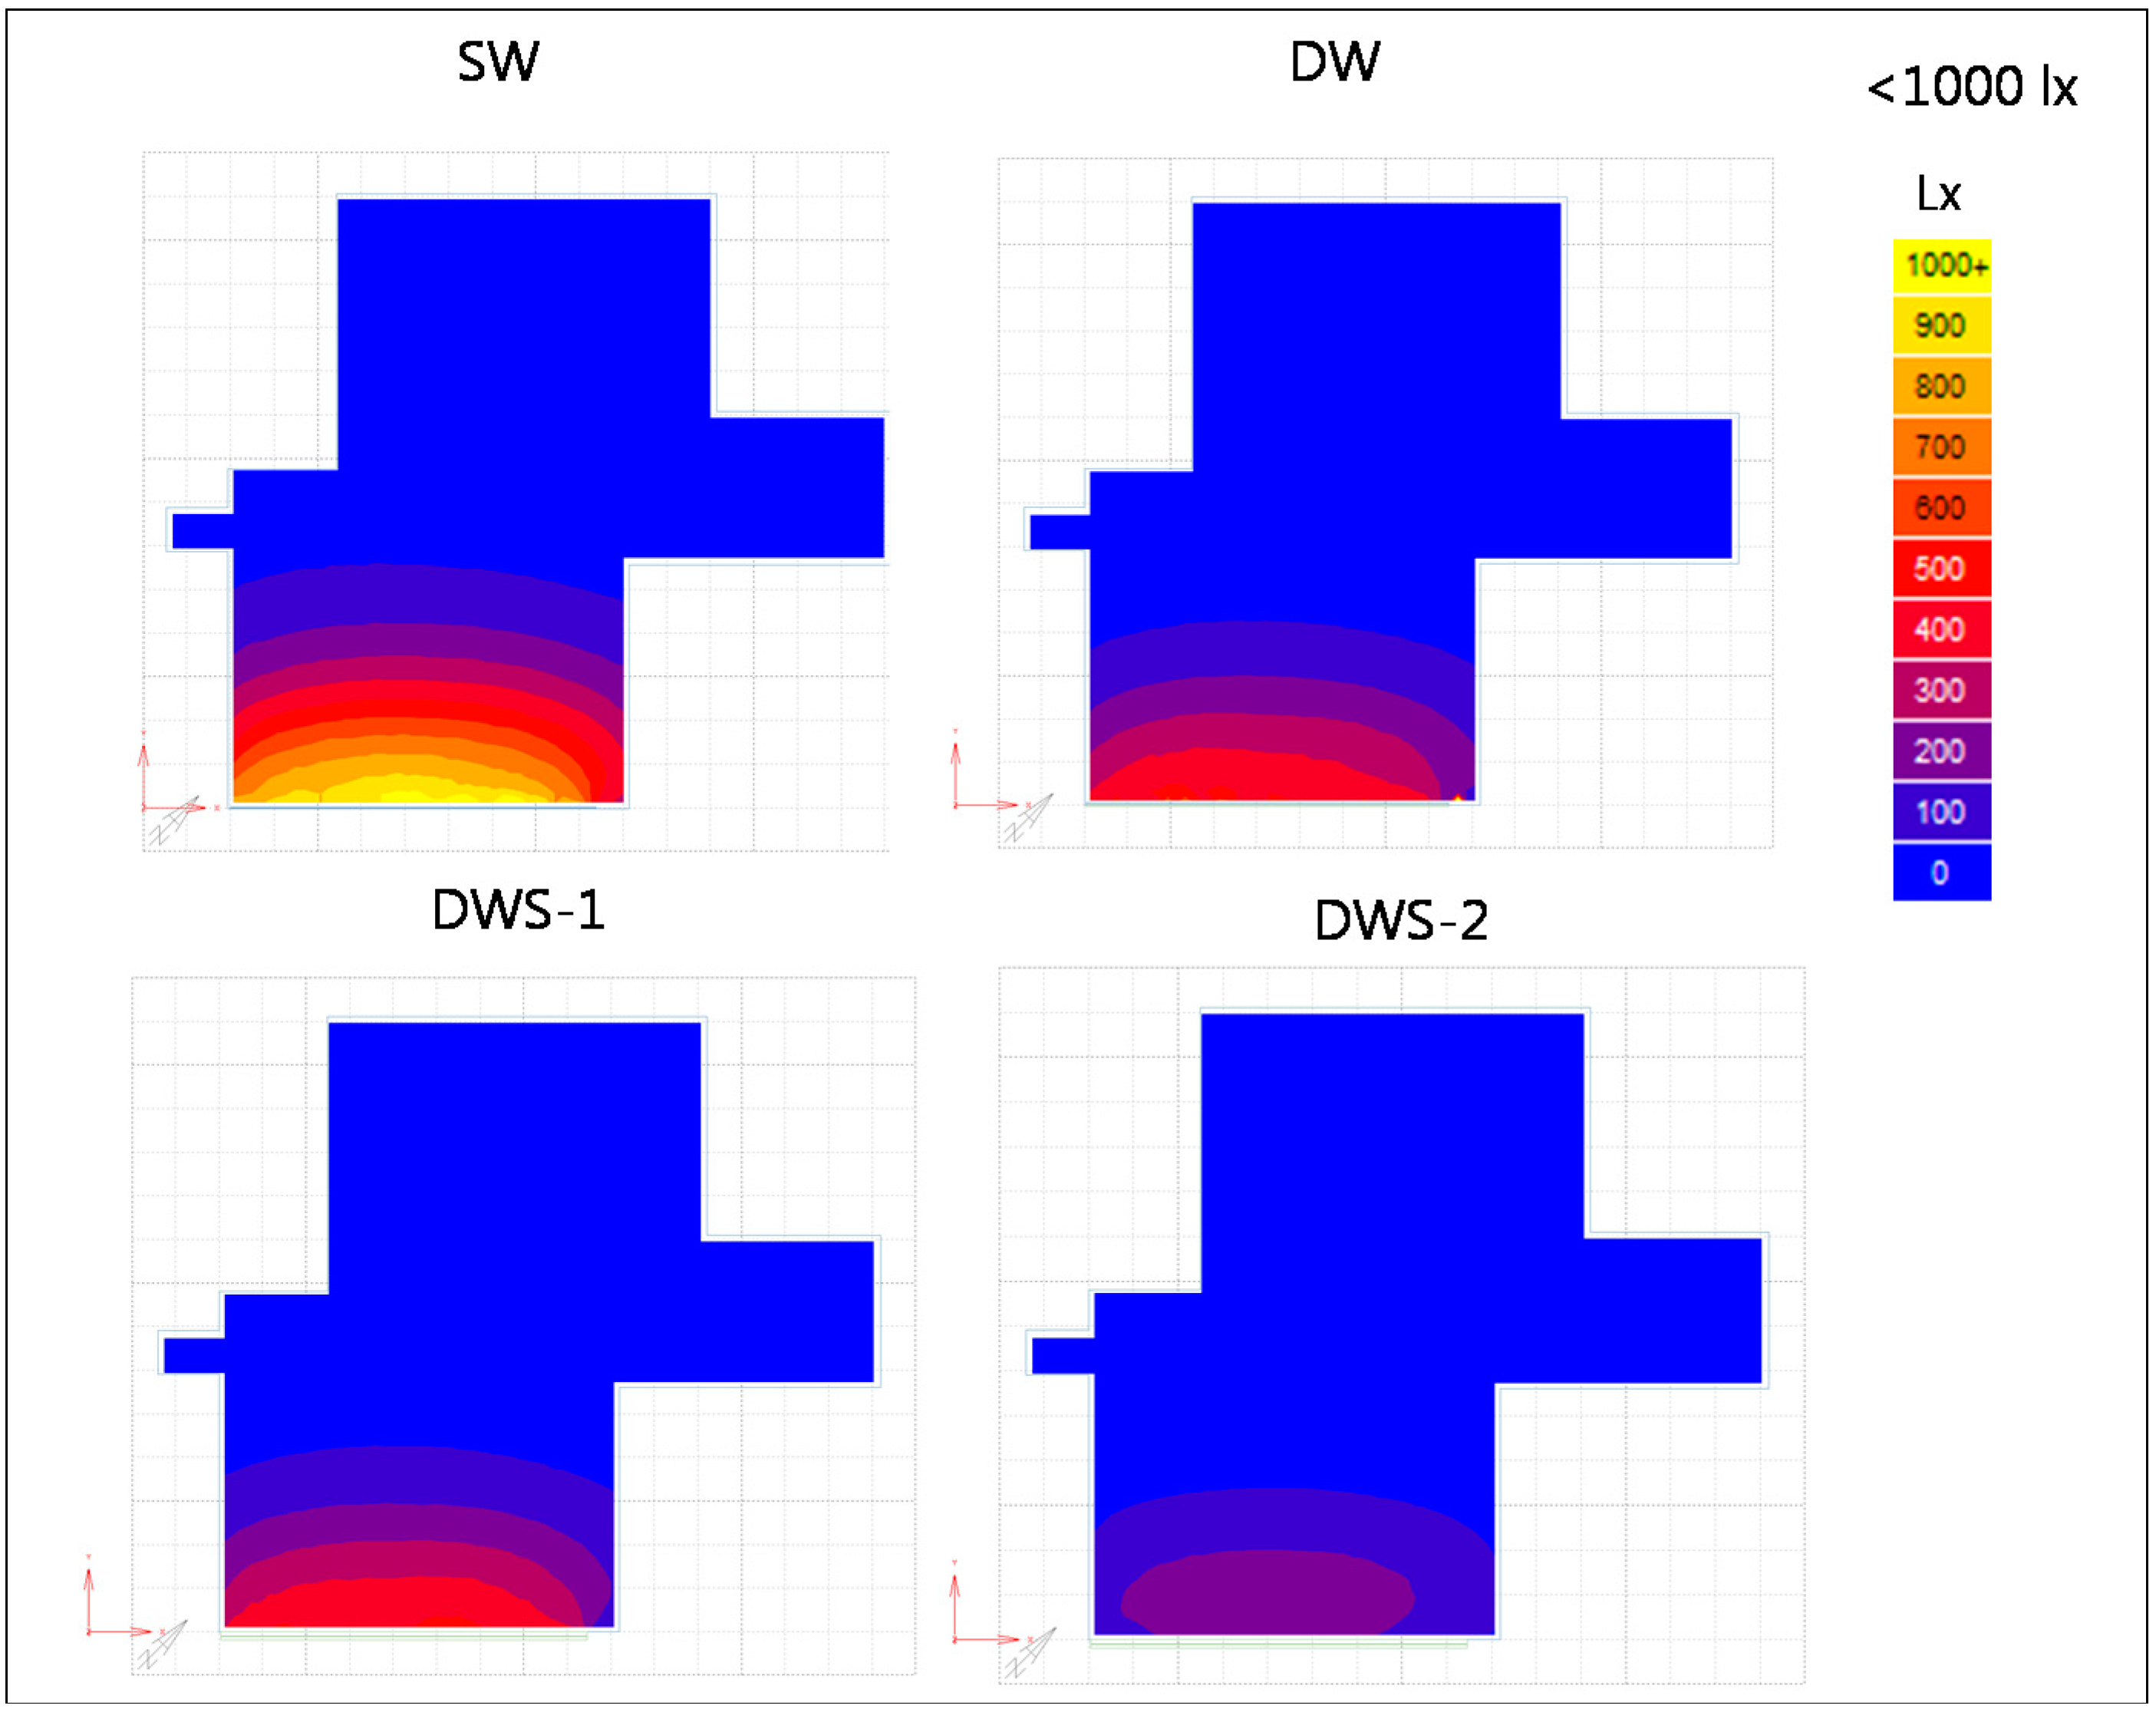
6.2.1. Daylighting Factor
| Shading condition | Without shading | With shading | |||||
|---|---|---|---|---|---|---|---|
| Window type | SW | DW | DWS | SW | DW | DWS-1 | DWS-2 |
| Reflectivity (Outward/Inward) | - | - | - | 84/84 | 84/84 | 84/84 | 84/10 |
| Average | 2.8 | 1.7 | 1.6 | 0.8 | 0.6 | 0.6 | 0.4 |
| Ration of DF > 2 | 29.1% | 20.3% | 19.7% | 7.6% | 0.8% | 0.0% | 0.0% |
| Shading condition | Without shading | With shading | |||||
|---|---|---|---|---|---|---|---|
| Window type | SW | DW | DWS | SW | DW | DWS-1 | DWS-2 |
| Reflectivity (Outward/Inward) | - | - | - | 84/84 | 84/84 | 84/84 | 84/10 |
| Perimeter zone | 2293.52 | 1045.31 | 999.99 | 557.51 | 285.53 | 280.57 | 159.49 |
| Middle zone | 374.31 | 209.85 | 209.63 | 82.67 | 42.02 | 42.80 | 21.88 |
| Internal zone | 105.08 | 59.03 | 59.03 | 15.83 | 7.88 | 8.70 | 2.82 |


6.2.2. Useful Daylight Index (UDI)
| Shading condition | Without shading | With shading | |||||
|---|---|---|---|---|---|---|---|
| Window type | SW | DW | DWS | SW | DW | DWS-1 | DWS-2 |
| Reflectivity (Outward/Inward) | - | - | - | 84/84 | 84/84 | 84/84 | 84/10 |
| UDI<100 | 100 | 100 | 100 | 100 | 100 | 100 | 100 |
| UDI100-2000 | 0 | 0 | 0 | 0 | 0 | 0 | 0 |
| UDI>2000 | 0 | 0 | 0 | 0 | 0 | 0 | 0 |
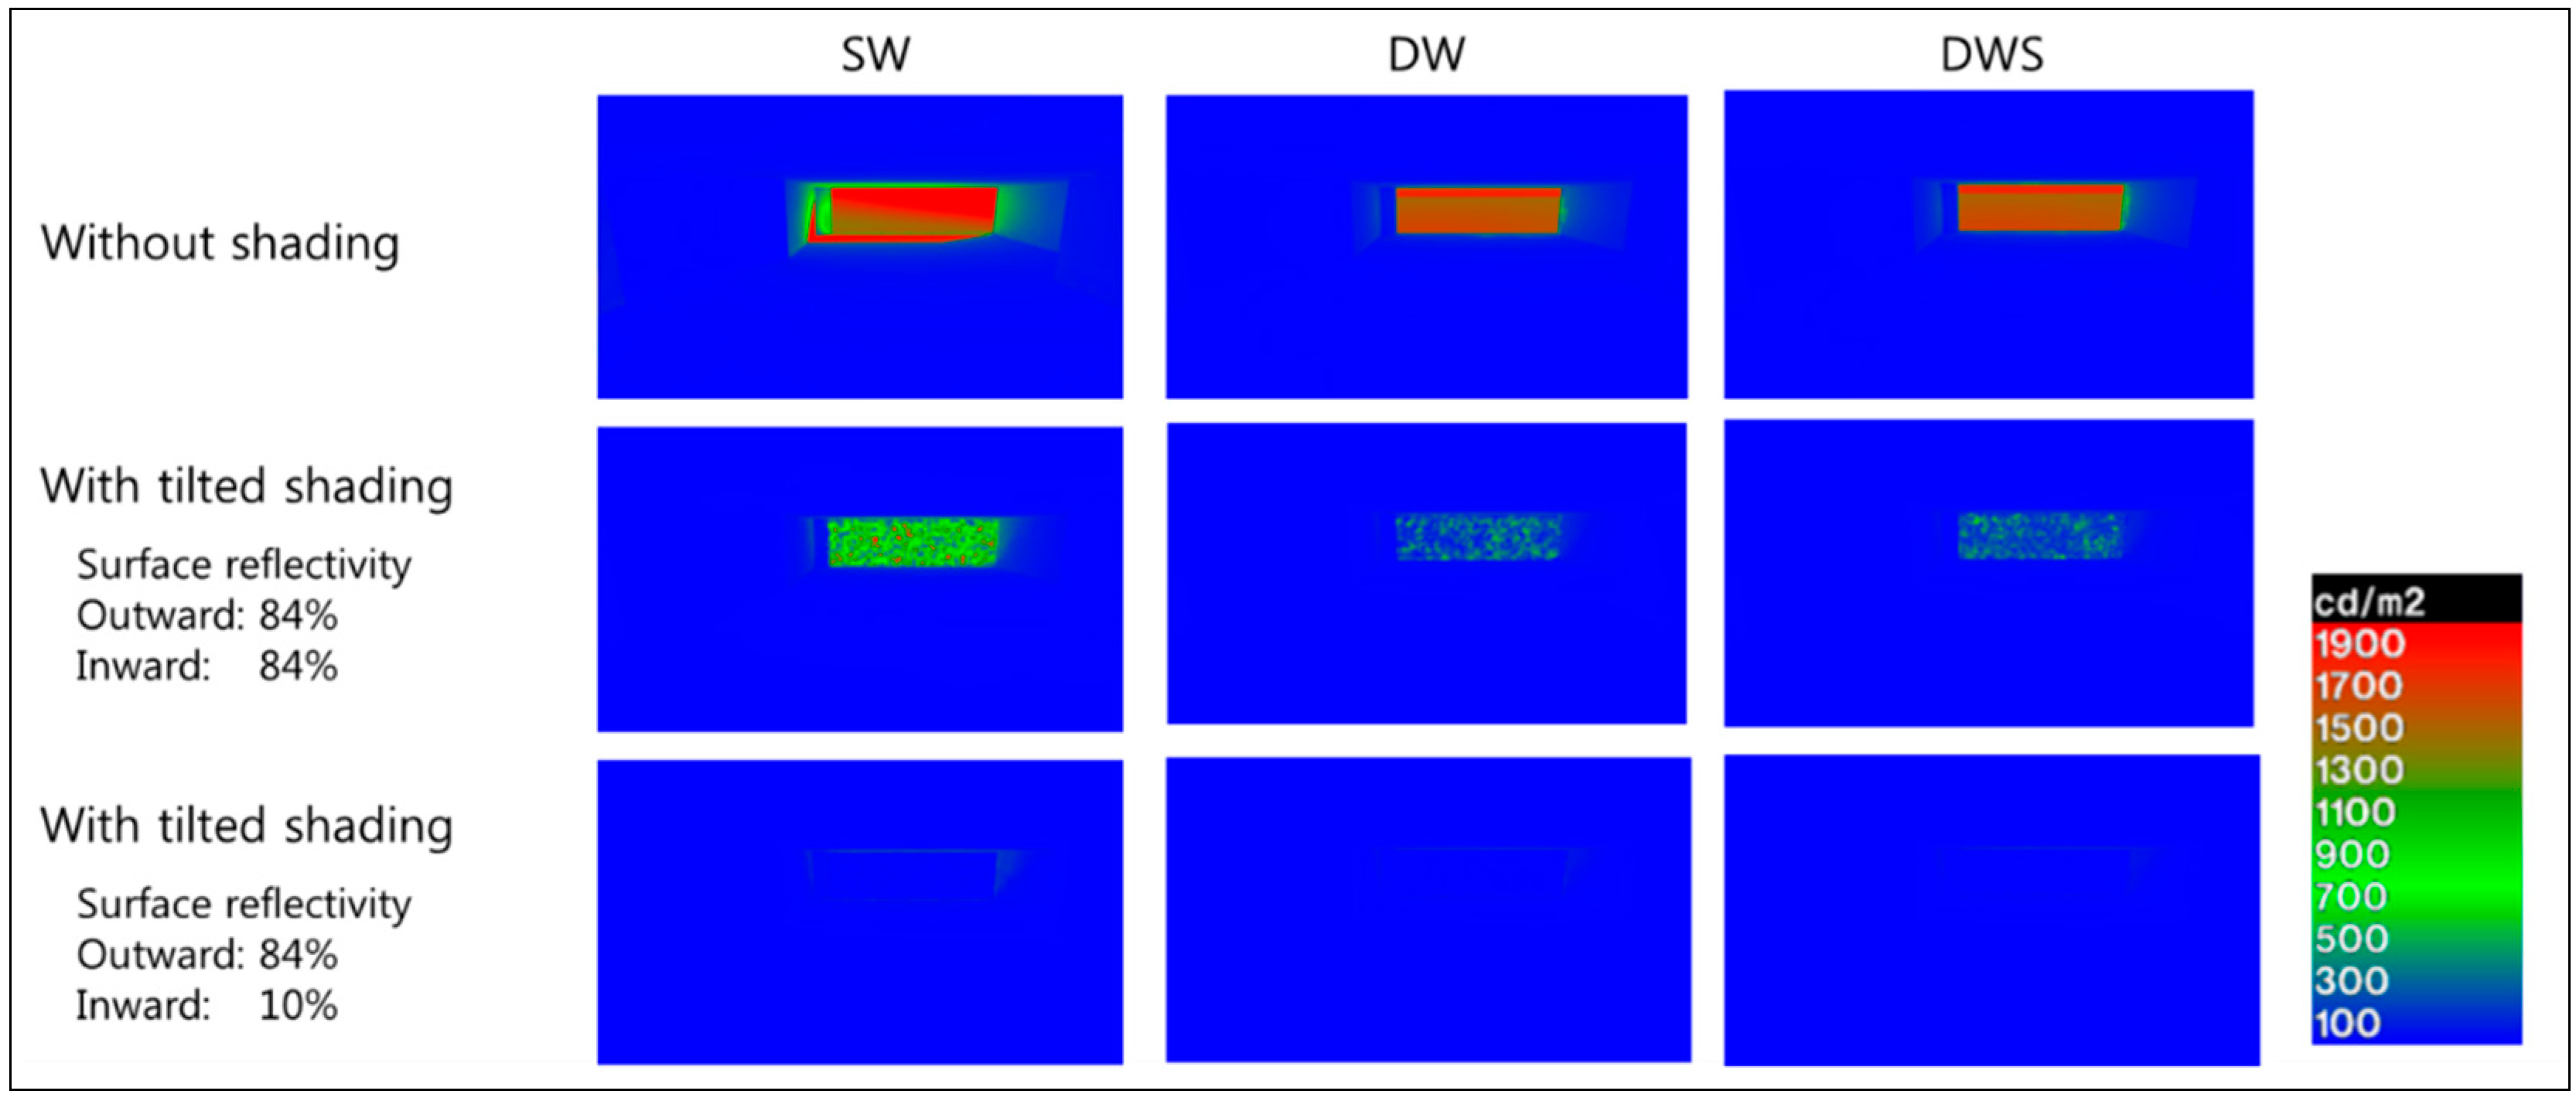
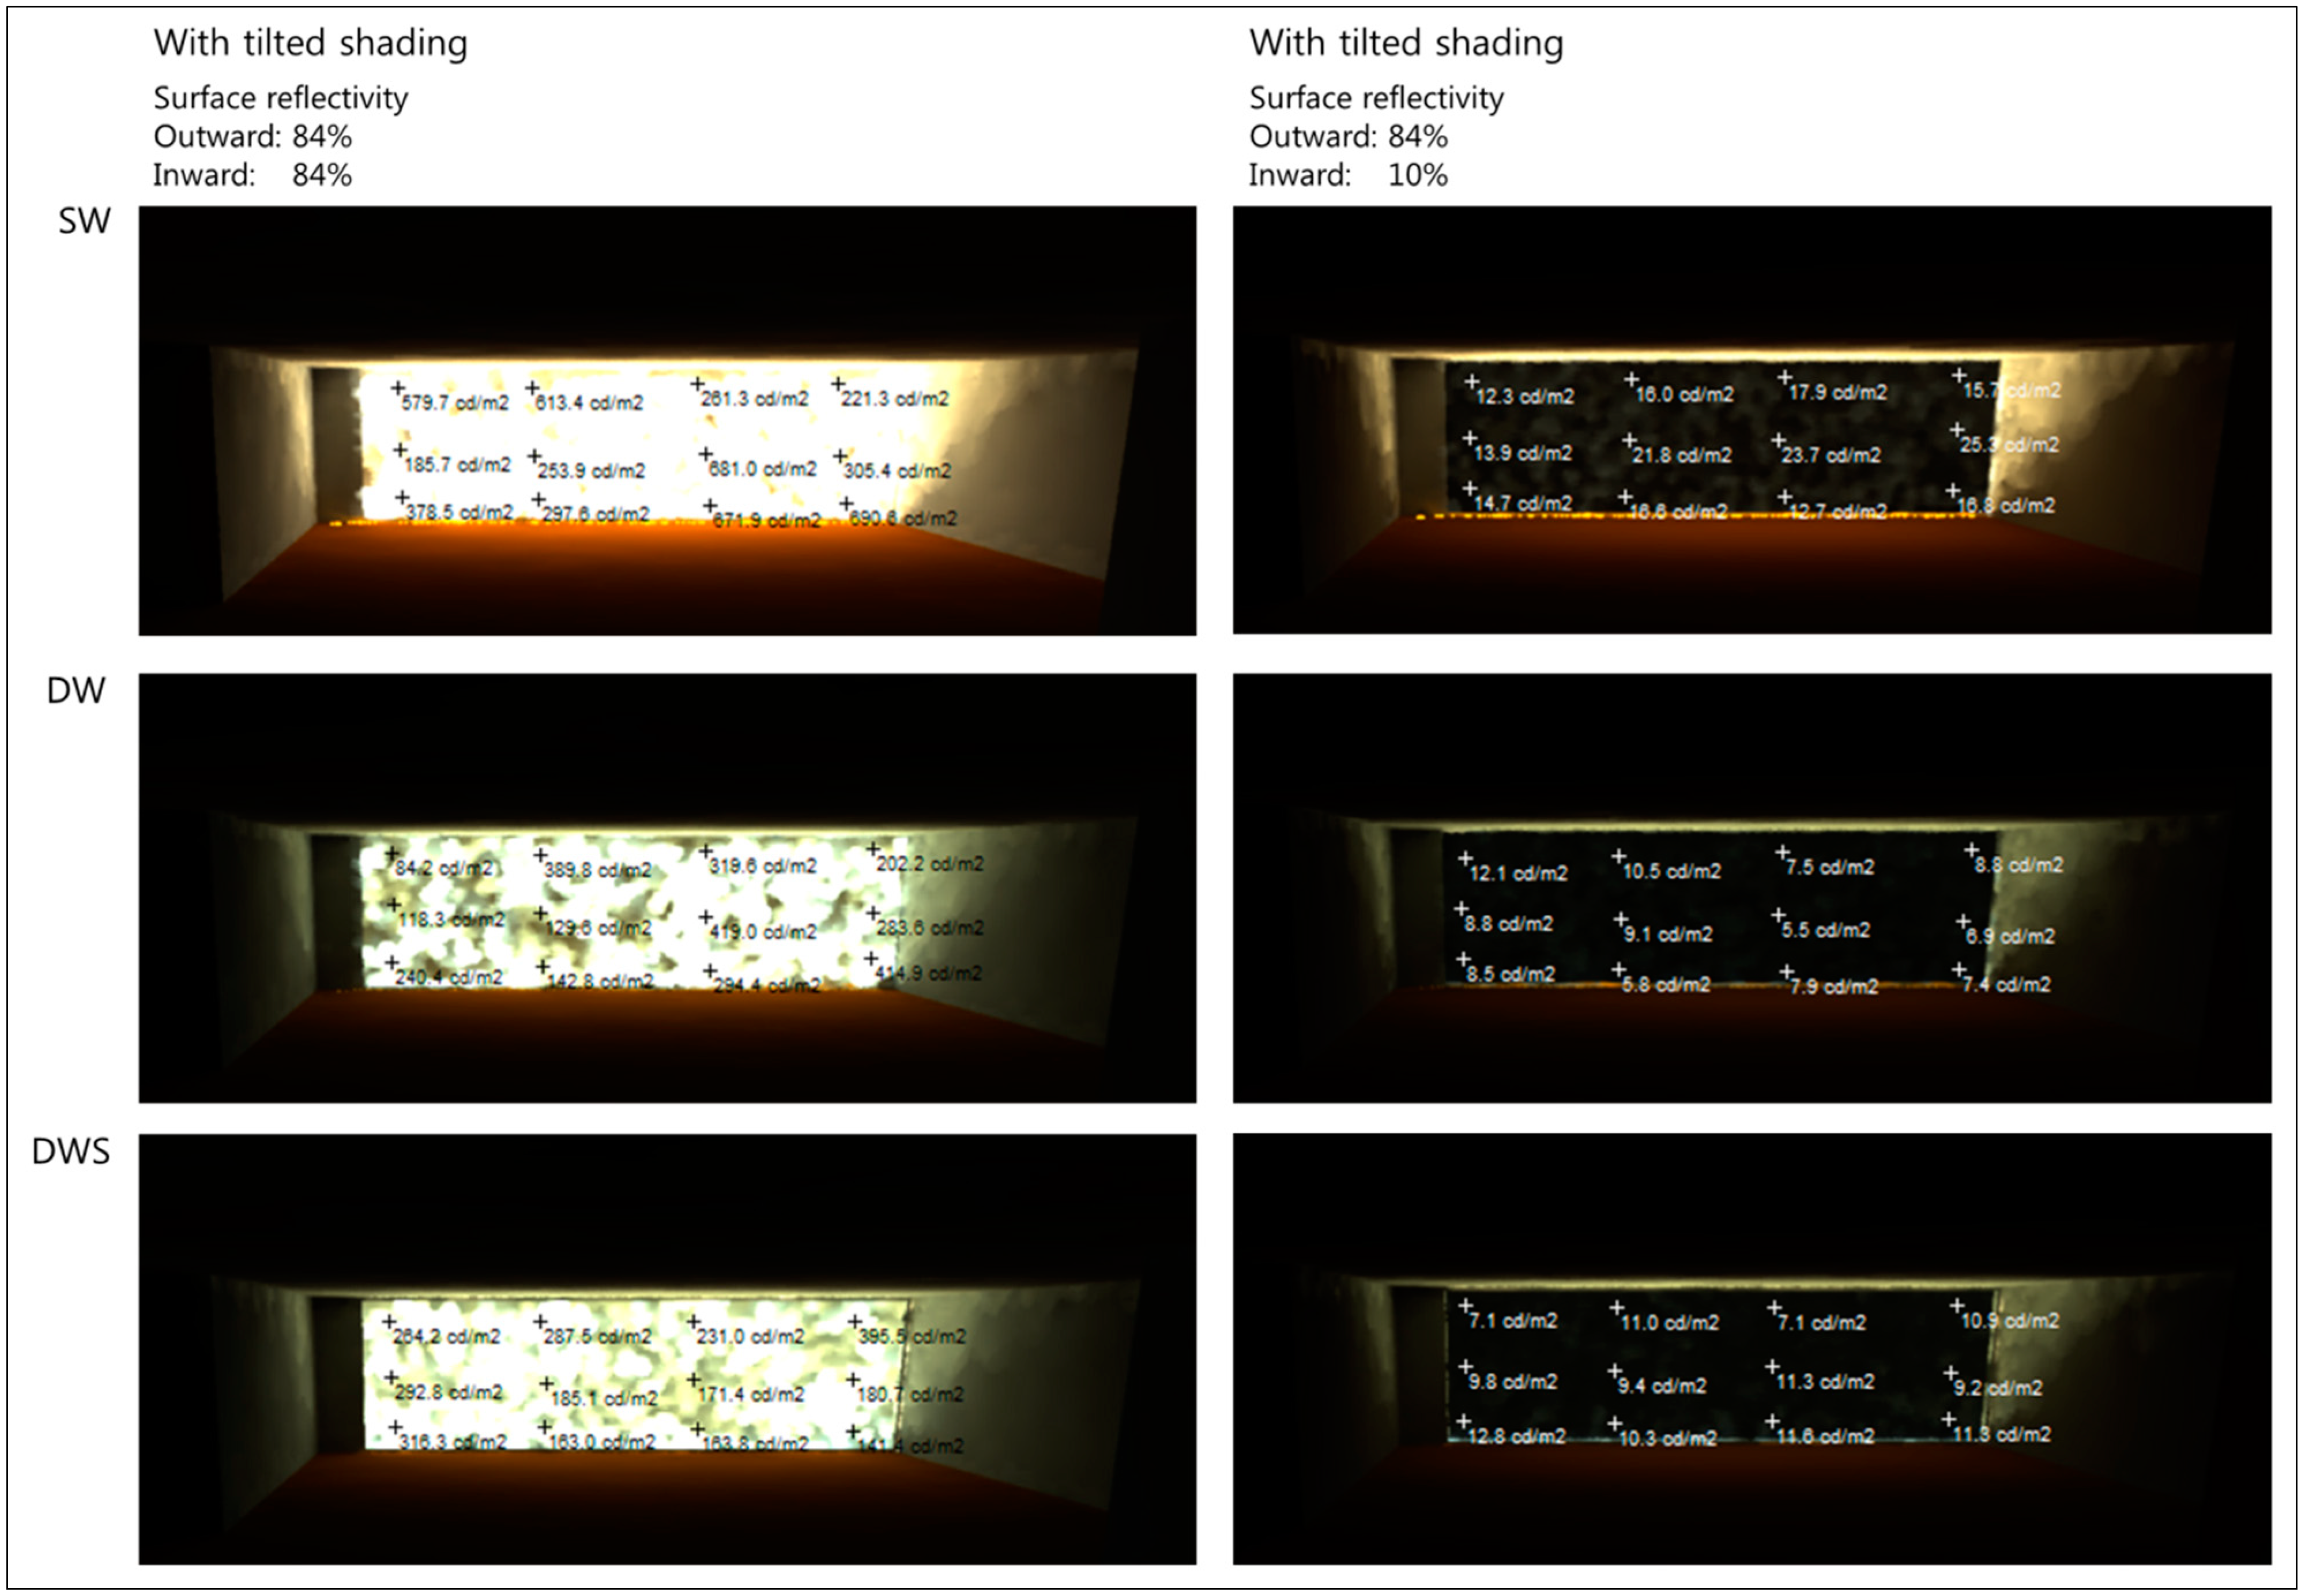
6.2.3. Absolute Glare
| Range | >2000 cd/m2 | >1000 cd/m2 | <500 cd/m2 | <30 cd/m2 |
|---|---|---|---|---|
| Perception of occupants | Too bright, anywhere in the room | Too bright, in the visual field | Preferable | Unacceptably dark |


7. Conclusions
- (1)
- According to our results, a cooling load reduction can be achieved by adopting the DWS. This reduction ranges from 43% to 61%. Regardless of the implementation of natural ventilation, the DWS offers a better performance than conventional windows. With natural ventilation, the performance of the DWS can be maximized.
- (2)
- The convective and radiant heat reductions were the most critical factors affecting the reduction of the cooling load via the application of the DWS.
- (3)
- An increase in the solar absorption by the rear surface of the shading device can reduce the cooling load by approximately 4%. This option could be considered when the cooling load has to be reduced to the lowest possible level.
- (4)
- Electricity cost during the cooling period can be significantly reduced by about 20%–24% by replacing conventional SWs with a DWS.
- (5)
- A shading device setting that prioritizes effective cooling load reduction can greatly decrease the DF and the glare risk of the indoor space. Especially, implementation of a shading device with low reflectivity at rear surface can result in undesirable low luminance level and illuminance level at indoor space.
- (6)
- A DWS implementing shading device with highly reflective at all surfaces is appropriate option for the better thermal and visual environment, while shading device with low reflectivity at the rear surface can contribute an additional 4% cooling load reduction.
Acknowledgments
Author Contributions
Conflicts of Interest
References
- Da Silva, F.M.; Gomes, M.G. Gap inner pressures in multistory double skin facades. Energ. Build. 2008, 40, 1553–1559. [Google Scholar]
- Roth, K.; Lawrence, T.; Brodrick, J. Double skin facade. ASHRAE J. 2007, 49, 70–73. [Google Scholar]
- Safer, N.; Woloszyn, M.; Roux, J.-J. Three-dimensional simulation with a CFD tool of the airflow phenomena in single floor double-skin facade equipped with a Venetian blind. Solar Energ. 2005, 79, 193–203. [Google Scholar]
- Hamza, N. Double versus single skin facades in hot arid areas. Energ. Buildings 2008, 40, 240–248. [Google Scholar]
- Baldinelli, G. Double skin facades for warm climate regions: Analysis of a solution with an integrated movable shading system. Build. Environ. 2009, 44, 1107–1118. [Google Scholar]
- Kim, S.Y.; Song, K.D. Determining photosensor conditions of a daylight dimming control system using different double-skin envelope configurations. Indoor Build. Environ. 2007, 16, 411–425. [Google Scholar]
- Ghaffarian, H.A.; Beradi, U.; Makaremi, N. Intelligent facades in low-energy buildings. Br. J. Environ. Clim. Change 2012, 2, 437–464. [Google Scholar]
- Fallahi, A.; Haghighat, F.; Elsadi, H. Energy performance assessment of double-skin facade with thermal mass. Energ. Build. 2010, 42, 1499–1509. [Google Scholar]
- Zhou, J.; Chen, Y. A review on applying ventilated double-skin facade to buildings in hot-summer and cold-winter zone in China. Renew. Sustain. Energ. Rev. 2010, 14, 1321–1328. [Google Scholar]
- Huckemann, V.; Kuchen, E.; Leão, M. Empirical thermal comfort evaluation of single and double skin facades. Build. Environ. 2010, 45, 976–982. [Google Scholar]
- Yoo, S.; Jeong, H.; Ahn, B.L; Han, H.; Seo, D.; Lee, J.; Jang, C.Y. Thermal transmittance of window systems and effects on building heating energy use and energy efficiency ratings in South Korea. Energ. Build. 2013, 67, 236–244. [Google Scholar]
- Joe, J.; Choi, W.; Kwon, H.; Huh, J.H. Load characteristics and operation strategies of building integrated with multi-story double skin façade. Energ. Build. 2013, 60, 185–198. [Google Scholar]
- Gratia, E.; de Herde, A. Natural cooling strategies efficiency in an office building with a double-skin façade. Energ. Build. 2004, 36, 1139–1152. [Google Scholar]
- Gratia, E.; de Herde, A. Guidelines for improving natural daytime ventilation in an office building with a double-skin façade. Solar Energ. 2007, 81, 435–448. [Google Scholar]
- Gratia, E.; de Herde, A. Greenhouse effect in double-skin façade. Energ. Build. 2007, 39, 199–211. [Google Scholar]
- Saelens, D.; Roels, S.; Hens, H. On the influence of the inlet temperature in multiple-skin facade modeling. In Proceedings of the 8th International IBPSA Conference, Eindhoven, The Netherlands, 11–14 August 2003; pp. 1139–1146.
- Cho, J.-K.; Hong, M.-H.; Yoo, C.-W. A case study on curtain-wall and window types of high-rise residences in Korea for improvement of natural ventilation. J. Archit. Inst. Korea 2009, 25, 253–261. [Google Scholar]
- Branislav, T. Buildings Envelopes Controlling Solar Radiation Gains. Available online: http://vts.su.ac.rs/docs/expres2012/01.%20Todorovic%20prof..pdf (accessed on 27 May 2014).
- Nikoofard, S.; Ugursal, V.I.; Beausoleil-Morrison, I. Effect of external shading on household energy requirement for heating and cooling in Canada. Energ. Build. 2011, 43, 1627–1635. [Google Scholar]
- Kim, J.T.; Kim, G. Advanced external shading device to maximize visual and view performance. Indoor Build Environ. 2010, 19, 65–72. [Google Scholar]
- Roche, L. Summertime performance of an automated lighting and blinds control system. Lighting Res. Technol. 2002, 34, 11–25. [Google Scholar]
- Laouadi, A.; Parekh, A. Complex fenestration systems: Towards product ratings for indoor environment quality. Lighting Res. Technol. 2007, 39, 109–122. [Google Scholar]
- Dubois, M.C. Impact of shading devices on daylight quality in offices: Simulation with radiance. Available online: https://lup.lub.lu.se/search/publication/526054 (accessed on 20 October 2014).
- Laouadi, A.; Reinhart, C.F.; Bourgeois, D. Efficient calculation of daylight coefficients for rooms with dissimilar complex fenestration systems. J. Build. Perform. Simul. 2008, 1, 3–15. [Google Scholar]
- Ochoa, C.E.; Aries, M.B.C.; Hensen, J.L.M. State of the art in lighting simulation for building science: A literature review. J. Build. Perform. Simul. 2012, 5, 209–233. [Google Scholar]
- Lomanowski, B.A. Implementation of Window Shading Models into Dynamic Whole-building Simulation. Available online: https://uwspace.uwaterloo.ca/handle/10012/4164 (accessed on 12 December 2008).
- Papakonstantinou, K.A.; Kiranoudis, C.T.; Markatos, N.C. Numerical simulation of air flow field in single-sided ventilated buildings. Energ. Build. 2000, 33, 41–48. [Google Scholar]
- Prajongsan, P.; Sharples, P. Enhancing natural ventilation, thermal comfort and energy savings in high-rise residential buildings in Bangkok through the use of ventilation shafts. Build. Environ. 2012, 50, 104–113. [Google Scholar]
- Cheong, C.-H.; Kim, T.-Y.; Leigh, S.-B.; Hwang, S.-H. Indoor Air Flow Pattern in the Mixed-Use Apartment with Double Window System. J. Archit. Inst. Korea 2013, 12, 287–296. [Google Scholar]
- Pasquay, T. Natural ventilation in high-rise buildings with double facades, saving or waste of energy. Energ. Build. 2004, 36, 381–389. [Google Scholar]
- Electricity Rates Calculator. (in Korean). Available online: http://cyber.kepco.co.kr/ckepco/front/jsp/CY/J/A/CYJAPP000.jsp (accessed on 20 October 2014).
- Berardi, U.; Wang, T. Daylighting in an atrium-type high performance house. Build. Environ. 2014, 76, 92–104. [Google Scholar]
© 2014 by the authors; licensee MDPI, Basel, Switzerland. This article is an open access article distributed under the terms and conditions of the Creative Commons Attribution license (http://creativecommons.org/licenses/by/4.0/).
Share and Cite
Cheong, C.H.; Kim, T.; Leigh, S.-B. Thermal and Daylighting Performance of Energy-Efficient Windows in Highly Glazed Residential Buildings: Case Study in Korea. Sustainability 2014, 6, 7311-7333. https://0-doi-org.brum.beds.ac.uk/10.3390/su6107311
Cheong CH, Kim T, Leigh S-B. Thermal and Daylighting Performance of Energy-Efficient Windows in Highly Glazed Residential Buildings: Case Study in Korea. Sustainability. 2014; 6(10):7311-7333. https://0-doi-org.brum.beds.ac.uk/10.3390/su6107311
Chicago/Turabian StyleCheong, Chang Heon, Taeyeon Kim, and Seung-Bok Leigh. 2014. "Thermal and Daylighting Performance of Energy-Efficient Windows in Highly Glazed Residential Buildings: Case Study in Korea" Sustainability 6, no. 10: 7311-7333. https://0-doi-org.brum.beds.ac.uk/10.3390/su6107311