Article

Assessment Framework and Decision—Support System for Consolidating Urban-Rural Construction Land in Coastal China

1
School of Geographic and Oceanographic Sciences, Nanjing University, Nanjing 210023, China
2
The Key Laboratory of the Coastal Zone Exploitation and Protection, Ministry of Land and Resources, Nanjing 210023, China
*
Author to whom correspondence should be addressed.
Sustainability 2014, 6(11), 7689-7709; https://0-doi-org.brum.beds.ac.uk/10.3390/su6117689
Submission received: 25 August 2014 / Revised: 12 October 2014 / Accepted: 17 October 2014 / Published: 3 November 2014
(This article belongs to the Special Issue Sustainable Land Use and Ecosystem Management)

Abstract

:
Urbanization transforms urban-rural landscape and profoundly affects ecological processes. To maintain a sustainable urbanization, two important issues of land-use need to be quantified: the comprehensive variation of urban-rural construction land and the specific models for consolidating these lands. The purpose of this study is to develop a framework to assess the change of urban-rural construction land and build a decision-support system for consolidating these lands. Four sub-layers were first built in the assessment framework, including the characteristic layer, the coordination layer, the potential layer and the urgency layer. Each layer encompassed specific indices for evaluating the change of urban-rural construction land in different aspects. The entropy method was then applied to the data resources from Landsat TM (Thematic Mapper) images, statistical data and overall land-use and land consolidation planning of Nantong city in coastal China to allocate weightings to the indices in each sub-layer. Finally, the decision-support system was built based on the assessment results and the degree of importance for consolidating urban and rural construction land, respectively. The results of our study show an overall investigation and quantitative description of the change of urban-rural construction land and provide an effective framework for land consolidation and land use management.

1. Introduction

Rapid land conversion for non-agricultural use has become the main feature of urbanization in China [1,2]. The sprawl of the built-up area of megacities, the development of township and rural enterprises, the rapid construction of infrastructure and the emergence of hollowing villages have all aggravated the land conversion for non-agricultural use. The rapid growth of urban-rural land-use can be found in the construction land such as residential land, commercial land, industrial land and traffic land since the reform and opening-up of China in 1978 [3,4]. As China will realize its urban dream in the coming decades, it can generate other great human-dominated resettlement experiments and construction land changes in the future. Moreover, the National New-type Urbanization Plan was just released by the central government in March, with targets for the fraction of China’s urban population set to rise by 1% per year to reach 60% by 2020 [5]. Construction land-use transition due to urbanization will lead to big changes in production and living space for urban-rural China as well as serious eco-environmental issues. It is essential and necessary to assess the comprehensive variation of urban-rural construction land and to build specific models for consolidating these lands for sustainable development [6,7,8,9].
Dramatic urbanization is significantly amplified in the developed coastal regions of China, such as the Yangtze River Delta Region and the Pearl River Delta Region [10,11,12,13]. Land conversion for non-agricultural use has effectively supported fast urban expansion in coastal cities [14], however, as the local economy relies firmly on the considerable inputs from urban land conversion, the utilization of construction land becomes inefficient [15,16]. The booming of economic development zones and the excessive expansion of commercial buildings has created vacant built-up land and inefficient land use [17,18]. Particularly, the pace of urban land conversion for non-agricultural use has obviously been faster than the pace of urbanization since 2000. According to data from Ministry of Land and Resources, the built-up area in Chinese cities has increased 50% while the increase of urban population is only 26%. This tremendous difference has caused extensive and inefficient use of urban land. Lacking unified planning of the countryside, rural areas are presenting a converse trend of decreasing rural population while increasing rural built land under the trend of urbanization [19]. There are large-scale influxes of rural laborers into cities for more job opportunities. When they return with high incomes, they are inclined to abandon their old dwellings in the inner village and build new houses either on the edge of the village or along the main road. This process is known as rural hollowing [20]. The tendency for “new outside expansion while old inside hollowing” [21] is becoming serious. In 2012, the amount of rural construction land in China has increased to 17 million ha, with per capita rural residential land of 230 m2 which is far beyond the maximum limit of 150 m2 in China. It is estimated that around 7.58 million ha of land can be consolidated from hollowing villages into arable land [22]. Thus, urban-rural land consolidation has become the key strategy for increasing land-use efficiency and coordinating urban-rural development.
Land Consolidation (LC) is seen as a land development technique used in many countries around the world including Germany, Sweden, Japan, Taiwan and Korea [23,24,25,26,27]. In essence, it is a method whereby an irregular pattern of agricultural or construction land is re-arranged into regular arable or building plots and equipped with basic infrastructure. LC in urban-rural areas not only aims at combining disparate land areas but also better management of all related issues such as urban-rural coordinated development, sustainable land-use and eco-environmental protection [28]. Therefore, the integrated assessment and models of urban-rural LC are major concerns in the field of LC. Some previous studies have attempted to search the assessment of LC by treating it as a landscape evaluation pre- and post- LC project [29,30]. Other studies, focusing on the economic, social and environmental impact of LC, have produced multi-criteria approaches for the estimation of LC effects and landscape decision analysis [31,32,33]. Recently, GIS-based technology has been widely used in the field of LC, such as a GIS-based automated system for planning and decision making of an LC project in Cyprus [34,35] and a web-GIS based support system for rural residential LC in China [36]. However, these studies have suffered from a lack of providing a comprehensive assessment of urban-rural land use change, and the assessment process itself does not take into consideration the specific consolidation models for urban and rural areas, respectively.
In this paper, a multi-criteria assessment framework for consolidating urban-rural construction land is outlined. Meanwhile, based on the results of assessment, a decision-support system is built for the consolidation model of urban and rural construction land, respectively. The assessment framework, which is summarized in the next section, involves four sub-criteria layers: a characteristic layer, a coordination layer, a potential layer and an urgency layer. Additionally, the structure of the decision-support system is created on the degree of importance of consolidating urban and rural construction land, respectively. Section 2 examines each of the methods in turn. In Section 3, a case study is introduced to exemplify the assessment and the system. Results and discussion are shown in Section 4 and conclusions are presented in Section 5.

2. Methods

2.1. Assessment Framework for Consolidating Urban-Rural Construction Land

Setting up an ex ante assessment is the basis for building a consolidation model scientifically [32]. In this study, the objectives and methodology of the assessment framework are influenced by the fragmentation characteristics of urban-rural construction land, by the utilization relationship between urban and rural areas, and by the capacity and urgency for consolidating urban-rural construction land. Therefore, the context of each influence factor is represented by the following four critical questions regarding land use change and LC; (1) What are the spatial characteristics of land fragmentation? (2) Is the statement of the utilization of urban-rural construction land in a coordinated relationship? (3) How much potential is there for consolidating urban-rural construction land? (4) How urgently does the place need to consolidate its urban-rural construction land? These questions are addressed by their respective four sub-layers of the assessment framework; the characteristic layer, the coordination layer, the potential layer, and the urgency layer, each of which encompasses specific indices as follows.

2.1.1. The Characteristic Layer

Land fragmentation is defined as the existence of a number of spatially separate plots of land which are explored as single units [37]. The existence of fragmented urban-rural construction land is regarded as an important feature of less-developed urban-rural building systems. It can be a major obstacle to the sustainability of urban-rural development, because it causes inefficiencies in human activities and involves the unnecessary waste of natural or social resources [38].
Various indices have been developed by many researchers in order to determine the effects of land fragmentation on the landscape [39,40,41,42,43,44,45]. In this study, landscape indices which include criteria regarding size, percentage, density and shape of plots are used for the characteristic assessment. These indices are defined as follows:
(1)
Index regarding size
The landscape index Mean Patch Area (AREA_MN) is used to indicate the size of plots. It is calculated using Equation (1):
Sustainability 06 07689 i001
Here, Ai represents the total area of i patches and, Ni represents the total number of i patches.
(2)
Index regarding percentage
The landscape index Percentage of Landscape (PLAND) is chosen as the index regarding percentage. PLAND is calculated using Equation (2):
Sustainability 06 07689 i002
In Equation (2), aij represents the area of patch ij, n represents the total number of i patches, and A represents the total area of landscape.
(3)
Index regarding density
The index regarding density is represented by the Patch Density (PD), which is calculated as Equation (3).
Sustainability 06 07689 i003
Here, ni means the number of i patches and A refers to the total area of landscape.
(4)
Index regarding shape
Indices about fractal dimension are commonly used to characterize shape in landscape studies. In this study, the landscape index Fractal Dimension Area Weighted Mean (FRAC_AM) is used to assess the patch shape and it is calculated as Equation (4).
Sustainability 06 07689 i004
Here, Pij represents the perimeter of patch ij and the other indicators have the same meaning as above.
All the indices are calculated in Fragstats 4.1 software [46].

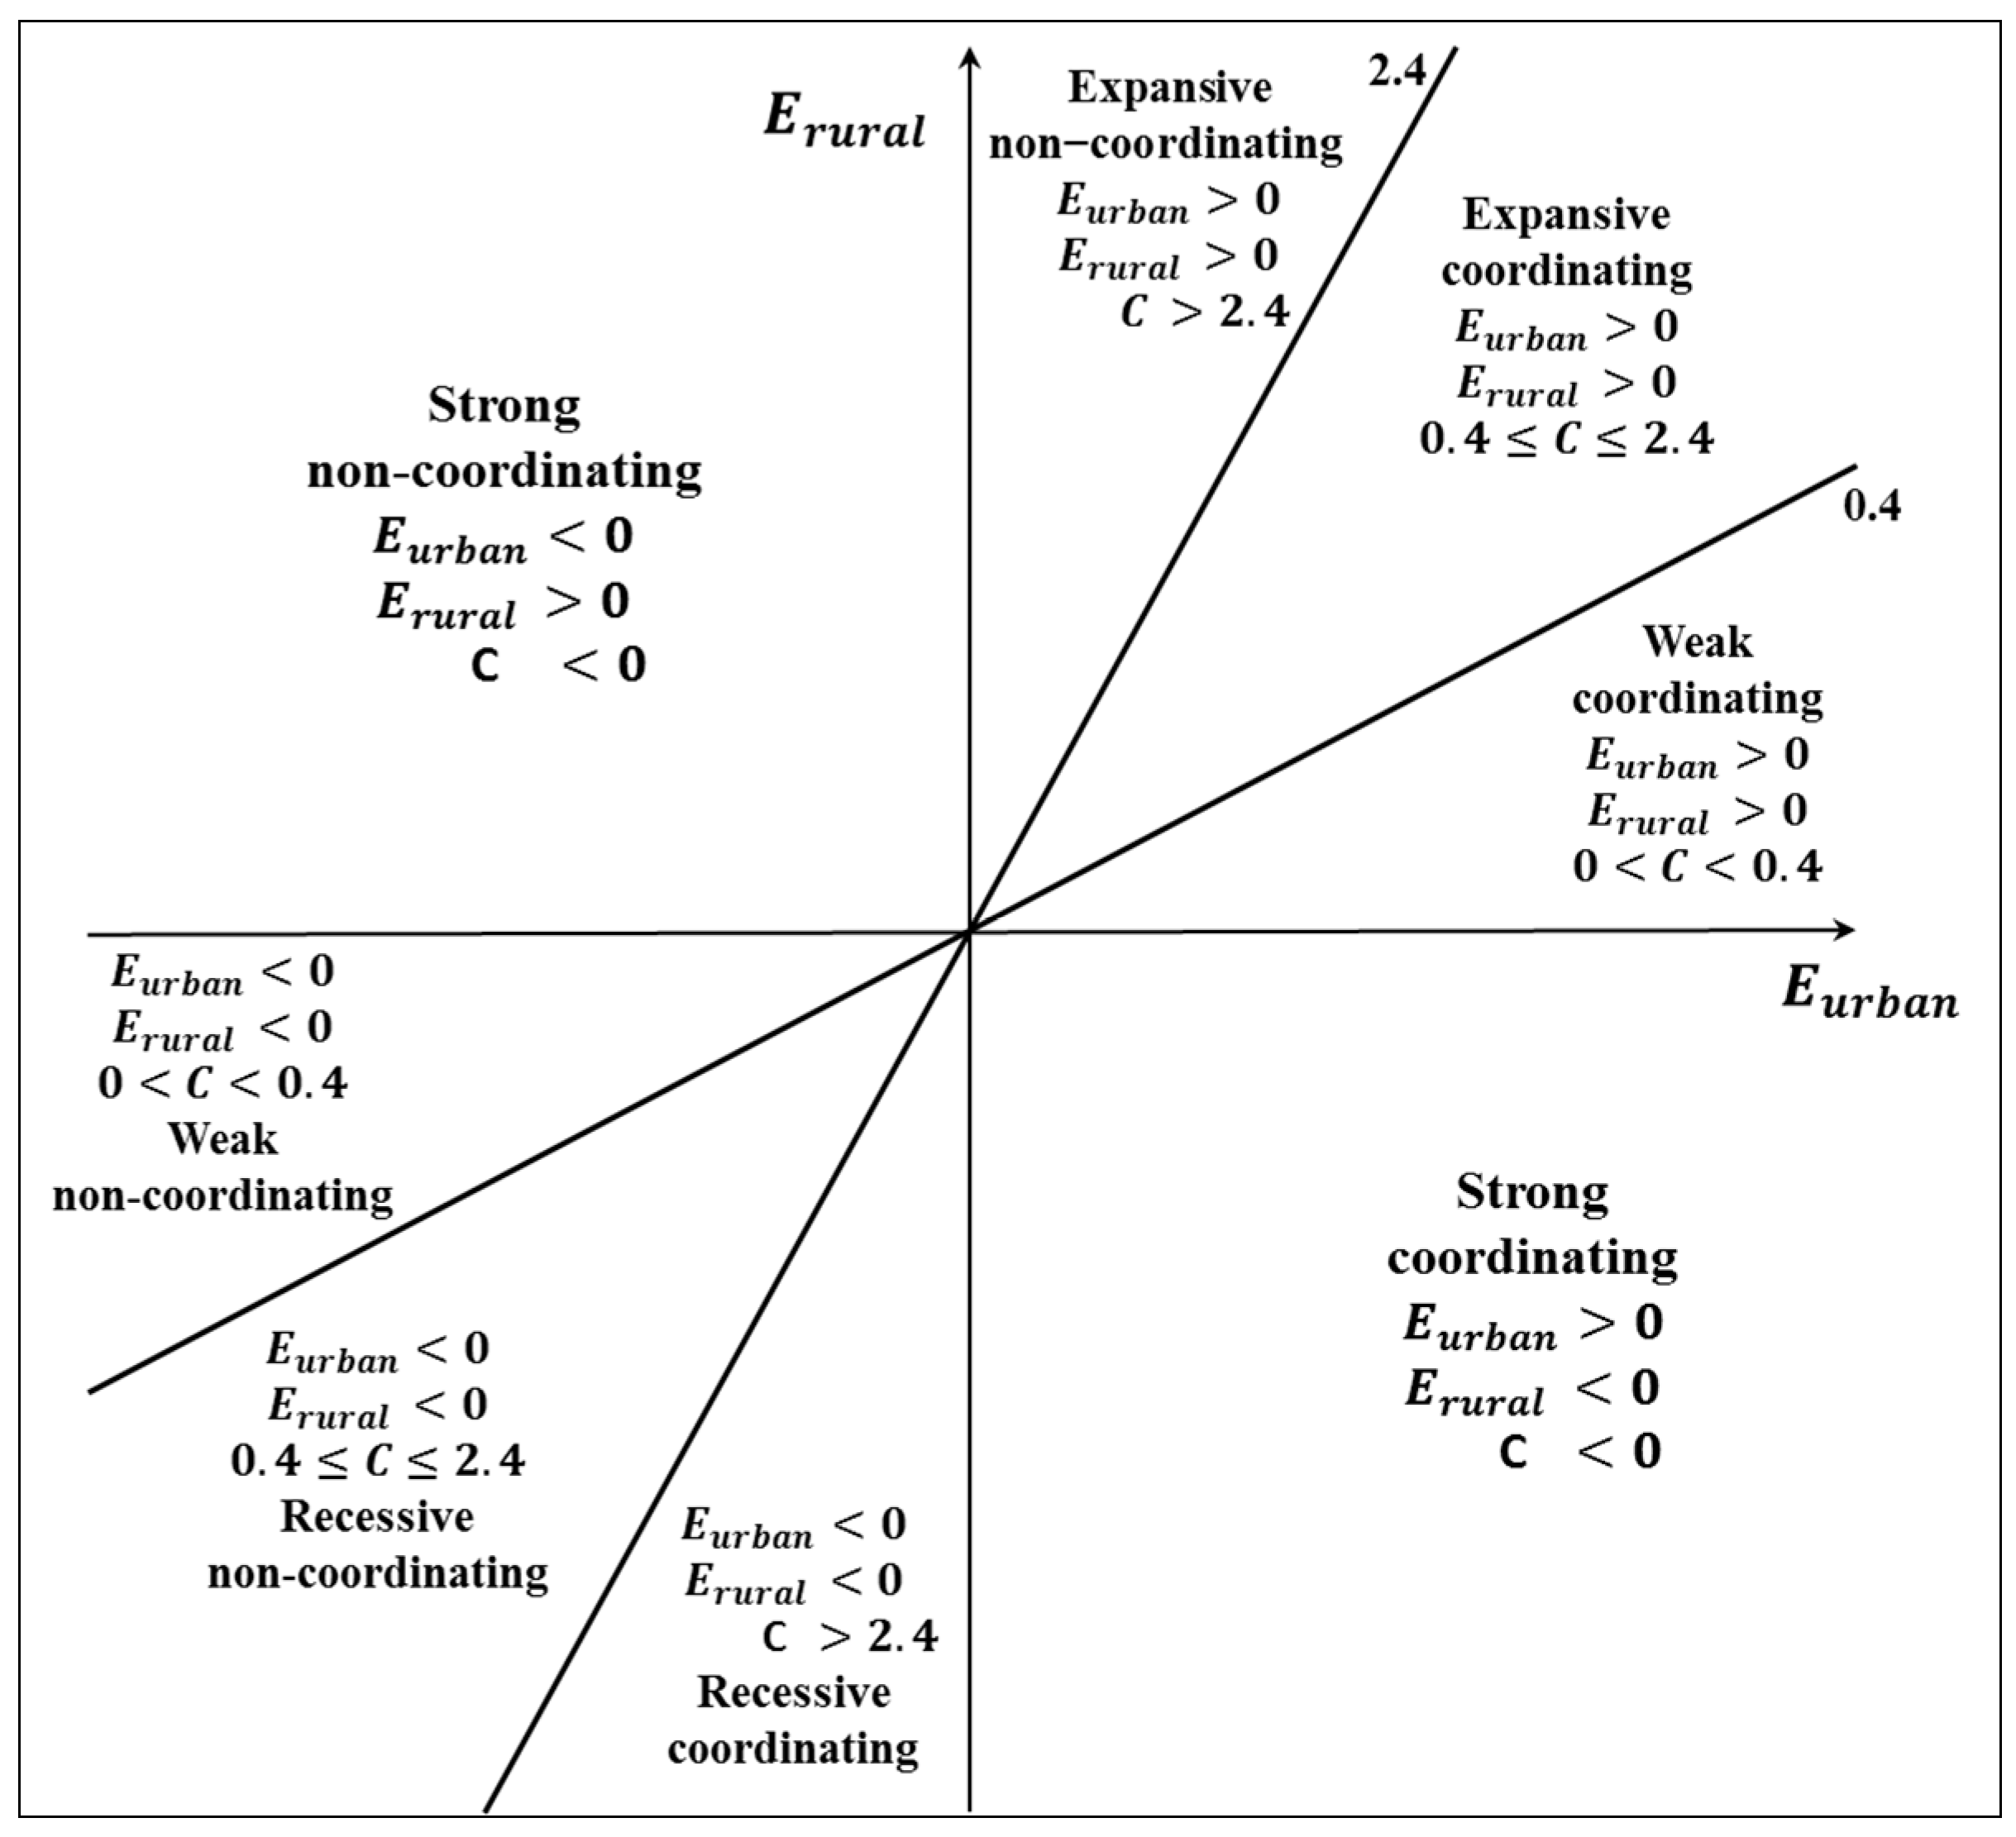
2.1.2. The Coordination Layer

Since the Ministry of Land and Resources proposed the land use policy “Increasing vs. Decreasing Balance” (IDB) in 2005, the coordination relationship between urban and rural construction land has been increasingly important in the LC planning and execution in China [21,47,48,49]. The key objective of the IDB land-use policy is to achieve equilibrium in the supply of land by balancing increases in planned urban construction land with decreases in idle rural construction land [21]. In this study, a theoretical model for coordination analysis has been presented which quantifies the IDB policy. Referring to the de-coupling theory [50,51], the determinants including elasticity of urban-rural construction land have been applied to categorize different degrees of coordinating and non-coordinating relationship [52]. The model can be expressed with Equation (5):
Sustainability 06 07689 i005
Here, C demonstrates the coordinating or non-coordinating value from urban elasticity Eurban to rural elasticity Erural. It indicates that the percentage change of urban and rural construction land (Murban and Mrural) are divided by the percentage change of urban and rural population (Purban and Prural) in a given time period. To ensure that the value of C will only be affected by the positive-negative action of Murban or Mrural, the values of Purban and Prural are set as the absolute values. The assumption is that urban population keeps increasing whilst rural population goes into decline through the development of urbanization.
In order to determine the threshold value of C, the national standards of urban-rural construction land per capita have been used in the study. It is said that the minimum standard of urban and rural construction land per capita is 60 m2 and 50 m2, while the maximum is no more than 120 m2 and 150 m2, respectively [53,54]. In the process of urbanization, two assumptions have been made to determine the threshold value: (1) if a person is living in a rural area with a minimum standard of 50 m2, the possible transition value from rural to urban construction land per capita would be 1.2 (60/50) and 2.4 (120/50); (2) if a person is living in a rural area with a maximum standard of 150 m2, the possible transition value from rural to urban construction land per capita would be 0.4 (60/150) and 0.8 (120/150). According to the limit analysis method, the minimum 0.4 and the maximum 2.4 can be the threshold value of C in the urban-rural transition process. Therefore, eight logical possibilities of coordinating and non-coordinating relationship can be distinguished (Figure 1).
Coordinating can be further divided into four sub-categories: in strong coordinating, Eurban grows and Erural decreases (and C < 0), weak and expansive coordinating occurs when Eurban and Erural both increase (0 < C < 0.4 and 0.4 ≤ C ≤ 2.4, respectively) and recessive coordinating occurs when Eurban and Erural both decrease (and C > 2.4). Non-coordinating includes four sub-categories: in strong non-coordinating Eurban decreases and Erural increases (and C < 0), in weak and recessive non-coordinating Eurban and Erural both decrease (0 < C < 0.4 and 0.4 ≤ C ≤ 2.4, respectively) and expansive non-coordinating occurs when both variable are increasing (C > 2.4).
Figure 1. The degrees of coordinating and non-coordinating of urban elasticity Eurban from rural elasticity Erural.
Sustainability 06 07689 g001

2.1.3. The Potential Layer

The degree of potential is one of the key prerequisites for LC planning. In this study, the assessment is not only to evaluate the potential of land resources, but also to detect the capacity of consolidation ability. Moreover, the potential of land resources in every study unit has been calculated through the Difference Value between Reality and Standard of urban-rural construction land per capita (DVALUE_RS per capita). This method has been recommended by the national guideline for LC planning in many places, and many previous studies have carried out this method for the measurement of potential land resources [55,56,57,58]. Meanwhile, the potential ability is closely related to the level of local economic development, as the consolidation project is a comprehensive engineering system that needs large investment. Therefore, Gross Domestic Product (GDP) and Fixed Assets Investment (FAI) have been chosen as the indicators of potential ability in the assessment framework.

2.1.4. The Urgency Layer

In this study, the LC urgency mainly comes from two aspects: the ecological risks and the planning demands. For the ecological risks, LC can drastically alter the regional ecosystem, and profoundly influence the regional ecological environment [59,60]. The assessment of ecological risks concerning urban-rural construction land consolidation is region-oriented and problem-specific. It is region-oriented as urban and rural areas have different eco-environmental situations, and it is problem-specific because we want to highlight key ecological risks that can present the most urgent eco-environmental problem. Considering the literature review and data availability, the Coverage Rate of Green Area (CRATE_GA) was chosen as the key indicator of ecological risk in the urban urgency layer. Meanwhile, the Area of Farmland per capita (AERA_FARM per capita) was selected as the key indicator of ecological risk in the rural urgency layer. Regarding the urgency of planning demands, there are two significant questions that must be answered: (1) how much space is available for new construction land compared with the local LC planning? (2) Are the reserved farmland resources (e.g., coastal mudflats, ponds) sufficient enough to support the local economic development and land use sustainability? Therefore, the planning demands in the urgency layer have two indicators, the Difference Value between Current and Planning Area of urban-rural construction land (DVALUE_CPA) and the Area of Reserved Farmland Resources (AREA_RFR).

2.1.5. Effect and Weight of Assessment Indicators

All the indicators of each sub-layer above are presented in Table 1, in addition to the effect and weight of assessment indicators. The sign “+” expresses that the value of indicator increases and its contribution to the sub-layer rises while on the contrary, the sign “–” expresses that the value of the indicator decreases and its contribution to the sub-layer rises. For example, the indicator FRAC_MN shows positive effects on the characteristic layer, which means the higher the value of FRAC_MN, the more fragmented the plots are, and the more serious the characteristic is. Another example is the indicator CRATE_GA, which shows a negative effect in the urgency layer: the lower the value of CRATE_GA, the more urgent the consolidation is.
Another important part in the calculation of assessment results is the determination of weights. The entropy method is applied to design the weight for each indicator in the sub-layer. This method firstly appeared in thermodynamics, and was introduced into information theory later by Shannon (1948) [61]. Nowadays, it is widely used in the fields of engineering, economics, finance, etc. [62,63,64,65,66,67,68,69]. Information entropy is the measurement of the disorder degree of a system. It can measure the amount of useful information with the data provided. When the difference of the value among the evaluating objects on the same indicator is high while the entropy is small, it illustrates that this indicator provides more useful information, and the weight of this indicator should be set correspondingly high. On the other hand, if the difference is smaller and the weight of this entropy is higher, the relative weight will be smaller. Hence, the entropy theory is an objective mode of weight determination. Moreover, the details of the entropy method are presented in Appendix A and the results of the entropy weights are shown in Table 1.
Table 1. The assessment framework of urban-rural construction land.
Sub-layerUrbanRural
IndicatorEffectWeightIndicatorEffectWeight
The characteristics layerAREA_MN+0.39AREA_MN+0.29
PLAND+0.35PLAND+0.24
PD+0.10PD+0.21
FRAC_AM+0.15FRAC_AM+0.26
The coordination layerC1.00C1.00
The potential layerDVALUE_RS per capita+0.32DVALUE_RS per capita+0.79
GDP+0.27GDP+0.16
FAI+0.41FAI+0.15
The urgency layerCRATE_GA0.14AERA_FARM per capita0.29
DVALUE_CPA+0.66DVALUE_CPA+0.47
AREA_RFR0.20AREA_RFR0.24

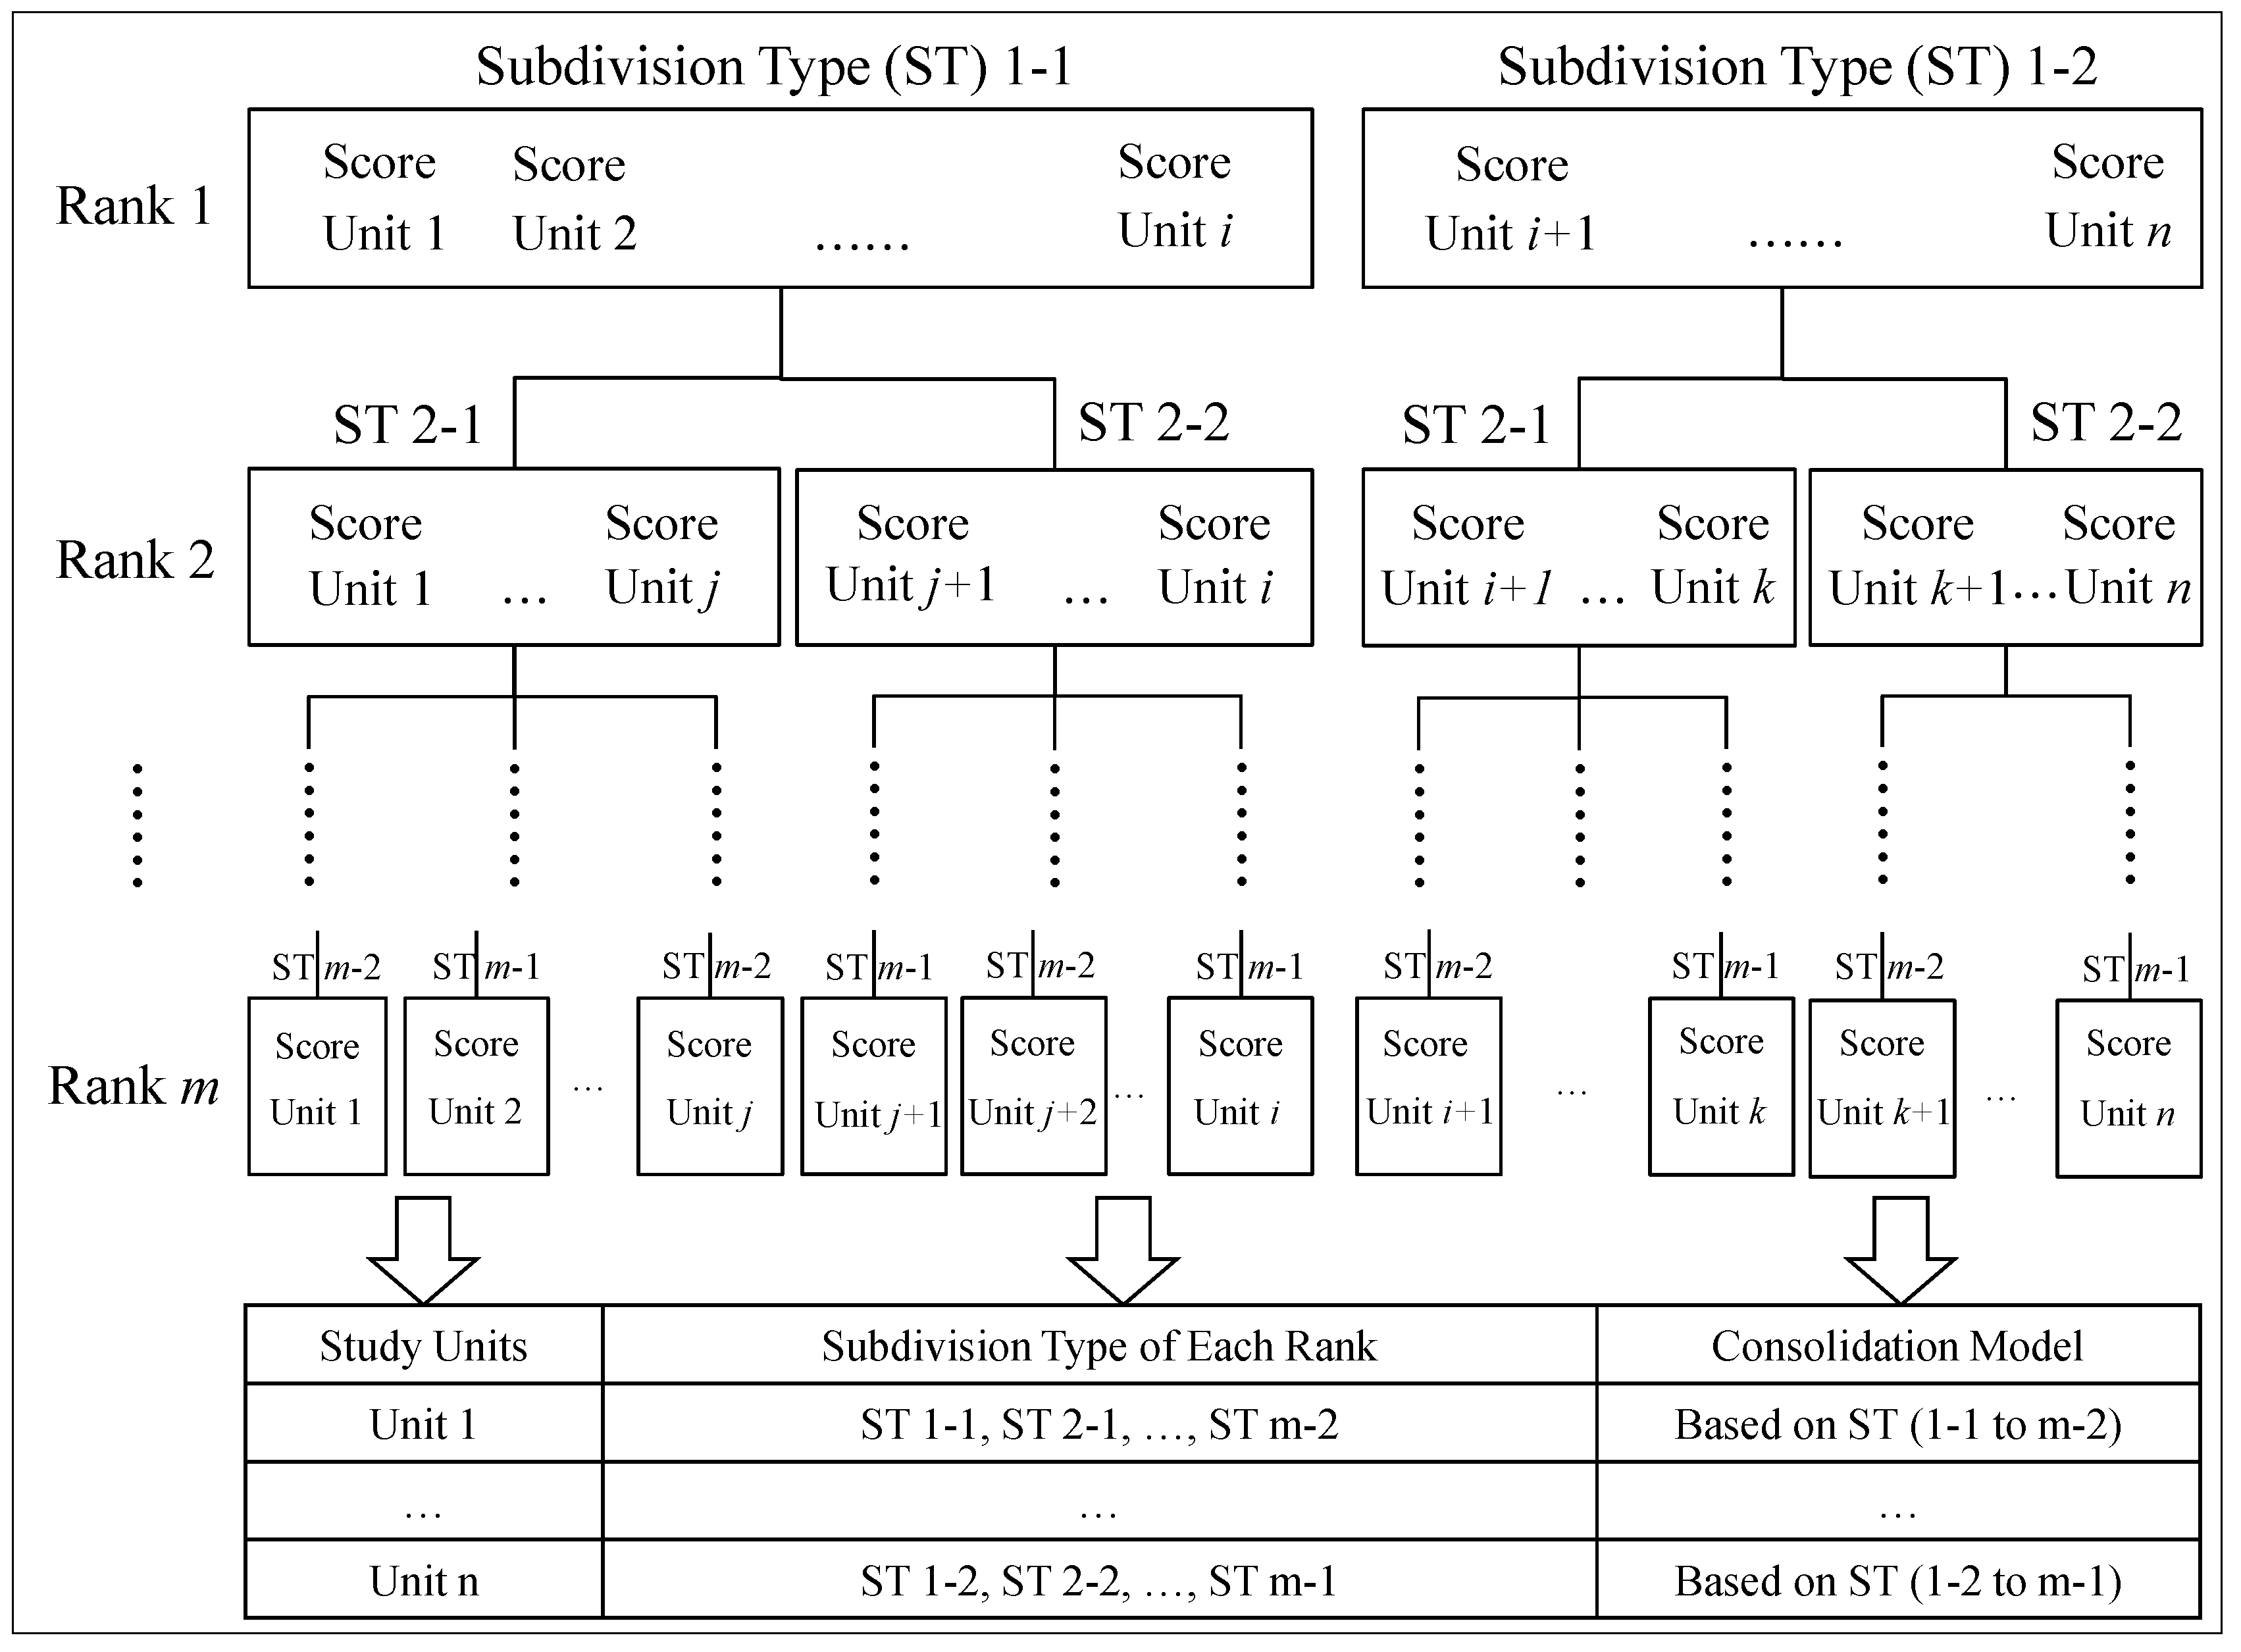
2.2. Decision-Support System for Consolidating Urban-Rural Construction land

Based on the assessment framework, the main process for building the decision-support system (Figure 2) is divided into five steps:
Figure 2. The main process of decision-support system.
Sustainability 06 07689 g002
Step 1: Determine the degree of importance (the sub-layer of assessment) for consolidating urban and rural construction land, respectively.
Step 2: Rank the degrees of importance and determine the subdivision type in each of them.
Step 3: Put the assessment results of study units into the first rank of degree of importance and divide them into the subdivision type by using Natural Breaks method in ArcGIS 10.0 [70].
Step 4: Continue to divide the study units based on previous subdivision type until the last degree of importance.
Step 5: Determine the LC model for each study unit based on the subdivision type in the order of degree of importance.
The core of the process is Step 2, which determines the rank of degree of importance for consolidating urban and rural construction land, respectively. In this study, the ranking of urban and rural degree of importance were ordered based on regional characteristics and project demands.
For the urban degree of importance (Table 2), the deteriorating environment and the critical shortage of urban land supply are increasingly serious problems faced by citizens and the government. To reflect this, the urgency layer was ranked as the first importance degree in urban consolidation. Moreover, the coordination layer was ranked as the second degree since urban consolidation is significantly influenced by the IDB land use policy in China. The other two layers were ranked as the order shown in Table 2, which indicates that consolidation potential is more important than the landscape characteristics in the process of urban consolidation.
Table 2. The degree of importance and the subdivision type for consolidating urban construction land.
The degree of importanceThe subdivision type
Rank 1The urgency layer
Subdivision typeStrongWeak
Rank 2The coordination layer
Subdivision typeCoordinatingNon-coordinating
Rank 3The potential layer
Subdivision typeGreatSmall
Rank 4The characteristic layer
Subdivision typeSeriousStable
For the rural degree of importance (Table 3), the utilization mode and allocation pattern of rural construction land mostly complies with the human-made landscape structures, such as the layout of roads and fishponds. Unlike urban LC, which is launched in a comparatively small area, rural LC usually covers large-scale landscapes. Therefore, understanding the characteristics of land-use change in rural areas is significant for carrying out LC projects. Meanwhile, measuring the potential of land resources is another important task, as rural LC involves more complex situations than urban LC. Therefore, the characteristic layer and the potential layer are ranked in the first and second degree of importance in the rural decision-support system, respectively. The other layers are ranked in the order shown in Table 3, which indicates the urgency layer is comparatively more important than the coordination layer in consolidating rural construction land.
Table 3. The degree of importance and the subdivision type for consolidating rural construction land.
The degree of importanceThe subdivision type
Rank 1The characteristic layer
Subdivision typeSeriousStable
Rank 2The potential layer
Subdivision typeGreatSmall
Rank 3The urgency layer
Subdivision typeStrongWeak
Rank 4The coordination layer
Subdivision typeCoordinatingNon-coordinating

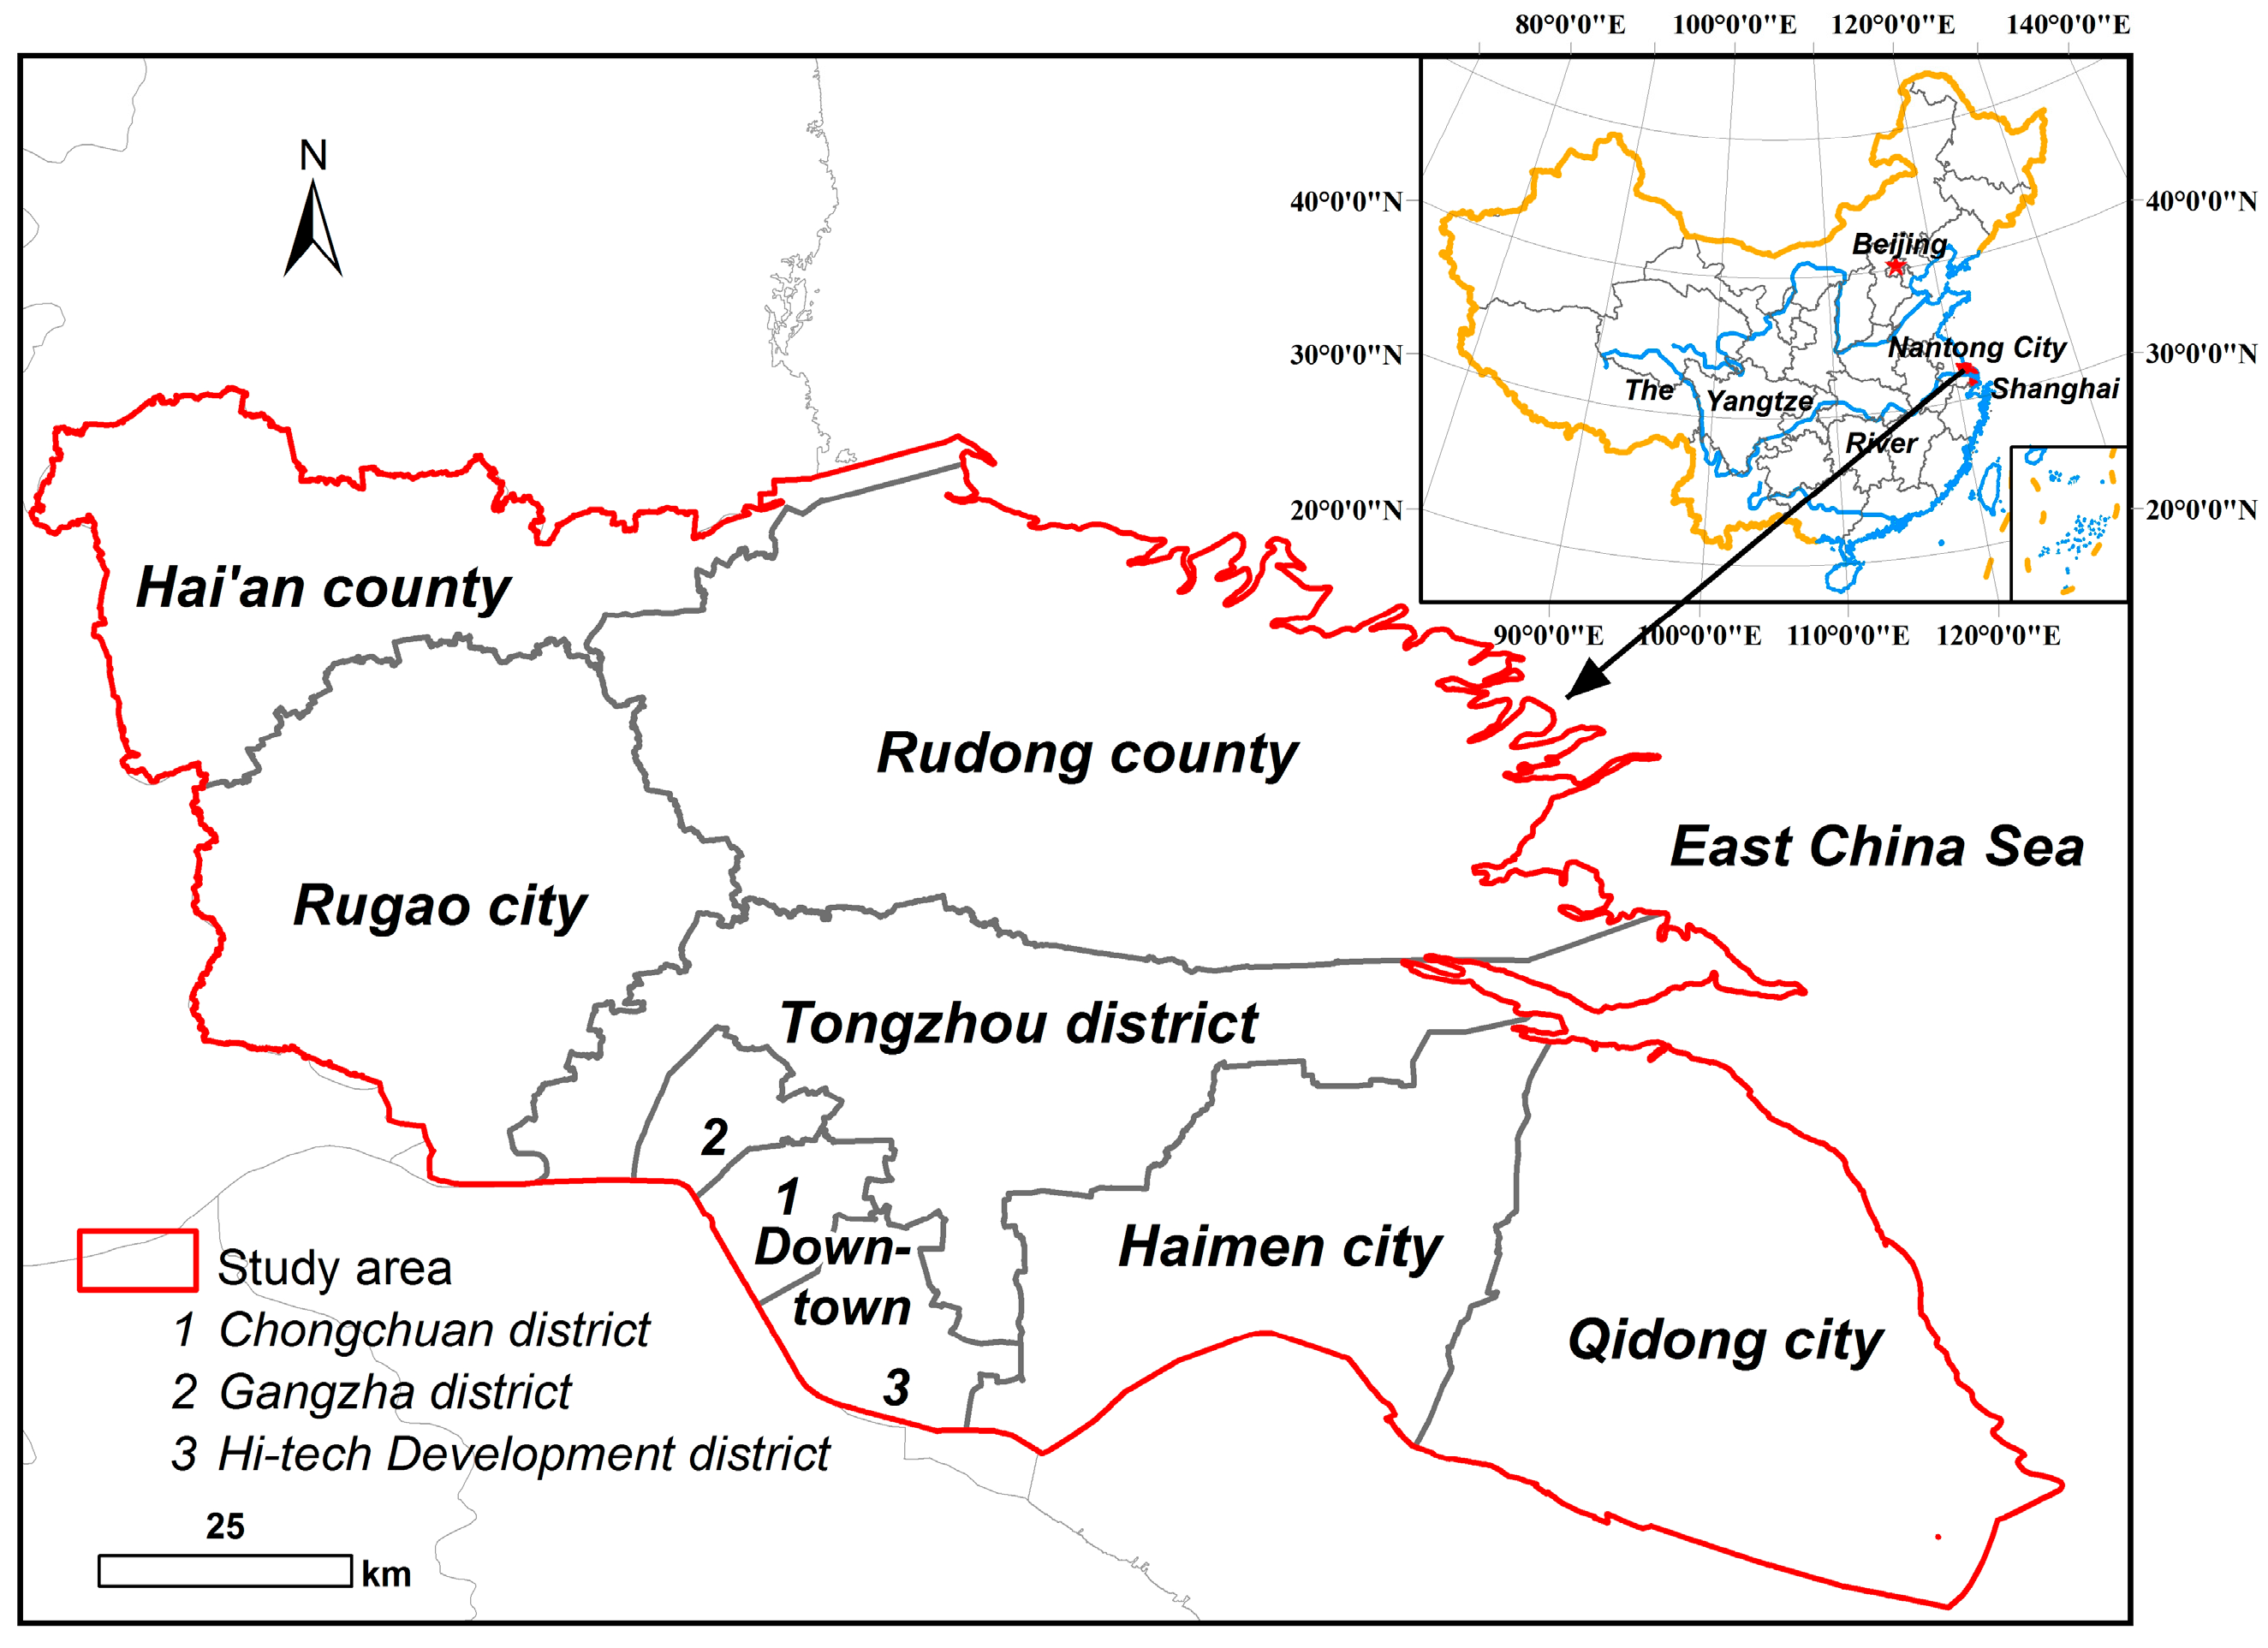
3. Study Area and Data Resources

3.1. Study Area

Nantong city has been chosen as the study area due to its unique geographical location and policy environment. It is located in the southeast of Jiangsu province, at the intersection of the Yangtze River estuary and the East China Sea (Figure 3). It is the only coastal city where two national strategies meet: Integration of Yangtze River Delta and Jiangsu Coastal Development. This area covers approximately 1.05 million ha of flat alluvial plains with a northern subtropical monsoon climate, both of which factors are beneficial for agricultural production. Since the new millennium, the economic growth of Nantong city has significantly accelerated, benefiting from the flourishing development of Shanghai and the Su-Xi-Chang region. At the end of 2011, the total GDP of Nantong city has amounted to 665.64 billion USD (9136.51 USD per capita) with an annual growth rate of 36.74%; the total urban population has increased to 4.20 million with an urbanization rate of 57.60%. However, with the development of urbanization and economic activities, land utilization in Nantong city has changed dramatically. The farmland has declined continuously and urban construction land has been developed inefficiently. In addition, due to the loose planning and neglected management in the countryside, the situation of new houses being built in rural areas has been particularly serious. The competition between construction land use and agricultural land protection has been a major concern in Nantong city, which is a typical predicament faced by most coastal cities in China.
Figure 3. Location and administrative division (county level) of Nantong city.
Sustainability 06 07689 g003

3.2. Data Resources

The study is conducted in Nantong city from 2001–2011. Due to data availability, some data are only available close to the study period, e.g., Landsat TM images are in the year 2000 and 2010. On the other hand, data from specific years are derived from the related planning, for example, the planning control indices (in 2011) related to this study are derived from the overall land use planning (2006–2020) and the municipal LC planning of Nantong city (2011–2015). Thus the data resources include:
  • Landsat TM images of Nantong city in 2000 and 2010;
  • The administrative map of Nantong city (county level);
  • Statistical data on the population, economy and environment of Nantong city in 2001 and 2011;
  • The overall land use planning of Nantong city (2006–2020);
  • The municipal LC planning of Nantong city (2011–2015).
The Landsat TM images and the administrative map of Nantong city came from the National Science and Technology Infrastructure: Data Sharing and Infrastructure of Earth System Science. The statistical data were obtained from the Nantong Statistical Yearbooks. The Nantong Bureau of Land Resources provided the key data in the overall land use planning and the municipal LC planning concerning our study.
The data of this paper were based on the county administrative division, which can be learned from Figure 3. It should be noted that the Downtown area is composed of three sub-regions, which are Chongchuan, Gangzha and the Hi-tech Development District. These sub-regions are merged into one spatial unit because of the availability of data and the convenience for analysis. The spatial data were abstracted for related indices (e.g., landscape indices) from the images and maps using ArcGIS 10.0 software. Attribute data were abstracted for related indices (e.g., coordination index) from the statistical and planning data outlined above. The calculation of spatial and attribute data followed the assessment framework outlined in Section 2.1.

4. Results and Discussion

Based on the data resources and results of data processing in Section 2.2, the weighting allocation in each sub-layer is determined with the entropy method and the assessment results are calculated for consolidating the urban-rural construction land in every county of Nantong city. The assessment results of urban and rural construction land are shown in Table 4 and Table 5, respectively. Moreover, putting the assessment results into the decision-support system and following the processing steps in Section 2.2, the consolidation type is divided and the consolidation model can be determined based on the subdivision type in each degree of importance. The main process and corresponding models of the decision-support system for consolidating urban and rural construction land are shown in Figure 4, Table 5, Figure 5 and Table 6, respectively.

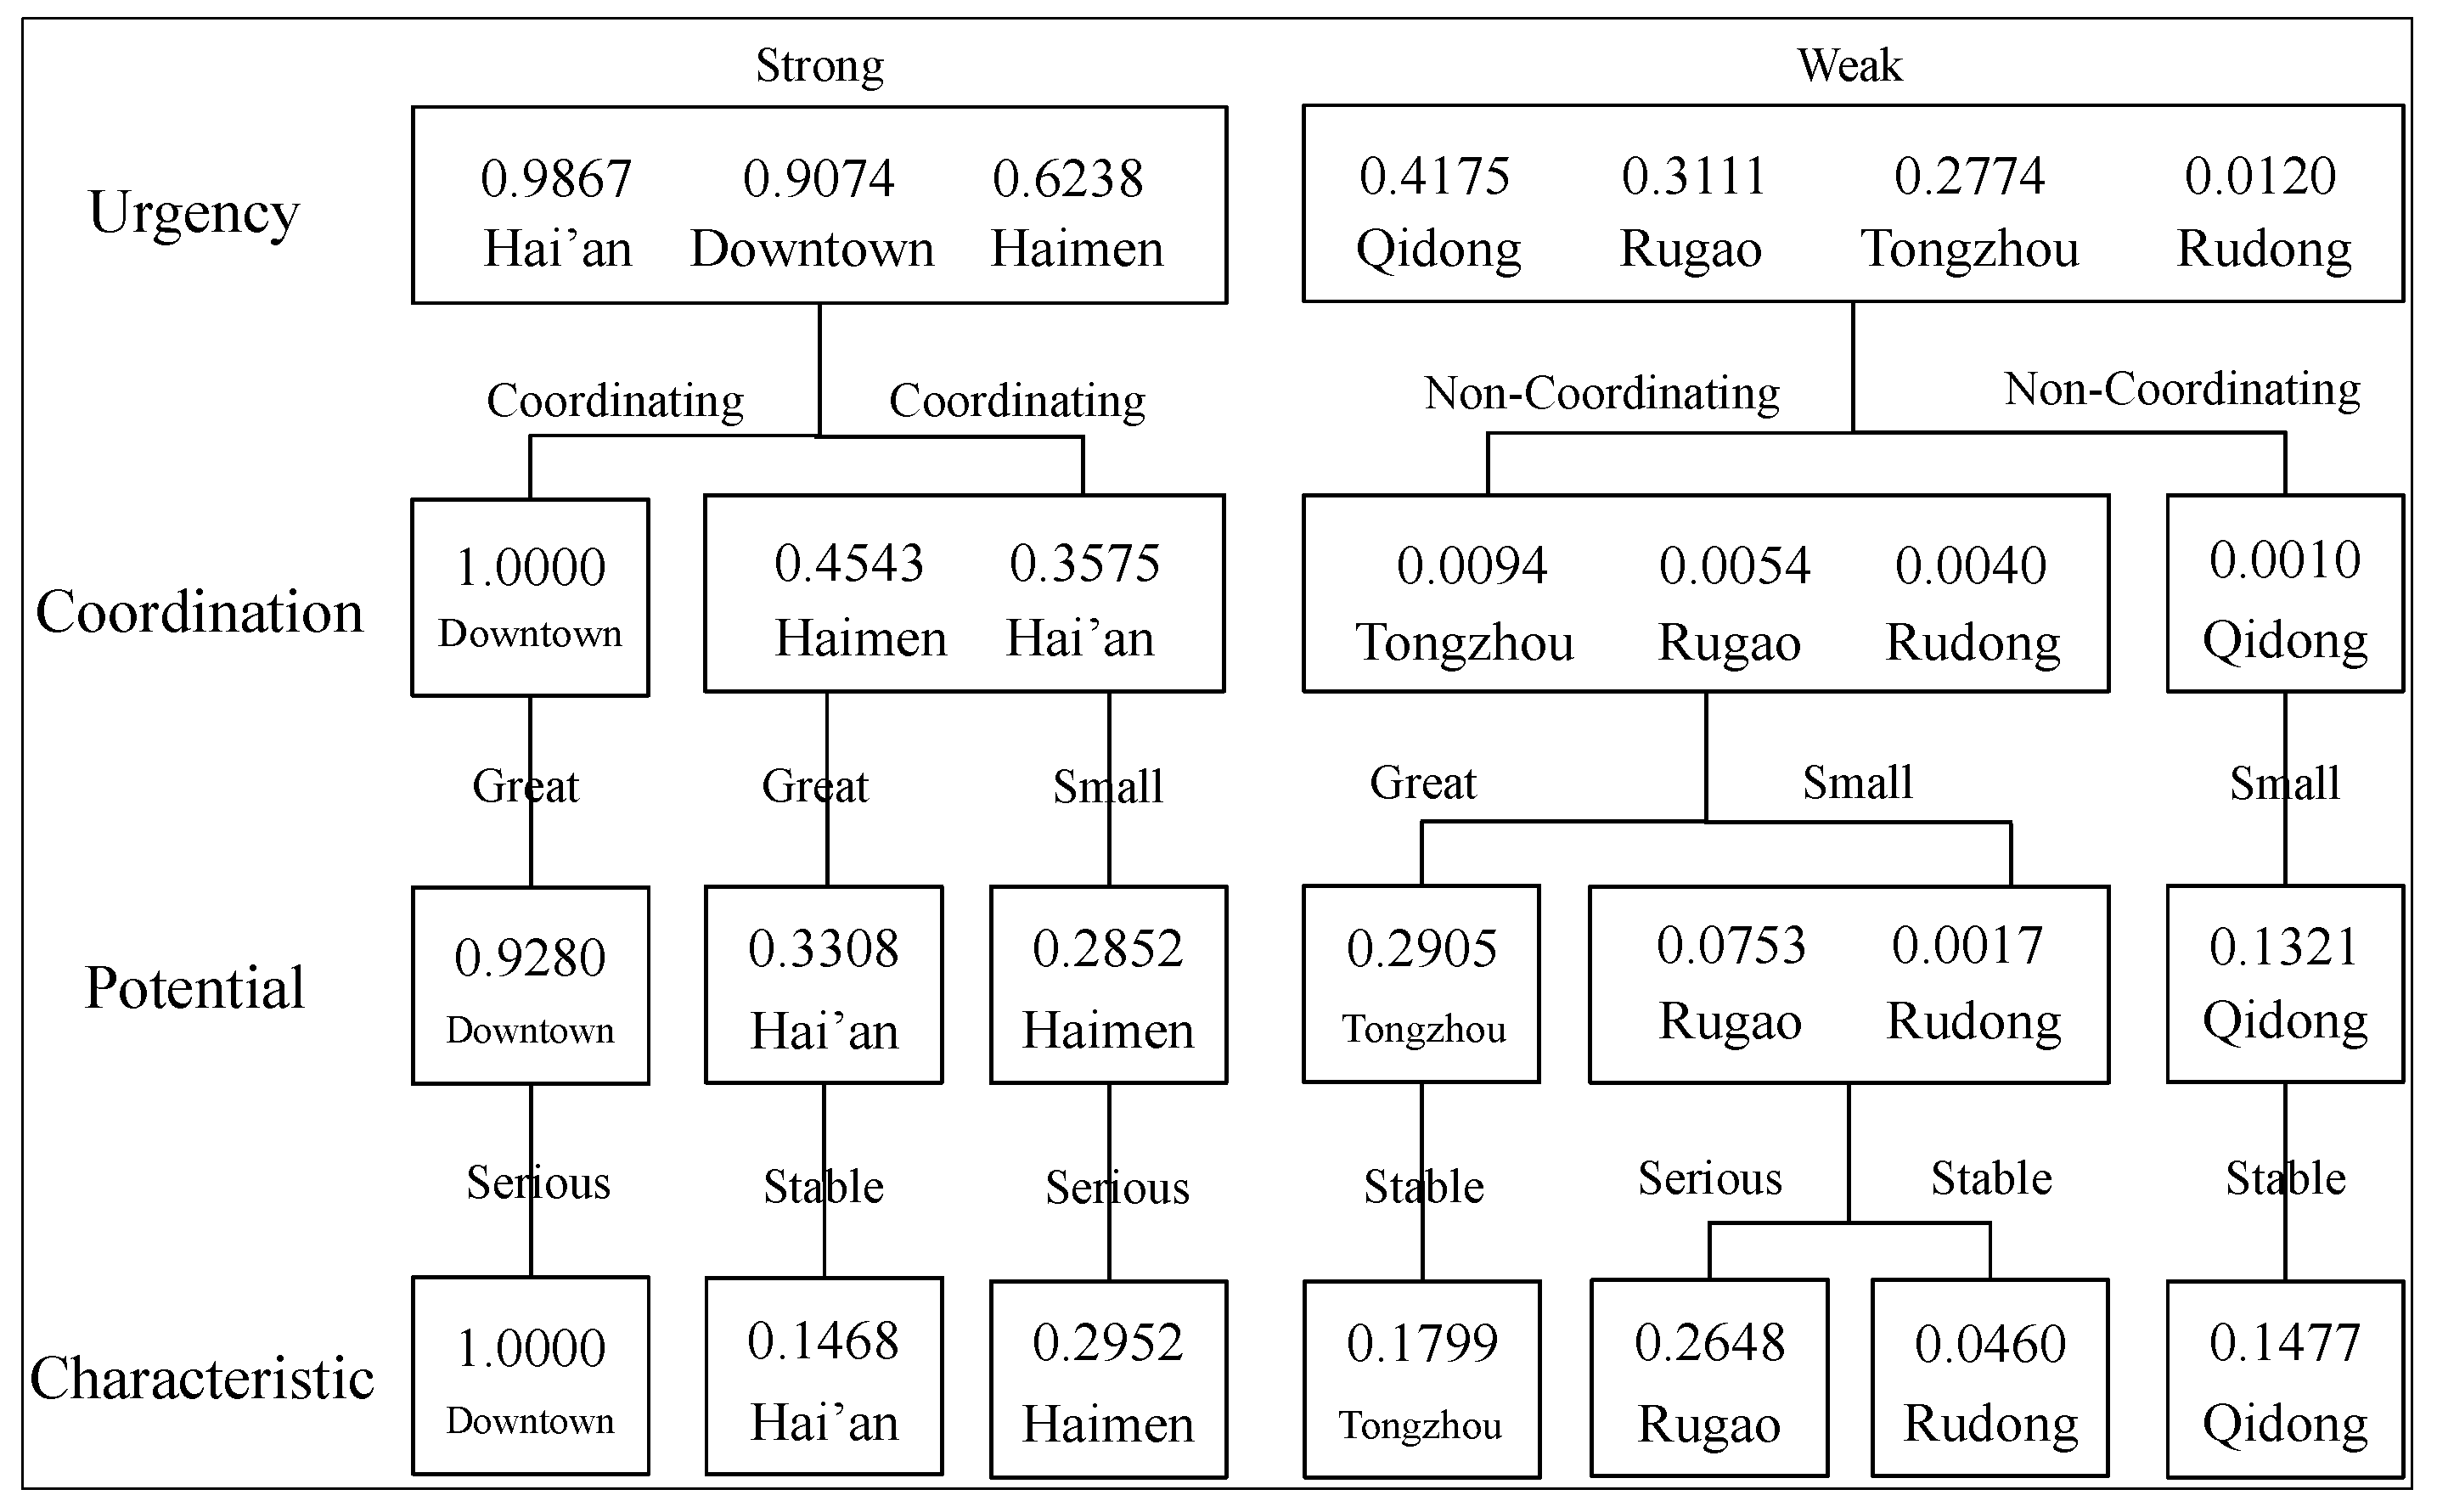
4.1. Urban Assessment and Consolidation Model

According to the assessment results (Table 4) of urban construction land, the counties in the first degree of importance—the urgency layer—can be divided into two types: strong and weak (Figure 4). To keep the integrity of the process, we first discuss the strong urgency type and then analyze the weak type.
Table 4. The assessment results of urban construction land.
DowntownTongzhouHai’anRudongQidongRugaoHaimen
The urgency layer0.90740.27740.98670.01200.41750.31110.6238
The coordination layer1.00000.00940.35750.00400.00100.00540.4543
The potential layer0.92800.29050.33080.00170.13210.07530.2852
The characteristic layer1.00000.17990.14680.04600.14770.26480.2952
Figure 4. The decision-support system for consolidating urban construction land.
Sustainability 06 07689 g004
In the strong urgency type, three counties are included: Hai’an county, Downtown area and Haimen city, which indicates comparatively high ecological risks and great planning demands in these places. More specifically, the coverage rate of green areas is low and the current area of urban construction land is far beyond the planning demands. Meanwhile, strong urgency is expressed by a small area of reserved farmland resources in local counties. These three counties should be considered as prior places of LC of urban construction land. In the next degree of importance, coordination relationship between urban and rural construction land is quantified using Equation (5). Here, Downtown area, Haimen city and Hai’an county all have a coordinating relationship in the utilization of urban-rural construction land, which shows increases in urban construction land while decreases in rural construction land when people move from rural to urban areas. Therefore, the implementation of IDB land use policy is not as necessary in these counties. In the subdivision of potential degree, Downtown area and Hai’an county have a comparatively greater consolidation potential than Haimen city, which indicates the first two counties have a great economic capacity and have higher DVALUE_RS than the last county. As a result, Downtown area and Hai’an county should make full excavation of their own land potential while Haimen city can develop new land resources to an allowable amount. Lastly, the characteristic degree can be identified by the assessment results in each county. Downtown area and Haimen city have a more serious situation of land fragmentation than Hai’an county, which shows the first two areas have more complex and fragmented urban plots than the last area. It is recommended that Downtown area and Haimen city should improve their urban land use efficiency through the renewal of unused parcels, while Hai’an county should avoid wasting urban land with optimization of small plots.
In the weak urgency type, four counties are included: Qidong city, Rugao city, Tongzhou district and Rudong county. This means that these places have a lower ecological risks and small planning demands than the strong urgency counties, so consolidation projects can be implemented in appropriate time and intensive way. Based on the calculating results of the LC relationship, the next degree of importance concerning the urban-rural relationship is divided. All four counties have a non-coordinating relationship, which indicates both urban and rural construction land have been increased during the rapid trend of urbanization. Therefore, these four counties are the key areas implementing the IDB land use policy. In the next degree of importance of consolidation potential, Tongzhou district has a comparatively great result while the other three have small ones. This indicates that Tongzhou district should excavate more potential land resources in its own area while the others can develop new land resources in consolidation projects. In the last characteristic degree, Rugao city has a comparatively serious situation of land fragmentation while Tongzhou district, Rudong county and Qidong city have stable results of land fragmentation.
Based on the subdivision type in each degree of importance, the urban consolidation model for every county in Nantong city can be concluded (Table 5). For example, the subdivision type in each degree of importance of Hai’an county is “strong urgency, coordinating relationship, great potential and stable characteristic”. According to the discussion above, the corresponding model for consolidating Hai’an county’s urban construction land can be “prior consolidation in coordinating relationship with excavation of land potential and optimization of small plots”. Hence, the words “Prior, Coordinating, Excavation and Optimization” can be the representatives of the model. Similarly, in Qidong city, the subdivision types of each degree of importance are “weak urgency, non-coordinating relationship, small potential and stable characteristic”. The corresponding consolidation model can be “appropriate consolidation implementing IDB policy with development of new land resources and optimization of small plots”. Therefore, the abbreviation of the model can be “Appropriate, IDB, Development and Optimization”. The other consolidation models are concluded in the same way shown in Table 5.
Table 5. The consolidation model of urban construction land in every county of Nantong city.
Study UnitsSubdivision Type of Each Importance DegreeConsolidation Model
Hai’an countyStrong urgency, Coordinating relationship,
Great potential and Stable characteristic
Prior, Coordinating,
Excavation and Optimization
Downtown areaStrong urgency, Coordinating relationship,
Great potential and Serious characteristic
Prior, Coordinating, Excavation and Renewal
Haimen cityStrong urgency, Coordinating relationship,
Small potential and Serious characteristic
Prior, Coordinating, Moderation and Renewal
Qidong cityWeak urgency, Non-coordinating relationship,
Small potential and Stable characteristic
Appropriate, “Increasing vs. Decreasing
Balance”, Development and Optimization
Rugao cityWeak urgency, Non-coordinating relationship,
Small potential and Serious characteristic
Appropriate, “Increasing vs. Decreasing
Balance”, Development and Renewal
Tongzhou districtWeak urgency, Non-coordinating relationship,
Great potential and Stable characteristic
Appropriate, “Increasing vs. Decreasing
Balance”, Excavation and Optimization
Rudong countyWeak urgency, Non-coordinating relationship,
Small potential and Stable characteristic
Appropriate, “Increasing vs. Decreasing
Balance”, Development and Optimization

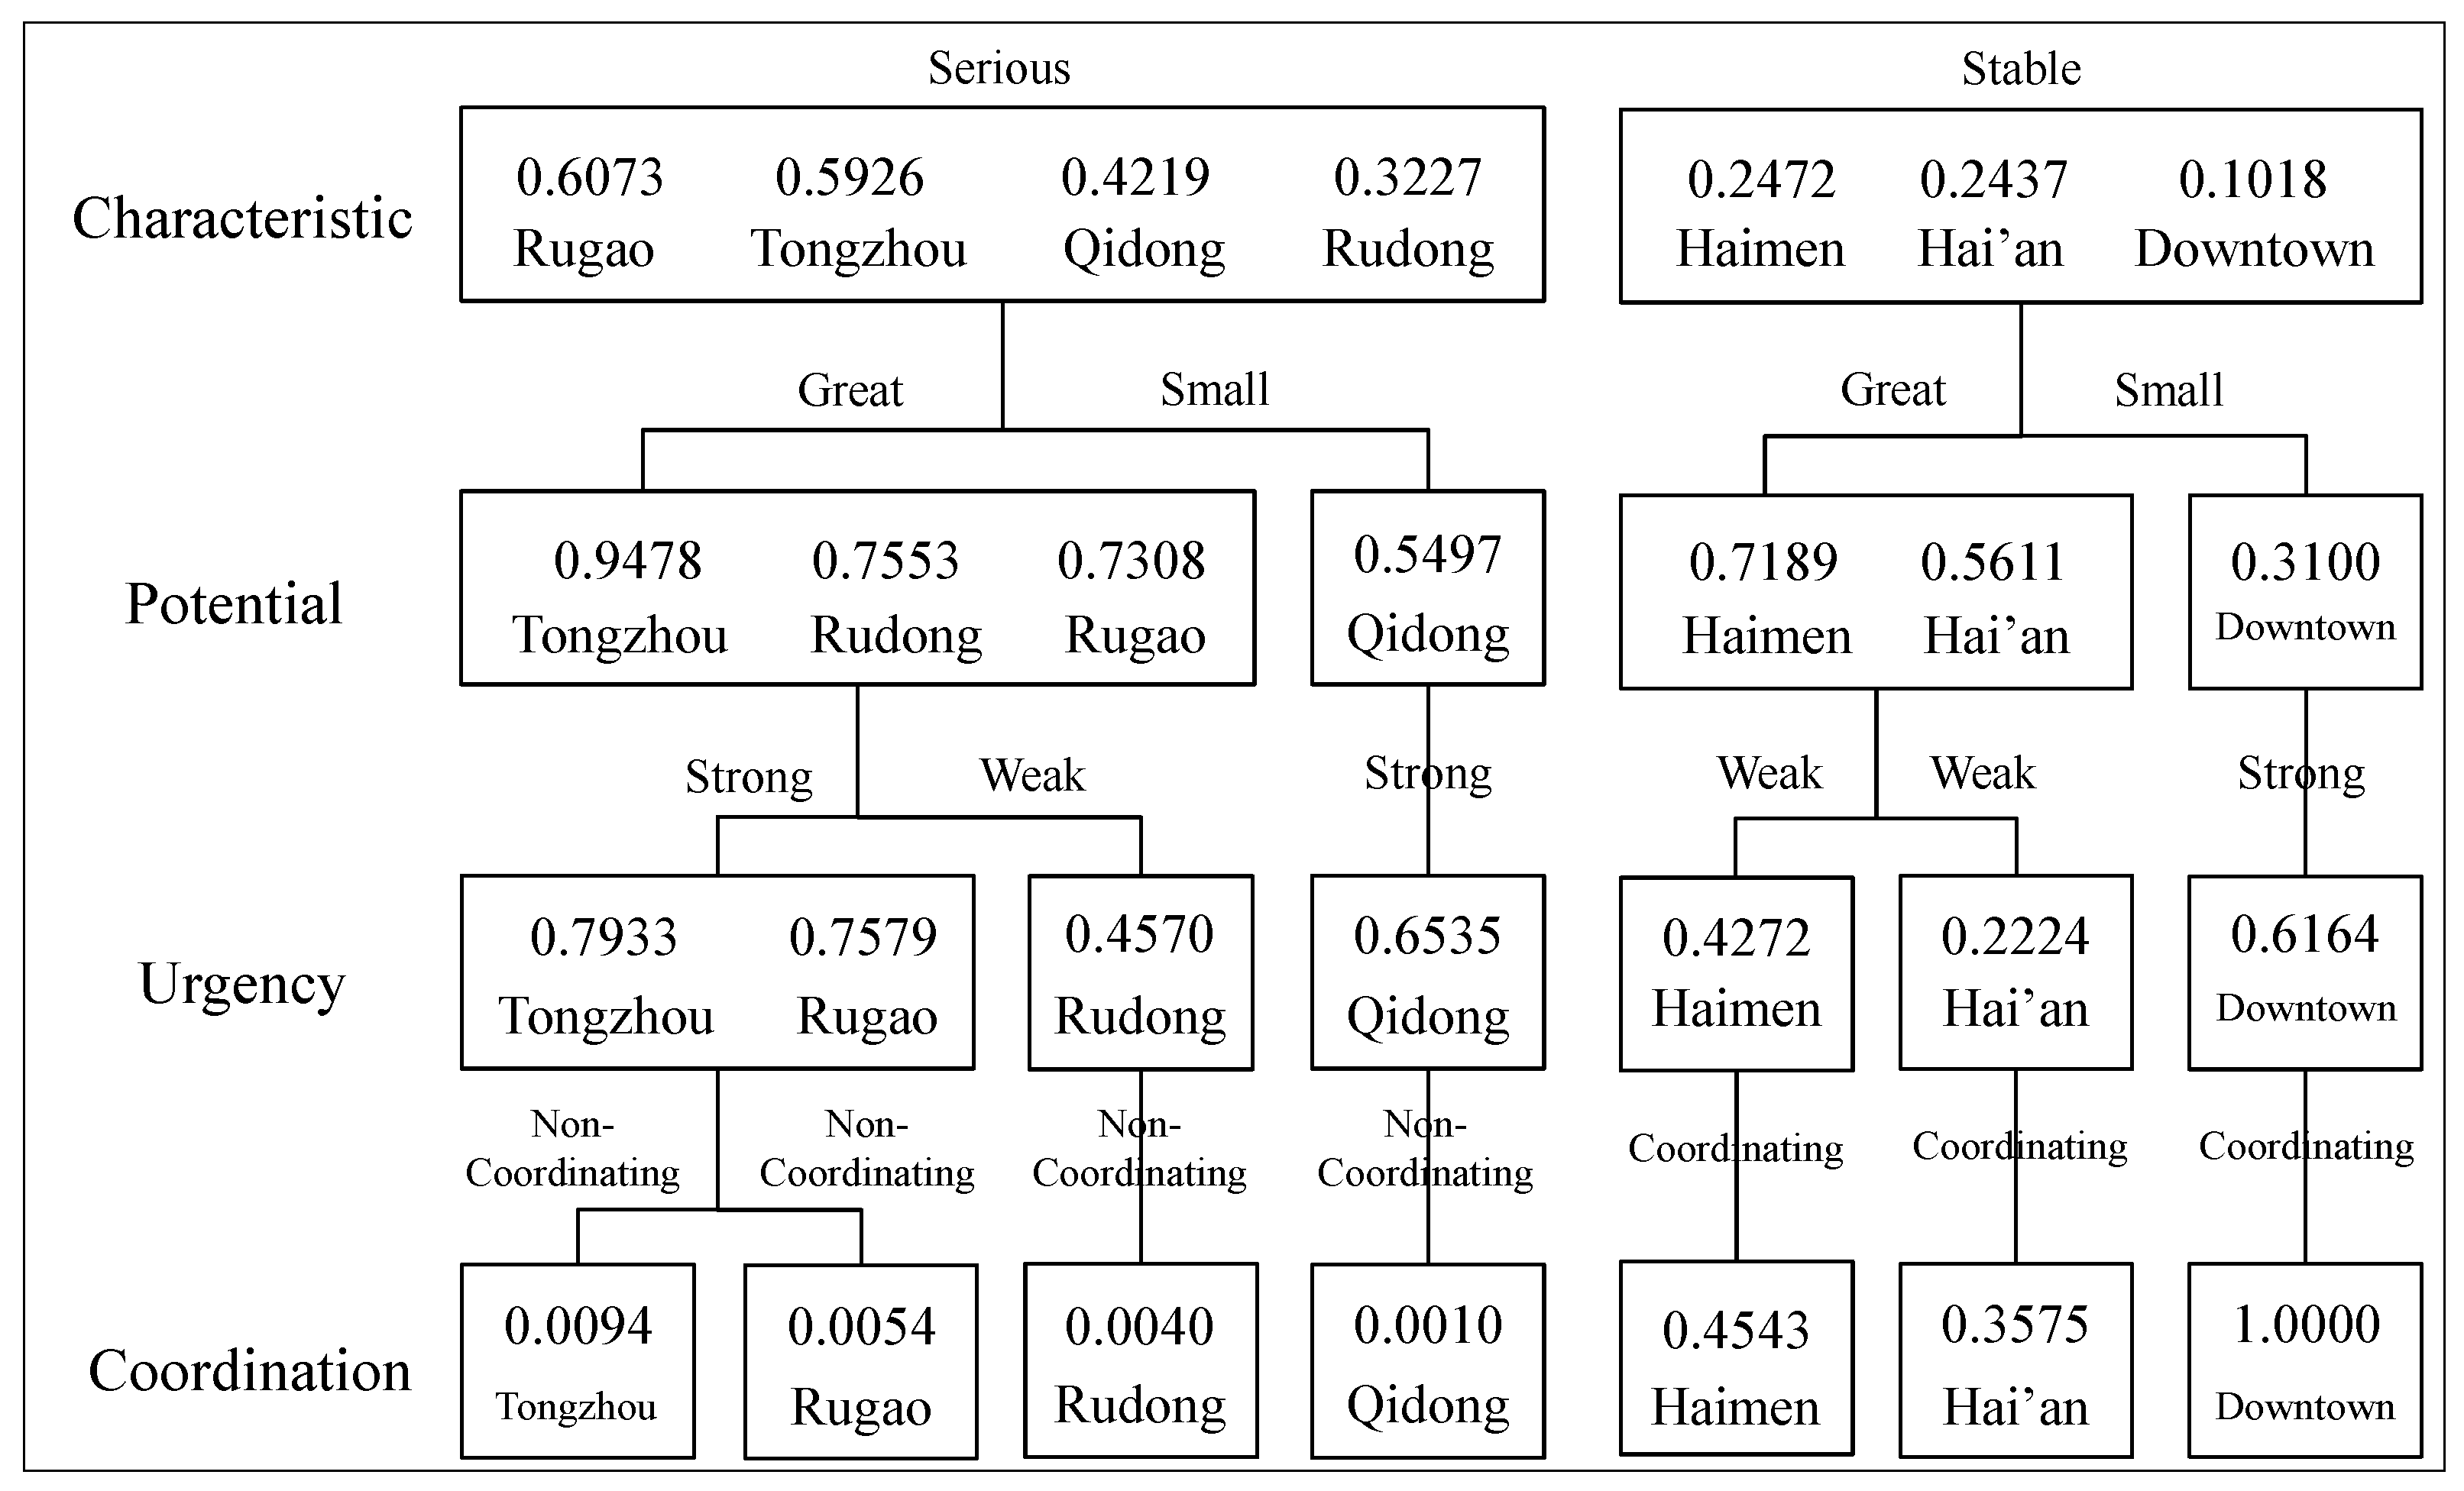
4.2. Rural Assessment and Consolidation Model

According to the rural degree of importance, the assessment results for consolidating rural construction land (Table 6) are firstly divided in the characteristic layer. In Figure 5, four counties belong to the serious type and the other three belonging to the stable one. Similar to the urban analysis, we try to begin with the discussion of serious group and then turn to the stable one.
Table 6. The assessment results of rural construction land.
DowntownTongzhouHai’anRudongQidongRugaoHaimen
The characteristic layer0.10180.59260.24370.32270.42190.67030.2472
The potential layer0.31000.94780.56110.75530.54970.73080.7189
The urgency layer0.61640.79330.22240.45700.65350.75790.4272
The coordination layer1.00000.00940.35750.00400.00100.00540.4543
Figure 5. The decision-support system for consolidating rural construction land.
Sustainability 06 07689 g005
In the serious type, land fragmentation of rural construction land is widespread in Rugao city, Tongzhou district, Qidong city and Rudong county. These places are the key areas for large-scale reallocation of scattered rural construction plots. Having understood the characteristics, the consolidation potential is divided in the next degree of importance. Tongzhou district, Rudong county and Rugao city have a comparatively greater potential than Qidong city, which indicates the first three counties with relatively high economic capacity can promote the large-scale implementation of moving and merging villages while the last county is encouraged to promote the integration of small villages. Moreover, in degree of urgency, Tongzhou district, Rugao city and Qidong county have a comparatively stronger urgency than Rudong city. It is recommended that the control of extension in rural construction land should be strengthened in Tongzhou district, Rugao city and Qidong county, while Rudong county, with weak urgency and ample area of reserved farmland resources, can optimize the village development in a harmonious and eco-friendly way. Lastly, in the coordination degree, all of the four counties have a non-coordinating relationship in the utilization of urban-rural construction land, which is mainly reflected by the double growth of urban and rural construction land in the trend of urbanization. Like the analysis in the degree of urban coordination, these four places are the key areas for implementing the IDB land use policy.
In the stable type, land fragmentation is not serious in Haimen city, Hai’an county and Downtown area. These three counties should focus on the transition of rural land use and advance rural development. In the potential degree, Haimen city and Hai’an county have a relatively greater potential than Downtown area. For the former two counties, merging idle villages can be an option in the rural consolidation. However, for the latter Downtown area, scattering small villages in suburbs which can be absorbed into the city with scientific consolidation planning exists. In the urgency degree, Downtown area has a comparatively strong urgency while Haimen city and Hai’an county have a weak one. It is recommended that Downtown area takes priority over launching rural consolidation projects to keep a high quality of urbanization. As for Haimen city and Hai’an county, optimization of village development is the proper choice for rural consolidation. The degree of coordination relationship is analyzed in the same way as urban degree of importance. Haimen city, Hai’an county and Downtown area are in a coordinating relationship of the utilization between urban and rural areas.
Similar to the urban consolidation model, the rural consolidation model for each county in Nantong city is concluded based on subdivision type of each degree of importance (Table 7). Taking Rugao city as an example, “serious characteristic, great potential, strong urgency and non-coordinating relationship” are the subdivision types. According to the discussion above, the corresponding model for consolidating rural construction land in Rugao city can be “large-scale reallocation of scattered plots and merging idle villages while controlling the extension of rural construction land and implementing IDB land use policy”. The abbreviation of the model can be “Reallocation, Merging, Control and IDB”. Another example is Haimen city, whose subdivision types are “stable characteristic, great potential, weak urgency and coordinating relationship”. The rural consolidation model of Haimen city can be “transition of rural development and merging idle villages with optimization and coordination of urban-rural land use”. The other rural consolidation models are concluded in the same way shown in Table 7.
Table 7. The consolidation model of rural construction land in every county of Nantong city.
Study UnitsSubdivision Type of Each Importance DegreeConsolidation Model
Rugao citySerious characteristic, Great potential, Strong urgency and Non-coordinating relationshipReallocation, Merging, Control and “Increasing vs. Decreasing Balance”
Tongzhou districtSerious characteristic, Great potential, Strong urgency and Non-coordinating relationshipReallocation, Merging, Control and “Increasing vs. Decreasing Balance”
Qidong citySerious characteristic, Great potential, Weak urgency and Non-coordinating relationshipReallocation, Merging, Optimization and “Increasing vs. Decreasing Balance”
Rudong countySerious characteristic, Small potential, Strong urgency and Non-coordinating relationshipReallocation, Integration, Control and “Increasing vs. Decreasing Balance”
Haimen cityStable characteristic, Great potential, Weak urgency and Coordinating relationshipTransition, Merging,
Optimization and Coordinating
Hai’an countyStable characteristic, Great potential, Weak urgency and Coordinating relationshipTransition, Merging,
Optimization and Coordinating
Downtown areaStable characteristic, Small potential, Strong urgency and Coordinating relationshipTransition, Integration,
Prior and Coordinating

5. Conclusions

This paper has set out an assessment framework and a decision-support system aimed at developing an integrated evaluation and specific models for urban-rural construction land consolidation. In this context, land fragmentation, coordination relationship, consolidation potential and urgency are considered as key problems in the consolidation process of urban-rural construction land which can be represented by four sub-layers: the characteristic layer, the coordination layer, the potential layer and the urgency layer. The characteristic layer constitutes landscape indices which include criteria regarding size, percentage, density and shape of plots for measuring the existing status of land fragmentation in urban and rural areas. The coordination layer provides a new methodology for quantifying the IDB land use policy by examining and categorizing the elasticity change from rural to urban areas. The potential layer not only aims at assessing the potential land resources, but also focusing on the capacity of consolidation ability, i.e., economic strength. Finally, the ecological risks and planning demands that underpin the urgency layer have been explained.
Based on the assessment results, the decision-support system is built, consisting of a specific degree of importance for urban and rural consolidation, respectively. The urgency layer is considered as the most important degree for consolidating urban construction land while the characteristic layer is ranked as the first decision degree of rural consolidation. The order of the degree of importance is region-oriented and problem-specific. Specifically, the objectives and methodology of LC are influenced by the specific conditions in different countries and regions, by their historical and more recent political, social and economic development, and also by the topographical conditions. The order of the degree of importance, which can be regarded as the decision option, is not static. Different conditions result in different decision options and a flexible combination of consolidation models. This paper has provided a case study for exemplifying the specific order of consolidating urban and rural construction land in China’s coastal cities. Our results are not the only answer for consolidating urban-rural construction land, but are the befitting solution in accordance with real conditions in every study unit. The methodology of the assessment and the decision-support system suggested in this paper is a type of referable framework for evaluation and consolidation of urban-rural construction land. Special indicators and decision options will be adjusted according to the regional practical situation if used in other regions.
At present, urbanization is an irreversible trend in China. However, sustainable urbanization is still confronted with difficulties [71,72]. Urban-rural LC, which can allocate urban-rural land resources and coordinate urban-rural development, is a profound way to promote sustainable urbanization. Our study is a type of beneficial trial to explore how, by analyzing its inner variation and constructing its outer model in order to offer guidance on local land use and urbanization. A more comprehensive analysis, i.e., combined with ecosystem services and scenario analysis from a macro to micro scale, is needed to make a contribution to sustainable urbanization in future studies.

Acknowledgments

This work was supported by Major Program of National Natural Science Foundation of China (Grant No. 41230751), the National Key Technology Research and Development Program (Grant No. 2012BAC01B01) and the National Science Foundation for Fostering Talents in Basic Research of the National (Grant No. J110340). We would especially like to thank Nantong Bureau of Land Resources for the support of our research and the 2014 Asia Global Land Project Conference for the recommendation of the abstract.

Author Contributions

Fangfang Cai and Lijie Pu designed the research. Fangfang Cai and Ming Zhu performed research and analyzed the data; Fangfang Cai wrote the paper. All authors read and approved the final manuscript.

Conflicts of Interest

The authors declare no conflict of interest.

References

  1. Lin, G.C.S. Reproducing Spaces of Chinese Urbanisation: New City-based and Land-centred Urban Transformation. Urban Stud. 2007, 44, 1827–1855. [Google Scholar]
  2. Liu, Y.; Fang, F.; Li, Y. Key issues of land use in China and implications for policy making. Land Use Policy 2014, 40, 6–12. [Google Scholar] [CrossRef]
  3. Ho, S.P.S.; Lin, G.C.S. Converting Land to Nonagricultural Use in China’s Coastal Provinces: Evidence from Jiangsu. Mod. China 2004, 30, 81–112. [Google Scholar] [CrossRef]
  4. Liu, J.; Zhan, J.; Deng, X. Spatio-temporal Patterns and Driving Forces of Urban Land Expansion in China during the Economic Reform Era. AMBIO 2005, 34, 450–455. [Google Scholar] [PubMed]
  5. Bai, X.; Shi, P.; Liu, Y. Society: Realizing China’s urban dream. Nature 2014, 509, 158–160. [Google Scholar] [CrossRef] [PubMed]
  6. Antrop, M.; van Eetvelde, V. Holistic aspects of suburban landscapes: Visual image interpretation and landscape metrics. Landsc. Urban Plan. 2000, 50, 43–58. [Google Scholar] [CrossRef]
  7. Theobald, D.M. Land-use dynamics beyond the American urban fringe. Geogr. Rev. 2001, 91, 544–564. [Google Scholar] [CrossRef]
  8. Díaz-Palacios-Sisternes, S.; Ayuga, F.; García, A.I. A method for detecting and describing land use transformations: An examination of Madrid’s southern urban-rural gradient between 1990 and 2006. Cities 2014, 40, 99–110. [Google Scholar] [CrossRef]
  9. Salvati, L. Agro-forest landscape and the “fringe” city: A multivariate assessment of land-use changes in a sprawling region and implications for planning. Sci. Total Environ. 2014, 490, 715–723. [Google Scholar] [CrossRef] [PubMed]
  10. Long, H.; Tang, G.; Li, X.; Heilig, G.K. Socio-economic driving forces of land-use change in Kunshan, the Yangtze River Delta economic area of China. J. Environ. Manag. 2007, 83, 351–364. [Google Scholar] [CrossRef]
  11. Xu, X.; Li, S. China’s open door policy and urbanization in the Pearl River Delta region. Int. J. Urban Reg. Res. 1990, 14, 49–69. [Google Scholar] [CrossRef]
  12. Tian, G.; Jiang, J.; Yang, Z.; Zhang, Y. The urban growth, size distribution and spatio-temporal dynamic pattern of the Yangtze River Delta megalopolitan region, China. Ecol. Model. 2011, 222, 865–878. [Google Scholar] [CrossRef]
  13. Shen, J.; Wong, K.-Y.; Feng, Z. State-Sponsored and Spontaneous Urbanization in the Pearl River Delta of South China, 1980–1998. Urban Geogr. 2002, 23, 674–694. [Google Scholar] [CrossRef]
  14. Gar-On Yeh, A.; Li, X.I.A. Economic Development and Agricultural Land Loss in the Pearl River Delta, China. Habitat Int. 1999, 23, 373–390. [Google Scholar] [CrossRef]
  15. Lin, G.C.S.; Yi, F. Urbanization of Capital or Capitalization on Urban Land? Land Development and Local Public Finance in Urbanizing China. Urban Geogr. 2011, 32, 50–79. [Google Scholar] [CrossRef]
  16. Zhang, X.Q. Urban land reform in China. Land Use Pol. 1997, 14, 187–199. [Google Scholar] [CrossRef]
  17. Cheng, J.; Masser, I. Urban growth pattern modeling: A case study of Wuhan city, PR China. Landsc. Urban Plan. 2003, 62, 199–217. [Google Scholar] [CrossRef]
  18. Wong, S.-W.; Tang, B.-S. Challenges to the sustainability of “development zones”: A case study of Guangzhou Development District, China. Cities 2005, 22, 303–316. [Google Scholar] [CrossRef]
  19. Liu, Y. Rural transformation development and new countryside construcion in eastern coastal area of China. Acta Geogr. Sin. 2007, 62, 563–570. [Google Scholar]
  20. Liu, Y.; Liu, Y.; Chen, Y.; Long, H. The process and driving forces of rural hollowing in China under rapid urbanization. J. Geogr. Sci. 2010, 20, 876–888. [Google Scholar] [CrossRef]
  21. Long, H.; Li, Y.; Liu, Y.; Woods, M.; Zou, J. Accelerated restructuring in rural China fueled by “increasing vs. decreasing balance” land-use policy for dealing with hollowed villages. Land Use Pol. 2012, 29, 11–22. [Google Scholar] [CrossRef]
  22. Liu, Y. Farmers Should Benefit from Rural Construction Land Consolidation (Nongcun Tudi Zhengzhi Yao Ran Nongmin Shouyi). The People's Daily (Renmin Ribao) 2010, A13. (In Chinese) [Google Scholar]
  23. Sorensen, A. Land readjustment and metropolitan growth: An examination of suburban land development and urban sprawl in the Tokyo metropolitan area. Prog. Plan. 2000, 53, 217–330. [Google Scholar] [CrossRef]
  24. Vitikainen, A. An overview of land consolidation in Europe. Nord. J. Surv. Real Estate Res. 2014, 1, 25–44. [Google Scholar]
  25. Backman, M.; Österberg, T. Land Consolidation in Sweden. In Proceedings of the Symposium on Modern Land Consolidation, Clermond-Ferrand, France, 10–11 September 2004; International Federation of Surveyors: Frederiksberg, Denmark, 2004; pp. 10–11. [Google Scholar]
  26. Meer, P.V. Land Consolidation through Land Fragmentation: Case Studies from Taiwan. Land Econ. 1975, 51, 275–283. [Google Scholar] [CrossRef]
  27. Agrawal, P. Urban land consolidation: A review of policy and procedures in Indonesia and other Asian countries. GeoJournal 1999, 49, 311–322. [Google Scholar] [CrossRef]
  28. Pašakarnis, G.; Maliene, V. Towards sustainable rural development in Central and Eastern Europe: Applying land consolidation. Land Use Policy 2010, 27, 545–549. [Google Scholar] [CrossRef]
  29. Aslan, S.T.; Gundogdu, K.S.; Arici, I. Some metric indices for the assessment of land consolidation projects. Pak. J. Biol. Sci. 2007, 10, 1390–1397. [Google Scholar] [CrossRef] [PubMed]
  30. Bonfanti, P.; Fregonese, A.; Sigura, M. Landscape analysis in areas affected by land consolidation. Landsc. Urban Plan. 1997, 37, 91–98. [Google Scholar] [CrossRef]
  31. Sklenicka, P. Applying evaluation criteria for the land consolidation effect to three contrasting study areas in the Czech Republic. Land Use Pol. 2006, 23, 502–510. [Google Scholar] [CrossRef]
  32. Crecente, R.; Alvarez, C.; Fra, U. Economic, social and environmental impact of land consolidation in Galicia. Land Use Pol. 2002, 19, 135–147. [Google Scholar] [CrossRef]
  33. Jeong, J.S.; García-Moruno, L.; Hernández-Blanco, J. A site planning approach for rural buildings into a landscape using a spatial multi-criteria decision analysis methodology. Land Use Pol. 2013, 32, 108–118. [Google Scholar] [CrossRef]
  34. Demetriou, D.; Stillwell, J.; See, L. An integrated planning and decision support system (IPDSS) for land consolidation: Theoretical framework and application of the land-redistribution modules. Environ. Plann. Plann. Des. 2012, 39, 609–628. [Google Scholar] [CrossRef]
  35. Demetriou, D.; Stillwell, J.; See, L. Land consolidation in Cyprus: Why is an integrated planning and decision support system required? Land Use Pol. 2012, 29, 131–142. [Google Scholar] [CrossRef]
  36. Dou, J.; Chen, Y.; Jiang, Y.; Wang, Y.; Li, D.; Zhang, F. A web-GIS based support system for rural land consolidation in China. N. Zeal. J. Agric. Res. 2007, 50, 1195–1203. [Google Scholar] [CrossRef]
  37. King, R.; Burton, S. Land fragmentation: Notes on a fundamental rural spatial problem. Prog. Hum. Geogr. 1982, 6, 475–494. [Google Scholar] [CrossRef]
  38. Tan, S.; Heerink, N.; Qu, F. Land fragmentation and its driving forces in China. Land Use Pol. 2006, 23, 272–285. [Google Scholar] [CrossRef]
  39. Nagendra, H.; Munroe, D.K.; Southworth, J. From pattern to process: Landscape fragmentation and the analysis of land use/land cover change. Agric. Ecosyst. Environ. 2004, 101, 111–115. [Google Scholar] [CrossRef]
  40. Forman, R.T. Land Mosaics: The Ecology of Landscapes and Regions; Cambridge University Press: Cambridge, UK, 1995. [Google Scholar]
  41. Irwin, E.G.; Bockstael, N.E. The evolution of urban sprawl: evidence of spatial heterogeneity and increasing land fragmentation. Proc. Natl. Acad. Sci. USA 2007, 104, 20672–20677. [Google Scholar] [CrossRef] [PubMed]
  42. Lindenmayer, D.B.; Fischer, J. Habitat Fragmentation and Landscape Change: An Ecological and Conservation Synthesis; Island Press: Washington, DC, USA, 2006. [Google Scholar]
  43. Jaeger, J.A. Landscape division, splitting index, and effective mesh size: New measures of landscape fragmentation. Landsc. Ecol. 2000, 15, 115–130. [Google Scholar] [CrossRef]
  44. Hargis, C.D.; Bissonette, J.A.; David, J.L. The behavior of landscape metrics commonly used in the study of habitat fragmentation. Landsc. Ecol. 1998, 13, 167–186. [Google Scholar] [CrossRef]
  45. Aguilera, F.; Valenzuela, L.M.; Botequilha-Leitão, A. Landscape metrics in the analysis of urban land use patterns: A case study in a Spanish metropolitan area. Landsc. Urban Plan. 2011, 99, 226–238. [Google Scholar] [CrossRef]
  46. McGarigal, K.; Cushman, S.; Ene, E. FRAGSTATS: Spatial Pattern Analysis Program for Categorical and Continuous Maps. Available online: http://www.umass.edu/landeco/research/fragstats/fragstats.html (accessed on 28 December 2012).
  47. Long, H.; Liu, Y.; Li, X.; Chen, Y. Building new countryside in China: A geographical perspective. Land Use Pol. 2010, 27, 457–470. [Google Scholar] [CrossRef]
  48. Siciliano, G. Urbanization strategies, rural development and land use changes in China: A multiple-level integrated assessment. Land Use Pol. 2012, 29, 165–178. [Google Scholar] [CrossRef]
  49. Long, H.; Zou, J.; Pykett, J.; Li, Y. Analysis of rural transformation development in China since the turn of the new millennium. Appl. Geogr. 2011, 31, 1094–1105. [Google Scholar] [CrossRef]
  50. Vehmas, J.; Kaivo-oja, J.; Luukkanen, J. Global Trends of Linking Environmental Stress and Economic Growth; Finland Futures Research Centre: Turku, Finland, 2003; pp. 6–9. [Google Scholar]
  51. Organisation for Economic Co-operation and Development (OECD). Indicators to measure decoupling of environmental pressure from economic growth. In OECD Environmental Strategy: 2004 Review of Progress; OECD Publishing: Paris, France, 2004. [Google Scholar]
  52. Li, Y.; Liu, Y.; Long, H. Spatio-temporal analysis of population and residential land change in rural China. J. Nat. Resour. 2010, 25, 1629–1638. (In Chinese) [Google Scholar]
  53. Tan, M.; Li, X. Characteristics of Urban Land Per Capita of Major Countries in the World and Its Implications for China. J. Natl. Resour. 2010, 25, 1813–1822. (In Chinese) [Google Scholar]
  54. Song, W.; Chen, B.; Chen, X. Theoretical and empirical analysis of potential calculation model for rural habitat consolidation. Trans. Chin. Soc. Agric. Eng. 2008, 24, 1–5. (In Chinese) [Google Scholar]
  55. Song, W.; Chen, B.; Jiang, G. Reseaech on land consolidation potential of rural habitat in China: Review and preview. Econ. Geogr. 2010, 11, 1871–1877. (In Chinese) [Google Scholar]
  56. He, Y.; Chen, Y.; Yao, Y.; Wei, N.; Xu, X.; Tang, P.; Yu, Q. Commentary on Study Methodology of Rural Residential Land Consolidation Potential. Geogr. Geo-Inf. Sci. 2008, 24, 80–83. (In Chinese) [Google Scholar]
  57. Shi, S.; Zhang, X. Current Situation Analysis and Land Reconsolidation Potential Calculation of Rural Residential Areas in Jiangsu Province. China Land Sci. 2009, 23, 52–58. (In Chinese) [Google Scholar] [CrossRef]
  58. Li, X.; Zhang, J.; Zheng, W.; Tang, C.; Miao, Z.; Liu, K. Calculation and analysis of land consolidation potential in rural habitat during rapid urbanization process in China. Trans. China Soc. Agric. Eng. 2004, 20, 276–279. (In Chinese) [Google Scholar]
  59. Yu, G.; Feng, J.; Che, Y.; Lin, X.; Hu, L.; Yang, S. The identification and assessment of ecological risks for land consolidation based on the anticipation of ecosystem stabilization: A case study in Hubei Province, China. Land Use Pol. 2010, 27, 293–303. [Google Scholar] [CrossRef]
  60. Lin, K.L. Determining key ecological indicators for urban land consolidation. Int. J. Strateg. Prop. Manag. 2010, 14, 89–103. [Google Scholar] [CrossRef]
  61. Shannon, C. A Mathematical Theory of Communication. Bell Syst. Tech. J. 1948, 27, 379–423. [Google Scholar] [CrossRef]
  62. Kapur, J.N. Maximum-Entropy Models in Science and Engineering; John Wiley & Sons: New Delhi, India, 1989. [Google Scholar]
  63. Liu, H.; Chen, W.; Sudjianto, A. Relative entropy based method for probabilistic sensitivity analysis in engineering design. J. Mech. Des. 2006, 128, 326–336. [Google Scholar] [CrossRef]
  64. Robinson, S.; Cattaneo, A.; El-Said, M. Updating and estimating a social accounting matrix using cross entropy methods. Econ. Syst. Res. 2001, 13, 47–64. [Google Scholar] [CrossRef]
  65. Yeh, A.-O. Measurement and Monitoring of Urban Sprawl in a Rapidly Growing Region Using Entropy. Photogramm. Eng. Remote Sens. 2001, 67, 83–90. [Google Scholar]
  66. Zellner, A. Bayesian Methods and Entropy in Economics and Econometrics; Springer Netherlands: Rotterdam, The Netherlands, 1991. [Google Scholar]
  67. Guo, X. Application of Improved Entropy Method in Evaluation of Economic Result. Syst. Eng.-Theory Pract. 1998, 12, 98–102. (In Chinese) [Google Scholar]
  68. Zou, Z.-H.; Yun, Y.; Sun, J.-N. Entropy method for determination of weight of evaluating indicators in fuzzy synthetic evaluation for water quality assessment. J. Environ. Sci. 2006, 18, 1020–1023. [Google Scholar] [CrossRef]
  69. Guo, C. A study of the methods for evaluating the entropy weight coefficient of the investment value of stocks. Nankai Econ. Stud. 2001, 5, 65–67. (In Chinese) [Google Scholar]
  70. Environmental Systems Research Institute (ESRI). ArcGIS Desktop: Release 10; Environmental Systems Research Institute: Redlands, CA, USA, 2011. [Google Scholar]
  71. Enserink, B.; Koppenjan, J. Public participation in China: Sustainable urbanization and governance. Manag. Environ. Qual. 2007, 18, 459–474. [Google Scholar] [CrossRef]
  72. Shen, L.; Peng, Y.; Zhang, X.; Wu, Y. An alternative model for evaluating sustainable urbanization. Cities 2012, 29, 32–39. [Google Scholar] [CrossRef]

Appendix A. The Weighting and Calculating Process of Indices in the Assessment Framework

The entropy method was adopted to assign the weights of the indices in the assessment framework. The main processes are as follows:
(1)
Data normalization
Suppose there are evaluating indicators in each-sub layer counted n, evaluating study units counted m, and then forms original indicators value X = {χij}, (i = 1…n, j = 1…m). Before putting these data into calculation, the input must be normalized to minimize redundancy and dependency. Normalization can be performed as follows, to which the positive indicators with “+”, there are
Sustainability 06 07689 i006
while, the negative indicators with “−”, there are
Sustainability 06 07689 i007
where, Sustainability 06 07689 i008 is the normalized data of study unit j on the indicator i, and Sustainability 06 07689 i008 ∈ [0,1] ; χij is the original data; χj min and χj max are the minimum and maximum value among χij, respectively.
(2)
Definition of the entropy
The entropy of the ith indicator is calculated as follows:
ej = -kPij lnPij
in which Sustainability 06 07689 i009, k = 1/ln n.
(3)
Definition of the entropy weight
The entropy weight wi of indicator i can be defined as:
Sustainability 06 07689 i010
in which 0 ≤ wi ≤ 1, Sustainability 06 07689 i011
(4)
Calculation of the assessment result
The assessment result Sij of the study unit j on the indicator i can be calculated as follows:
Sustainability 06 07689 i012
The assessment results of urban and rural construction land are shown in Table 4 and Table 6, respectively.

