Article

Sustainable Production of Bio-Combustibles from Pyrolysis of Agro-Industrial Wastes

1
Facoltà di Ingegneria e Architettura, Università degli Studi di Enna "Kore", Cittadella Universitaria, Enna 94100, Italy
2
Siciliacque S.p.A., Via Gioacchino di Marzo, Palermo 90144, Italy
*
Author to whom correspondence should be addressed.
Sustainability 2014, 6(11), 7866-7882; https://0-doi-org.brum.beds.ac.uk/10.3390/su6117866
Submission received: 26 September 2014 / Revised: 27 October 2014 / Accepted: 3 November 2014 / Published: 6 November 2014

Abstract

:
Evaluation of the sustainability of biomass pyrolysis requires a thorough assessment of the product yields and energy densities. With this purpose, a laboratory scale fixed bed reactor (FBR) was adapted from the standard Gray-King (GK) assay test on coal to conduct fixed bed pyrolysis experiments on agricultural and agro-industrial by-products. The present study provides results on the pyrolysis of two types of biomass: chipped olive tree trimmings (OT) and olive pomace (OP). Solid (char) and liquid (tar) product yields are reported. Mass yields are determined and compared with values obtained in similar works. Results indicate that char yield decreases from 49% (OT-db) and 50% (OP-db) at 325 °C to 26% (OT db) and 30% (OP-db) at 650 °C. Tar yield is almost constant (42%) at different reaction temperatures for OT, while it decreases slightly from 42% to 35% for OP. Energy density of the products at different peak temperatures is almost constant for OT (1.2), but slightly increases for OP (from a value of 1.3 to a value of 1.4).

1. Introduction

Nowadays fossil fuels are still the world’s main energy sources; however, their environmental impact [1] and their increasing cost has lead scientists to investigate more environmentally friendly technologies to foster sustainability of their use at larger scales. In addition, due to political unrest in the world, diversification of energy sources is needed [2,3,4,5].
It is well accepted that agriculture can contribute to the increase of renewable energy production [6,7,8,9] and thus reduce fossil fuel dependency and production of pollutants [10].
The European Community Biomass Action Plan of 2005 [11] describes biomass as a possible source to ensure the security of energy supply; however, its use must not result in an additional form of environmental degradation. The Convention on Climate Change of the EU of 2005 defines biomass as a non-fossilised and biodegradable material that originated from animals, plants and microorganisms.
Biomass could originate from energy crops or from residues of agricultural and agro-industrial activities. Biomasses originating from energy crops are often criticised as non-sustainable, since they are deemed responsible for the depletion of the soil of principal nutrients and competing with food crops [12,13,14]. The use of agro-industrial residues as a fuel does not imply such a “side-effect”, as agro-industrial firms produce wastes that could be used as low-cost low impact fuel [15]. Sicilian olive oil industry wastes are a good example of biomass that could be used for energy production [16]. A potentially low cost biomass, that, when used in virtual cycles, could help to find solutions to the final disposal of products that currently constitute a hazardous waste [17,18].
However, the use of olive waste as a biofuel is not free from drawbacks which should be taken into due consideration, e.g., the elevated perishability, the seasonality, the inhomogeneity, the relatively low energy content [16] and the high distribution of the feedstock throughout the territories [19]. Thus, much effort should be dedicated to investigate the prospected technology for energy conversion.
In a recently published study, Jahirul et al. [20] pointed out some of the principal aspects of pyrolysis and gasification of biomass, highlighting the strengths of the technology, with particular regards to the higher prospected electrical energy efficiency (when compared to the classical combustion technology), hence the lower consumption of feedstock and the potential application of the technology in micro-cogeneration units, more adapted to the scattered distribution of feedstock throughout the territories.
Pyrolysis is a thermochemical process through which feedstock is exposed to high temperatures (up to 800 °C) in total absence of an oxydating agent. The technology is useful to convert the “low-quality” fuel into a higher quality one. During pyrolysis, the feedstock volatise leaving a solid combustible highly carbonised residue known as “char” and a series of low weight and higher weight volatiles, which can in part be condensed into a sticky dark coloured liquid made of heavy hydrocarbons known as “bio-oil”.
Char, bio-oil and gas yields depend mainly on the heating rate, peak temperature and residence time of feedstock in the reaction [11]. Though the technology has been described in literature since the 80’s [21] and has been used since pre-industrial era to produce charcoal [12], many of the details of the process still need to be investigated, especially concerning the biomass bio-oil and char yields and characterization.
These issues have become predominant in current research, as bio-oil and char are more stable, more homogeneous, higher energy content fuels [21], which can be used as feedstock for energy production purposes; yet not enough data are available on olive waste, and aspects of the phenomenon are still to be analysed. Whilst agro-industry is seeking ways to make a viable use of its residues, simple methods for predicting the behaviour of the residues when subjected to thermal processes are not yet available.
For this reason, a horizontal fixed-bed reactor was developed at the laboratory of Environmental and Energy of the University “Kore” of Enna. This system allows researchers to determine the influence of pyrolysis parameters on the product yields, and consequently to determine the variation on energy yields of products. The reactor design was derived from the standard Gray-King (GK) assay test on coal [22]; some other developments are also reported in literature [1,23].
Tar recovery procedure described in literature [24,25,26,27] has been specifically adapted for the newly developed system and is described here in detail.

2. Experimental Section

2.1. System Set-up

A horizontal fixed-bed type reactor, derived from the standard Gray-King assay test on coal, was purposely modified to allow the flow of an inert gas carrier to sweep out the pyrolysis products during reaction. Figure 1 and Figure 2 show respectively a schematic representation of the apparatus and a picture of the assembled system.
Figure 1. Schematic lay-out of the pyrolysis system used in the Laboratory of Energy and Environment (L.E.A.).
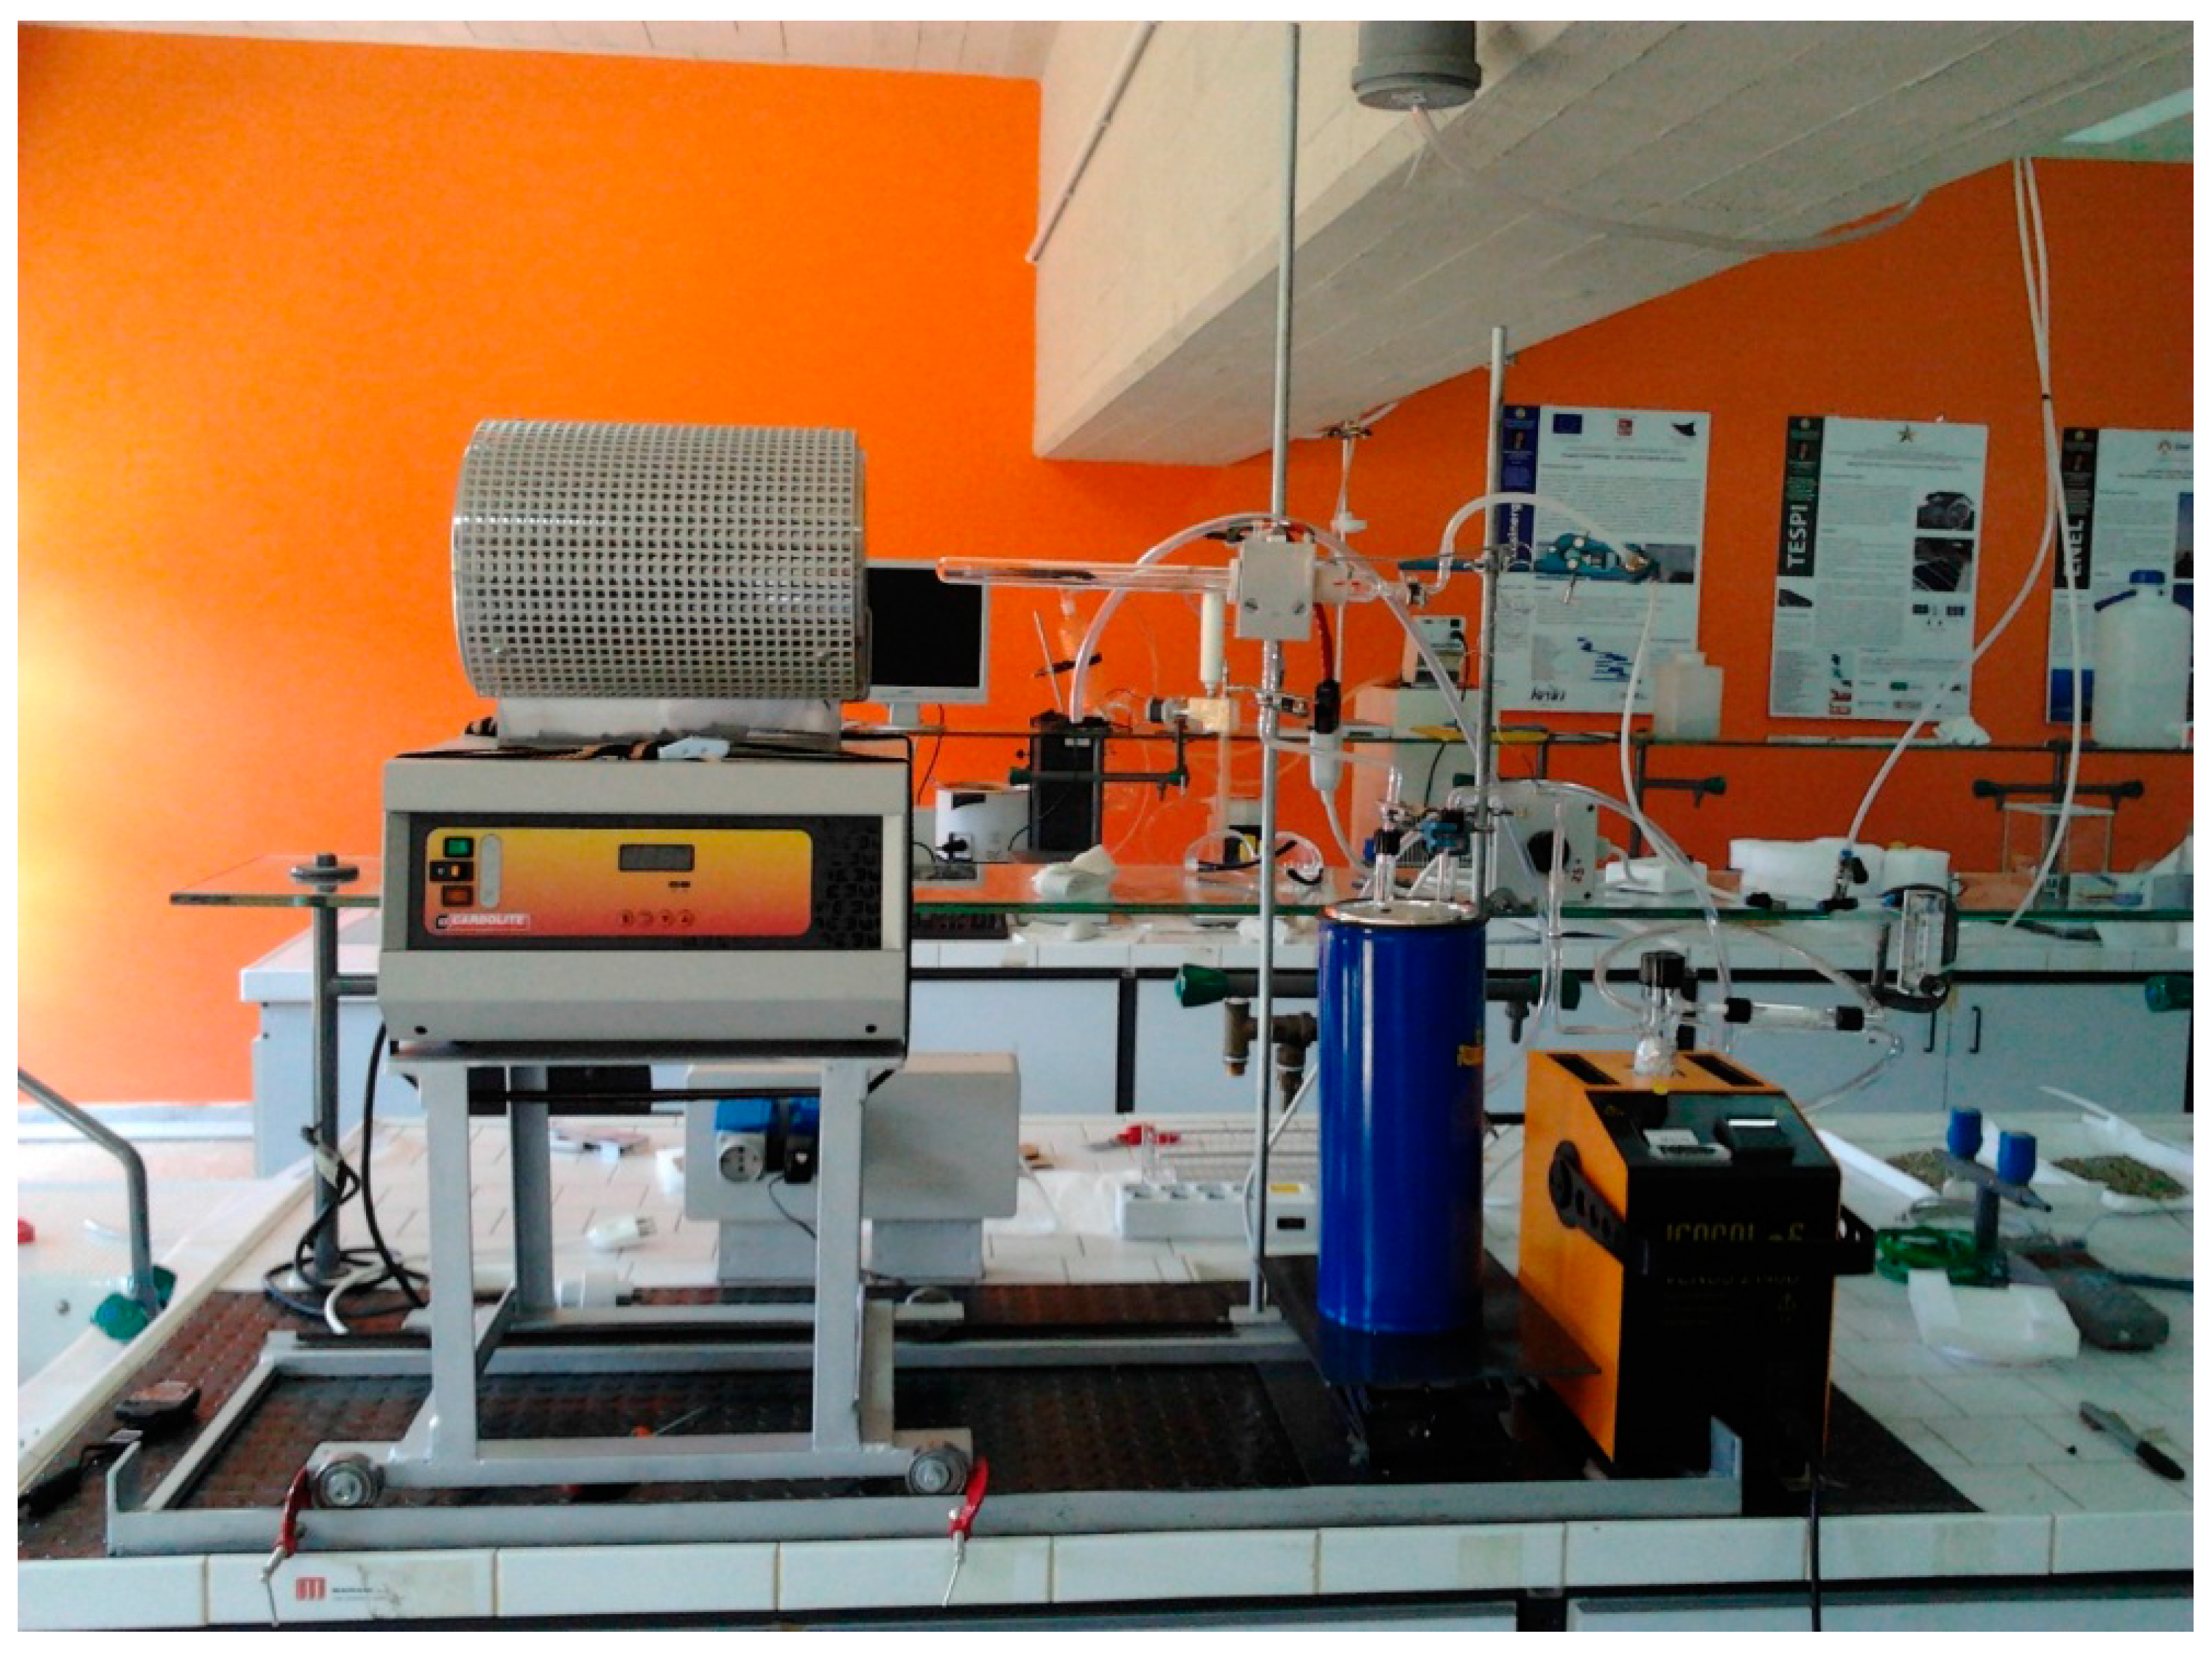
Sustainability 06 07866 g001
Figure 2. Picture of the assembled system as it appears in the laboratory.
Sustainability 06 07866 g002
The system consists of a quartz cylindrical reactor 340 mm long and 20 mm internal diameter closed at one end and provided with a 29/32 mm open end. The reactor body is provided with an 8 mm diameter side-connection to sweep the pyrolysis products away.
A special quartz cap equipped with an 8 mm internal diameter inner tube allows the inert gas flow into the feedstock. The special cap is provided with a RotulexTM fitting for gas inlet and a screw cap to insert a K-type thermocouple. The thermocouple is connected to a data logger to monitor and record the temperature. Reactor design posed several challenges both during design and set up.
Condensation of the bio-oil in the reactor tubes outside the furnace was an issue which could significantly hamper the results. Tars are formed along the reactor through the biomass bed and remain in vapour phase until they leave the hot area and pass through a colder section. This could influence the results in two ways: (1) the repeatability of tar yield could be diminished by the increased complexity in tar recovery; and (2) tar chemical characteristics could change as a repeatable cooling path could not be assured. For this reason, the reactor system (1) is held by a purposely shaped aluminium heating jacket (2) which keeps a constant temperature (approximately 180 °C) in order to prevent premature condensation of bio-oil and ensure that all vapours are condensed in the cooling traps located downstream.
Vapours and gases formed during the reaction exit the reactor through the side arm connected via a RotulexTM joint to a gas pipe line directly connected to two traps.
The first trap is a U-shaped tube (4) immersed in a water/ethylene glycol and dry ice bath which allows it to reach a temperature of −27 °C; the second trap is a glass finger (5) kept at −30 °C by a refrigerating system (6) (Isocal 2140B, Isotech, Colchester, VT, USA).
A glass fiber filter (7) is located downstream of the second trap to avoid the loss of bio-oil which has not condensed in the traps. A water bubbler (8), placed at the end of the system, is used to monitor the correct gas flow into the system. The uncondensed gases are then discharged into an exhaust hood (9).
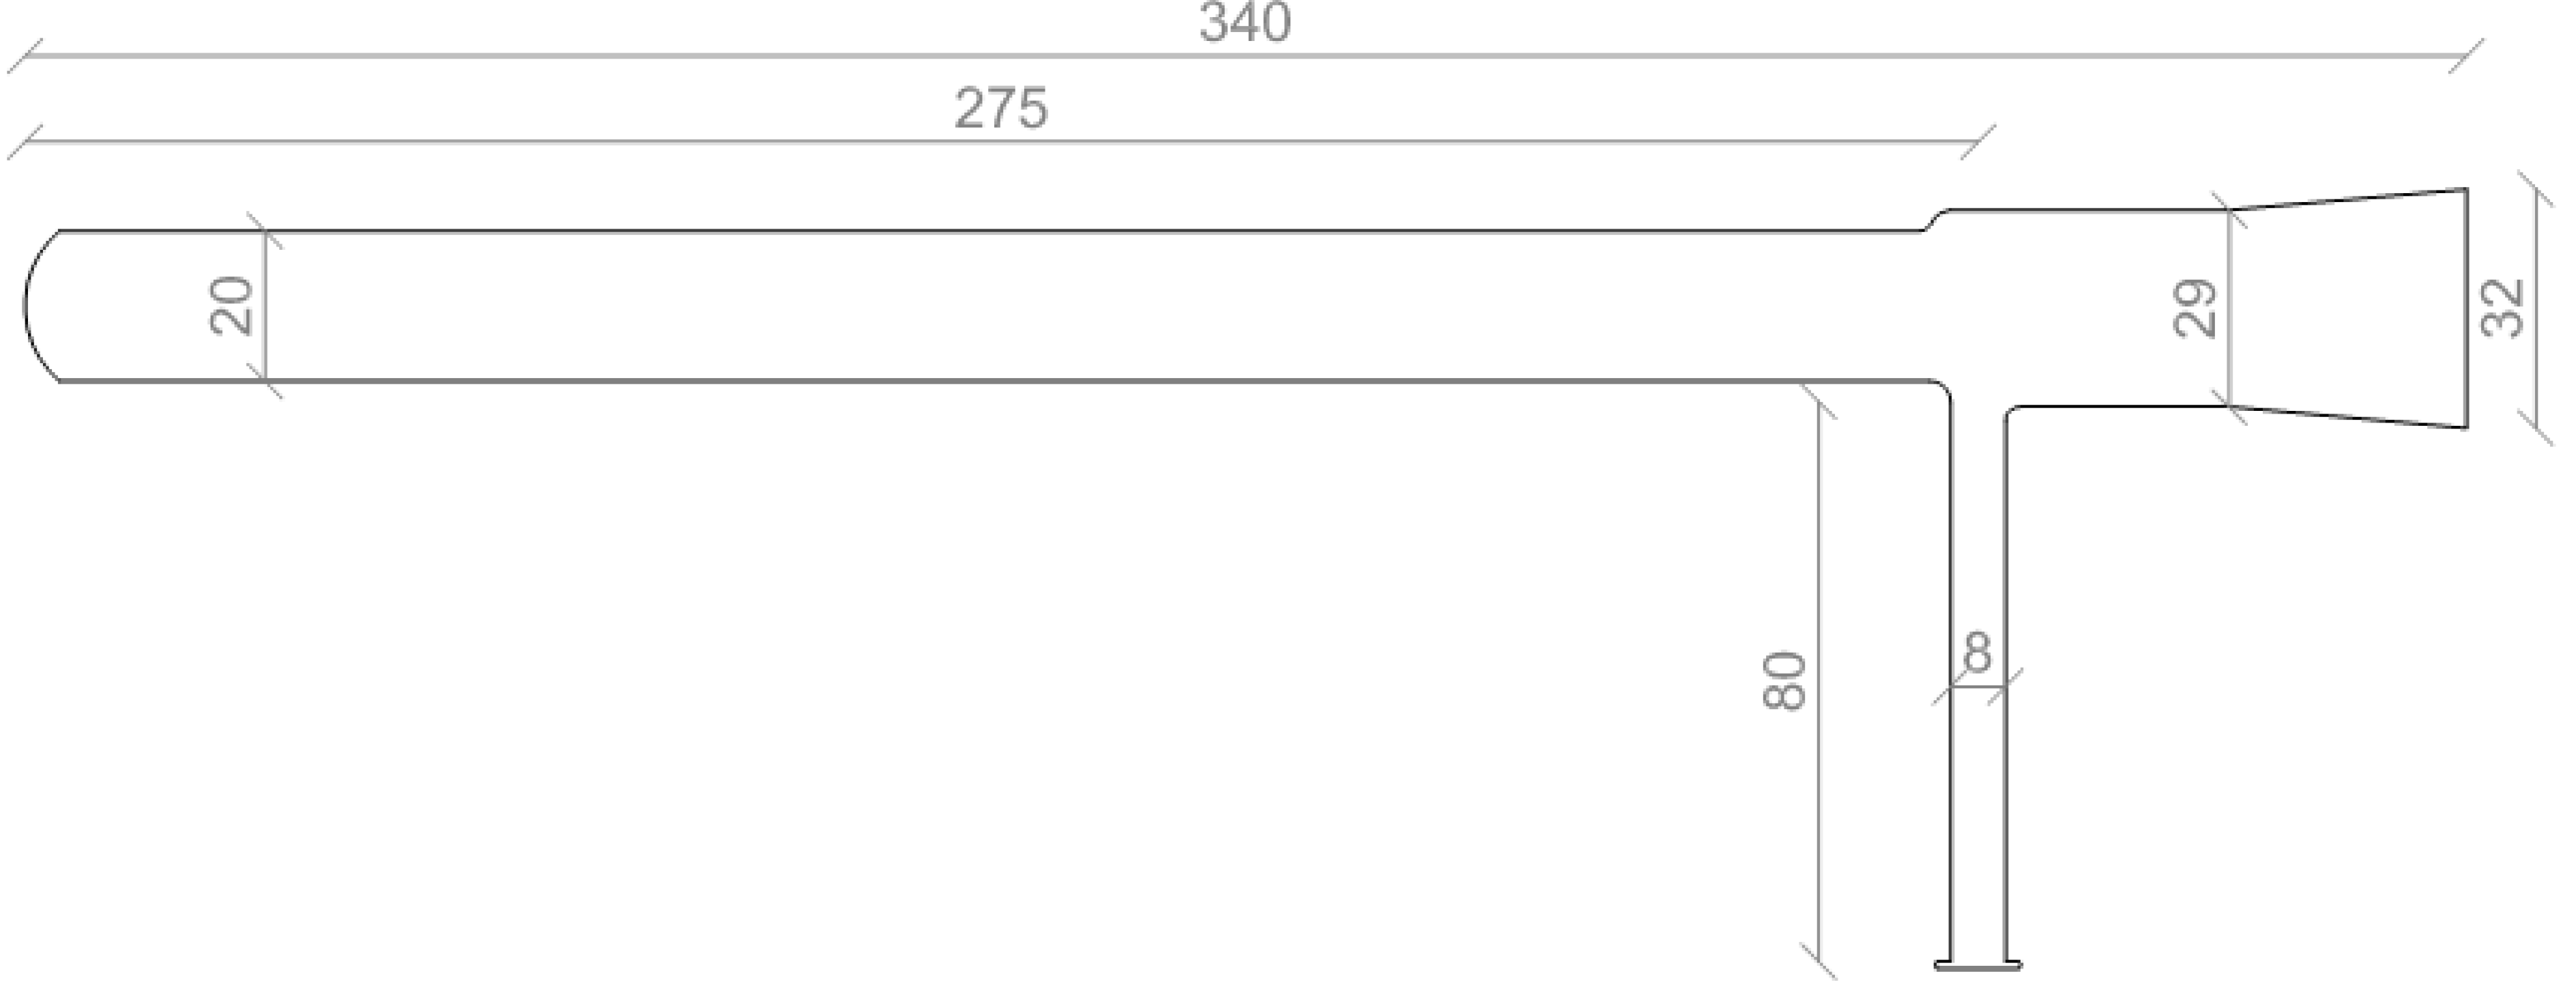
The reactor (see Figure 3) is heated up by an external furnace (Carbolite MTF 12/38/250) (10), that allows it to reach a maximum temperature of 1200 °C. The temperature, the ramp rate, and the residence time are easily set by the control panel of the furnace (11). The furnace is mounted on rails (12) which easily allow it to be slid back and forward, while the reactor is held in place by the heating aluminium jacket.
Figure 3. Quartz reactor body details (dimensions expressed in mm).
Sustainability 06 07866 g003
Another significant challenge was related to the manual operations necessary to conduct the pyrolysis runs. The aim of the design was to set up an “easy to use” system capable of providing industrial operators with quick results with the lowest possible effort.
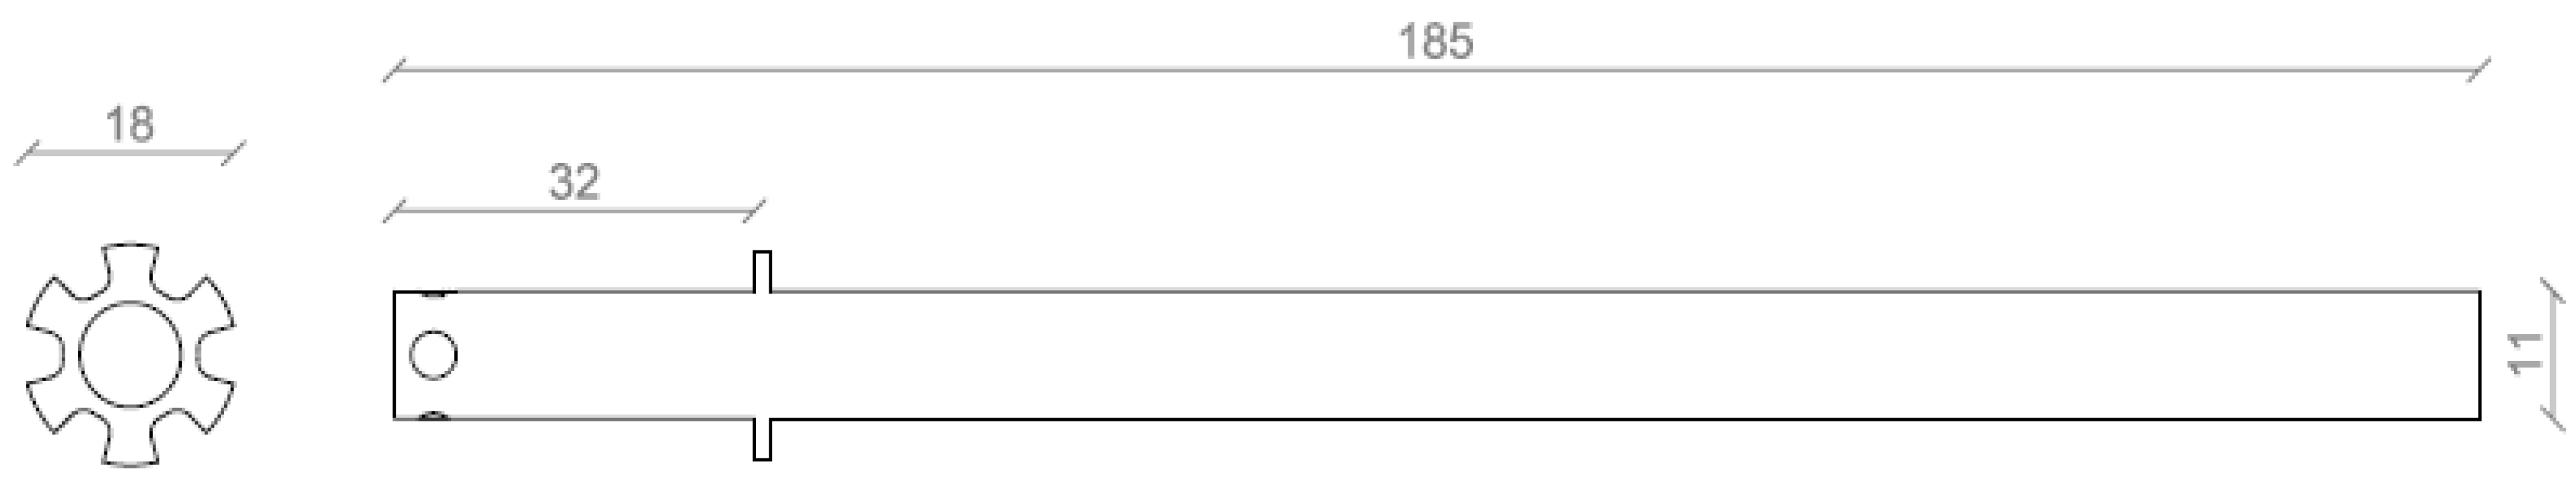
Hence, another important challenge was to design a system that would allow one operator to load the reactor, keep the biomass feedstock at the same position in the reactor (thus minimising temperature gradient along the sample) and at the same time allow the inert gas carrier to sweep out the fumes of pyrolysis, minimizing preferential pathways of the vapours that would lead to non-repeatable data. The challenge was overcome by placing a “sample holder” into the reactor: a cylindrical stainless steel (AISI 316) tube (Figure 4), open at both ends, is located in the reactor in order to easily load the biomass into the reactor, and make the inert gas evenly sweep through it.
The stainless steel feedstock holder is equipped with a purposely made collar which allows the sample to be placed exactly at the same position in the reactor, to avoid differences in temperature profiles during the different tests. This collar is 19 mm diameter and placed at a distance of 40 mm from the end. The collar is also provided with a stainless steel wire mesh to avoid loss of smaller biomass particles.
Figure 4. Stainless steel biomass holder (dimensions expressed in mm).
Sustainability 06 07866 g004
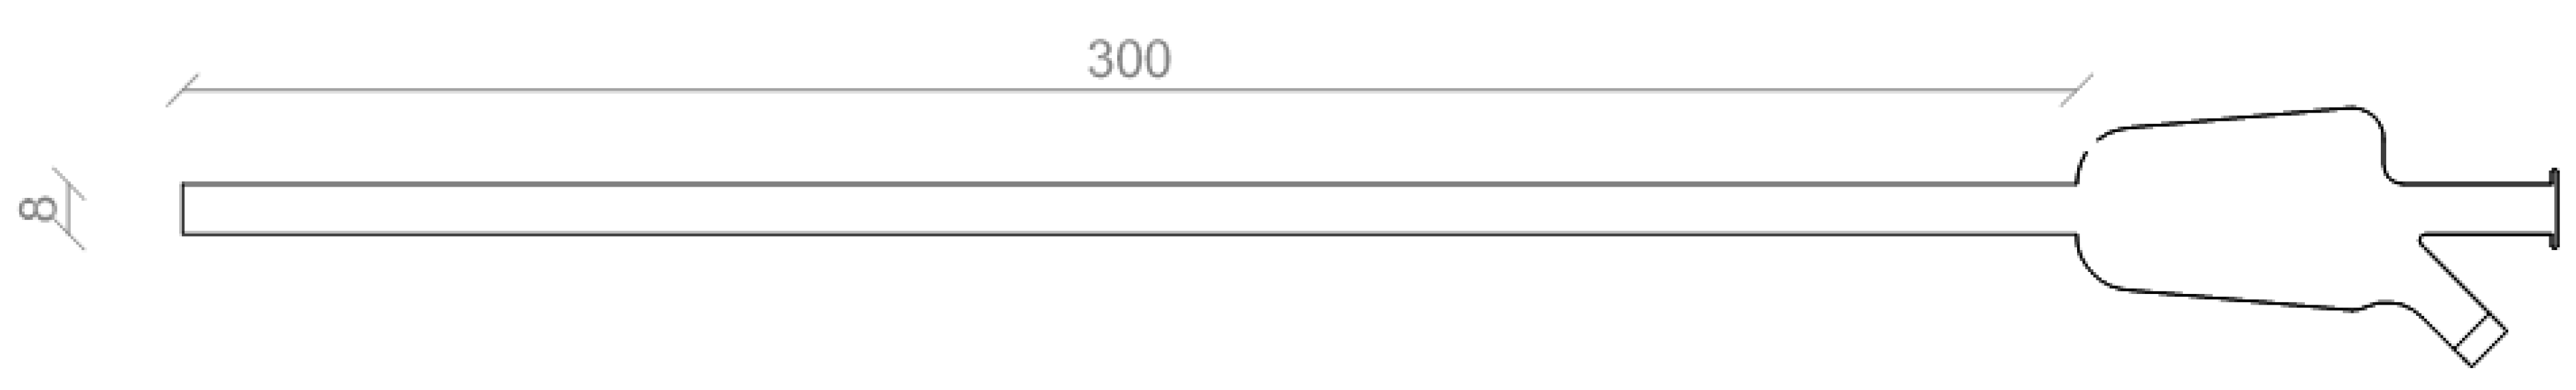
Figure 5 shows a gas carrier quartz inner tube placed inside the main reactor in order to allow the sweep gases to correctly flow throughout the sample. The inner tube is provided with two holes at one end: one is used to connect the gas inlet, while the other is used to place a thermocouple to monitor the temperature of the feedstock during the reaction.
Figure 5. Reactor cap/gas inlet system (dimensions expressed in mm).
Sustainability 06 07866 g005
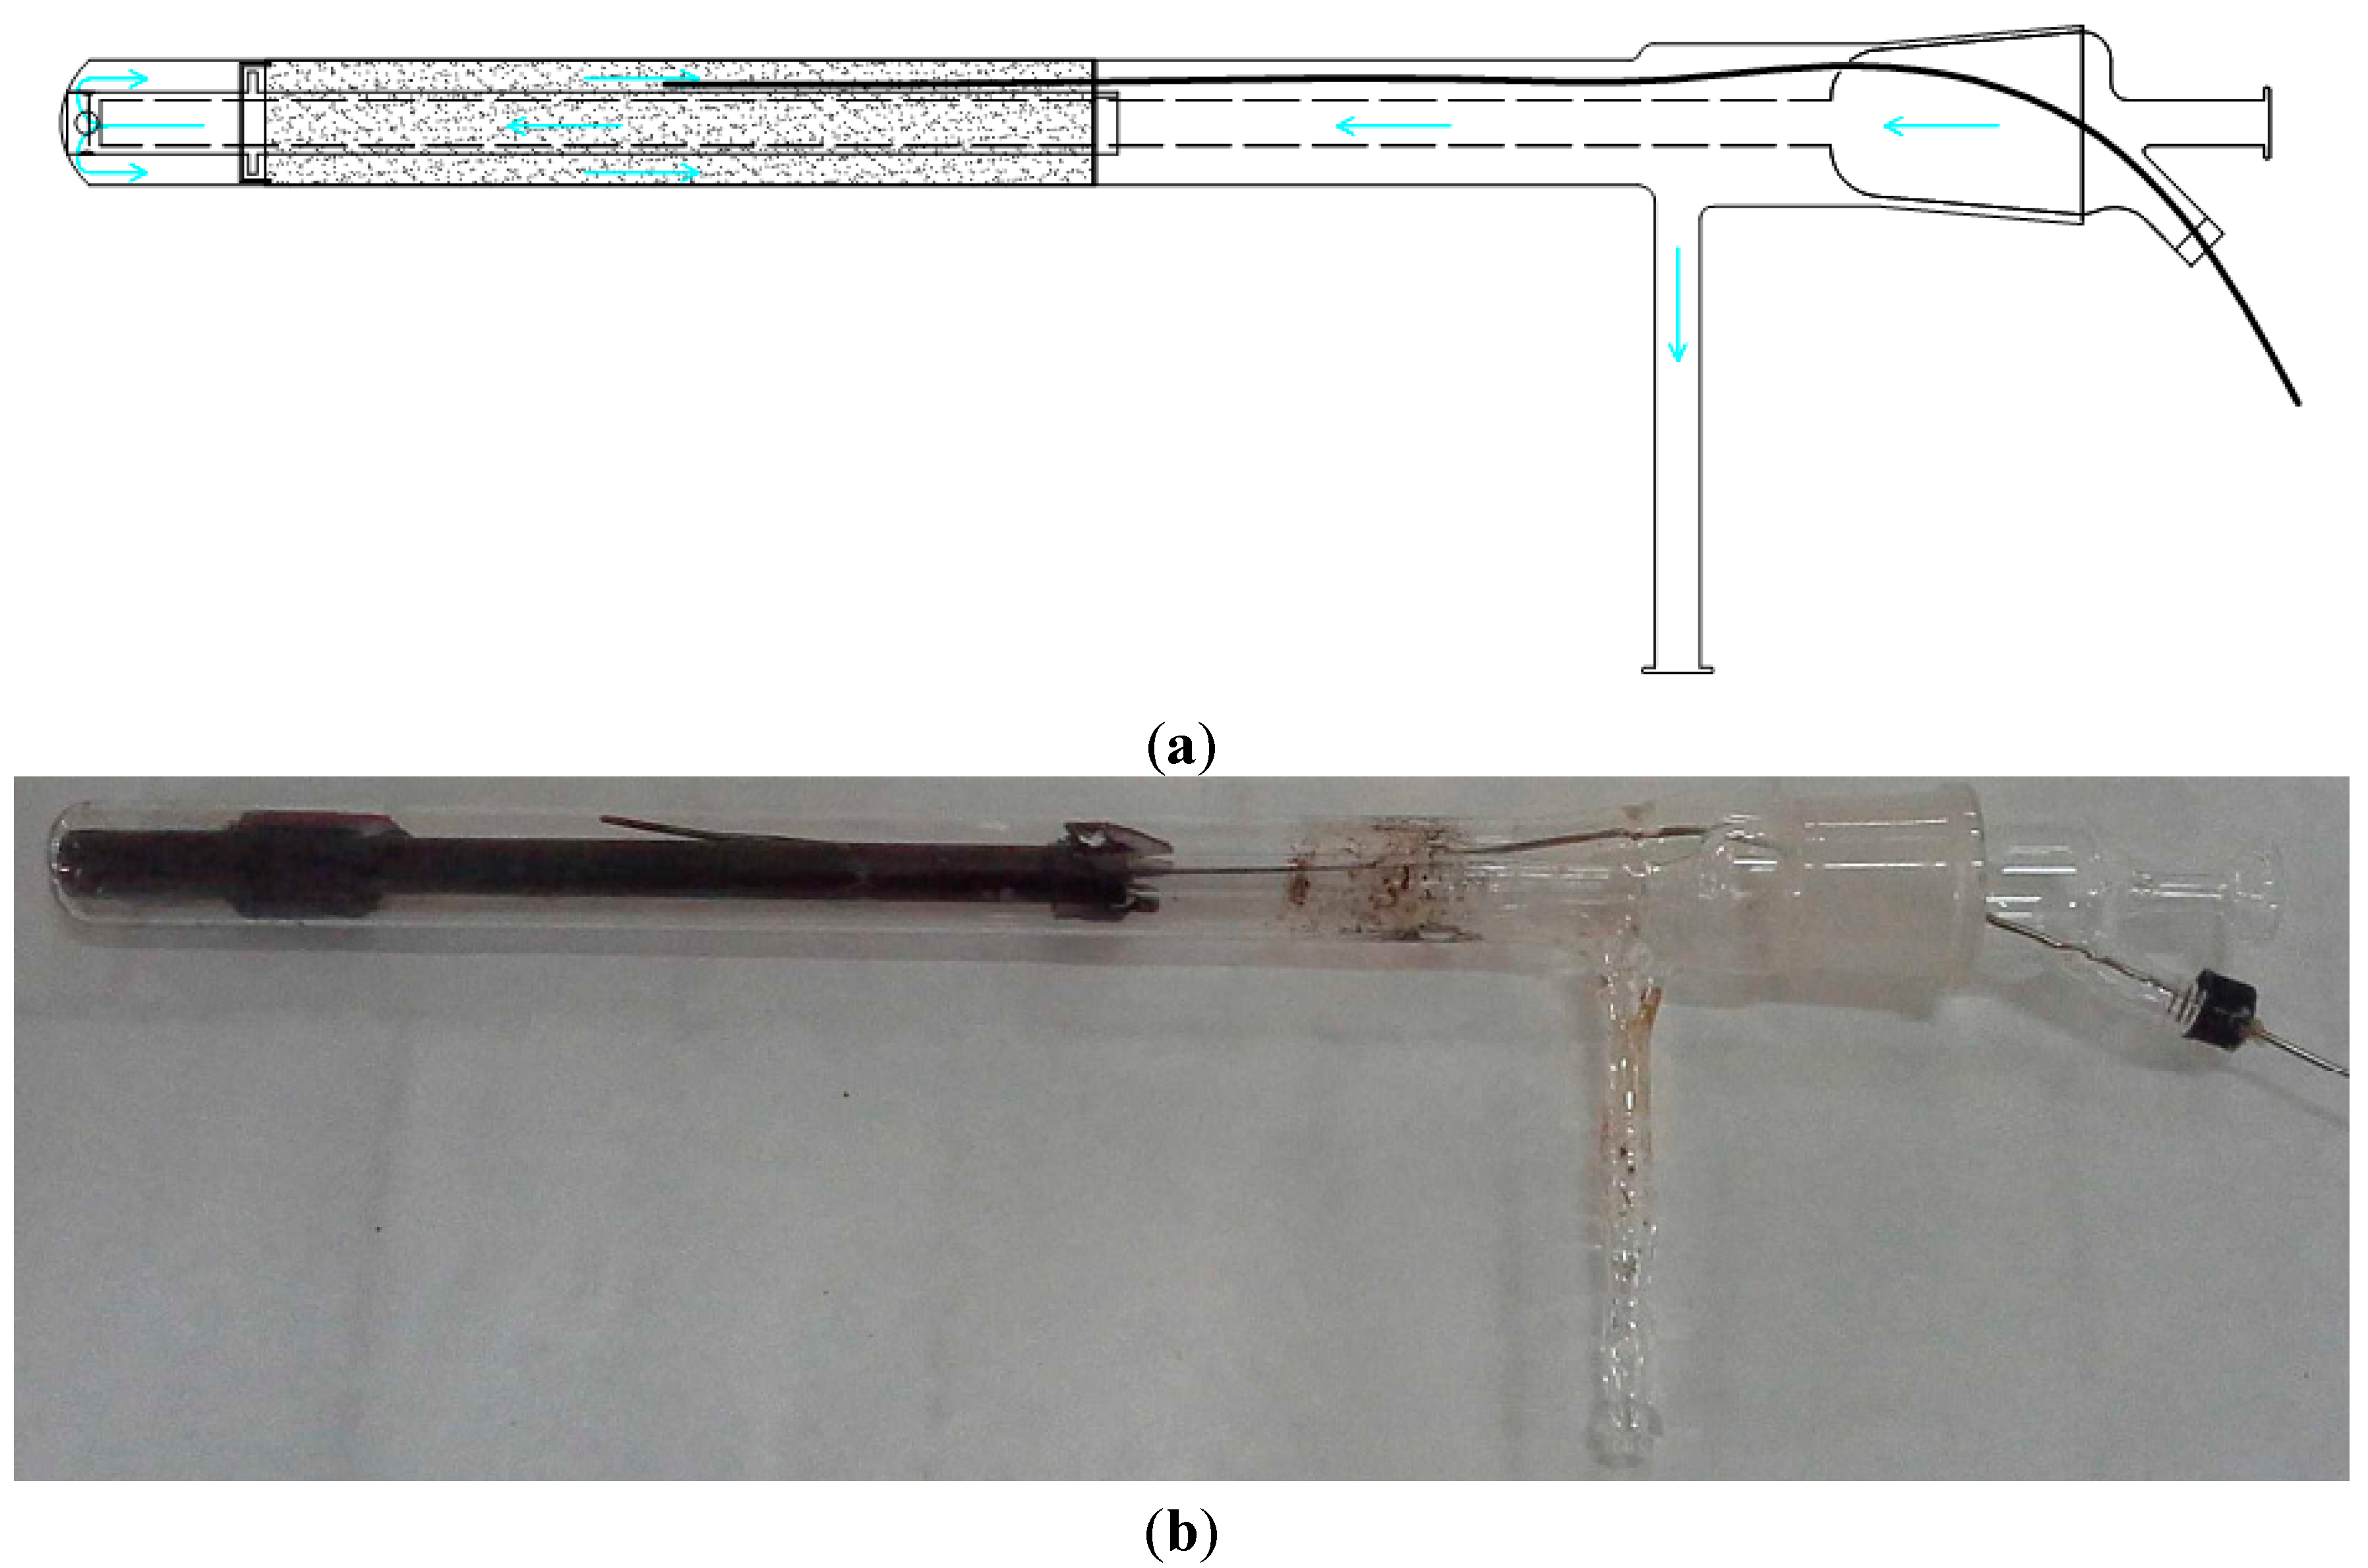
The inner glass tube is purposely shaped to fit in the reactor, while a Teflon gasket ensures the necessary sealing. The two components are held together by means of a metal clip. The assembled reactor is shown in Figure 6.
Figure 6. (a) Schematic view; (b) picture of the assembled reactor.
Sustainability 06 07866 g006
The system significantly simplifies the loading operations into the reactor and allows the inert gas to correctly flow through the sample to sweep any oxidating agent away prior to reaction and all the pyrolysis vapours as they are formed during reaction.

2.2. Test Run

A series of pyrolysis runs have been carried out using different feedstocks in order to test repeatability of results and reliability of the reactor. Olive trimming (OT), Olive pomace (OP).
Helium was used as inert gas carrier flowing at a rate of 1.5 L/min, peak temperatures ranged between 325 °C and 650 °C, heating rate 50 °C/min, gas residence time approximately 3.3 s and reaction holding time at the peak temperature of 30 min (Table 1).
Table 1. Pyrolysis conditions applied to the biomass in the present study. Residence time: 30 min, atmosphere: He.
SamplePyrolysis peak temperature (°C) Heating rate 50 °C/min
OT/OP325
400
500
650

2.2.1. Sample Preparation and Characterization

Olive tree trimmings were collected fresh from 50+ years old trees of the “Moresca” variety in the Enna province during the pruning season, between January and February, while olive pomace, still from the Moresca variety olives, was collected from mill farms of the “two phase decanter” type. After collection, biomass was milled using a knife mill, to a particle size lower than 1 mm, then sieved to select particle size range 425–850 µm portion.
Due to the intrinsic inhomogeneity of the feedstock, particle size range will have an important influence on outcomes of pyrolysis. The milled biomasses are then oven dried for one hour at 105 °C and then left to stabilize at room condition or stored in a desiccator. After the milling and drying procedure both OT and OP show, when left equilibrating at room condition, a stable moisture content between 6% and 8%. Proximate analyses were carried out by a LECO Thermogravimetric Analyser Leco TGA 701; 200–300 mg of solid samples were used to evaluate composition in terms of moisture content (MC), volatile fraction (VF), fixed carbon (FC) and ashes (Ash), using the following methodology:
  • A 20 °C/min ramp to 105 °C in air and hold until weight constancy (<±0.05%) for MC calculation;
  • A 50 °C/min ramp from 105–900 °C, hold time 7 min, in N2 to determine the VF;
  • An isothermal time at 800 °C in reactive environment (air) to determine Ash content.
Ultimate analyses were carried out by an Elementar Macro Vario Cube analyzer for simultaneous CHNS determination. Gross (GVC) and net (NCV) calorific values of raw and treated feedstock were evaluated according to the CEN/TS 14918 standard by means of a LECO AC500 calorimeter (LECO Corporation, St. Joseph, MI, USA).

2.2.2. Experimental Procedure

Approximately 10 g of feedstock was weighted to nearest of 0.0001 g and loaded into the reactor, which was then closed hermetically.
The loaded reactor, fixed to the heating jacket, was connected to the two cold traps and filter, which is connected by rubber tubing to a water bubbler connected to the discharge hose. Helium gas was left to flow at a rate of 1.5 L/min (approximately 3.3 s of gas residence time) into the reactor to purge the system of any air and to sweep out the volatile products during pyrolysis. Pyrolysis temperature, ramp rate (50 °C/min), and residence time (30 min) were set through the controller before each test. The furnace was slid on the rails, and once the reactor was inserted, the programmed experiment started.
At the end of the reaction, the furnace was slid out and the reactor left cooling to room temperature. Char was collected, then the tubes and all other parts washed using a solution of chloroform and methanol in the ratio of 1:4 [22,23,24]. The organic solution was then filtered in pre-weighted Whatman™ n° 4 filter to filter out any remaining char particles. The filtered solution was then evaporated by means of a rotovap to recover the condensed liquid fraction.
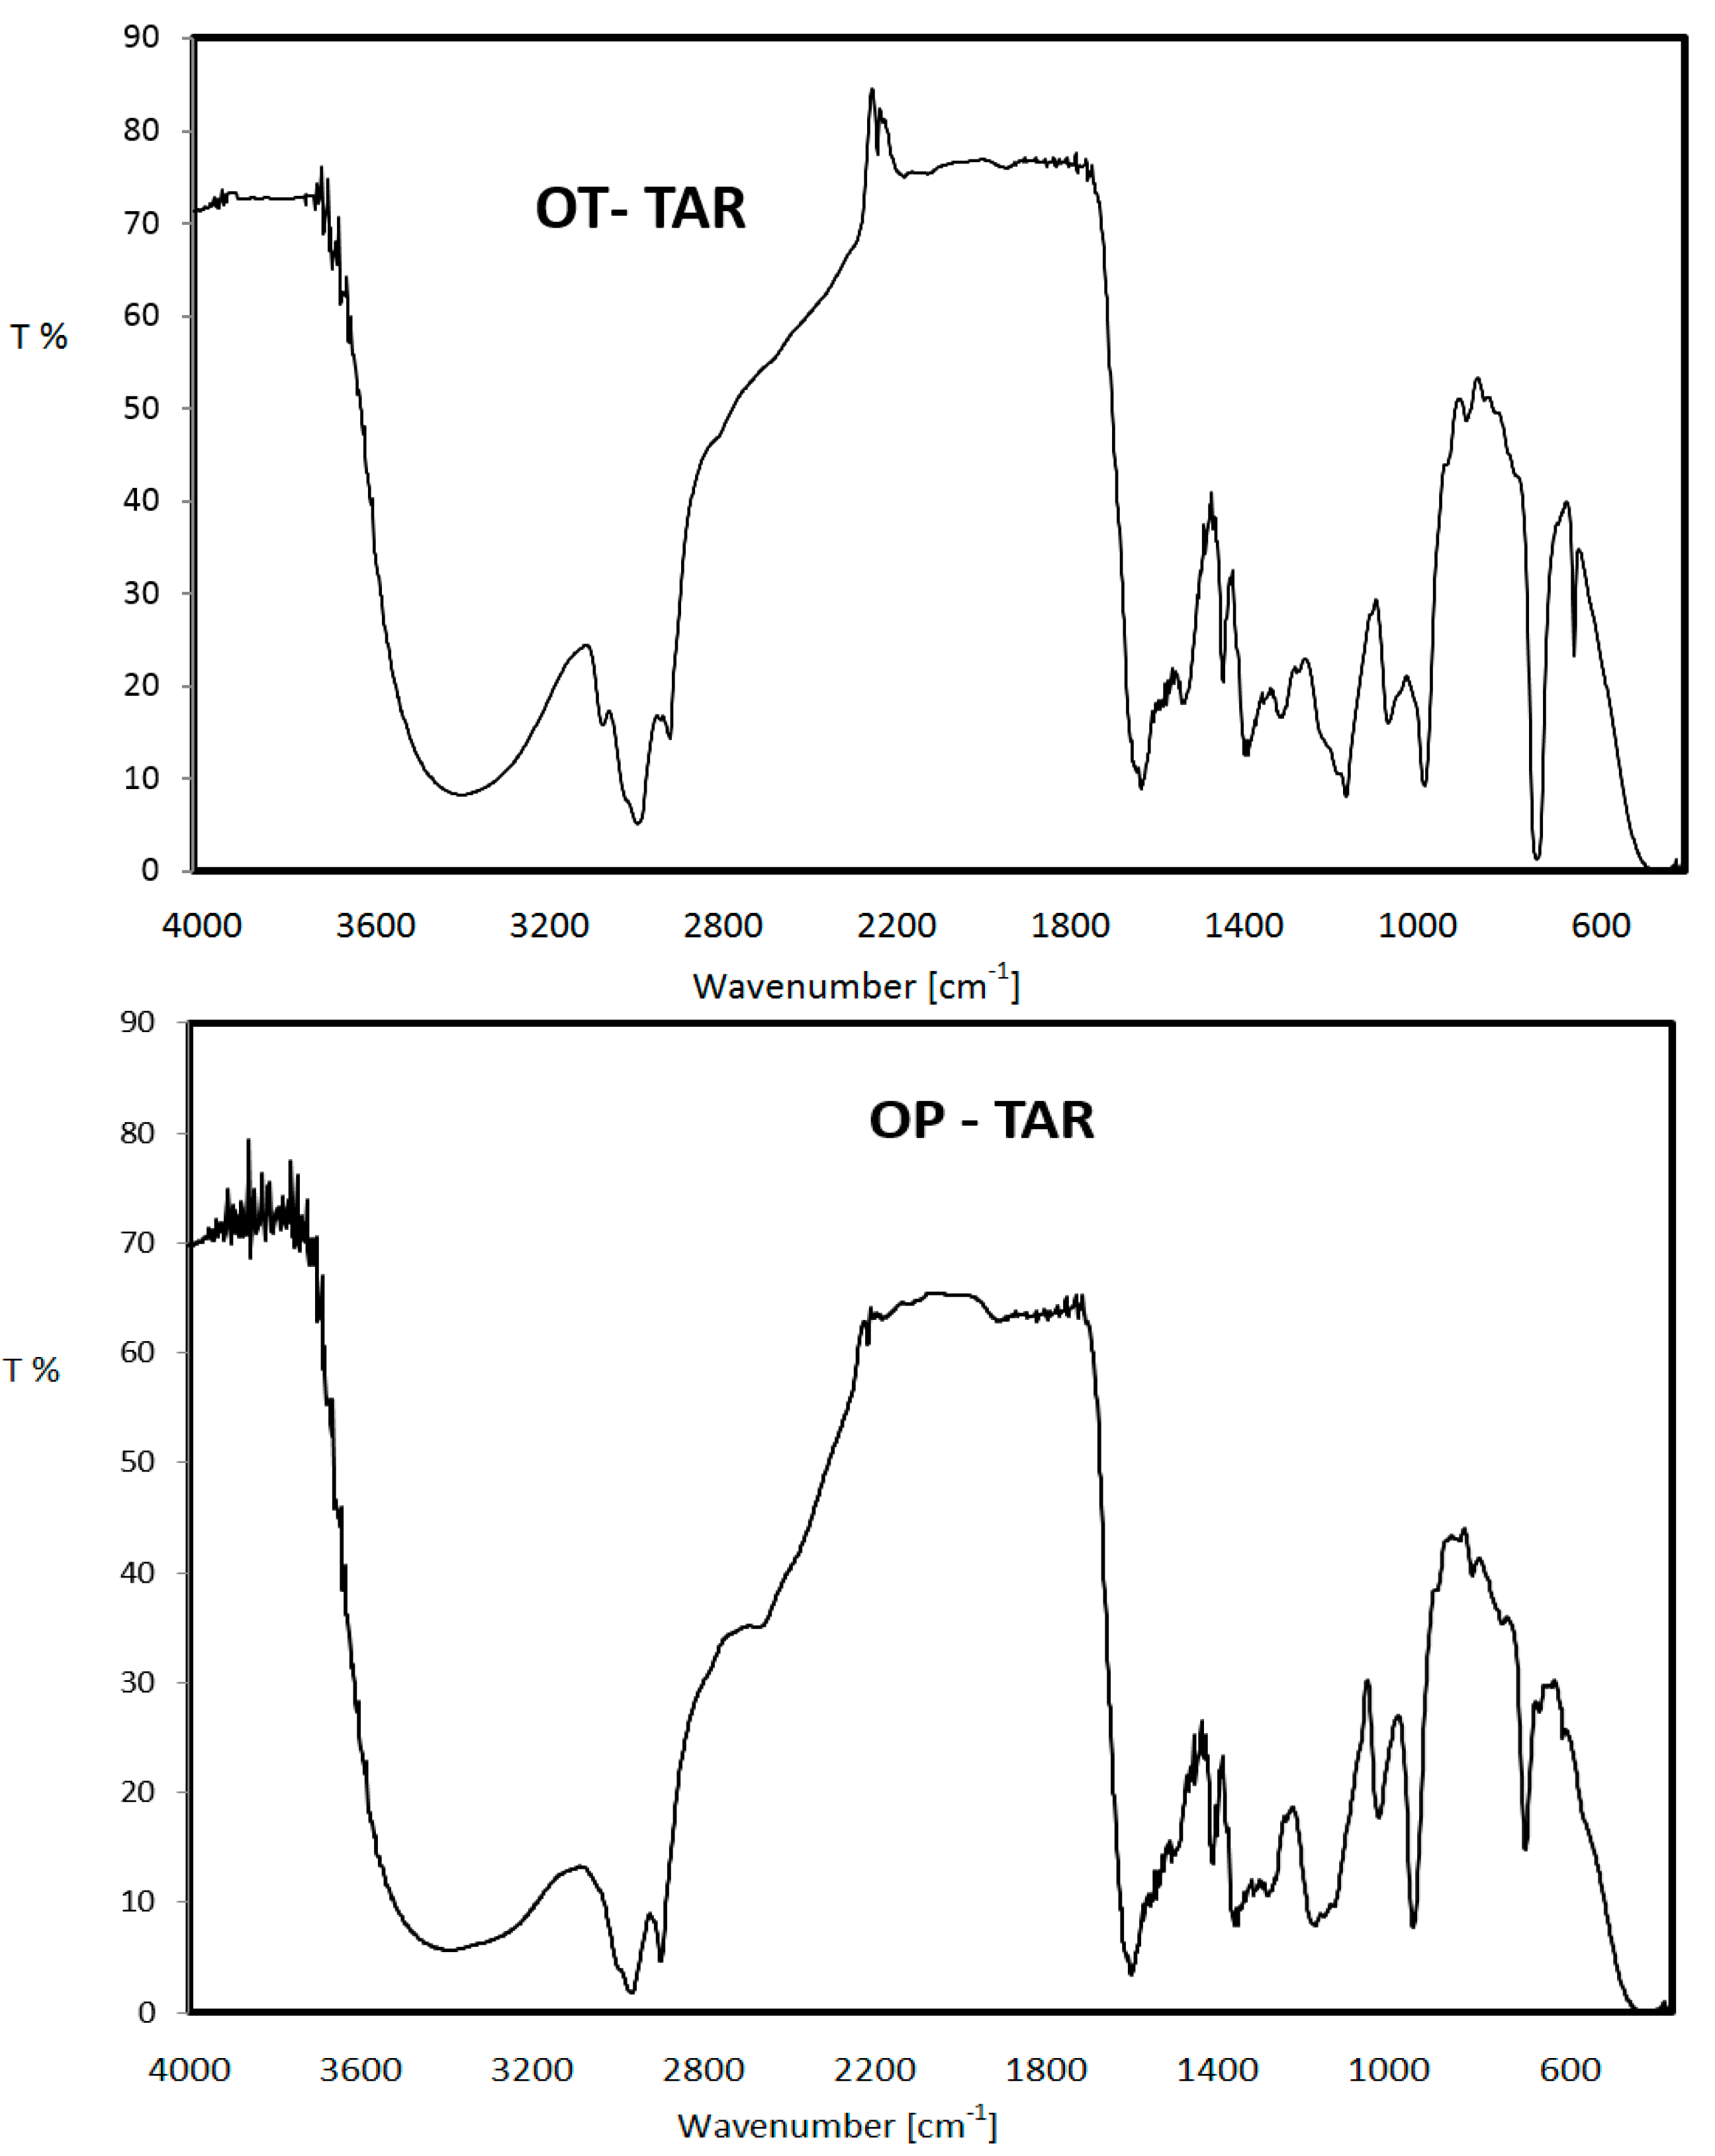
Tar is a complex mixture of oxygenated and non-oxygenated hydrocarbons with a high variety of molecular weights and boiling points, hence, during the evaporation phase, some of these compounds may volatilise or recombine to form different compounds, so that the very same definition of what is tar may be ambiguous.
Moreover, tar is recovered from the tubes with the use of an organic solvent mixture, and this may also influence the results. It is therefore necessary to define the rationale behind the recovery methodology and the subsequent procedure, as repeatability of tar yields and tar characterisation may prove difficult to achieve otherwise.
Some authors agree with the definition of tar as a “mixture of hydrocarbons with molecular weight higher than that of benzene” [11]. Based on this assumption, and considering that benzene has a boiling point of 40 °C at 347 mbar of pressure, evaporation was performed at these operating conditions. Moreover, in order to minimise differences due to different reactions with the organic solvent in the different runs, and get consistent data for each run, the volume of organic solution of tar, after recovery and before evaporation, was diluted to a constant total volume of 170 mL.
The evaporation time was also kept constant and equal to one hour for all the tests. The tar yield is then determined by the difference between the gross weight of the evaporation vessel and the pre-weighted vessel.

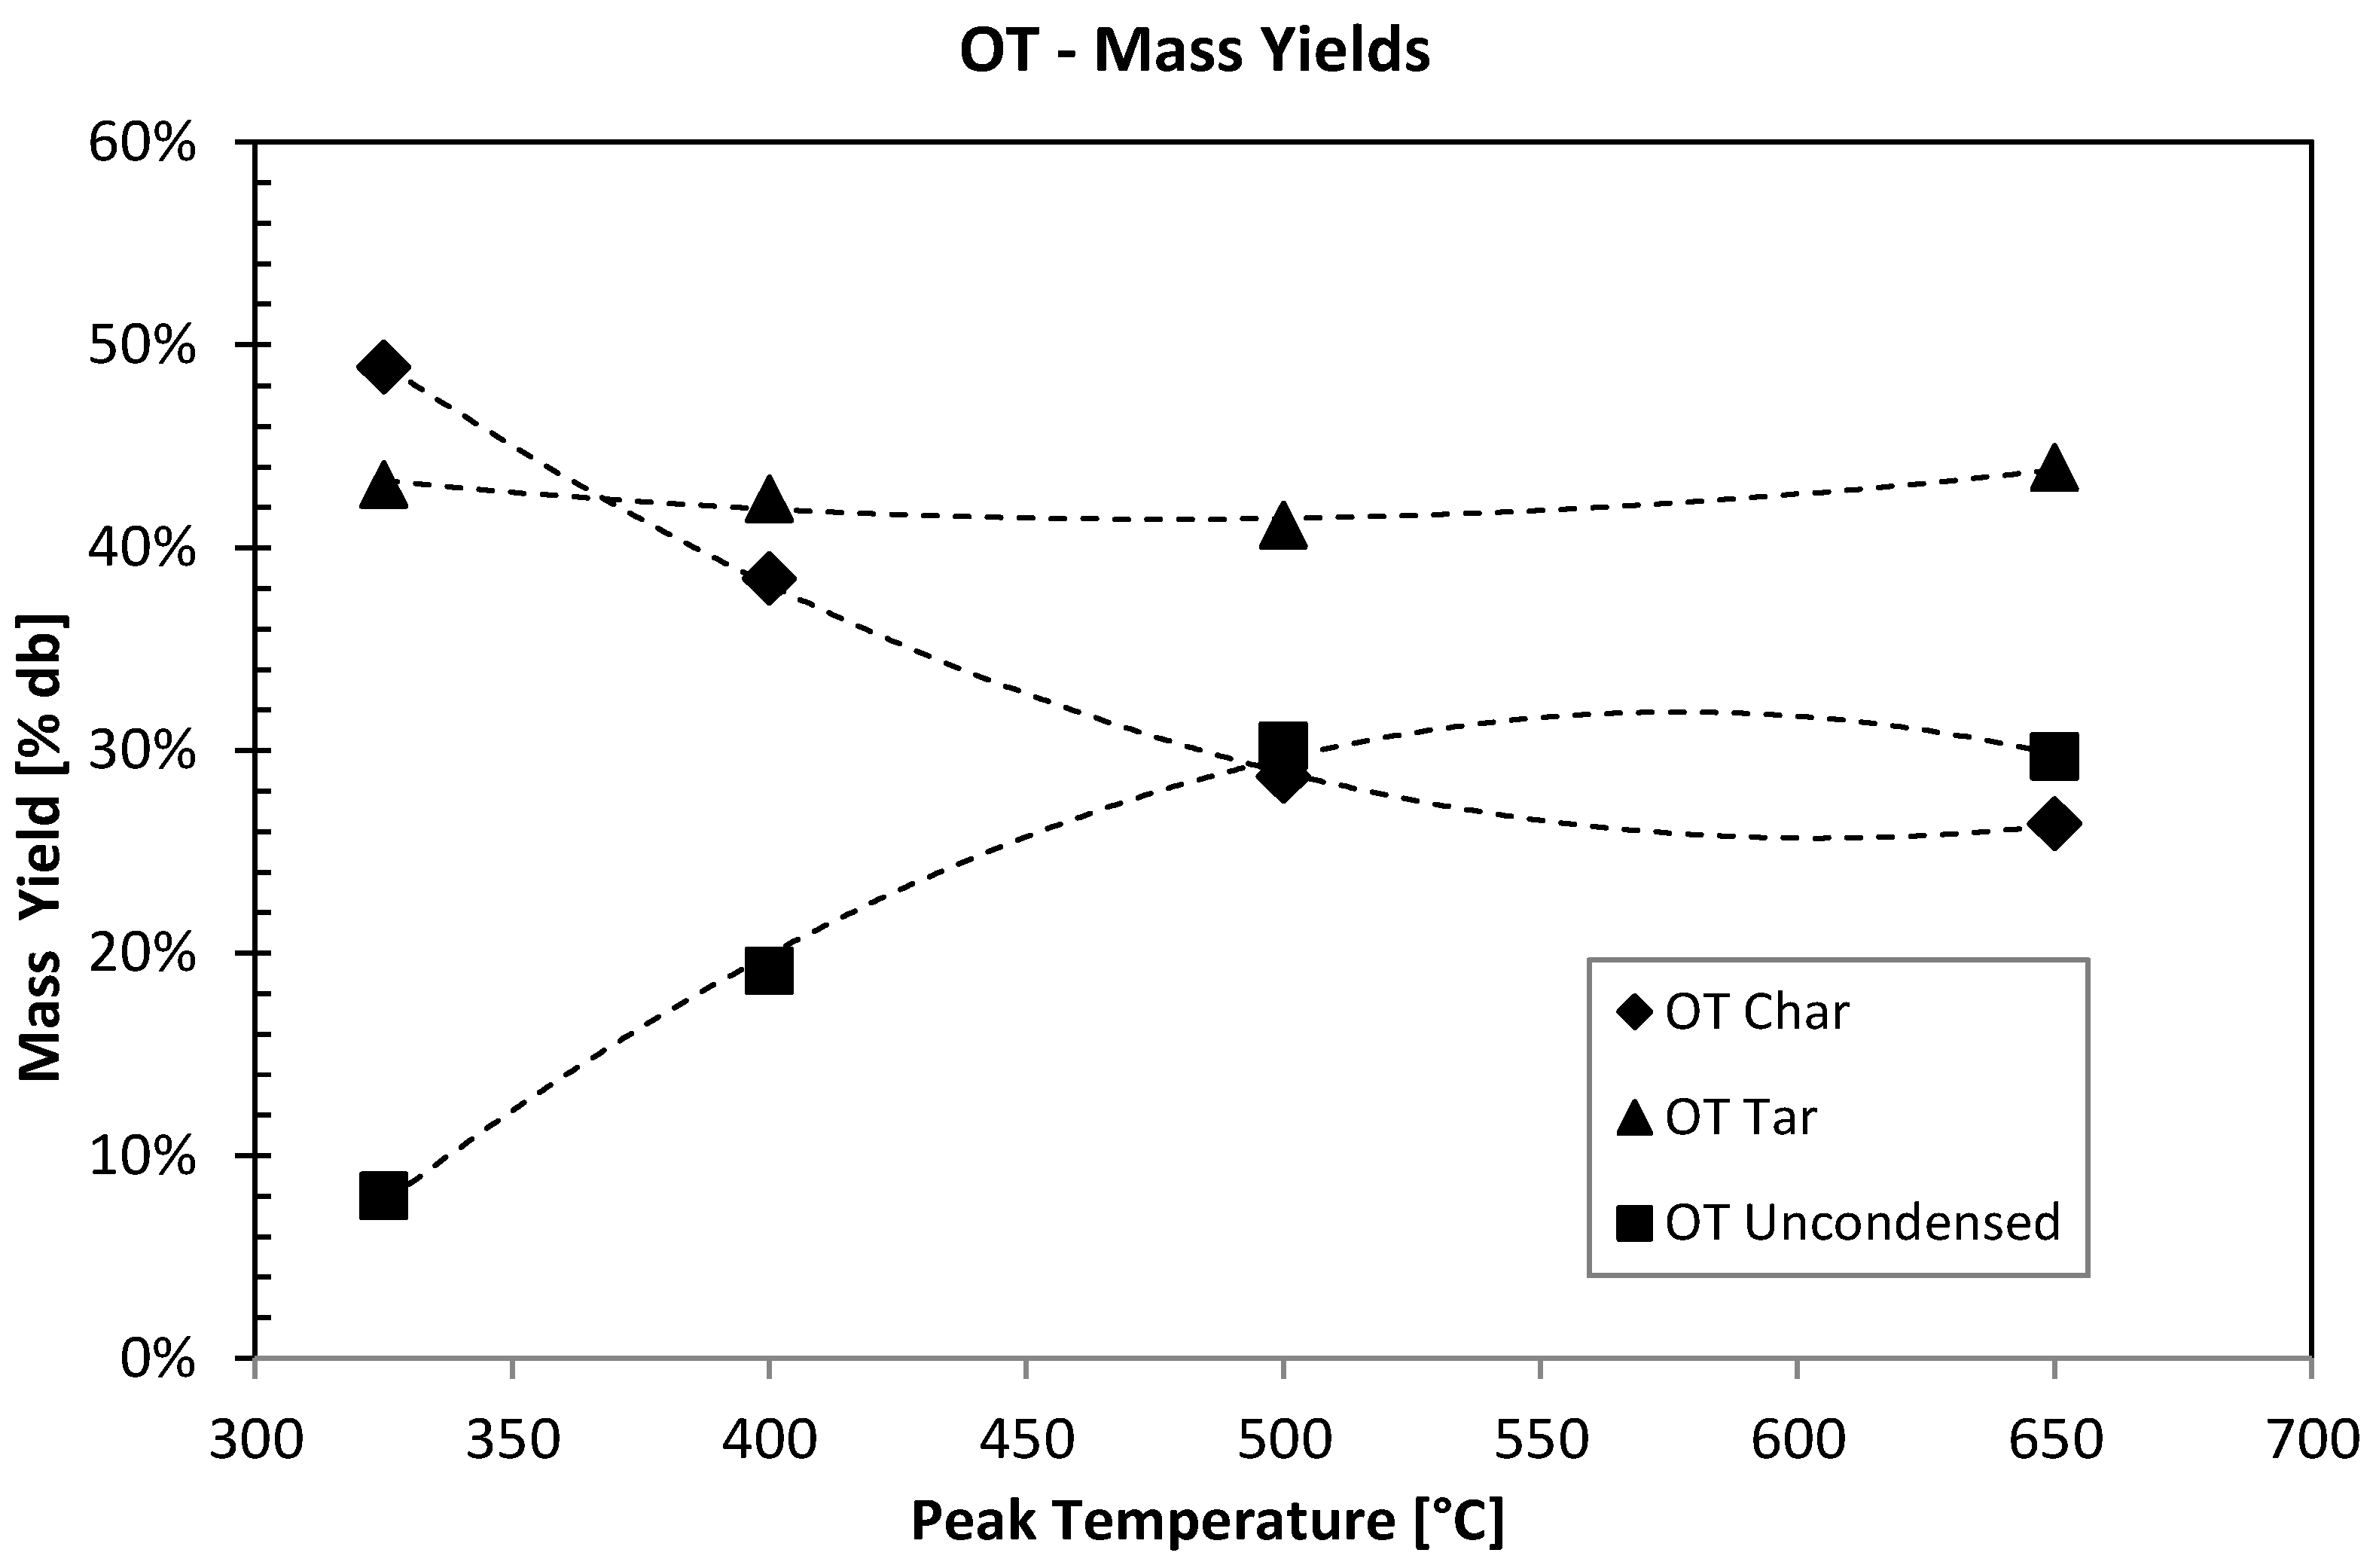
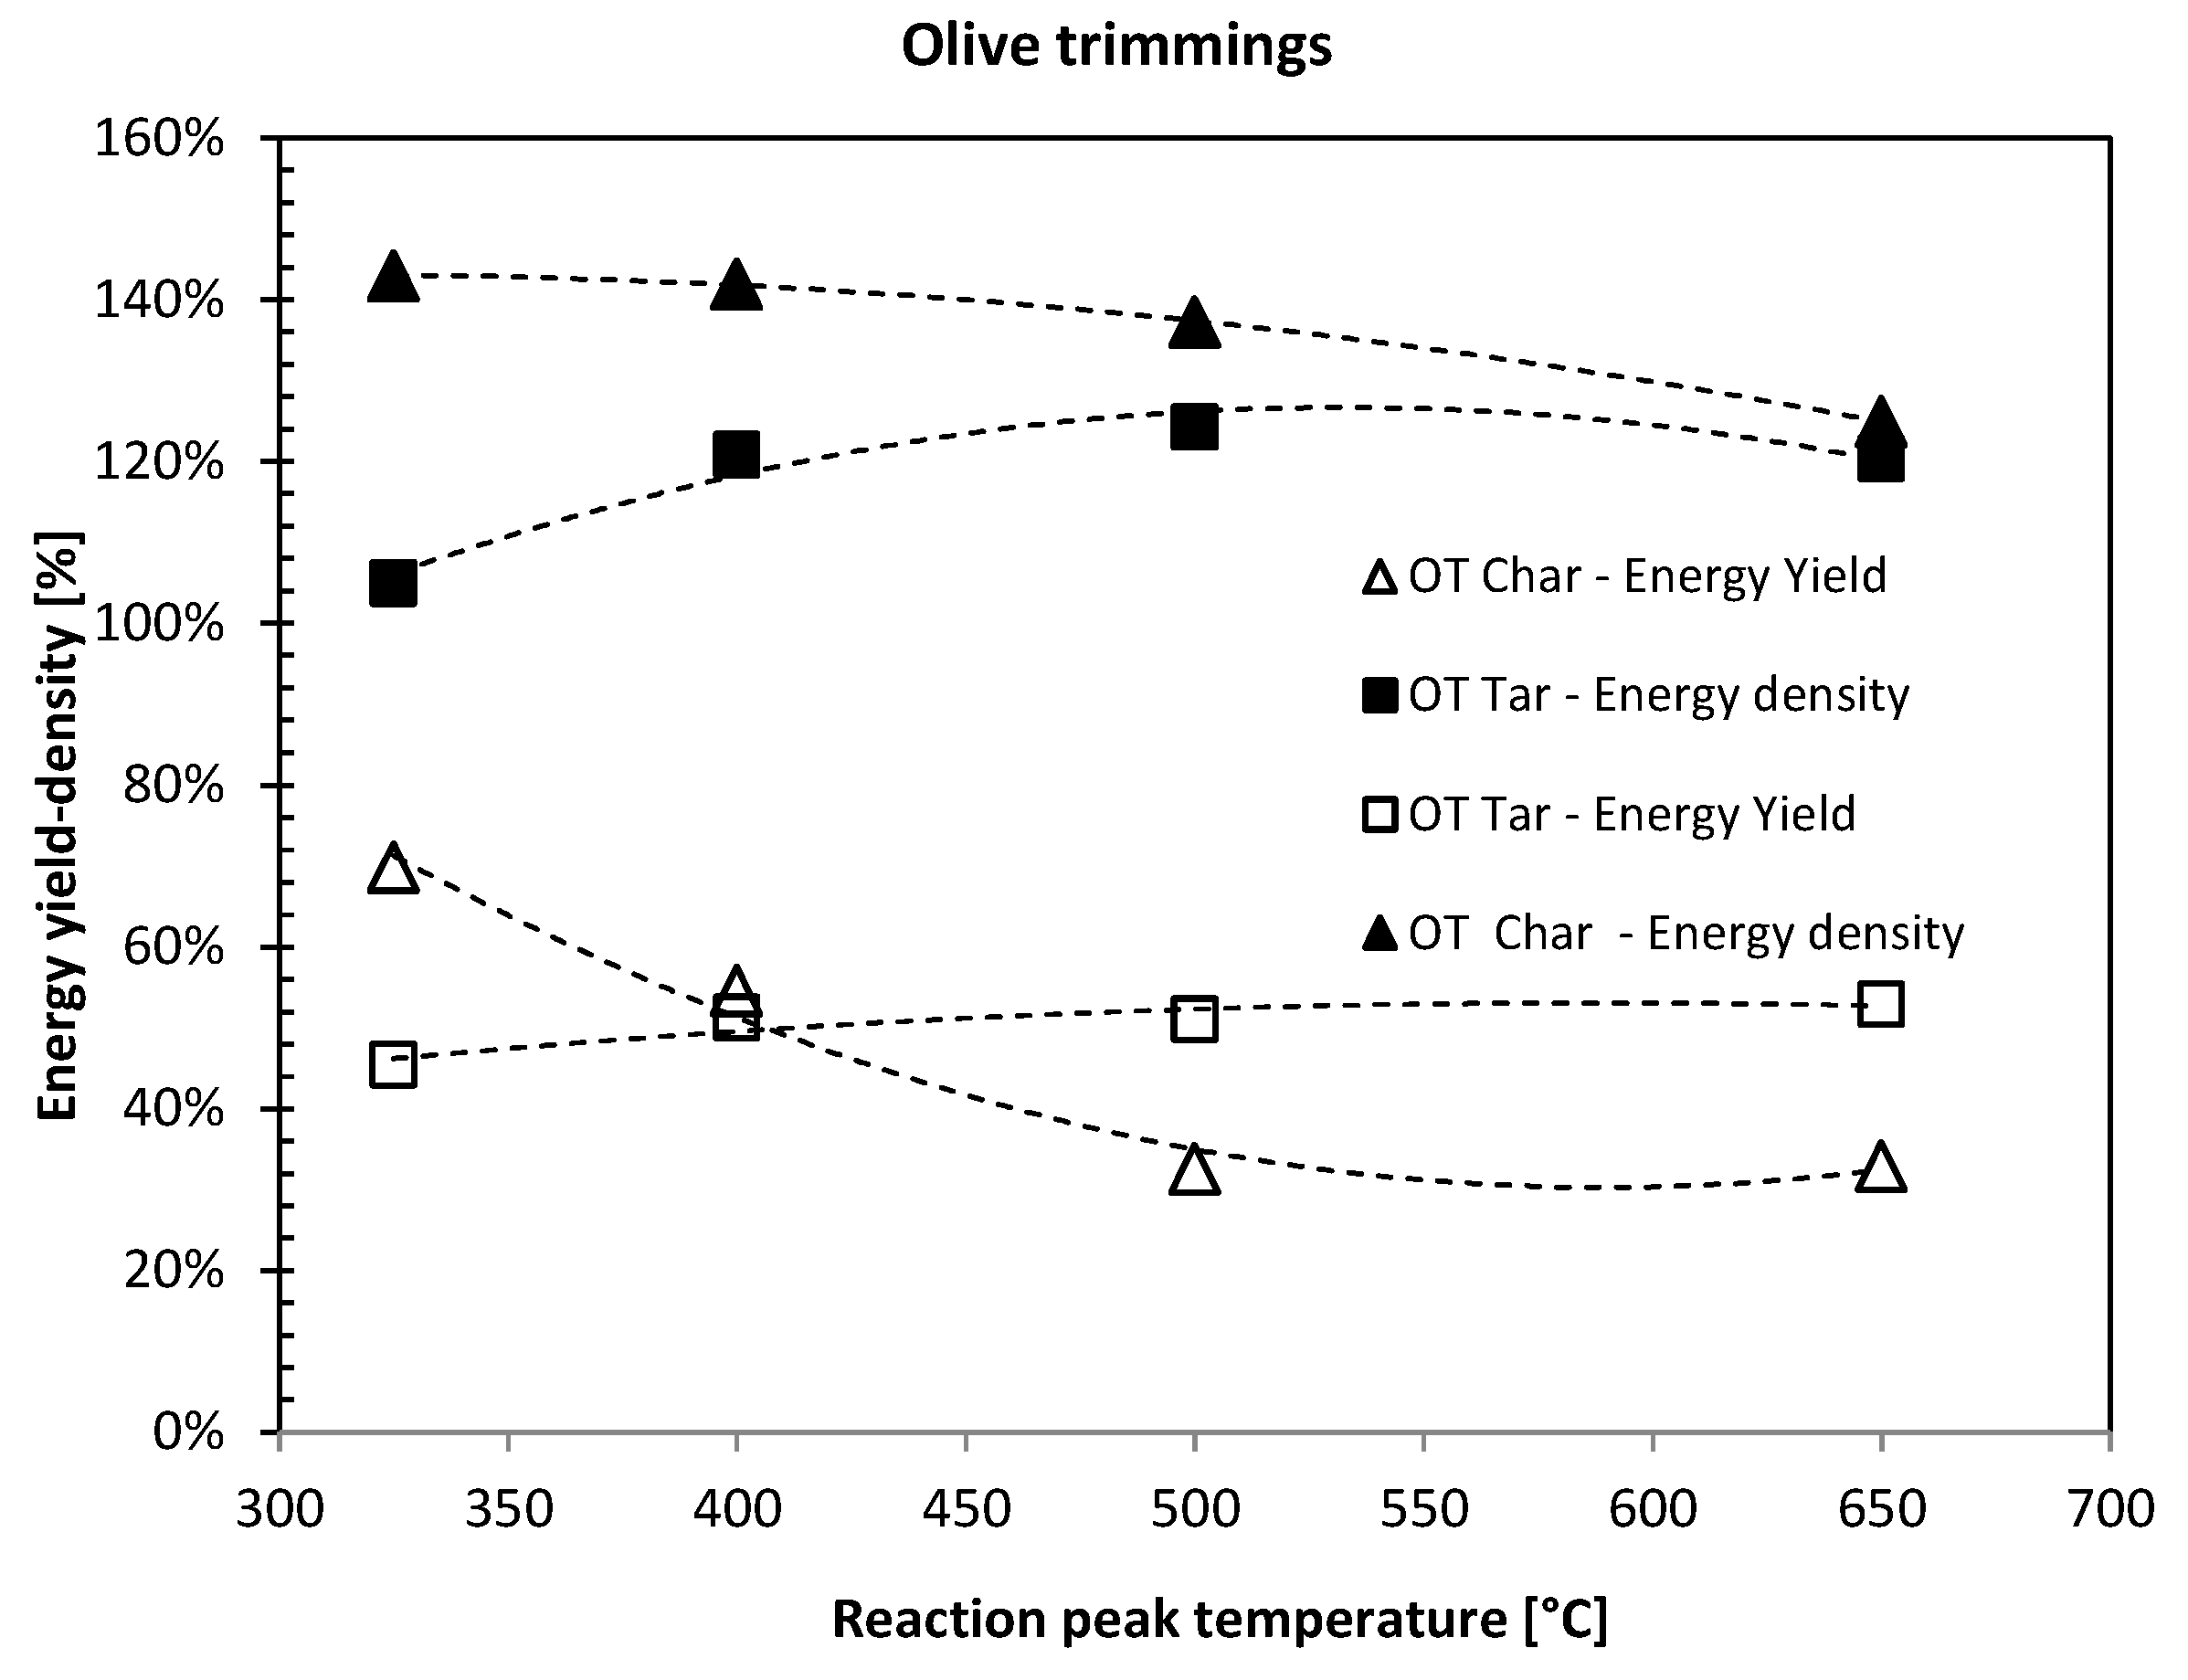
2.2.3. Energy Analysis

Mass yields and energy properties of the pyrolysis products were determined and compared to the values of the raw materials. GCV was determined through a Calorimeter model “Leco AC 500”. Mass Yields (MY), Energy Yield (EY) and Energy Densities (ED) [8] were calculated as follow:
Sustainability 06 07866 i001
where Wf and W0 are respectively the weight of the obtained product, and the weight of the initial biomass.
Sustainability 06 07866 i002
where GCVt and GCVu are the gross calorific values of the treated and un-treated biomass.
Sustainability 06 07866 i003

2.2.4. Analytical Determinations

Ultimate analyses were done using an Elementar Macro Vario Cube analyzer for simultaneous CHNS determination. Proximate analyses were carried out by a LECO Thermogravimetric Analyser TGA 701. Typically, 200–300 mg of solid samples was used to evaluate composition in terms of moisture content (MC), volatile fraction (VF), fixed carbon (FC) and ashes (Ash). The thermal program was as follows:
  • 20 °C/min ramp to 105 °C in air; hold until weight constant (<±0.05%) for MC calculation.
  • 50 °C/min ramp from 105–900 °C, hold time 7 min, in N2 to determine the VF.
  • Isothermal hold at 800 °C in a reactive environment (air) to determine the “Ash” content.
FT-IR absorption spectra were recorded on a Shimadtzu 8400 FTIR spectrometer using pure tar compounds on KBr windows.

3. Results and Discussion

All the pyrolysis experiments were carried out in triplicates, OT and OP mass yields showed a percentage error lower than 3% whilst tar yields results showed a consistently higher error, anyhow controlled below 6%.
Values for GCV both for char and tar samples showed errors lower than 4%. The proximate and ultimate analyses on dry basis (d.b.) of the untreated biomasses are reported in Table 2 and Table 3, respectively.
Table 2. Proximate analysis of the untreated OT (olive trimmings) and OP (olive pomace).
Proximate analysis% d.b. (dry basis)OTOP
Moisture6.27.4
Volatile Matter75.169.7
Fixed Carbon14.619.8
Ash4.13.1
Table 3. Ultimate analysis of the untreated biomasses: OT and OP.
Ultimate analysis% d.b.OTOP
C49.352.7
H6.15.9
N2.12.7
S0.20.2

3.1. Mass Yields

Figure 7 shows the char, tar and the unrecovered material mass yields trends (the unrecovered residue mass yield is calculated by difference) of OT. Char yield decreases with increasing peak temperature to a minimum value of about 26.4 w% d.b. at 650 °C. On the other hand tar yields remain almost constant (approx. 42–43 w% d.b.) at different temperatures and the unrecovered material mass yield grows with temperature reaching a value of about 29.7 w% d.b. at 650 °C.
Figure 8 shows the char, tar and the uncondensed mass yields (calculated by difference) of OP at different peak temperatures. Again char yield shows a decreasing trend to a minimum value of about 30.3 w% d.b. with increasing peak temperature to 650 °C.
Tar yield slightly decreases with temperature to a minimum value of 35.1 w% d.b.at 650 °C and the unrecovered material mass yield reaches a value of about 34.6 w% d.b.at 650 °C.
Figure 7. Olive tree trimmings: Char, Tar and Uncondensed mass yields at different reaction peak temperature.
Sustainability 06 07866 g007
Figure 8. Olive Pomace: Char, Tar and Uncondensed mass yields at different reaction peak temperature.
Sustainability 06 07866 g008
In Table 4, mass yield values of OT and OP pyrolysis residues are reported.
Table 4. Mass yields w% d.b. of OT and OP pyrolysis residues. (* determined by difference).
Pyrolysis peak temperature [°C]325400500650
CharOT48.938.528.726.4
OP50.137.732.430.3
TarOT43.142.441.143.9
OP42.139.238.735.1
Unrecovered *OT819.130.229.7
OP7.823.128.934.6
OT and OP show similar mass (liquid plus solid) yield trends during pyrolysis but OP tar yield appears to lower as pyrolysis peak temperature increases.
We observe that OT tar yield remains constant (42% d.b.) at the different peak temperatures (325–650 °C) while OP tar decreases with temperature from a value of 42% d.b. at 325 °C to a value of 35% d.b. at 650 °C. This is one significant difference between OT and OP and could be due to several reasons which would need further investigation.
Looking at these results, we may speculate that OT char is more reactive at the higher temperatures and/or that some secondary charring reactions may occur in greater proportion in OP samples. This could be due to the relatively higher boiling point of the oils contained in OP compared to the elements contained in OT.
Oils still present in the OP particles at higher temperatures may provide “more favourable” conditions to secondary charring of tars formed upstream of the sample and hitting the hot particles downstream.
Naturally, if this were the case, the bed height would have an important influence on results. This issue is currently being more deeply investigated by the authors and results will be published in a future work.
Cordella et al. [22] recently carried out similar pyrolysis experiments on sorghum, switchgrass and corn stalks which showed similar char yields. In that case, though, tar mass yields showed different behaviour. In fact, it is shown to increase between 300 and 400 °C and then remain constant between 400 and 650 °C.

3.2. Proximate and Ultimate Analysis of OT and OP Pyrolysis Solid Residues

Table 5 shows the results of proximate and ultimate analysis of the pyrolysed OT and OT samples at different peak temperatures.
Proximate analysis data show that, by increasing the severity of the treatment, the solid residue show a lower moisture content at equilibrium and that volatile mass decreases fast, together with an increase of fixed carbon content to a value of approximately 60% for OT and 68% for OP.
OT and OP chars recovered at 650 °C pyrolysis peak temperature show a residual VM of 21% and ash content of 14.4% and 10.7%, respectively.
Ultimate analysis shows that already at 325 °C most of the oxygenated compounds are lost, (OT O% = 13.2, OP O% = 16.9). Moreover, carbon content for the OT and OP residues quickly reaches a value around 70%, while hydrogen content progressively decreases with severity of treatment.
Table 5. Proximate and ultimate analysis of OT and OP pyrolysis solid residues, (w.b.:wet basis).
SampleProximate AnalysisUltimate Analysis
M (w.b.)VM (d.b.)FC (d.b.)Ash (d.b.)C%H%N%S%O%
OT untreated6.2%75.1%14.6%4.1%49.3%6.1%2.1%0.2%38.4%
OT 325 °C3.6%56.0%32.6%7.9%71.2%5.5%2.2%0.1%13.2%
OT 400 °C1.4%39.1%48.7%10.8%68.0%4.1%1.8%0.2%15.2%
OT 500 °C2.2%28.1%56.3%13.4%70.4%2.5%1.6%0.2%11.8%
OT 650 °C4.5%20.9%60.2%14.4%73.1%1.4%1.6%0.2%9.4%
OP untreated7.4%69.7%19.8%3.1%52.7%5.9%2.7%0.2%35.5%
OP 325 °C1.4%48.9%43.1%6.7%71.2%5.5%1.6%0.1%16.9%
OP 400 °C1.0%33.4%56.9%8.8%70.9%3.8%2.3%0.1%14.2%
OP 500 °C0.3%23.4%65.1%11.2%75.3%2.7%2.1%0.1%8.7%
OP 650 °C0.5%20.9%67.9%10.7%79.6%1.5%2.1%0.1%6.0%

3.3. FTIR Analysis of OT and OP Tars

Figure 9 shows FT-IR OT and OP spectra of tars obtained at 500 °C pyrolysis peak temperature.
Figure 9. FT-IR, of pure OT and OP tar sample obtained at 500 °C pyrolysis peak temperature (KBr windows).
Sustainability 06 07866 g009
OT and OP tars show a very similar IR absorption spectra, indicating similar compounds (and thus identical functional groups) are present in both tars.
In Table 6 we report a possible assignment for the absorption bands [28]. The IR spectra clearly show the presence of large quantities of phenolic species, together with organic oxygenated species like ketones and ethers.
Table 6. Assignments and modes of FT-IR bands for OT and OP tars, pyrolysis peak temperature 500 °C (n.d. = not detected).
AssignmentWavenumber (cm−1)
OTOP
v, C-H (aromatic outside the plane)665n.d.
v, C-H (aromatic outside the plane)756756
v, C-H (aromatic outside the plane)10281028
v, C-O-C (Aril-Ether) and C-CO-C1114115
v v v, C-O-C (Aril-Ether) and C-CH312171217
v, O-H (bending)13371337
v, O-H (bending)13711371
v, C=C (stretching aromatic)14161417
v, C=C (stretching aromatic)14541454
v, C-H (bending)14621462
v, C=C (stretching aromatic)15141515
v, C=C (stretching aromatic)15561557
v, C=C (stretching aromatic)16071607
v, C=O (stretching ketonic) and v, O-H (phenolic)16341633
v, C=O (stretching ketonic) and v, O-H (phenolic)16511651
v, C=O (stretching ketonic) and v, O-H (phenolic)16661667
v, C=O (stretching ketonic)17131713
v, C-H (stretching)28512852
v, C-H (stretching)28722879
v, C-H (stretching)2928n.d.
v, C-H (stretching)30113014
v, O-H (phenolic with hydrogen bond)33563354

3.4. Energy Yield and Energy Density.

GCV of untreated material, char and tar are reported in Table 7. Figure 10 and Figure 11 show the correlation between peak temperature and energy density for OT and OP.
It can be noted that the energy density of OT char decreases with increasing temperature, while char derived from the OP shows an almost constant value in energy density with increasing temperature.
This is due to the fact that the GCV of the OP is constant with increasing temperature, while its mass loss increases. OT’s decrease in energy density is due to the fact that GCV decrease with increasing temperature.
These results may also suggest more prominent secondary charring in OP than in OT since GCV of OP chars remain largely constant whilst GCV of tar diminishes, when compared to OT, for which GCV of chars diminishes for peak temperatures above 325 °C.
Both OT and OP tars show their maximum energy densities at 500 °C peak temperature, (E.Y.OT = 1.24 and E.Y.OP = 1.33).
Table 7. Gross calorific values of untreated OT, OP and of their char and tar.
GCV d.b. (J/g)
Peak temperature (°C)OTOP
chartarchartar
Untreated19,998-19,706-
32520,70820,43830,07321,811
40027,52923,44030,00725,667
50026,63124,12129,98126,956
65024,23423,36830,00526,830
Figure 10. Energy yield and energy density of OT char and tar.
Sustainability 06 07866 g010
Figure 11. Energy yield and energy density of OP char and tar.
Sustainability 06 07866 g011
In more macroscopic terms, we may summarise that at a 500 °C peak temperature, both OT and OP solid and liquid residues show excellent energetic properties for potential applications as higher quality bio-fuels; hence, this may be considered as the optimum peak temperature for a pyrolysis process at farm level.

4. Conclusions

In this study, a horizontal fixed-bed pyrolysis reactor (FBR) was developed by adapting the system for the standard Gray-King (GK) assay test on coal. The system built proved an easy to use and reliable means for slow pyrolysis experiments on agro-industrial residues. The FBR allows researchers to determine the influence of pyrolysis parameters on the product yields, and consequently to determine the variation on mass and energy yields of products. The preliminary pyrolysis experiments conducted with olive agro-industrial residues, olive tree trimming and olive pomace returned good reproducibility data, showing a percentage error in mass yields less than 4% for char recovery and not higher than 6% for tar.
Proximate analysis data demonstrate that the moisture content at equilibrium generally lowers with the severity of the pyrolysis treatment. Volatile mass decreases fast, together with an increase of fixed carbon content, (at 650 °C pyrolysis peak temperature OT and OP − VM = 21%; OT − FC = 60% and OP − FC = 68%). Ultimate analysis shows that already at 325 °C most of the oxygenated compounds are lost, (OT − O% = 13.2, OP − O% = 16.9). Moreover, carbon content for the OT and OP residues quickly reaches a value around 70%, while hydrogen content decreases progressively with severity of treatment.
FT-IR analyses show that in OT and OP tars consist of similar chemical compounds. IR spectra clearly show the presence of significant quantities of phenolic species together with organic oxygenated species like ketones and ethers. The energetic analyses conducted show a clear increase in energy density during pyrolysis. At 500 °C peak temperature, OT and OP chars show energy densities of 1.37 and 1.48 respectively, while their corresponding tars show energy densities of 1.24 and 1.33. Thus, both OT and OP chars and tars are excellent candidates as higher quality more sustainable bio-fuels. The system designed and tested is foreseeable as a powerful, easy to use, yet accurate tool to help farms enhance their sustainable practices by quickly characterising their residues with respect to the potential improvement of their characteristics as a biofuel.

Author Contributions

All authors contributed equally to this work. All authors read and approved the final manuscript.

Conflicts of Interest

The authors declare no conflict of interest.

References

  1. Somrang, Y. Effect of Operating Conditions on Product Distributions and Bio-oil ageing in Biomass Pyrolysis. Ph.D. Thesis, Imperial College London of Science, Technology and Medicine, London, UK, 2011. [Google Scholar]
  2. Kandiyoti, R. Pipelines,Flowing Oil and Crude Politics, 2nd ed.; I.B. Tauris &Co. Ltd.: London, UK, 2012. [Google Scholar]
  3. Tudisca, S.; di Trapani, A.M.; Sgroi, F.; Testa, R.; Squatrito, R. Economic analysis of PV systems on buildings in Sicilian farms. Renew. Sustain. Energy Rev. 2013, 28, 691–701. [Google Scholar]
  4. Sgroi, F.; Tudisca, S.; di Trapani, A.M.; Testa, R.; Squatrito, R. Efficacy and Efficiency of Italian Energy Policy: The Case of PV Systems in Greenhouse Farms. Energies 2014, 7, 3985–4001. [Google Scholar]
  5. Marvuglia, A.; Messineo, A. Monitoring of wind farms’ power curves using machine learning techniques. Appl. Energy 2012, 98, 574–583. [Google Scholar]
  6. Sanders, J.; van der Hoeven, D. Opportunities for a Bio-based Economy in the Netherlands. Energies 2008, 1, 105–119. [Google Scholar]
  7. Koseki, H. Evaluation of Various Solid Biomass Fuels Using Thermal Analysis and Gas Emission Tests. Energies 2011, 4, 616–627. [Google Scholar]
  8. Ballarin, A.; Vecchiato, D.; Tempesta, T.; Marangon, F.; Troiano, S. Biomass energy production in agriculture: A weighted goal programming analysis. Energy Policy 2011, 39, 1123–1131. [Google Scholar]
  9. Messineo, A.; Volpe, R.; Marvuglia, A. Ligno-cellulosic biomass exploitation for power generation: A case study in sicily. Energy 2012, 45, 613–625. [Google Scholar]
  10. Fernandes, U.; Costa, M. Potential of biomass residues for energy production and utilization in a region of Portugal. Biomass Bioenergy 2010, 34, 661–666. [Google Scholar]
  11. European Commission. Biomass action plan, 2005. Europa Summaries of EU Legislation. Available online: http://europa.eu/legislation_summaries/energy/renewable_energy/l27014_en.htm (accessed on 18 February 2014).
  12. Basu, P. Biomass Gasification and Pyrolysis—Practical Design and Theory; Elsevier: Amsterdam, The Netherlands, 2010. [Google Scholar]
  13. Panoutsou, C.; Eleftheriadis, J.; Nikolaou, A. Biomass supply in EU27 from 2010 to 2030. Energy Policy 2009, 37, 5675–5686. [Google Scholar]
  14. Sheehan, J.J. Biofuels and the conundrum of sustainability. Curr. Opin. Biotechnol. 2009, 20, 318–324. [Google Scholar]
  15. Celma, A.; Rojas, S.; Lopezrodriguez, F. Waste-to-energy possibilities for industrial olive and grape by-products in Extremadura. Biomass Bioenergy 2007, 31, 522–534. [Google Scholar]
  16. Messineo, A.; Volpe, R.; Asdrubali, F. Evaluation of Net Energy Obtainable from Combustion of Stabilised Olive Mill By-Products. Energies 2012, 5, 1384–1397. [Google Scholar]
  17. Vitolo, S.; Petarca, L.; Bresci, B. Treatment of olive oil industry wastes. Bioresour. Technol. 1999, 67, 129–137. [Google Scholar]
  18. Cotana, F.; Messineo, A.; Petrozzi, A.; Coccia, V.; Cavalaglio, G.; Aquino, A. Comparison of ORC Turbine and Stirling Engine to Produce Electricity from Gasified Poultry Waste. Sustainability 2014, 6, 5714–5729. [Google Scholar]
  19. Istat. Stima Delle Superfici e Produzioni Delle Coltivazioni Agrarie. Available online: http://agri.istat.it/ (accessed on 18 July 2014). (In Italian)
  20. Jahirul, M.I.; Rasul, M.G.; Chowdhury, A.A.; Ashwath, N. Biofuels Production through Biomass Pyrolysis—A Technological Review. Energies 2012, 5, 4952–5001. [Google Scholar]
  21. Evans, R.J.; Milne, T.A. Molecular characterization of the pyrolysis of Biomass. 1. Fundamentals. Energy Fuels 1987, 1, 123–137. [Google Scholar]
  22. Methods for Analysis and Testing of Coal and Coke. Caking and Swelling Properties of Coal. Assessment of Caking Power by Gray-King Coke Test. Available online: http://0-shop-bsigroup-com.brum.beds.ac.uk/ProductDetail/?pid=000000000000247881 (accessed on 27 October 2014).
  23. Cordella, M.; Berrueco, C.; Santarelli, F.; Paterson, N.; Kandiyoti, R.; Millan, M. Yields and ageing of the liquids obtained by slow pyrolysis of sorghum, switchgrass and corn stalks. J. Anal. Appl. Pyrolysis 2013, 104, 316–324. [Google Scholar]
  24. Monteiro Nunes, S.; Paterson, N.; Dugwell, D.R.; Kandiyoti, R. Tar Formation and Destruction in a Simulated Downdraft Gasifier. Energy Fuels 2007, 21, 3028–3035. [Google Scholar]
  25. Monteiro Nunes, S.; Paterson, N.; Herod, A.; Dugwell, D.R.; Kandiyoti, R. Tar Formation and Destruction in a Fixed Bed Reactor Simulating Downdraft Gasification: Optimization of Conditions. Energy Fuels 2008, 22, 1955–1964. [Google Scholar]
  26. Spiegl, N.; Sivena, A.; Lorente, E.; Paterson, N.; Millan, M. Investigation of the Oxy-fuel Gasification of Coal in a Laboratory-Scale Spouted-Bed Reactor: Reactor Modifications and Initial Results. Energy Fuels 2010, 24, 5281–5288. [Google Scholar]
  27. Evans, R.; Milne, T.A.; Abatzoglou, N. Biomass Gasifier “Tars”: Their Nature,Formation, and Conversion. Available online: http://www.nrel.gov/docs/fy99osti/25357.pdf (accessed on 27 October 2014).
  28. Spectral Database for Organic Compounds SDBS. Available online: http://sdbs.db.aist.go.jp/sdbs/cgi-bin/direct_frame_top.cgi (accessed on 27 October 2014).

