Emergy-Based City’s Sustainability and Decoupling Assessment: Indicators, Features and Findings


Abstract
:1. Introduction
2. Methodological Framework
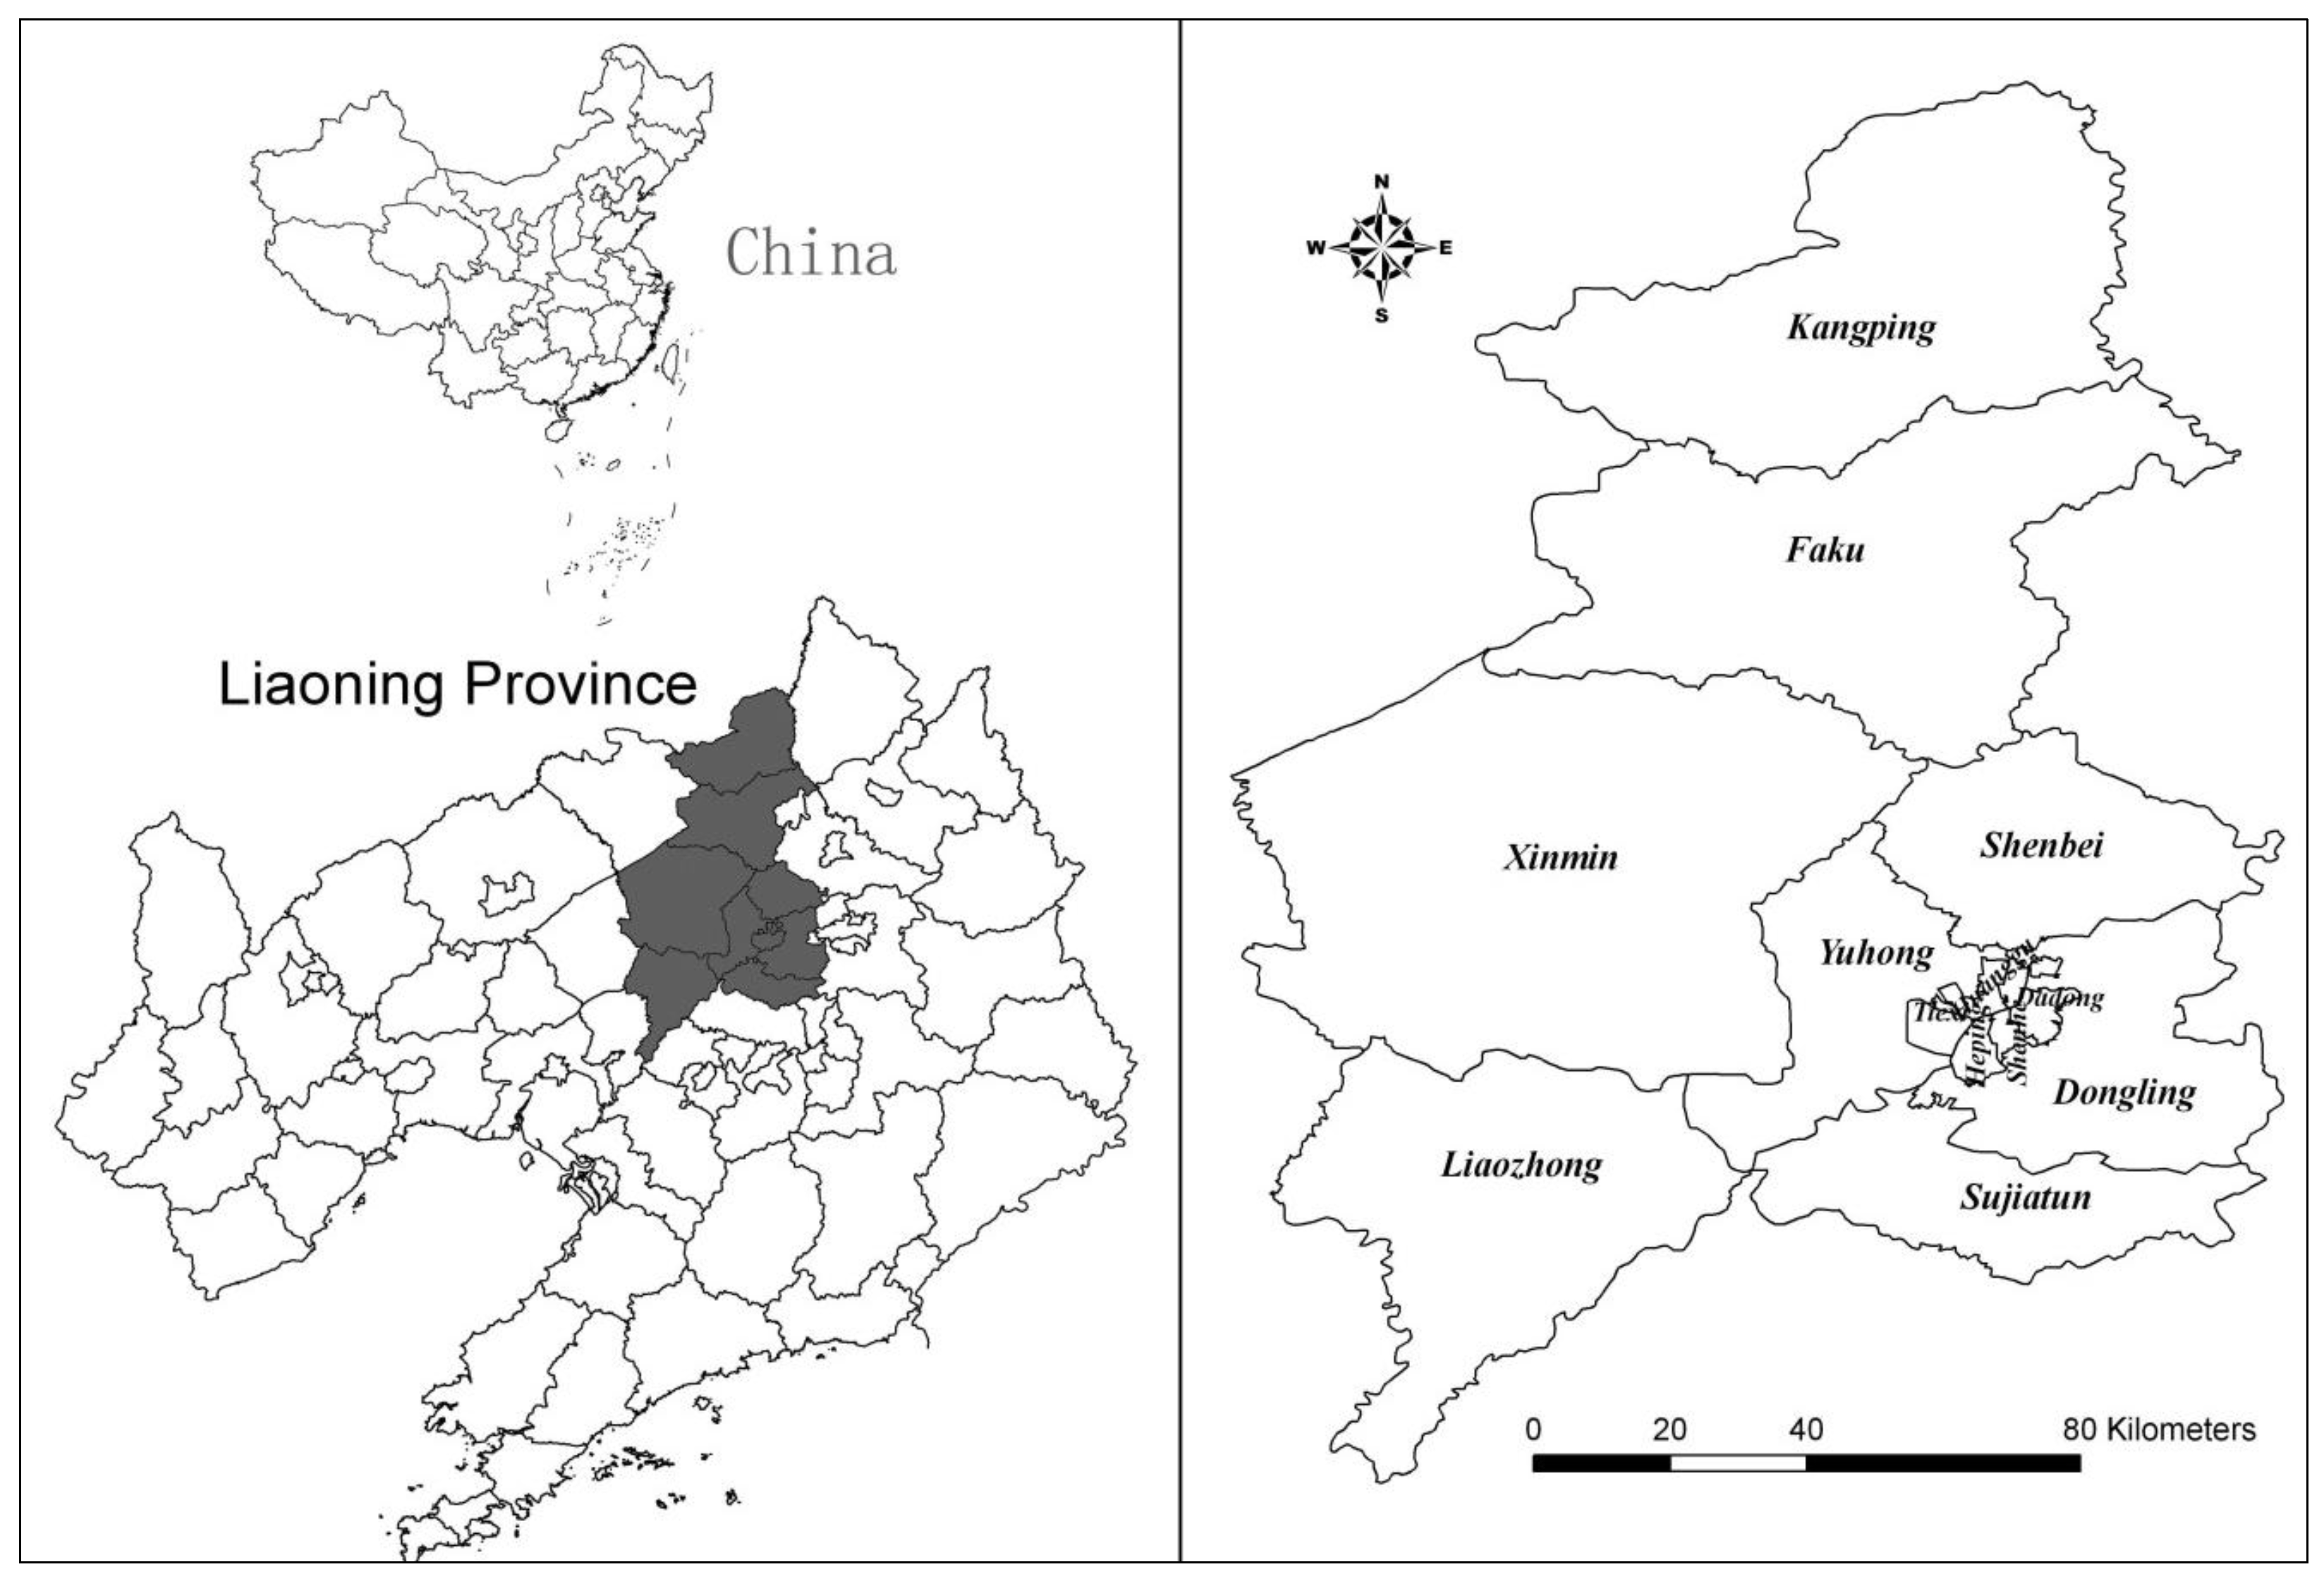
2.1. Studied Area: Shenyang City

2.2. Indicators and Data Sources
2.3. Methodologies
2.3.1. Emergy Analysis

| Note | Item | Unit | Raw data | Transformity (sej/unit) | Reference | Emergy (sej/year) |
|---|---|---|---|---|---|---|
| Non-renewable resources of agriculture | ||||||
| 1 | Nitrogenous Fertilizer | kg | 2.86 × 10⁸ | 6.62 × 10¹² | [30] | 1.89 × 10²¹ |
| 2 | Phosphate Fertilizer | g | 7.80 × 10¹⁰ | 9.35 × 10⁹ | [30] | 7.29 × 10²⁰ |
| 3 | Potash Fertilizer | g | 5.73 × 10¹⁰ | 9.32 × 10⁸ | [30] | 5.34 × 10¹⁹ |
| 4 | Compound Fertilizer | g | 2.09 × 10¹¹ | 2.80 × 10⁹ | [31] | 5.84 × 10²⁰ |
| 5 | Pesticide | J | 9.50 × 10¹⁴ | 1.97 × 10⁶ | [31] | 1.87 × 10²¹ |
| 6 | Plastic Membrane | g | 2.29 × 10¹⁰ | 3.20 × 10⁹ | [32] | 7.32 × 10¹⁹ |
| 7 | Agricultural Diesel Oil | g | 8.23 × 10¹⁰ | 2.83 × 10⁹ | [33] | 2.33 × 10²⁰ |
| Total Non-Renewable Resources (NRR) | 5.44 × 10²¹ | |||||
| Industrial Energy Consumption | ||||||
| 8 | Coal | J | 7.40 × 10¹⁷ | 9.10 × 10⁴ | [34] | 6.74 × 10²² |
| 9 | Cleaned Coal | J | 7.89 × 10¹⁶ | 9.10 × 10⁴ | [34] | 7.18 × 10²¹ |
| 10 | Other Cleaned Coal | J | 4.75 × 10¹⁵ | 9.10 × 10⁴ | [34] | 4.32 × 10²⁰ |
| 11 | Coal Products | J | 9.00 × 10¹⁴ | 9.10 × 10⁴ | [34] | 8.19 × 10¹⁹ |
| 12 | Coke | J | 3.71 × 10¹⁵ | 6.71 × 10⁴ | [35] | 2.49 × 10²⁰ |
| 13 | Natural Gas | J | 2.20 × 10¹⁶ | 1.71 × 10⁵ | [36] | 3.75 × 10²¹ |
| 14 | Crude Oil/petroleum | J | 3.04 × 10¹⁶ | 1.48 × 10⁵ | [36] | 4.5 × 10²¹ |
| 15 | Gasoline | g | 4.04 × 10¹¹ | 2.92 × 10⁹ | [33] | 1.18 × 10²¹ |
| 16 | Kerosene | J | 1.50 × 10¹⁵ | 5.50 × 10⁵ | [33] | 8.27 × 10²⁰ |
| 17 | Diesel | g | 4.29 × 10¹¹ | 2.83 × 10⁹ | [33] | 1.22 × 10²¹ |
| 18 | Fuel Oil | g | 4.06 × 10¹⁰ | 2.66 × 10⁹ | [33] | 1.08 × 10²⁰ |
| 19 | Liquefied Petroleum Gas | g | 2.86 × 10⁹ | 3.11 × 10⁹ | [33] | 8.89 × 10¹⁸ |
| 20 | Electricity | J | 4.10 × 10¹⁶ | 1.74 × 10⁵ | [37] | 7.14 × 10²¹ |
| Total Emergy of Energy (EoE) | 9.41 × 10²² | |||||
| Waste | ||||||
| 21 | Solid waste | g | 1.14 × 10¹³ | 1.88 × 10⁷ | [38] | 2.15 × 10²⁰ |
| 22 | Waste water | J | 3.13 × 10¹⁵ | 6.66 × 10⁵ | [39] | 2.08 × 10²¹ |
| 23 | Waste gas | m3 | 1.30 × 10¹¹ | 6.68 × 10¹⁰ | [31] | 8.69 × 10²¹ |
| Total Waste Emergy (WE) | 1.10 × 10²² | |||||
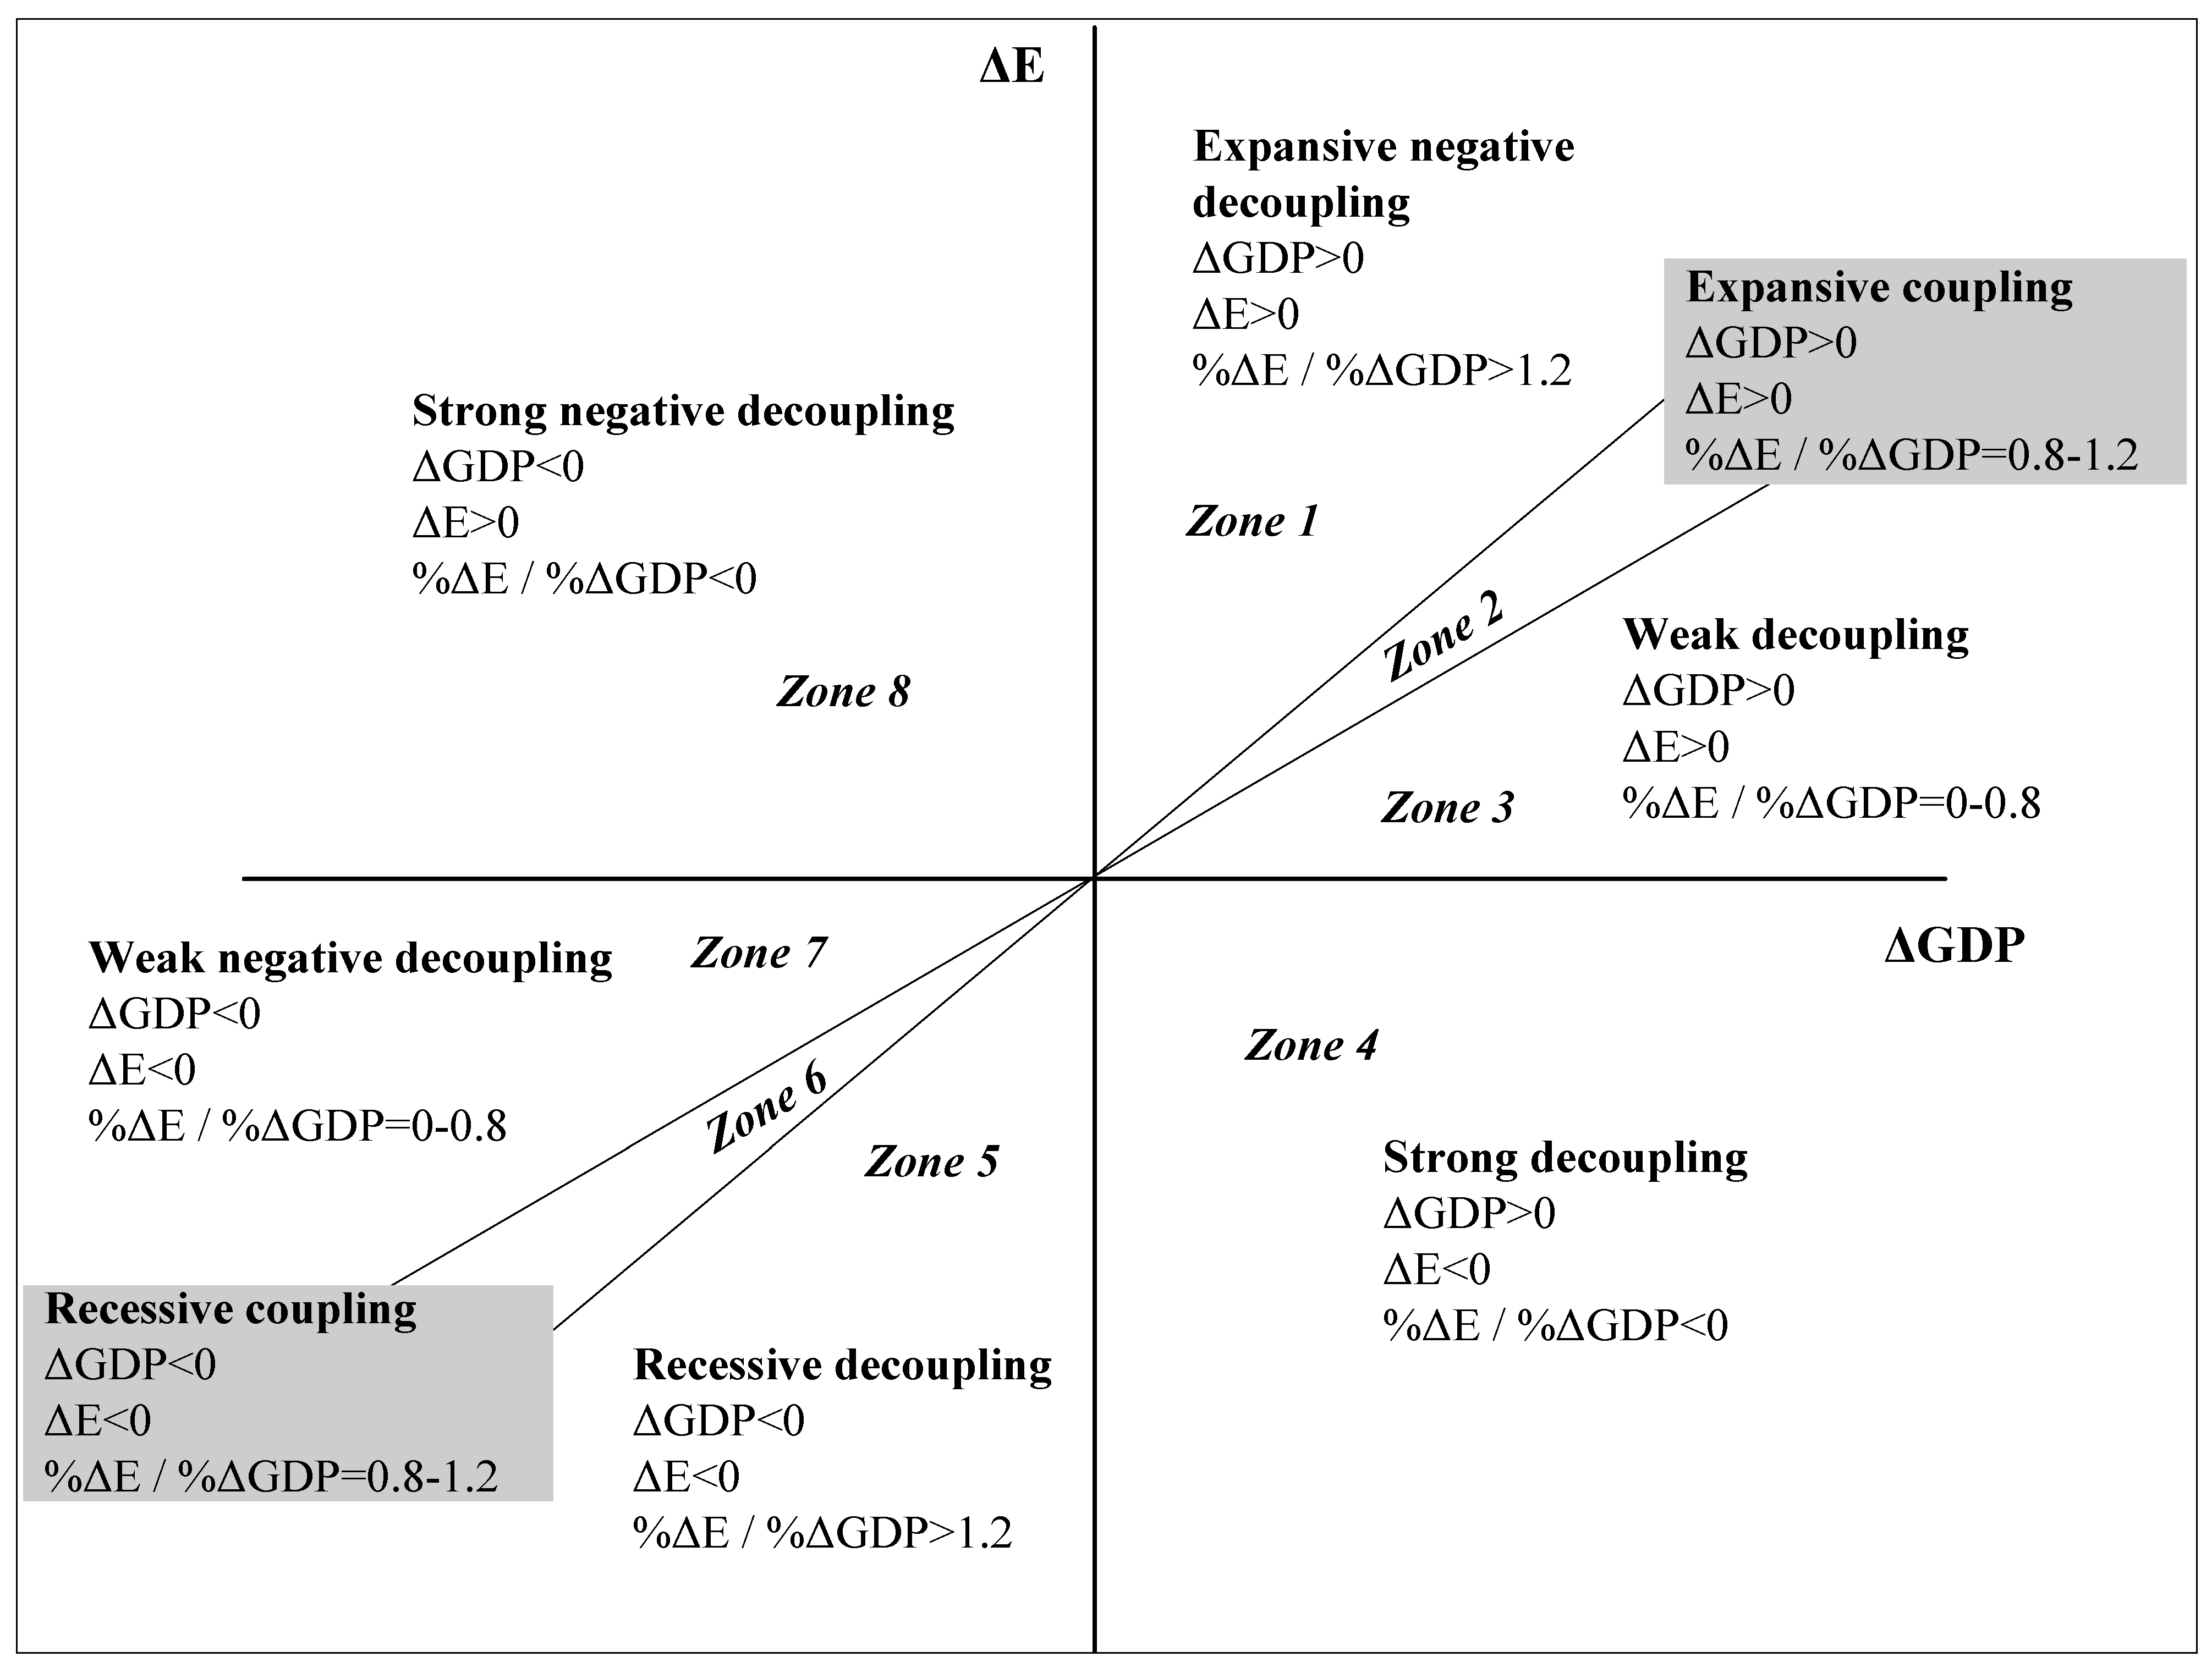
2.3.2. Decoupling

3. Results
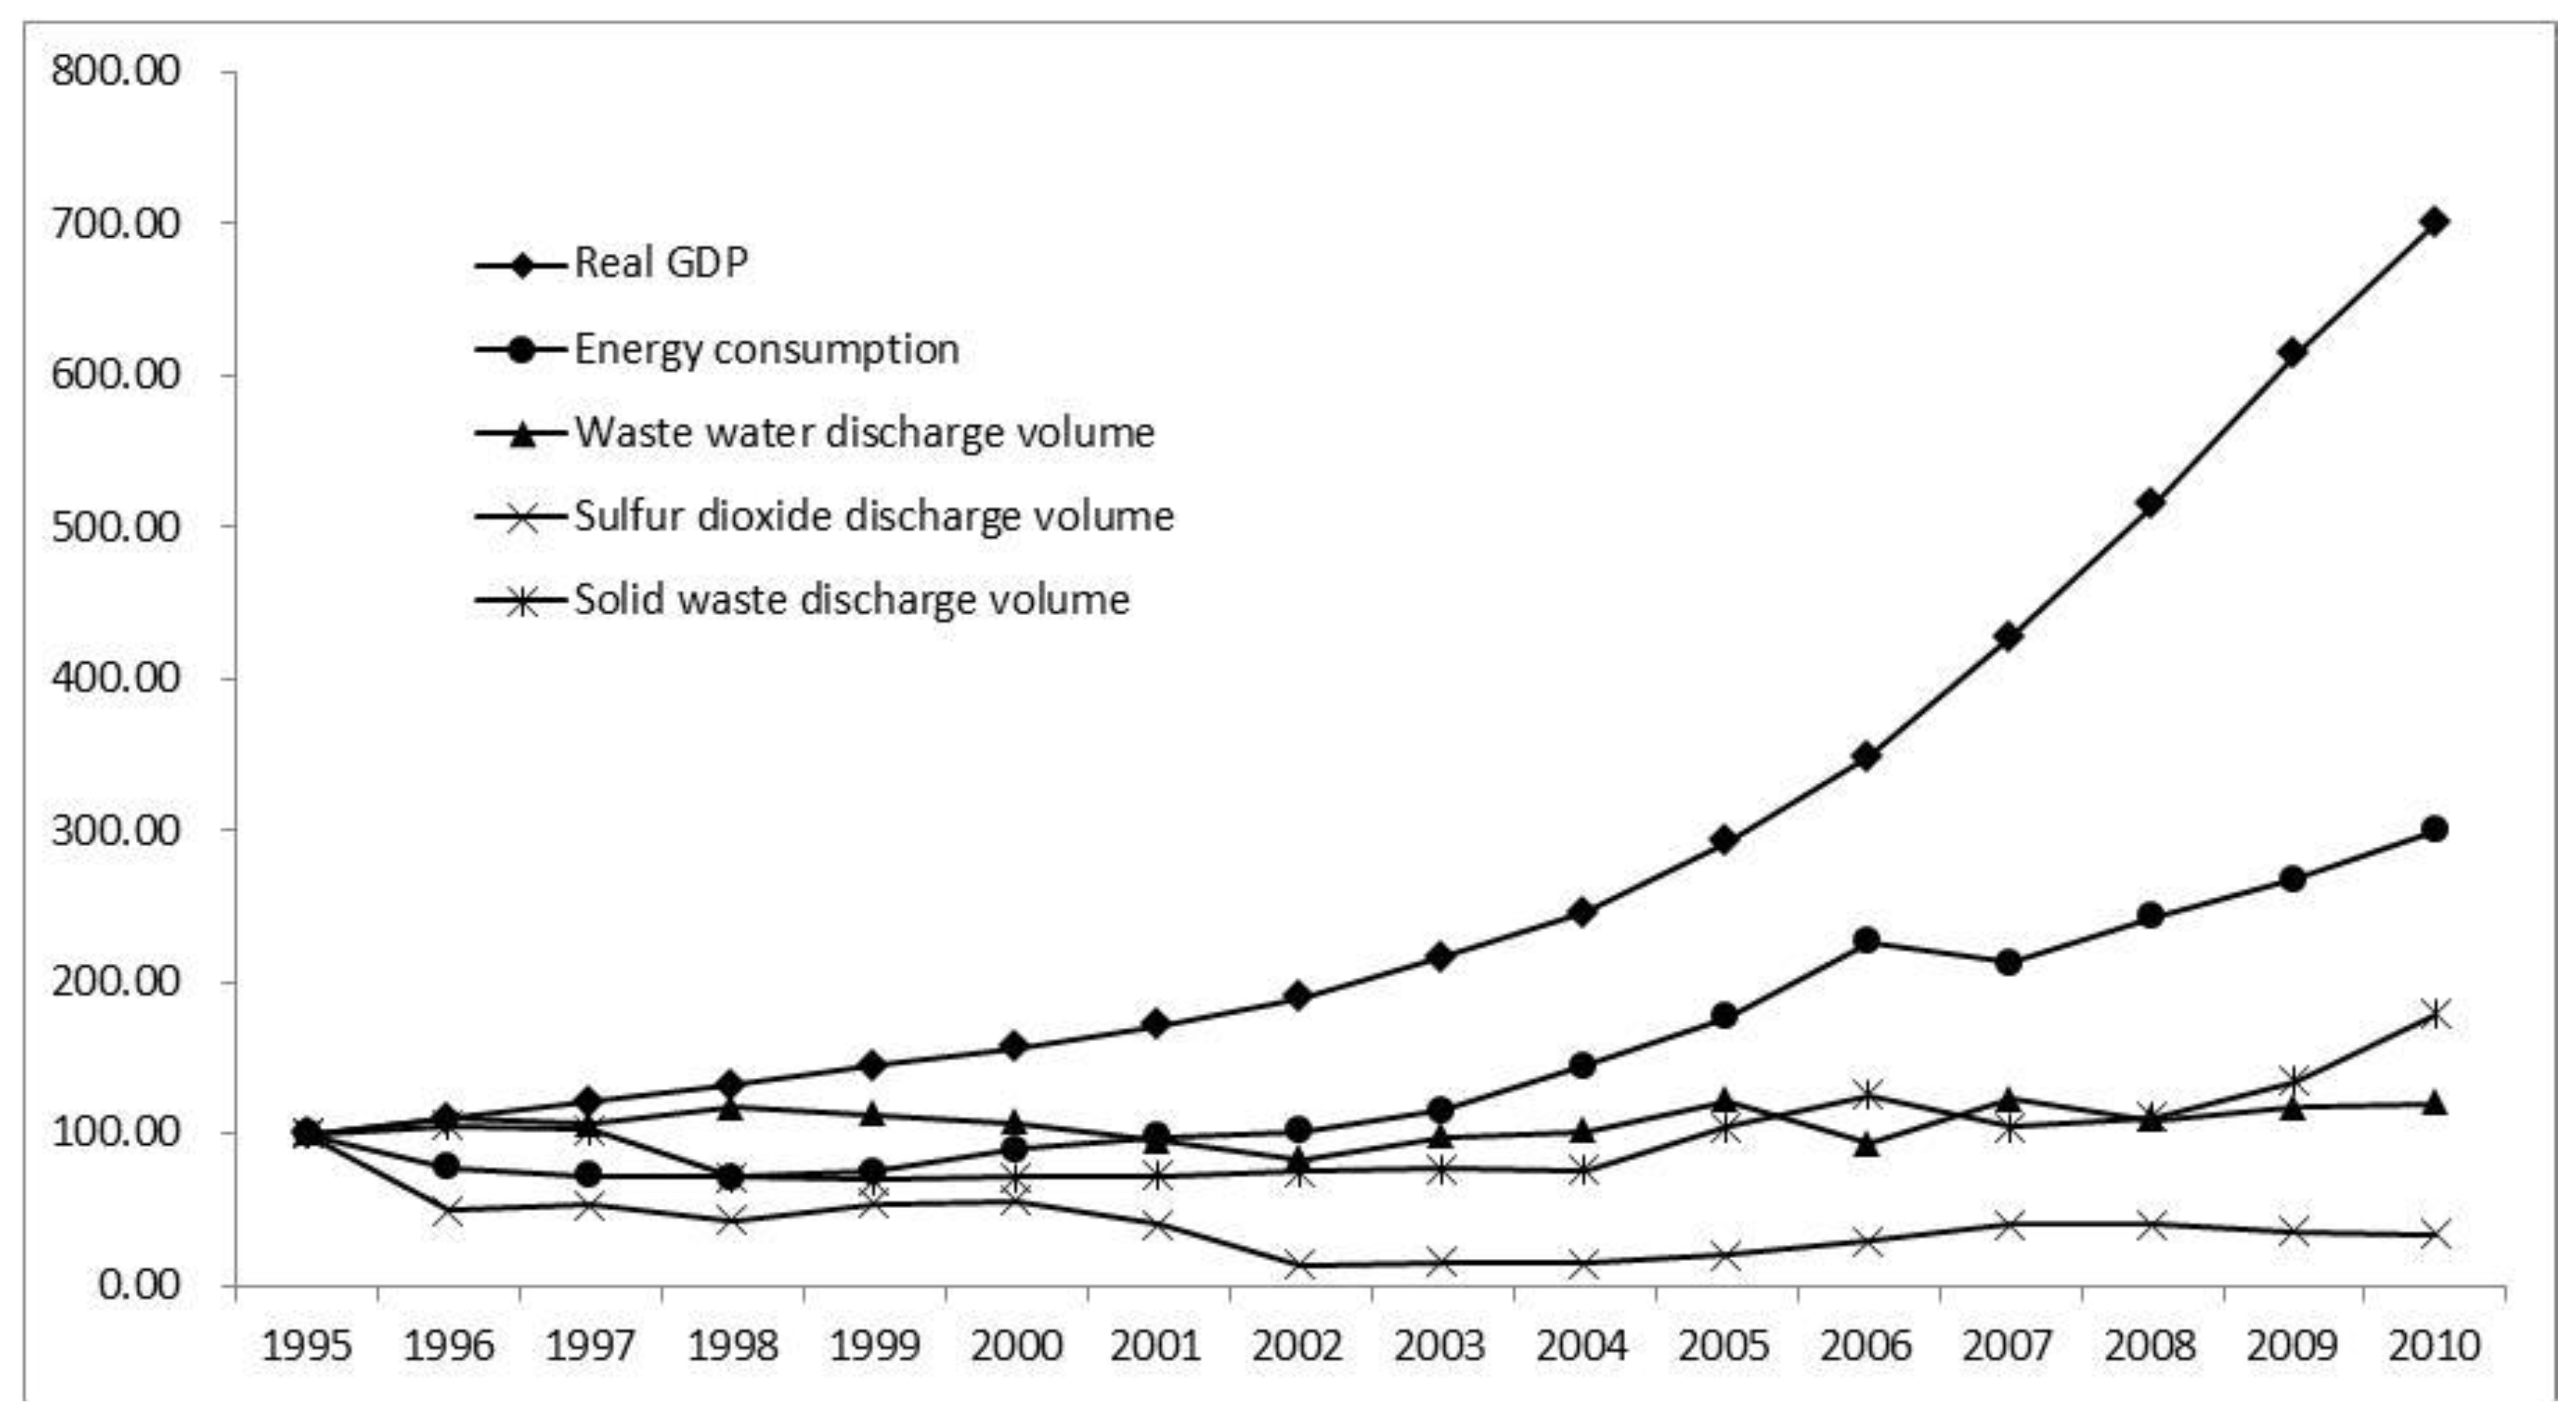
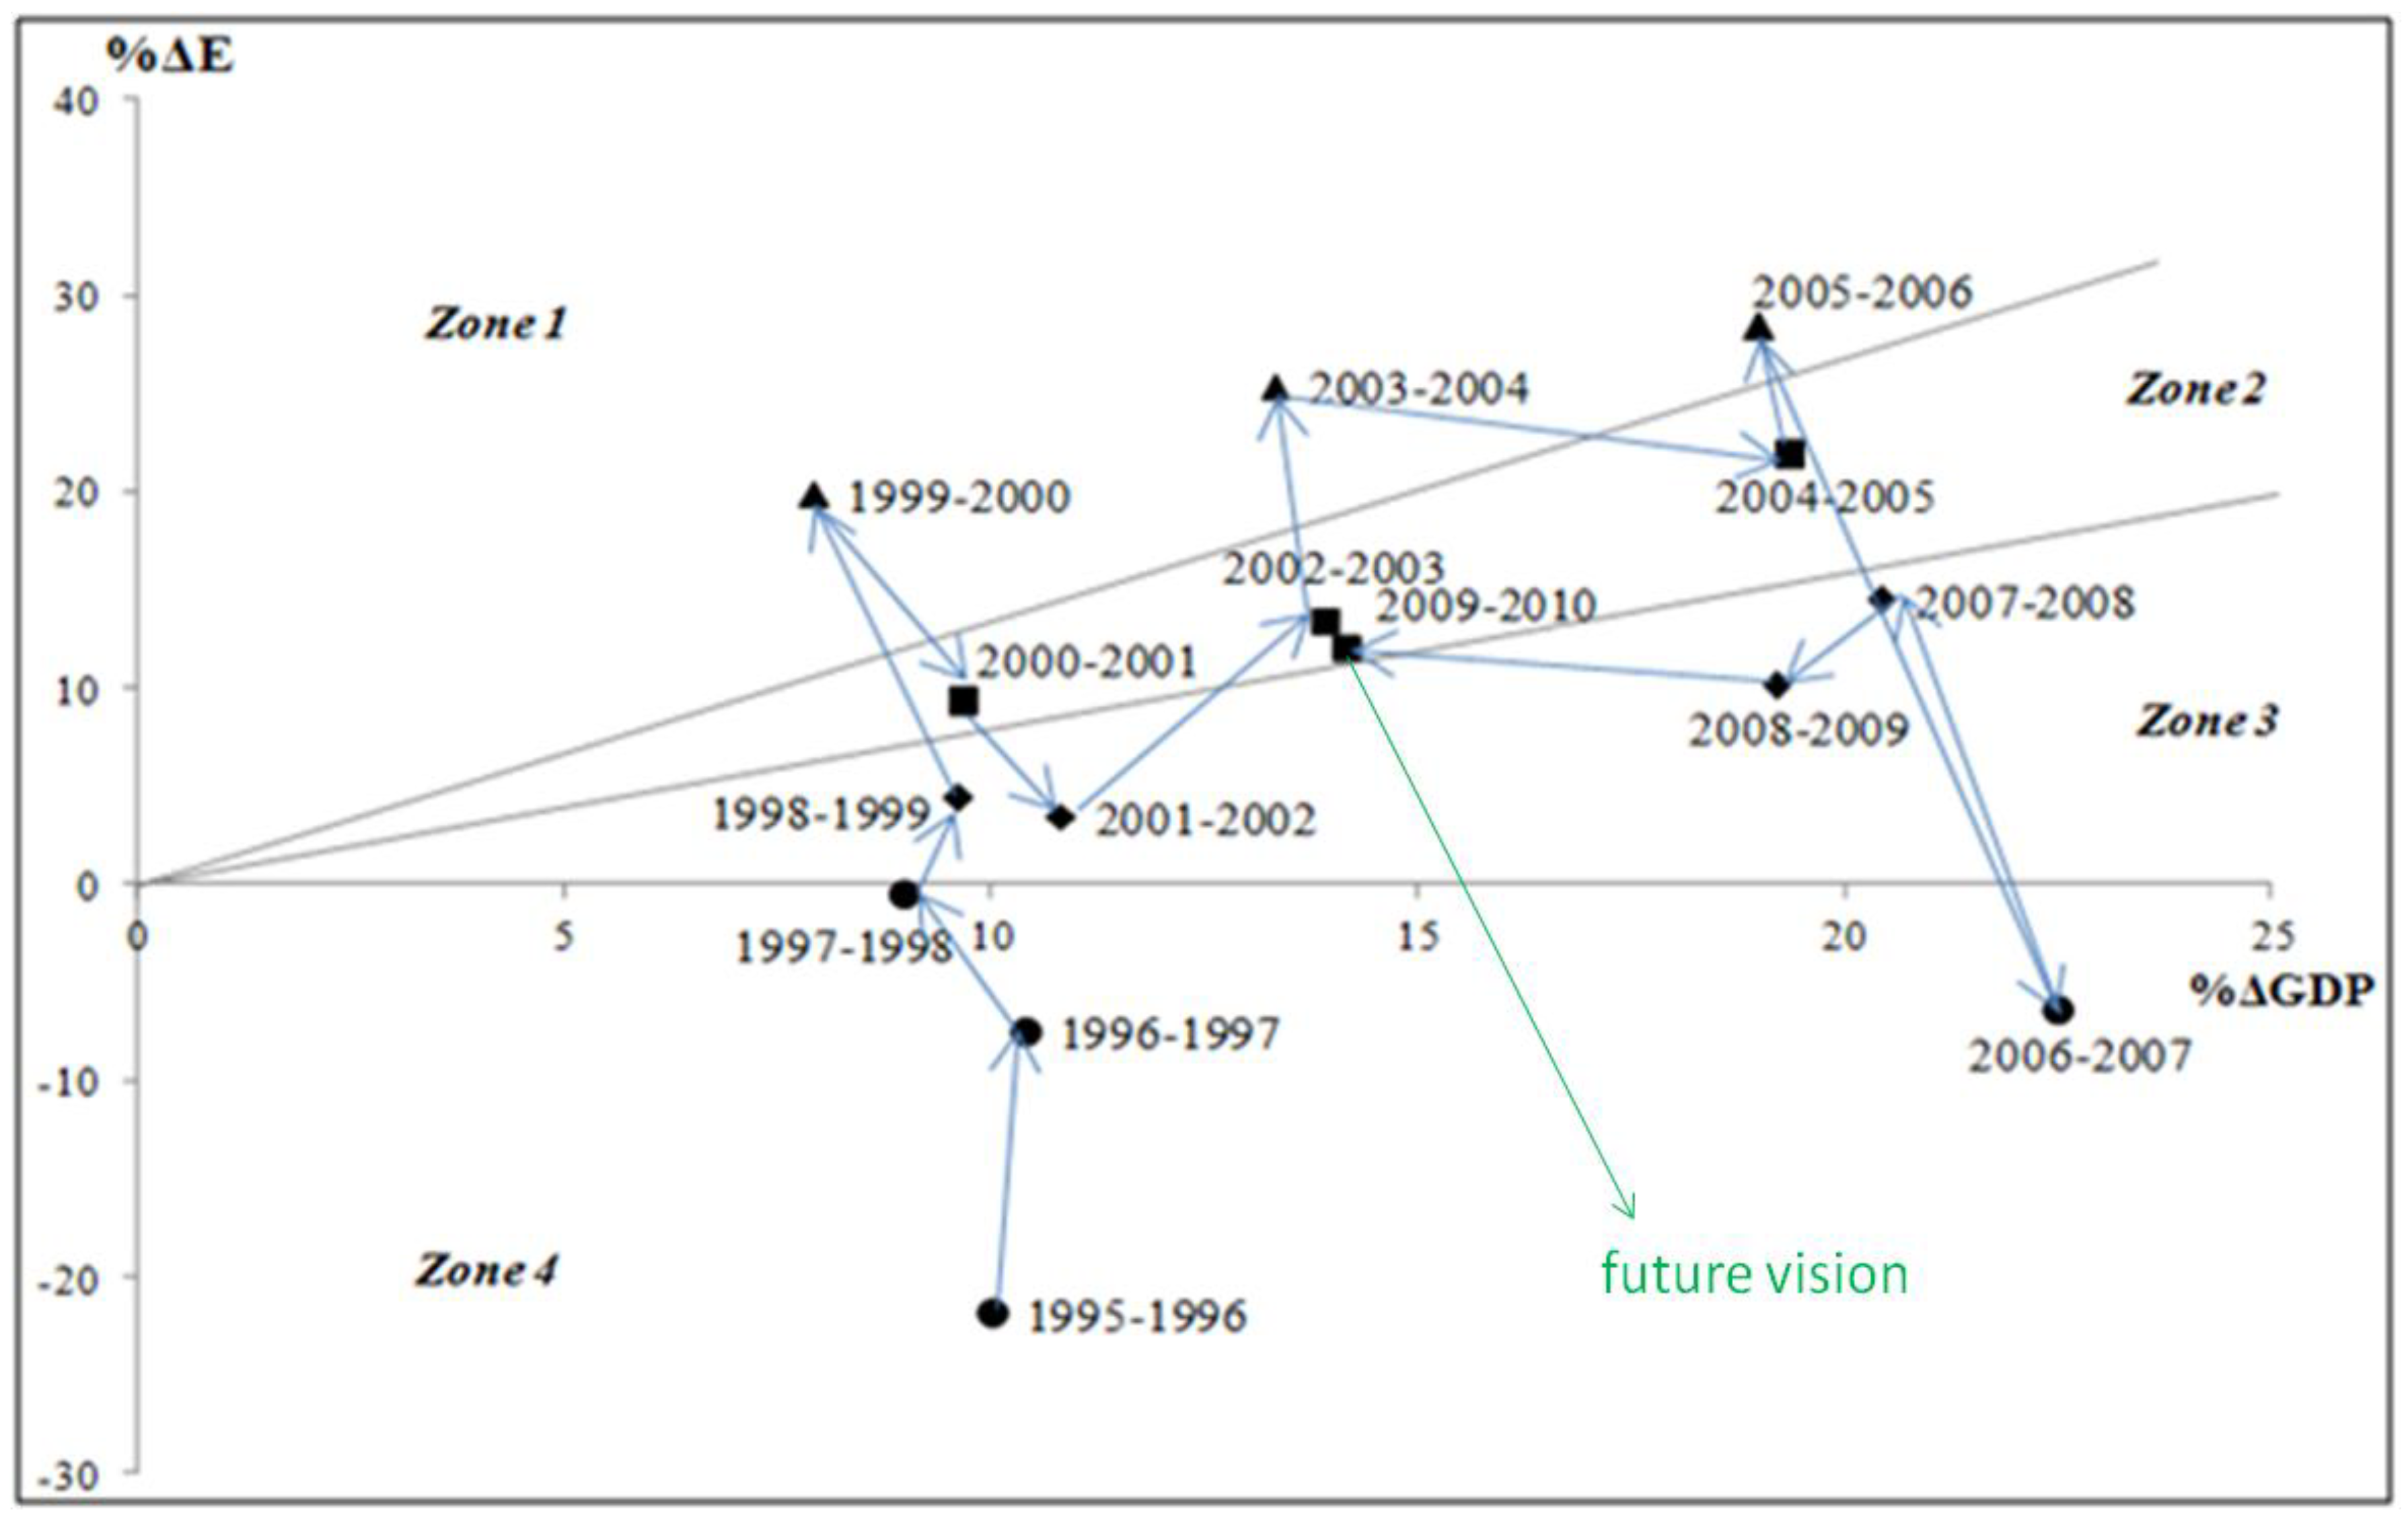
3.1. Decoupling in Shenyang City


3.2. Efficiency Analysis
| Items | |||||
|---|---|---|---|---|---|
| Non-renewable resources for agricultural activities (NRR) | sej | 1.87 × 10²¹ | 2.20 × 10²¹ | 4.45 × 10²¹ | 5.44 × 10²¹ |
| Energy consumption for industrial activities (EoE) | sej | 2.09 × 10²² | 2.32 × 10²² | 3.03 × 10²² | 9.41 × 10²² |
| Total Resources Consumption (TRC) | sej | 2.28 × 10²² | 2.54 × 10²² | 3.48 × 10²² | 9.95 × 10²² |
| Solid waste (Esw) | sej | 8.54 × 10²² | 3.60 × 10²² | 5.11 × 10²² | 2.15 × 10²⁰ |
| Waste water (Eww) | sej | 2.90 × 10²¹ | 1.86 × 10²¹ | 2.11 × 10²¹ | 2.08 × 10²¹ |
| Waste gas (Ewg) | sej | 8.39 × 10²¹ | 3.07 × 10²¹ | 1.64 × 10²² | 8.69 × 10²¹ |
| Total Waste Emergy (WE) | sej | 9.67 × 10²² | 4.09 × 10²² | 6.96 × 10²² | 1.10 × 10²² |
| Real GDP (RG) | Yuan | 6.73 × 10¹⁰ | 1.05 × 10¹¹ | 1.97 × 10¹¹ | 4.71 × 10¹¹ |
| Economic-Efficiency (EE) | Yuan/sej | 2.95 × 10⁻¹² | 4.15 × 10⁻¹² | 5.68 × 10⁻¹² | 4.73 × 10⁻¹² |
| Environmental-pressure(EP) | sej/Yuan | 1.44 × 10¹² | 3.88 × 10¹¹ | 3.52 × 10¹¹ | 2.33 × 10¹⁰ |
3.3. Cost Analysis
| Indicators | Unit | 1995 | 2000 | 2005 | 2010 |
|---|---|---|---|---|---|
| Environmental protection investment (EPI) | Yuan | 1.86 × 10⁸ | 1.06 × 10⁸ | 6.86 × 10⁷ | 6.41 × 10⁷ |
| Employment (EPM) | capita | 2.55 × 10⁶ | 2.07 × 10⁶ | 1.62 × 10⁶ | 1.48 × 10⁶ |
| Indicators | unit | 1995–2000 | 2005–2010 |
|---|---|---|---|
| Δ(NRR + EoE) | sej | 2.54 × 10²¹ | 6.47 × 10²² |
| ΔRG | Yuan | 3.81 × 10¹¹ | 2.74 × 10¹¹ |
| ΔFYE | sej/Yuan | 6.68 × 10¹¹ | 2.36 × 10¹¹ |
| ΔEPI | Yuan | −8.04 × 10⁷ | −4.49 × 10⁷ |
| ΔEPM | Yuan | −4.80 × 10⁵ | −1.40 × 10⁵ |
| IfD | Yuan | 1.20 × 10⁻³ | 1.91 × 10⁻⁵ |
| JfD | Person | −0.72 × 10⁻⁶ | −0.59 × 10⁻⁶ |
4. Conclusions
Acknowledgments
Author Contributions
Conflicts of Interest
References
- Zhang, Y.; Zhang, J.Y.; Yang, Z.; Li, S. Regional differences in the factors that influence China’s energy-related carbon emissions, and potential mitigation strategies. Energy Policy 2011, 39, 7712–7718. [Google Scholar] [CrossRef]
- United Nations, Department of Economic and Social Affairs. World Urbanization Prospects, the 2011 Revision. Available online: http://esa.un.org/unup/index.html (accessed on 2 January 2014).
- Xue, B.; Chen, X.; Geng, Y.; Guo, X.; Lu, C.P.; Zhang, Z.; Lu, C. Survey of officials’ awareness on circular economy development in China: based on municipal and county level. Resour. Conservat. Recycl. 2010, 54, 1296–1302. [Google Scholar] [CrossRef]
- Xue, B.; Li, C.; Liu, Z.; Geng, Y.; Xi, F. Analysis on CO2 emission and urbanization at global level during 1970–2007. Adv. Clim. Change Res. 2011, 7, 423–427. [Google Scholar]
- Xue, B.; Geng, Y.; Ren, W.; Zhang, Z.; Zhang, W.; Lu, C.; Chen, X. An overview of municipal solid waste management in Inner Mongolia Autonomous Region of China. J. Mater. Cycles Waste Manag. 2011, 13, 283–292. [Google Scholar] [CrossRef]
- Geng, Y.; Sarkis, J.; Ulgiati, S.; Zhang, P. Measuring China’s circular economy. Science 2013, 339, 1526–1527. [Google Scholar] [CrossRef]
- Kissinger, M.; Sussman, C.; Moore, J.; Rees, W.E. Accounting for the ecological footprint of materials in consumer goods at the urban scale. Sustainability 2013, 5, 1960–1973. [Google Scholar] [CrossRef]
- Ren, W.; Xue, B.; Zhang, L.; Ma, Z.; Geng, Y. Temporal-spatial analysis on air pollution index in China’s megacities. Chin. J. Ecol. 2013, 32, 2788–2796. [Google Scholar]
- Sorrell, S. Energy, economic growth and environmental sustainability: Five propositions. Sustainability 2010, 2, 1784–1809. [Google Scholar] [CrossRef]
- Santos-Martín, F.; Martín-López, B.; García-Llorente, M.; Aguado, M.; Benayas, J.; Montes, C. Unraveling the relationships between ecosystems and human wellbeing in Spain. PLoS One 2013, 8. Article e73249. [Google Scholar]
- Liu, H.; Zhou, G.; Wennersten, R.; Frostell, B. Analysis of sustainable urban development approaches in China. Habitat Int. 2014, 41, 24–32. [Google Scholar] [CrossRef]
- Rees, W.E. The conundrum of urban sustainability. In How Green Is the City? Sustainability Assessment and the Management of Urban Environments; Devuyst, D., Hens, L., de Lannoy, W., Eds.; Columbia University Press: New York, NY, USA, 2001; pp. 37–42. [Google Scholar]
- Li, Y.; Chen, W.; Chang, G. China’s environmental polices evolution and circular economy development: Their implications to realize ecological modernization. China Popul. Res. Environ. 2008, 18, 12–18. [Google Scholar]
- Hiremath, R.B.; Balachandra, P.; Kumar, B.; Bansode, S.; Murali, J. Indicator-based urban sustainability—a review. Energy Sustain. Dev. 2013, 17, 555–563. [Google Scholar] [CrossRef]
- Voula, M.; Pedersen, J. Urban sustainability indicators. Available online: http://eurofound.europa.eu/pubdocs/1998/07/en/1/ef9807en.pdf (accessed on 2 January 2014).
- National Statistical Institute of Italy. Environmental Sustainability Indicators in Urban Areas: An Italian Experience. In Proceedings of the European Statisticians, Joint ECE/Eurostat Work Session on Methodological Issues of Environment Statistics, Ottawa, ON, Canada, 1–4 October 2001.
- Moreno, S.H.; Martínez, J. Indicators of urban sustainability in Mexico. Theor. Empir. Res. Urban Manag. 2010, 5, 46–60. [Google Scholar]
- Lynch, A.J.; Andreason, S.; Eisenman, T.; Robinson, J.; Steif, B. Sustainable urban development indicators for the United States. Available online: http://www.penniur.upenn.edu/uploads/media_items/sustainable-urban-development-indicators-for-the-united-states.original.pdf (accessed on 2 January 2014).
- Organization for Economic Co-operation and Development (OECD). OECD Environmental Strategy for the First Decade of the 21st Century. Available online: http://www.oecd.org/dataoecd/33/40/1863539.pdf (accessed on 2 January 2014).
- Zhang, Z. Decoupling China’s carbon emissions increase from economic growth: An economic analysis and policy implications. World Dev. 2000, 28, 739–752. [Google Scholar] [CrossRef]
- Organization for Economic Co-operation and Development (OECD). Indicators to Measure Decoupling of Environmental Pressure from Economic Growth. Available online: http://www.olis.oecd.org/olis/2002doc.nsf/LinkTo/sg-sd(2002)1-final (accessed on 2 January 2014).
- Yu, Y.; Chen, D.; Zhu, B.; Hu, S. Eco-efficiency trends in China, 1978–2010: Decoupling environmental pressure from economic growth. Ecol. Indic. 2013, 24, 177–184. [Google Scholar] [CrossRef]
- Bringezu, S.; Schutz, H.; Steger, S.; Baudisch, J. International comparison of resource use and its relation to economic growth—the development of total material requirement, direct material inputs and hidden flows and the structure of TMR. Ecol. Econ. 2004, 51, 97–124. [Google Scholar] [CrossRef]
- Sjostrom, M.; Ostblom, G. Decoupling waste generation from economic growth—a CGE analysis of the Swedish case. Ecol. Econ. 2010, 69, 1545–1552. [Google Scholar] [CrossRef]
- Browna, M.T.; Ulgiati, S. Understanding the global economic crisis: A biophysical perspective. Ecol. Model. 2011, 223, 4–13. [Google Scholar] [CrossRef]
- Brown, M.T.; Herendeen, R.A. Embodied energy analysis and emergy analysis: A comparative view. Ecol. Econ. 1996, 19, 219–235. [Google Scholar] [CrossRef]
- Mu, H.; Feng, X.; Chu, K. Improved emergy indices for the evaluation of industrial systems incorporating. Ecol. Eng. 2011, 37, 335–342. [Google Scholar] [CrossRef]
- Shenyang Municipal Government. Shenyang Statistics Yearbook 1995\2000\2006\2011; Shenyang Press: Shenyang, China, 2013.
- National Statistical Bureau of China. Available online: http://www.stats.gov.cn/ (accessed on 2 January 2014). (In Chinese)
- Cuadra, M.; Rydberg, T. Energy evaluation on the production, processing and export of coffee in Nicaragua. Ecol. Model. 2006, 196, 421–433. [Google Scholar] [CrossRef]
- Lan, S.F.; Qin, P.; Lu, H. Emergy Synthesis of Ecological Economic Systems; Chemical Industrial Press: Beijing, China, 2002; pp. 335–336. [Google Scholar]
- Brandt-Williams, S.L. Handbook of Emergy Evaluation—A Compendium of Data for Emergy Computation Issued in a Series of Folios: Folio #4 (2nd printing): Emergy of_Florida Agriculture. Available online: http://cep.ees.ufl.edu/emergy/documents/folios/Folio_04.pdf (accessed on 2 January 2014).
- Bastianoni, S.; Campbell, D.E.; Ridolfi, R.; Pulselli, F.M. The solar transformity of petroleum fuels. Ecol. Model. 2009, 220, 40–50. [Google Scholar] [CrossRef]
- Brown, M.T.; Ulgiati, S. Updated evaluation of exergy and emergy driving the geobiosphere: A review and refinement of the emergy baseline. Ecol. Model. 2010, 221, 2501–2508. [Google Scholar] [CrossRef]
- Odum, H.T. Environmental Accounting, Emergy and Environmental Decision Making. John Wiley & Sons: Hoboken, NJ, USA, 1996. Available online: http://dieoff.com/emergy.pdf (accessed on 2 January 2014).
- Brown, M.T.; Protano, G.; Ulgiati, S. Assessing geobiosphere work of generating global reserves of coal, crude oil, and natural gas. Ecol. Model. 2010, 222, 879–887. [Google Scholar] [CrossRef]
- Riposo, D. Integrated Energy and Environmental Analysis of Utility Scale Wind Power Production. Master Thesis, University of Maryland, College Park, MD, USA, 2008. [Google Scholar]
- Zhou, J.B.; Jiang, M.M.; Chen, B. Emergy evaluations for constructed wetland and conventional wastewater treatments. Commun. Nonlinear Sci. Numer. Simulat. 2009, 14, 1781–1789. [Google Scholar] [CrossRef]
- Zhang, L.X.; Chen, B.; Yang, Z.F.; Chen, G.Q.; Jiang, M.M.; Liu, G.Y. Comparison of typical mega cities in China using emergy synthesis. Commun. Nonlinear Sci. Numer. Simulat. 2009, 14, 2827–2836. [Google Scholar] [CrossRef]
- Tapio, P. Towards a theory of decoupling: Degrees of decoupling in the EU and the case of road traffic in Finland between 1970 and 2001. Transp. Policy 2005, 12, 137–151. [Google Scholar] [CrossRef]
- Vehmas, J.; Malaska, P.; Luukkanen, J.; Kaivo-oja, J.; Hietanen, O.; Vinnari, M.; lvonen, J. Europe in the Global Battle of Sustainability: Rebound Strikes Back? Advanced Sustainability Analysis; Turun Kauppakorkeakoulu: Turku, Finland, 2003. [Google Scholar]
- Ren, W.; Xue, B.; Geng, Y.; Sun, L.; Ma, Z.; Zhang, Y.; Mitchell, B.; Zhang, L. Inventorying heavy metal pollution in redeveloped brownfield and its policy contribution: case study from Tiexi district, China. Land Use Policy 2014, 38, 138–146. [Google Scholar] [CrossRef]
- Xue, B.; Mitchell, B.; Geng, Y.; Ren, W.; Müller, K.; Ma, Z.; Puppim de Oliveira, J.A.; Fujita, T.; Tobias, M. A review on China’s pollutant emissions reduction assessment. Ecol. Indicat. 2014, 38, 272–278. [Google Scholar] [CrossRef]
- Ren, W.; Geng, Y.; Xue, B.; Fujita, T.; Ma, Z.; Jiang, P. Pursuing co-benefits in China’s old industrial base: A case of Shenyang. Urban Clim. 2012, 1, 55–64. [Google Scholar] [CrossRef]
© 2014 by the authors; licensee MDPI, Basel, Switzerland. This article is an open access article distributed under the terms and conditions of the Creative Commons Attribution license (http://creativecommons.org/licenses/by/3.0/).
Share and Cite
Zhang, L.; Xue, B.; Geng, Y.; Ren, W.; Lu, C. Emergy-Based City’s Sustainability and Decoupling Assessment: Indicators, Features and Findings. Sustainability 2014, 6, 952-966. https://0-doi-org.brum.beds.ac.uk/10.3390/su6020952
Zhang L, Xue B, Geng Y, Ren W, Lu C. Emergy-Based City’s Sustainability and Decoupling Assessment: Indicators, Features and Findings. Sustainability. 2014; 6(2):952-966. https://0-doi-org.brum.beds.ac.uk/10.3390/su6020952
Chicago/Turabian StyleZhang, Liming, Bing Xue, Yong Geng, Wanxia Ren, and Chengpeng Lu. 2014. "Emergy-Based City’s Sustainability and Decoupling Assessment: Indicators, Features and Findings" Sustainability 6, no. 2: 952-966. https://0-doi-org.brum.beds.ac.uk/10.3390/su6020952