Article

Integrated Metrics for Improving the Life Cycle Approach to Assessing Product System Sustainability

1
US Environmental Protection Agency, National Risk Management Laboratory, 26 W Martin Luther King Drive, Cincinnati, OH 45268, USA
2
Global Product Stewardship and Product Supply, The Procter & Gamble Company, Cincinnati, OH 45268, USA
*
Author to whom correspondence should be addressed.
Sustainability 2014, 6(3), 1386-1413; https://0-doi-org.brum.beds.ac.uk/10.3390/su6031386
Submission received: 31 December 2013 / Revised: 7 March 2014 / Accepted: 10 March 2014 / Published: 19 March 2014

Abstract

:
Life cycle approaches are critical for identifying and reducing environmental burdens of products. While these methods can indicate potential environmental impacts of a product, current Life Cycle Assessment (LCA) methods fail to integrate the multiple impacts of a system into unified measures of social, economic or environmental performance related to sustainability. Integrated metrics that combine multiple aspects of system performance based on a common scientific or economic principle have proven to be valuable for sustainability evaluation. In this work, we propose methods of adapting four integrated metrics for use with LCAs of product systems: ecological footprint, emergy, green net value added, and Fisher information. These metrics provide information on the full product system in land, energy, monetary equivalents, and as a unitless information index; each bundled with one or more indicators for reporting. When used together and for relative comparison, integrated metrics provide a broader coverage of sustainability aspects from multiple theoretical perspectives that is more likely to illuminate potential issues than individual impact indicators. These integrated metrics are recommended for use in combination with traditional indicators used in LCA. Future work will test and demonstrate the value of using these integrated metrics and combinations to assess product system sustainability.

1. Introduction

1.1. Background

While the global production and consumption of goods and services are meeting the critical needs of populations and driving economies, there are numerous indications that these activities are occurring in an unsustainable fashion. This is exemplified by the fact that humans occupy nearly one third of the global terrestrial net primary production of the Earth [1], and there is serious concern that human consumption will outstrip the productive capacity of the Earth over the coming decades [2]. Further, the Global Footprint Network estimated that the global ecological footprint overshot the biocapacity of the Earth in the late 1970s [3]. Hence, it is clear that there must be a shift in consumption and production patterns worldwide.
The need to both assess and improve methods of production and consumption was recognized at the World Summit on Sustainable Development in Johannesburg in 2010, and incorporated into the Johannesburg Plan of Implementation under the heading of Sustainable Production and Consumption. This plan was renewed and reinstituted in the 10-Year Framework of Programs at the 2012 Rio+20 Conference on Sustainable Development [4]. It purports the need to use life cycle approaches (clause I.vii), which have been widely-established as essential in assessing the environmental sustainability of product systems. Results of life cycle approaches are critically informative to avoid the burden-shifting that can occur when attempting to mitigate a single source of environmental damage (e.g., the effort to resolve an air pollution problem spawns a water contamination issue).
The use of life cycle approaches has been recommended recently by two National Academy of Sciences (NAS) panels: one on Sustainability and the U.S. Environmental Protection Agency (EPA) [5] and another addressing EPA science needs for addressing 21st-century environmental problems [6]. The panels furthermore both strongly advocated that U.S. EPA use system approaches to assess sustainability, and develop appropriate sets of indicators to measure progress towards sustainability. In theory, such approaches or indicators can be applied to any system, like an ecosystem, an organization, or the sustainable innovation and production of a consumer product, the eventual subject of our research. In the realm of products, while the benefit to improving product sustainability may be shared by all those directly (e.g., consumers) or indirectly (e.g., a community in which a product life cycle stage occurs) affected by the product systems, we hypothesize that approaches and indicators will have particular value to industry because of their potential leverage over the most aspects of the product life cycle. As sustainability embodies the assessment of multiple facets and dimensions of a system, this paper explores a set of metrics that may give insight into new linkages and interactions of product system parts with each other, and with other systems, and ways to identify and mitigate unsustainable outcomes. Each metric captures fundamental properties of the product system and while they are computed separately and not combined, when evaluated they provide a means of assessing sustainability from multiple dimensions. Identification of these approaches and metrics is the initial objective of a research partnership between the U.S. EPA and The Procter & Gamble Company to develop systems to enable economically, socially, and environmentally sustainable innovation in product design and production. It is hoped that new life cycle-related system approaches, like those based on the integrated metrics presented here, will clarify relationships within innovation and production systems, and lead to proactive solutions for potential problems associated with increasing resource use and impacts to people and ecosystems. We begin with an overview of the current use of life cycle assessment and associated life cycle impact indicators to evaluate product systems, to establish a context and need for the introduction of additional metrics to further expand and improve upon this approach.

1.2. Life Cycle Assessment of Product Systems

Life cycle assessment (LCA) is a standardized framework for assessing the environmental impacts of products by taking into account impacts associated with all stages of a product life cycle, beginning with resource extraction for all materials and energy sources used in making a product, and continuing through the use and ultimate disposal of a product and intermediate wastes [7]. LCA is a multi-step process, prescribed by international standard guidelines, that typically includes a life cycle impact assessment (LCIA) [8] in which the impacts of the environmental releases generated and resources used are evaluated for the total system, or a part of the system (e.g., a single process). Numerous methodologies exist for LCIA each including a set of impact categories (e.g., ozone depletion, water use, human health impact of criteria pollutants). Each release or resources used in the product system is classified into one or more impact categories, based on known (or suspected) potential for impact in that category, and then its impact is characterized based on its relative stress for that category (e.g., for global warming potential 1 kg CO2 = 1 kg CO2-eq whereas 1 kg CH4 = 25 kg CO2-eq). Once all emissions or resources are characterized for a given impact category, the total impact of the product system in that category can be estimated [9], typically as a sum of the characterized emissions for an impact category. This procedure is replicated for all the impact categories in a methodology (sometimes 10 or more) to provide an estimate of potential environmental stress caused by a product in multiple categories. These estimates of environmental stress are typically called midpoint indicators. Some LCIA methodologies provide characterization of emissions that include more than just environmental stresses— they include estimates of specific impacts, e.g., called endpoints [9]. Some methodologies further aggregate midpoint and or endpoint impacts into areas of protection typically including human health, ecosystems, infrastructure, and resource stocks. These methodologies provide what are known as damage indicators. Damage indicators may be further combined based on value judgements of their perceived importance into a single score.
Figure 1 provides an example of an LCIA methodology for ozone depleting substances. These are characterized based on potency using a midpoint indicator (i.e., Ozone Depletion Potential). Endpoint/damage methodologies extend beyond the midpoint analysis and use modeling assumptions and value choices to forecast the quantity of future human health impacts (e.g., skin cancer) that may relate to these specific emissions. These calculations are usually aggregated with other human health impacts to a common unit of damage (e.g., disability adjusted life years (DALYs)). As illustrated in Figure 1, there are many pathways leading to potential impact) which are currently too difficult to estimate (e.g., immune system suppression, marine life damage). In these cases, the endpoint effects are not calculated and thus are not included in the endpoint/damage analysis.
Figure 1. Illustration of an LCIA methodology for stratospheric ozone depleting substances [10].
Sustainability 06 01386 g001
Beyond tracking the previously mentioned environmental impacts, there has also been some effort to provide information relevant for understanding economic and social outcomes. UNEP-SETAC and others have published international guidelines to assist with the harmonization of practices for social LCA (SLCA) and life cycle sustainability assessment (LCSA) [11,12,13] and a number of groups offer approaches for assessing outcomes beyond those addressed by the LCIA methods previously described. Some authors have explored the integration of techniques developed for the purpose of cost benefit analysis to augment existing LCA models [5,14,15] while others have proposed the use of an LCA-like framework for tracking the interactions between actors within a supply chain and the society within which they operate [11,16] in order to track impacts such as human dignity and well being [17,18]. Some authors propose to accomplish this using indicators which are relatively new to the field of LCA, such as those related to payments for labor [19], while others attempt to express social outcomes in terms of existing human health indicators based on relationships to societal conditions [20]. Social LCA or life cycle sustainability assessment is a young field and a diverse array of indicators are currently discussed [11,21,22,23]. Data availability poses a key challenge for SLCA/LCSA as do decisions regarding which indicators to include and how best to interpret multiple indicators [11,24].
While using LCIA indicators and those described for social LCA can provide a rich set of information regarding the potential environmental, economic and social impacts of a product system, there are further steps that can be taken to aid interpretation. Normalizing the results for each impact category may be useful for better understanding the relevance of impacts in respect to a region or population. Usually, this involves an external normalization database which provides a regional perspective [25], but does not demonstrate which impacts are more relevant for sustainability. ReCiPe, Eco-indicator 99 [26], and LIME [27] are LCIA methodologies that provide endpoint characterization and include an additional step of grouping and weighting LCIA indicators into damage indicators and then a single score. Although such an approach may better facilitate comparisons, this process inevitably involves judgments that are subject to errors, bias, and misconceptions [10,28,29,30,31].
LCIA methodologies, while providing information on multiple impacts, are limited by the models for impact characterization available [32] and, therefore, do not always represent a comprehensive measure of all, or even the most significant potential impacts of a given product system. LCIA is still in development, but at the same time, there is a need to employ additional indicators that relate the performance of a system more closely to sustainability measures.

2. Integrated Metrics for Product System Analysis

The use of LCIA methodologies, life cycle costing, and proposed new social LCA indicators provide sets of midpoint and endpoint indicators for product systems that have proven valuable in assessing the potential environmental and to a more limited extent economic and social impacts of products in a consistent framework, particularly by creating linkages between production and consumption processes and environmental stressors, costs, and social hotspots. However, performing LCA with conventional environment (LCIA) indicators—and further even supplementing these with social and economic indicators (LCSA)—does not provide a sufficient measure of product system sustainability because the independent impact measures are not combined using algorithms based on overarching sustainability principles, such as living within resource limitations (energetic or land-based), maintaining order and resilience, or creating economic value. Here, selected metrics (In this paper, we refer to metrics as general methods of quantitative assessment (renewable energy used measured in J), whereas indicators are specific applications of metrics to a context (renewable energy used (J)/kg output) [5].) are defined and described for application to assessment of product system sustainability.

2.1. Definition of Integrated Metrics

Due to the lack of scientific means to integrate different impacts, LCIA (environmental) and related economic and social indicators must be supplemented with additional metrics for product sustainability assessment. Indicators from these methodologies may be useful for identifying specific environmental, economic and social impacts of products, but they fall short of integrating those impacts into metric that provides information on system condition or health.
Integrated metrics may be defined as measures of system health or effect, which integrate multiple impacts into a single unit of measure based on a common scientific or economic principle, and give consideration to the full system of interest in respect to its environmental, social and/or economic context. In previous work integrated metrics have been referred to by other names, including sustainability metrics [33], sustainability indicators [5], or composite indicators [34]. The term “integrated” is preferred over “sustainability” and “composite”, because they do not measure sustainability directly in themselves, and because they are not “composites” of different indicators with different units and purposes such as the Environmental Sustainability Index [35]. Integrated metrics have the following common properties [33]:
(1)
Based on a physical or economic principle. Integrated metrics are based on established scientific or economic theory (e.g., thermodynamics or market theory) and underscored by clearly defined mathematical relationships between resources or emissions and the environment, human population, or the economy.
(2)
Founded on a systems approach. Integrated metrics are founded on a systems approach, attempting to be holistic in consideration of all relationships between a system, its parts, and the larger context.
(3)
Not directly measureable. Integrated indicators are abstract quantities. They describe the system as a whole and thus are not apparent in any physical property of the system, or any of the individual components or impacts of a system.

2.2. Selected Integrated Metrics for Product System Application

Previous U.S. EPA research has demonstrated a number of integrated metrics to be useful in measuring system sustainability for regional systems [36,37,38,39,40,41]. Among these metrics are ecological footprint, emergy, green net regional product, and Fisher information. Findings from the application of these metrics to the San Luis Basin, CO (USA) support the concept that characterization of sustainability requires a multidisciplinary approach and demonstrates the need to measure multiple aspects of a system as the outcomes of metric application showed different trends and reflect different aspects of the system. Further, violation of the sustainability criteria established for any of the integrated metrics indicated movement away from sustainability for the overall system [39]. These metrics are selected here because of their recognized values to sustainability assessment, their level of maturity, their unique and equally justifiable theoretical underpinnings and perspectives, and their complementarity.
Each of these metrics satisfies the three principles described in Section 2.1. The basic theory and science supporting each of these system metrics has been described and vetted in the peer-reviewed literature, but they continue to evolve and are being extended to apply in new contexts. Because product systems ultimately depend on the same resources and produce the same types of pollutants as regions, these integrated metrics are equally valid for use in assessing the sustainability of processes of production and consumption. Derivations of these same four integrated metrics are proposed for use in assessment of product systems: emergy, ecological footprint, Green Net Value Added, and Fisher information. Each of these metrics is described in the next sections. We briefly introduce and explain the basic algorithms underlying each of the integrated metrics. For each metric, we list relevant indicators that can be used for developing sustainability criteria for product systems.

2.2.1. Ecological Footprint

Effectively managing land use is an import aspect of global sustainability. The appropriation of land for certain purposes can limit or degrade the ecosystems and limit the goods and services that can be provided by those associated ecosystems [42,43]. As land (and the seas) supports a variety of goods and services that differ widely between the biological and geographic area, summing together land of different types and geographies does not provide a firm basis for understanding the sustainability of land use. Furthermore, it is not just the direct appropriate of land (e.g., for residential purposes) that is affected, it is also unoccupied land that needs to remain functioning and intact to help absorb wastes and maintain the global biogeochemical balance, particularly of the carbon cycle, the imbalance of which is a major driver of climate change. Ecological footprint (EF) provides a useful estimate of land use that takes into account the underlying capacity of land to provide ecosystem services.

2.2.1.1. The Ecological Footprint Method

EF is an approximation of the biologically productive land area required to support human activities. For purposes of calculating EF, land is generally divided into five types: cropland, grazing land, forest land, fishing grounds, built-up land, and carbon uptake land. EF was primary developed as a regional or national environmental accounting tool [44], but can also be applied to products. To apply EF in the context of product systems, land use along the full life cycle can be assigned to one of the first four land use types, and CO2 emissions data can be used to estimate the required carbon uptake land.
For a given product, EF can be estimated using Equation 1.
Sustainability 06 01386 i002
where EF is the EF of product system, Pi,j represents the amount of an agricultural input, i, to the product system, produced in country j in kg, Yi,j is the national average yield of input i in country j in kg hec−1, YFi,k is the “yield factor” for product i produced on land type k in world hec hec−1, and EQFk is the “equivalence factor” for land type k in global hec world hec−1. EFs of inputs, i, are then summed over all inputs into the product system. Note that in the context of an LCA, this includes all land used and CO2 emissions upstream and downstream of the use of the product in the life cycle. The “yield factor” describes the ratio between national and world average yields and is used to convert the amount of land required in a certain country to an estimate of the amount of world average land of a certain type required to provide the equivalent level of production. In effect, the yield factor adjusts for regional differences in the productivity of a certain land type. The “equivalence factor” serves as an adjustment between the productivity of global average land of a certain type and the productivity of global average land.
In addition to direct appropriation of land area, the EF calculation includes accounting for the area of land required to biologically sequester anthropogenic carbon dioxide emissions. For the purposes of this calculation, after factoring in the role of the ocean, forests are assumed to be the only terrestrial means of sequestering CO2. Thus, the EF CF for carbon dioxide emissions is based on an adjustment for ocean uptake, the world average uptake capacity of forest land, and the EQF for translating forest land into global hectares.
Generally greenhouse gases are characterized in LCA studies using characterization factors describing global warming potential (GWP) and expressing the result in terms of a mass of carbon dioxide equivalent emissions (CO2-eq) [45,46]. These characterization factors include a variety of substances, which contribute to GWP. We propose that calculating the EF carbon uptake land based on total CO2-eq rather than only CO2 emissions is more consistent with typical LCA practice and more inclusive of the total impact associated with greenhouse gases [47]. This approach assumes that CO2 sequestered by forests can serve as a one-to-one offset for CO2-eq releases.

2.2.1.2. Sustainability Criteria: EF for Product Systems

The primary indicator derived from EF is the total ecological footprint per functional unit of product. However, the total EF can be decomposed into indicators for EF from land occupation, EF from mitigated emissions, and EF from land use change. The sustainability objective is to minimize EF and all of its subcomponents.

2.2.2. Emergy

Emergy theory is based on a recognition that our ecosystems and human activities are limited by the past, present and future energy available to the biosphere. Traditional LCIA indicators do not capture all types of energies supporting the environmental flows and resources consumed over the life cycle of the product. Because the creation of resources requires energy, energy can be used to measure total resource use. Emergy (EME) is an energy accounting quantity that can be used to trace back the underlying energy from the environment that is used directly or indirectly to make a product. In this way, emergy can be used to relate a product to available energy, which is a critical component of sustainability. EME can be used to complement LCA to capture this broader measure of energy for products that includes appropriation of ecosystem goods and services [48,49,50].

2.2.2.1. The Emergy Method

In the emergy method, all direct and indirect sources of material and energy input into a product system are tracked and quantified in units of a common type of energy. The common type of energy used is solar energy, which in EME is called solar emjoules. The solar emjoules embodied in any resource are based on the use of sunlight that was directly or indirectly required to make a resource. For instance, the solar emjoules of a tree in an unmanaged forest would include the sunlight the tree absorbed to perform photosynthesis, as well as the energy by the climate system to provide the rainfall absorbed as well as to the energy that have been used in biogeochemical processes to form the nutrients used by the tree. In emergy, models of natural processes on global and local scale underlying the formation of these basic resources, including renewable and nonrenewable resource, are used to estimate the amount of emergy in these resources. The emergy from these resources is included in the total emergy used to make a product from the respective quantity of these resources. In this sense, EME is like the “energy memory” of a product system.
The most basic indicator estimated with EME is a unit emergy value (UEV). In the product system context, a UEV is the total amount of emergy used (solar emjoules: sej) per functional unit of product. To estimate a product system UEV in the LCA framework, UEVs for resources are needed along with the full inventory of resources consumed in all processes of a product system. The emergy of every resource consumed by the product systems can be calculated and aggregated with respect to the functional unit of the product. This relationship is indicated in the following equation.
Sustainability 06 01386 i003
Where EME of a product system is the sum of the emergy value in sej of all characterized resources, i, in the product system, where the amount, Qi, of each resource i in a given unit, is converted into solar energy equivalents via a resource-specific emergy characterization factor, ECFi, in sej unit−1. The ECF for an elementary flow (a raw resource) is the name of the UEV for that specific resource for use in the LCA context. Resource units are typically, but not limited to, mass and energy.
Emergy may be characterized as non-renewable or renewable, like traditional energy, based on the energy source [36]. In emergy, renewable energy sources include direct use of sun, wind, rain, tide, wave energy, and geothermal heat, whereas non-renewable emergy includes fossil fuels, as well as storages of materials like minerals and water sources that are not sufficiently replenished. It is assumed in emergy that the use of renewable resources is more sustainable than using non-renewable resources.

2.2.2.2. Sustainability Criteria: EME for Product Systems

EME indicators are usually calculated to compare systems, suggest optimized alternatives, predict trends, and reduce environmental burdens. EME used with the life cycle approach can provide two indicators particularly relevant to product systems: (1) the UEV of the product, and (2) the % renewable emergy (%R) of the product. The UEV represents total embodied energy required to support the creation and functioning of the product system, and should be minimized to achieve system efficiency (use less emergy to make the same unit of a product) and improve sustainability. The %R represents the portion of emergy from renewable sources of the total emergy inputs, and this should be maximized to improve sustainability.

2.2.3. Green Net Value Added

Products are goods and services that are traded in a marketplace with an associated economic value—a price. The price represents, in economic theory, the marginal value the consumer attaches to the product. In order for products to be sustainable from an economic perspective, there must be a demand for the product in the market place at the price offered by the producer, and the cost to produce the product must be less than the price of the product in order for the producer to stay in business. The purchase of materials and services, depreciation expenses, and labor expenses constitute the cost of production of a final product. These costs are reflected in the market. However, such traditional costs ignore the external environmental damage costs the production process inflicts on the society, and are not reflected in the market. An environmental externality is the environmental cost or benefit of an activity that affects those uninvolved directly with the activity. For example, when a manufacturing facility emits GHG in to the atmosphere, the damage that occurs due to climate change is born by the global community. In order to arrive at full cost of production, the environmental externality costs are added to the traditional cost of production. If this full cost can be estimated for the product, it can be a valuable measure of sustainability that incorporates traditional economic theory as well as the costs of the environmental and social damages associated with a product. Reporting this measure in monetary terms is especially useful for producers because it can be used to augment traditional cost, which is the primary driver of decision making.

2.2.3.1. The Green Net Value Added (GNVA) Method

Economists have used the dynamics of Green Net National Product (GNNP) and Genuine Savings to measure sustainability at the macroeconomic level. GNNP adjusts the traditional measure of wellbeing, Net National Product, by subtracting the value of the depletion of natural capital (e.g., stock of forest or minerals) and damages from environmental pollution (e.g., emission of particulate matter, GHG). The value of depletion of a single unit of natural capital is measured as the scarcity rent, i.e., price less cost of extraction. Increasing GNNP per capita over time is interpreted as the economy becoming more sustainable from an environmental and economic perspective. Translating this macroeconomic sustainability metric into a metric for product assessment that is compatible with LCA is a challenge. In such an approach, the value of the final product should be reduced by the depreciation of natural capital, environmental externalities and depreciation of manmade capital occurring through the product system. However, finding depreciation of manmade capital along the supply chain is very difficult to obtain, as this involves access to information on depreciation expenses of all the intermediate goods that are inputs into the final product. We instead propose a metric based on adjustment to Net Value Added (NVA) of the final product, which we term Green Net Value Added (GNVA) (see also [51]). Green Net Value Added is based on the principle that products must create value that is greater than the environmental and human health damages incurred in their creation. Net Value added at firm level represents the total return of the firm earned by all providers of capital, plus employees less depreciation expenses [52] as in the following equation:
NVA = Revenue – (Purchase of Materials and Services) − Depreciation Expenses
NVA can also be interpreted in the product context if the terms are defined in this context. GNVA attempts to adjust the NVA by accounting for environmental externality damages, since the cost to produce the final product already includes all scarcity rent and depreciation costs associated with the production of intermediate goods, and thus are all subtracted from the NVA to arrive at the GNVA, as in the following equation:
GNVA = NVA − Environmental Externality Costs
For example, if a company buys oil as input to produce a final good, the price paid for oil includes all depreciation expenses occurring at extraction, refining, and transportation, and the scarcity rent of depletion. The main purpose of GNVA is to augment conventional company accounts by monetizing environmental damages associated with its activity.
A methodology must be defined to attach monetary values (e.g., U.S. dollar, Euro) to the environmental impacts identified and quantified in the LCI or LCIA. As the externalities are not bought and sold in the market, environmental economists have developed non-market valuation methods to attach monetary values to externalities. There is extensive literature on the theoretical development and empirical application of non-market valuation methods [53,54,55,56,57]. The EPA “Guidelines for Preparing an Economic Analysis” [58] offers a detailed explanation of non-market valuation methods.
In order to find values of externalities, we propose using an approach known as the “benefit transfer method”. Benefit transfer occurs when a researcher adapts the values of environmental damages obtained from published studies instead of undertaking a primary non-market valuation study. For example, we can use benefit transfer methods to compute the external costs associated with a ton of air emissions, such as Particular matter (PM), SO2, NOx, NH3 and Volatile Organic Carbon (VOC), CO2, and external effects due to soil erosion and other ecosystem destruction identified in published literature. For example, U.S. EPA has developed software called BenMap to estimate the benefit associated with reduction in PM 2.5 and its precursors, SO2 and NOx. Using BenMap methodology, Fann et al. present the externality cost per ton of PM related emissions, disaggregated for 17 industrial sectors [59]. The majority of costs associated with air emissions in the BenMap and related models are all related to human health/mortality. The cost of other air pollutants like carbon dioxide can be obtained from meta analysis of several published studies [57].

2.2.3.2. Sustainability Criteria: GNVA for Product Systems

Total GNVA is the primary indicator for comparison of sustainability of two production processes that results in the same final product. The sustainability objective is to maximize GNVA. If changing the production process—either through technological change or through input substitution—results in higher GNVA, then the production process becomes more sustainable. For example, if a company switches its energy source from a polluting source to a cleaner source, all things equal, such a move would likely reduce the total GNVA due to reduced externality cost. For a more detailed comparison of alternatives in GNVA, GNVA can be deconstructed into realized cost and externality cost per functional unit of product. Each of these costs can be further dissected to understand the contributing factors for policy analysis and scenario development.

2.2.4. Fisher Information

Product systems are typically characterized by complex dynamics and have highly inter-connected social, economic and environmental components related to sustainability. Managing the supply chains that support these systems poses a unique challenge not only due to the temporal horizon of its processes but because of its spatial network of related yet distinct elements. Accordingly, evaluating product systems involves tracking multiple and often disparate variables that change over time; thereby highlighting the critical need for approaches that aid in assessing and managing patterns of growth and development [37]. Such work is aimed at employing methods that aid in monitoring system behavior, maintaining desired conditions and preventing catastrophic shifts [41].
Any well-functioning system, whether natural (e.g., lake) or man-made (e.g., production line), must maintain some level of order (predictable patterns) for it to be managed and sustained over time; hence there is an inherent time component to sustainability [60]. Accordingly, quantifying the order and stability is an important part of evaluating the sustainability of a system. As a simple example, consider a clear lake rich with plant life and aquatic species. In this state, the lake is thriving, bountiful and able to sustain life (state 1: oligotrophic). Now, imagine this environment becomes contaminated due to an inflow of nutrient runoff. Over time, this inflow will have a detrimental impact on the ability of the lake to maintain its pristine condition and without intervention, there is a great possibility that it will undergo a transition (regime shift) to a totally different state where the conditions are characterized by reductions in biodiversity and water quality, algae overgrowth and lack of oxygen needed for fish species survival (state 2: eutrophic). Although this is an ecological example, it provides insight on the importance of tracking changes in system variables and highlights the benefit of utilizing methods which may provide insight on changes in system condition. In the context of a product system, while managers are constantly evaluating quality metrics, it is easy to see how changes in resource availability, emissions, logistics, warehousing and supplier costs, employee health and safely, etc., may impact the ability of products to be produced efficiently, delivered on time and cost effectively.
The ability to evaluate dynamic changes in parameters related to sustainability serves as a perfect complement to traditional product system LCAs which typically assess life cycle environmental impacts as a “snapshot”. This temporal aspect is not captured by LCIA indicators nor the other integrated metrics being used in this study. Fisher information (FI), a key method in information theory, provides a method of monitoring changes in system variables by collapsing them into an index that can be tracked over time to capture the dynamic behavior of a system to include its regimes and regime shifts [61]. FI affords the ability to assess movement toward and away from sustainability by evaluating the time series data from social, economic and environmental variables that have been compiled to describe changes in the behavior of the system over time. While, FI has been used to assess various types of model and real systems, this is the first proposal of using this approach to assess product systems.

2.2.4.1. Fisher Information Method

FI was developed by Ronald Fisher as a measure of the amount information that can be obtained by observation for the purpose of fitting parameters to data [62]. It has since been adapted as a means of assessing order in data [63]. The form of FI developed used in this application is defined as:
Sustainability 06 01386 i004
where ds is the change in state (i.e., condition of the system) and p(s) is the probability of a system being observed in a particular state. Hence, FI is based on the probability of a system experiencing certain conditions as determined by changes in underlying variables. In order to evaluate real systems, Equation 5 was adapted to derive methods for computing FI for discrete data. Details of the FI derivation and calculation methodology can be found in the literature [41,64].
One of the foundational elements of employing FI for assessing changes in system condition is that different states of a system exhibit different degrees of dynamic order. Hence, (1) an orderly regime is defined by a non-zero FI that does change over time (i.e., Sustainability 06 01386 i005); (2) progressive decrease in FI indicates increasing variation in system variables, thereby signifying loss of dynamic order and movement away from stability and sustainability; (3) steadily increasing FI indicates the system is changing at a slower rate and becoming more organized; however this increase does not ensure there is a shift unless the system actually settles into a new regime ( Sustainability 06 01386 i005); and (4) a sharp decrease in FI between two stable dynamic regimes denotes a regime shift [63,64,65] . Although increasing FI is indicative of higher dynamic order, it does not automatically represent a transition to a preferred state (e.g., oligotrophic vs. eutrophic lake or an economically viable business vs. one nearing economic collapse). Such information on the characteristics of the condition can only be determined by assessing the underlying variables [66].
For product systems, the data for computing FI may include the life cycle inventory of resources used and releases (e.g., energy use and CO2 emissions); however, it is not limited to this information and may also encompass costs and pertinent social indicators that characterize corporate activity (e.g., rate of injury per 100 employees) or measures that provide a contextual understanding of how the product system affects the community in which it is located (e.g., employment rate). Compared to the other metrics, there is flexibility in the variables that are used to calculate FI. The only requirement for FI is that the variables are representative of the core economic, environmental and social condition of the product system, its corresponding supply chain, and the surrounding community and environment. When FI is being used to perform a comparative assessment, it is important that the set of variables selected to describe the condition of each system is identical to ensure that the systems are characterized the same and accordingly, can be compared. However, in the case where there are data quality and quantity issues and it is impossible to find common variables for the desired period of the study, the systems should be evaluated separately (at least for the period where there is no overlap in variables or time period).

2.2.4.2. Sustainability Criteria: FI for Product Systems

The core sustainability criteria for assessing changes in system condition using FI is that decreasing FI indicates movement away from sustainability. While a higher FI value is typically associated with higher order, the level of order is not as important as the ability of the system to remain stable within a desirable regime. Hence, a stable and sustainable system (and/or system regime) reflects desirable conditions, has a relatively high mean FI (<FI>) and low standard deviation in FI (σFI) over time [67,68].

2.2.5. Other Integrated Metrics

Other integrated metrics are likely applicable to product systems, such as human appropriation of net primary production (HANPP) [69], exergy [70], or indices derived from ecological network theory [71]. These metrics are not recommended here as they are based on similar principles and expected to provide similar signals to the selected metrics and yet are less developed for a product systems context: HANPP is based on a principle of bioproductivity like ecological footprint; exergy is another thermodynamics-based measure of system condition that has been used alongside [72] or independently of emergy to evaluate product systems but does not capture energy transformations in the biosphere; measures of system resilience or order based on ecological network theory are more challenging to compute and less proven for technical systems than Fisher Information. Although an adequate metric has not been identified, there is still a need for an integrated metric that provides an indication of system condition, based on social and ethical expectations and norms that more firmly captures aspects of social responsibility than the metrics proposed here, as this perspective is widely acknowledged to be of great importance to sustainability of global supply chains [73].

3. Using Integrated Metrics in LCA

Table 1 summarizes the underlying principles, units of measure, key indicators, and references for the selected metrics. Three of these metrics have already been demonstrated, in a limited number of applications, to be computable for product systems. EME theory has been used to develop LCIA methods under various names, including emergy [50], solar energy demand [48], and ecological cumulative exergy consumption [72]. A first attempt to develop EF method into a set of LCIA characterization factors was done by Huijbregts and colleagues [9] for the EcoInvent LCA database. More recently, EF was applied to the design of regional energy grid [74] and to assessment of transportation fuels [47]. Forms of GNVA have been incorporated into life cycle approaches to value environmental, economic, and social costs and benefits of products [75,76]. FI has not yet been applied to a product system, but has been applied extensively to systems such as ecosystems as well as cities and regions, for which data such as emissions that may also be collected for product systems have been utilized.
Table 1. Summary of selected integrated metrics.
MetricUnderlying system principleResource or emissions-oriented?Captures temporal changes?QuantityKey Indicators (per functional unit of product)Key References
Ecological Footprint (EF)Primary production (Biological) BOTHNLand areaTotal EF[44]
Emergy (EME)ThermodynamicsResourceNEnergyTotal emergy; % renewable emergy[77]
Green Net Value Added (GNVA)EconomicsEmissionsNMoney Full cost; Externality cost[51]
Fisher Information (FI)Information theoryBOTHYInformationFI/time; Var(FI)/time[63]
Figure 2 presents the place of the integrated metrics in the life cycle approach. Life cycle inventory results include resources, emissions, and life cycle costs summed over the full life cycle of a product with respect to a functional unit. These inventory data are used to estimate various midpoint, endpoint and potentially damage and single score indicators using established LCIA methodologies. Depending on methodological considerations, inventory data, LCIA indicators (midpoint or endpoint), or additional community and facility data not generated by the life cycle inventory are used to calculate the integrated metrics. Note that some midpoint and even endpoint LCIA indicators are tied to the integrated metrics while others are not. This is because the integrated metrics methodologies have been developed outside of the LCA approach, and therefore do not depend exclusively on the set of data generated by the LCA, but maybe use this information when being adapted to the LCA framework. In the LCIA framework, the damage indicators may be combined based on value-judgments into a single score. To avoid the use of value judgments in interpretation, the integrated metrics are not combined into a single score.
Figure 2. Relationship of the four proposed integrated metrics to the life cycle approach. EME = emergy; EF = ecological footprint; GNVA = Green Net Value Added; FI = Fisher information. The dashed boxes represent optional elements of a generic LCIA framework.
Sustainability 06 01386 g002
Tracing the pathways in Figure 2 and linking inventory results or LCIA indicators to integrated indicators is useful for understanding the types of information they capture. EME captures all forms of resource use including renewables and non-renewables. These include fossil fuels, water and minerals as well as ecosystems goods and services. EF captures land use as well as the global warming potential of GHG emissions. GNVA captures life cycle material and service costs, direct labor costs and depreciation, damages to human populations, either using non-LCA based externality cost models or using LCA-based endpoints like occurrence of respiratory disease to estimate human health impact, as well as the traditional economic cost of the product. FI captures changes in the variables that characterize a system to include life cycle inventory results but also data representing local communities surrounding manufacture such as population and regional economic product data as well as facility data that may not be captured in the LCA. What is not depicted in this figure is that the data used for FI must include a time series for each data point since FI is time-dependent. Only the information used as direct inputs to product system calculations are shown in Figure 2; it should also be noted that additional information may be used to calculate conversion factors used by the integrated metrics. For instance, EF uses yield factors based on national level land type productivity; EME uses a wealth of information about global and regional energy flows in development of unit emergy values. The assumption here is that these conversion factors are already available for product system calculation as part of the methodology.
Notably there is some overlap across integrated indicators regarding the information used in their computation, but it is important to acknowledge that this information is used in different ways. Land use is used in EF to estimate use of biologically productive land, and in EME to estimate energy embodied in renewable resources available to that a parcel of land. In EF, GHG emissions are used to estimate productive land area required to mitigate those emissions in GNVA, GHG emissions are used to estimate damages associated with climate change caused by the incremental increase in emissions. In the next section, we attempt to provide a mathematical foundation for the relationship between releases associated with a product system, LCIA indicators, and integrated metrics.

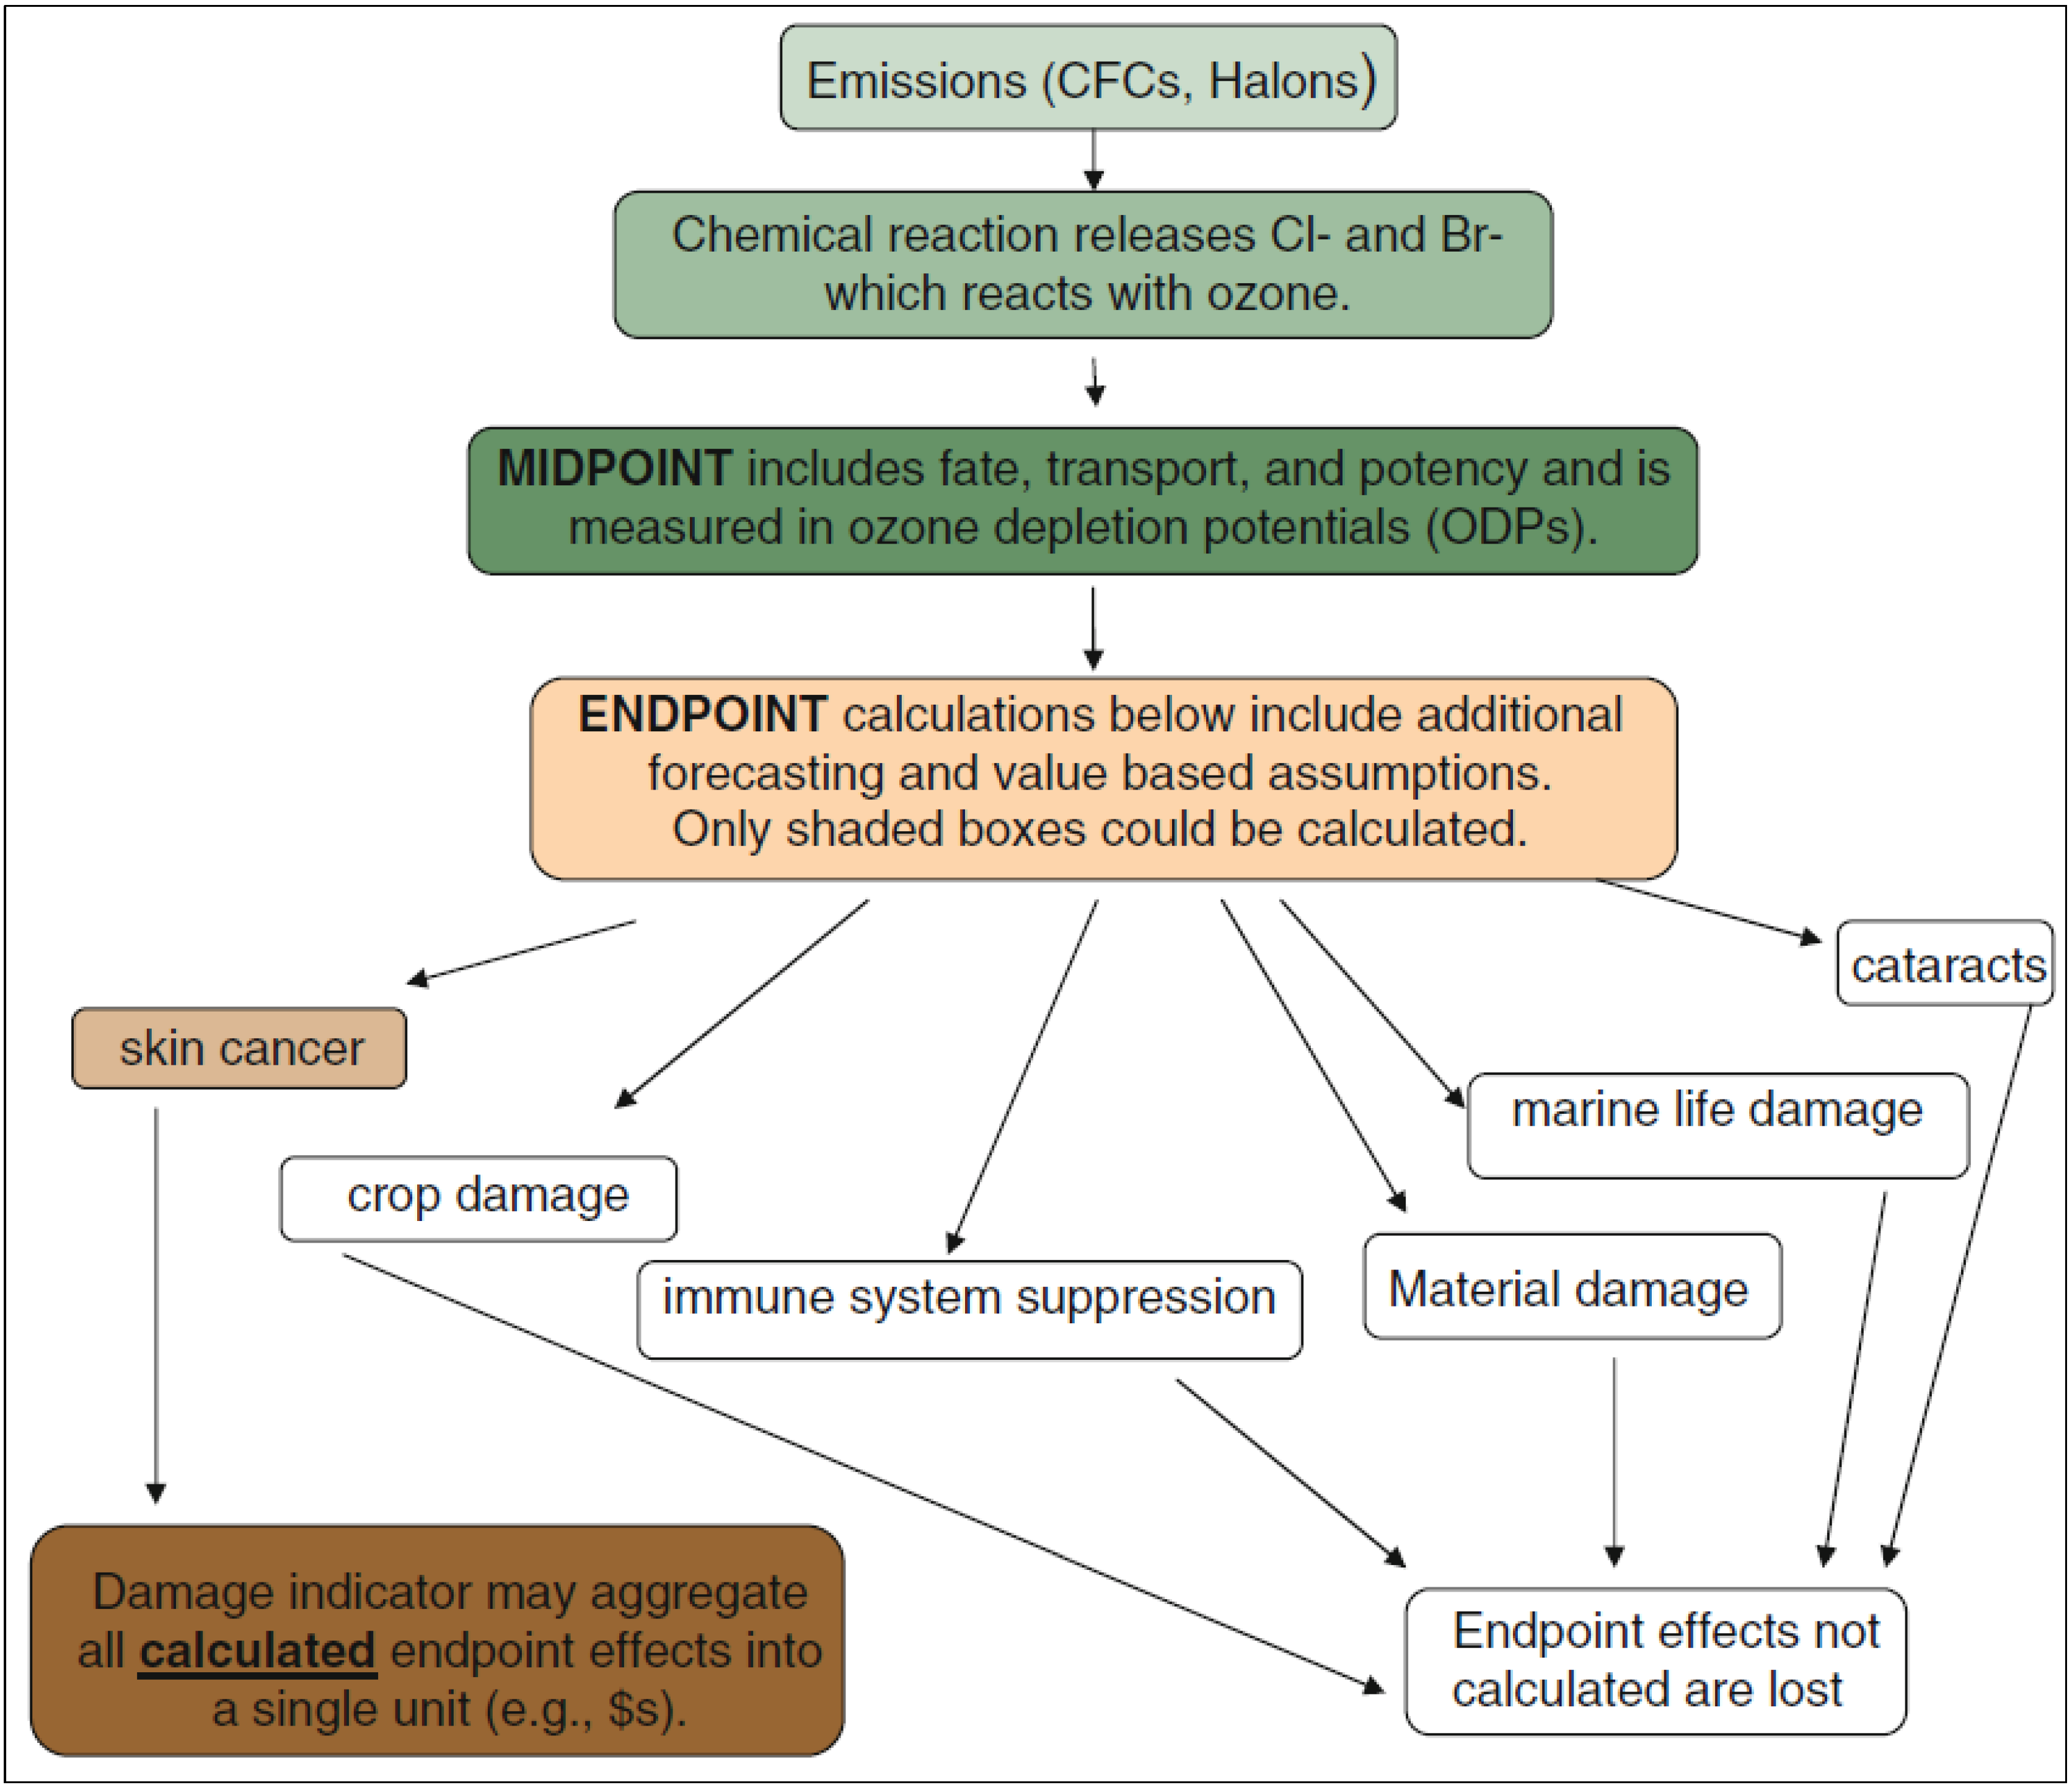
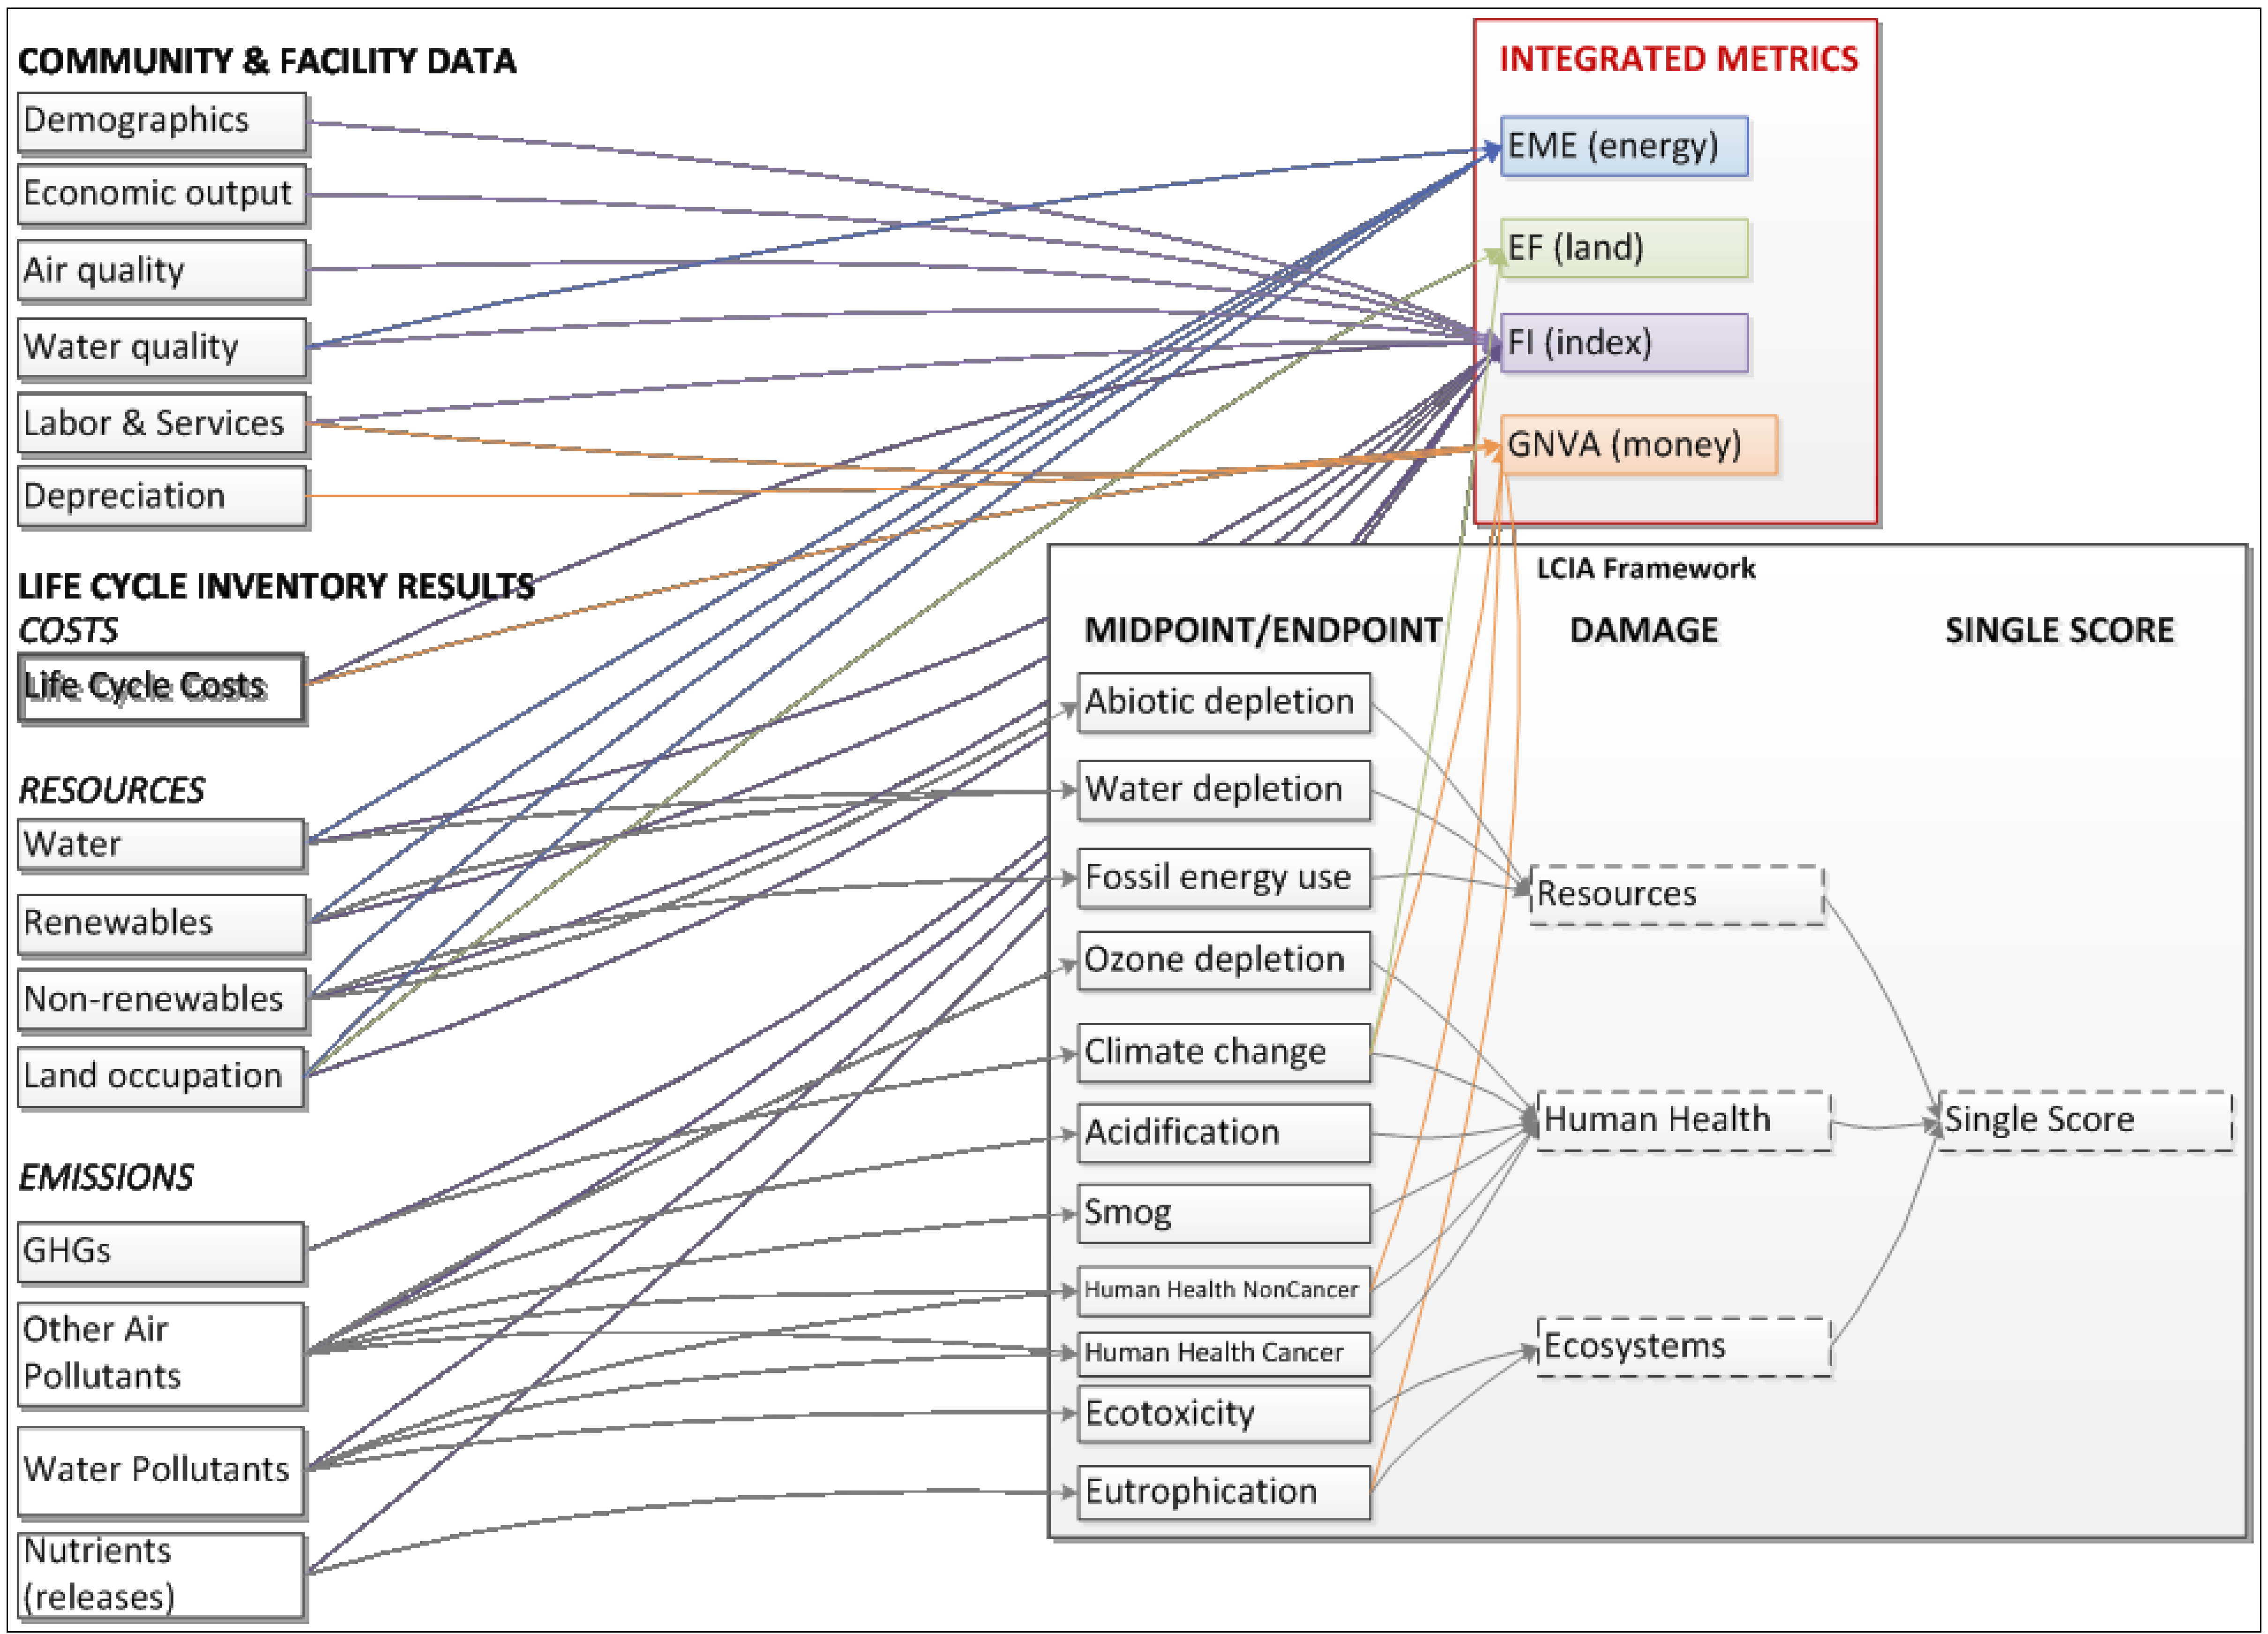
3.1. The Relationship between Integrated Metrics and LCIA Indicators: Theory

As illustrated in Figure 2, there are three classes of relevant quantities: (1) measures of the different resources used and releases generated in a product system, (2) LCIA indicators that correlate these measures to a known environmental impact, and (3) integrated metrics which attempt to translate multiple indicators into a common measure, e.g., solar energy, land use, information, or money, according to an existing scientific theory. The purpose of this section is to briefly explore the relationship between these three different quantities.
To develop the formal theory, we will adopt the following convention: a particular measure for a resource use or release i will be designated by xi, an LCIA indicator will be designed by I, and an integrated metric will be given by IM. We will assume that an LCIA midpoint or endpoint indicator I can be calculated from the measures xi which implies that there is a function I (x1, x2, …). Similarly, an integrated metric IM can be calculated from the measures xi such that there is a function IM (x1, x2, …). Now, the fact that computing the indicators I and the integrated metrics IM can be computed from the measures xi means that the functions I (x1, x2, …) and IM (x1, x2, …) exist. We assume that these functions are continuous and smooth enough to be differentiable, but that is the case with the functional forms normally used in environmental studies.
The sustainability criteria for integrated metrics are always formulated in terms of changes in the metric with respect to different options, i.e., which of several options is the more sustainable. To illustrate the point, we consider two options here designated as one and two. For the integrated metrics being considered here, this can be expressed formally by,
Sustainability 06 01386 i007
where IM designates a particular integrated metric, e.g., EF, EME, FI, or GNVA. If a lower value of IM is understood to be more sustainable, then Option 1 is more sustainable than Option 2 according to integrated metric IM when the above equation is satisfied. For example, if the integrated metric IM is the ecological footprint (EF), then the lower the EF the more sustainable the system. If the EF of Option 1 is 200 global hec, and Option 2 is 250 global hec, Option 1 meets the sustainability criteria. Expressions like this one can be written for all of the integrated metrics. Further, because these integrated metrics represent very different aspects of the system, a compelling case that one option is more sustainable than another option can only be made when the appropriate above expression is satisfied for all integrated metrics of interest.
If additional sustainability criteria are needed to evaluate the options, the expression may be extended to account for some particular criteria based on one or more of the LCIA indicators. For example, let us say that, in addition to the aforementioned sustainability criteria, there is a need to reduce global warming, fossil energy use and water depletion. In that case, for each additional LCIA indicator criteria, an expression similar to the one for IM needs to be formulated, such that:
Sustainability 06 01386 i008
where I designates a particular LCIA indicator, e.g. global warming potential. If a lower value of I is understood to be more sustainable, then, Option 1 is preferable to Option 2 if (I(option 1)I(option 2)) < 0, i.e., Option 1 has a lower LCIA indicator score than Option 1. For example, if global warming potential (GWP) is the LCIA indicator, and Option 1 has GWP of 1200 kg CO2-eq, whereas Option 2 a GWP of 1500 kg CO2-eq, Option 1 is more sustainable.
The LCIA indicator criteria by itself does not necessarily indicate that Option 1 is more sustainable than Option 2, as the LCIA indicators capture a more limited interaction between the product system and its environment than do the integrated metrics. Moreover, integrated metrics are very broad measures that can be relatively insensitive to changes in portions of constituent measures, and therefore, it is often possible to meet two sustainability criteria simultaneously, although this becomes increasingly difficult with the addition of additional criteria. For example, there is no reason to think that one could not have a decreasing ecological footprint while simultaneously decreasing global warming potential, as in the given examples. However, by imposing both a constraint on EF, the integrated metric, and global warming potential, the LCIA indicator, we insure more sustainability with a lower EF and the satisfaction of a specific concern by lowering GWP.

3.2. The Relationship of Integrated Metrics to LCIA Indicators: Illustration

To further illustrate the theory generally described in the preceding section, consider the case of ecological footprint, an integrated metric that includes consideration of land occupation and greenhouse gas emissions [47]. A spreadsheet that further illustrates this example is provided as Supplementary Material. According to Figure 2, ecological footprint (EF) is a function of land occupation (LO) and greenhouse gas emissions (GHG), where EF of both land occupation and greenhouse gas emissions are calculated in global hectares using Equation 1. Then the corresponding sustainability criterion is,
Sustainability 06 01386 i001
where it is understood that a lower EF is more sustainable, and where it is assumed that Option 1 is the more sustainable one. Now, ∂EF /∂LO > 0 as ecological footprint increases with land occupation, and ∂EF /∂GHG > 0 because ecological footprint increases with greenhouse gas emissions as land is needed to process the emissions. Both partial derivatives are positive numbers.
Then, there are three possibilities for meeting the ecological footprint criterion indicated by the expressions above:
[LO (Option 1) − LO (Option 2)] < 0 and [GHG (Option 1) − GHG (Option 2)] < 0
where both land occupation and green house gas emissions decrease from Option 1 and to Option 2,
Sustainability 06 01386 i006
or where an increase in land occupation (LO) has to be compensated by a corresponding decrease in greenhouse gas (GHG) emissions from Option 1 to Option 2 as given by Equation 10.
Sustainability 06 01386 i010
or where an increase in greenhouse gas emissions (GHG) has to be compensated by a corresponding decrease in land occupation (LO) from Option 1 to Option 2 as given by Equation 11.
Note that while it could be argued that Equations 10 and 11 could be combined as one, it is instructive to treat them separately to emphasize that there are two choices. Any of these possibilities will satisfy the ecological footprint criterion for greater sustainability of Option 1 over Option 2.
If, there is a need to decrease global warming potential from Option 1 to Option 2 as in Equation 7, another expression needs to be added that will further constrain choices. According to Figure 2, global warming potential (GW) depends only on greenhouse gas emissions (GHG), and the appropriate expression is:
Sustainability 06 01386 i009
Here, there is only one possibility for reducing global warming potential between Option 1 and Option 2,
GHG (Option 1) < GHG (Option 2)
i.e., the greenhouse gas emissions of Option 1 have to be smaller than those of Option 2.
However, because greenhouse gas emissions appear in the sustainability criterion expression for the ecological footprint, one of the three options for meeting the ecological footprint criterion has to be removed because now GHG(Option 1) – GHG(Option 2) has to be a negative number. Therefore, there are only two possibilities remaining for EF of Option 1 to be less than that of Option 2—either Equation 9 or 10 have to hold true—in other words, either that both global warming potential and land occupation for Option 1 should be less than those of Option 2 (Equation 9), or the increase in EF due to land occupation of Option 1 is less than the corresponding increase in EF with respect to global warming potential (Equation 10).
If it is further required that land occupation decrease between Options 1 and 2, the only possibility that remains for meeting the ecological footprint sustainability criterion is satisfying Equation 9, such that both land occupation and global warming potential of Option 1 are less than those of Option 1.
The example presented in this section illustrates that as LCIA indicator constraints are added, the flexibility in meeting sustainability criteria based on the integrated metrics decreases. This is the case for any number of integrated metrics and LCIA indicators, although the complexity of the analysis will naturally increase with the number of integrated metrics and LCIA indicators.

4. Discussion and Future Work

4.1. The Use of Integrated Metrics to Characterize Product Systems

Integrated metrics are expected to be helpful to characterize product systems, but assessments using them would only be as accurate as the data used, their completeness to characterize the system, and the validity of the underlying mathematical relationships linking the data to environmental impacts. Often life cycle approaches depend on extensive data, for which either proxy data are used, or product systems are simplified so that only aspects of systems that are not identical are included for comparative analysis. Furthermore, not every relationship may be properly characterized by any given metric, and the scientific or economic principle behind a metric provides one perspective on a system, which cannot be scientifically proven more valuable than another perspective. Therefore, the following recommendations are made for the use of integrated metrics:
(1)
Use for relative comparison. Integrated metrics rarely provide absolute values of system condition, due to limitations in full information for the system and lack of complete understanding of environmental or economic relationships. However, as long as comparable data are used and systems are equivalently characterized in respect to their environment, they can be used for making relative comparisons (i.e., more or less sustainable). This relativism also extends to the interpretation of trends in the sustainability metrics. While they cannot be used to state that a process, product or system is absolutely sustainable, they reflect conditions that are indicative of movement toward or away from sustainability [41].
(2)
Use alongside specific environmental, economic, and social indicators. Integrated metrics do not replace the function of specific modeled indicators or measurements of stress or damage to a particular receptor. These indicators are still critical for tracking, assessing, and managing environmental, economic, and social problems.
(3)
Use multiple sustainability criteria. While an integrated metric only provides a single perspective of system condition, multiple perspectives based on different scientific principles are possible and expected to be helpful. As discussed above, each integrated sustainability metric represents a particular aspect of system condition which is tied to sustainability through a specific criterion that indicates, in relative terms, whether one option is more or less sustainable than another option [78]. While this makes it difficult to select the appropriate set of integrated metrics, multiple metrics may provide a more diverse and robust perspective or “signals” of system condition. Furthermore, the reliability of a sustainability assessment increases with the number of integrated metrics and associated sustainability criteria that support it.
This last point cannot be over emphasized because all aspects of the system do not map with equal fidelity into all of the integrated metrics, i.e., economic aspects are best represented with total cost accounting, energy and resource aspects best map into emergy, land use and carbon emissions best correspond to ecological footprint, and changes in system variables over time map most accurately into Fisher information. Hence, if the cause of the relative unsustainability is: (1) economic or human health-related, then the best signal is likely to come from total cost accounting; (2) resource or energy use, then the best insights are likely to come from the emergy calculations; (3) land use, then the best signal would likely come from the ecological footprint; and (4) dynamic instability, then the Fisher information would likely have the best signal. An analogy of the use of multiple tests in the diagnosis of human illness is useful for justifying the use of multiple integrated metrics. A doctor may take a patient’s temperature, pulse rate, and blood oxygen level looking for signs of the body’s response to an illness. These measurements are not totally independent (or statistically orthogonal by definition) but they each provide a unique perspective. If any of the measurements present an abnormal result, there is an indication that the person is ill. In the same way, the proposed integrated metrics are not 100% orthogonal—in other words, there is some overlap in the information that they use. However, any one of these metrics may reveal one product system option to be less sustainable than a comparable option.

4.2. Integrated Metrics and LCIA Indicators

There are fundamental differences between the LCIA framework and integrated metrics. In LCIA, endpoints are considered the end of a cause-and-effect chain between an environmental stressor and entity, and the damage indicators derived from them estimate the damage of that impact to an area of protection. Understanding a specific impact and/or damage to an area of protection is only one aspect of sustainability. The integrated metrics present a measure, or signal, or total system health that cannot be reflected in a single impact pathway [79].
Not all the system information contributing to midpoints and endpoints in LCIA will contribute to each integrated metric, and in cases some of the same information may be used by more than one integrated metric. Here, it is important to recognize that the integrated metrics were developed outside of the LCA community. The advantage of being exogenous to this community is that the theories linking system attributes (e.g., emissions) to a measure of system condition are not forced to fit a within the confines of the LCIA framework (i.e., to estimate damage to an area of protection), and they have been developed over time drawing on expertise from a wide variety of fields with a common goal of assessing the sustainability of systems. Not being restricted to the information drawn from the life cycle inventory, the integrated metrics also capture additional information, which may not be included in the typical life cycle inventory but which is valuable for understanding product system health or sustainability. Furthermore, integrated metrics do not by definition separate environmental, economic, and social information into separate indicators, and, thus, take a less segmented approach to addressing the three pillars of sustainability.

4.3. Communication of Integrated Metrics

Ultimately, indicators used in sustainability assessment must be communicable and understandable to decision makers as well as to stakeholders [5]. Multi-attribute LCAs may present 10 or more indicators. While this is informative regarding potential environmental impacts, it can hinder decision making when the indicators show trade-offs, or are associated with impacts that are not understood by the decision maker. The four integrated metrics introduced here for use with life cycle approaches can be represented in rather simple quantities of land (EF), energy (EME), money (GNVA), and order or stability (FI). A smaller number of more easily communicated indicators than those normally presented in LCA studies should facilitate understanding and communication about the system, yet capture a larger set of sustainability-relevant information. The traditional LCIA indicators will remain a part of the set of systems information necessary for managing product system sustainability, but will be selectively communicated based on the audience.
We propose no means of weighting to combine and communicate the integrated metrics as a single score as is done for some LCIA methods, as this involves subjective opinions, which can vary widely based on circumstances [80]. The alternative use of integrated metrics that we demonstrated mathematically in Section 3 shows which of two or more options is more sustainable based on superior performance in respect to the integrated metrics as well as the LCIA indicators. When conflict exists between the results of one or more integrated metrics, there cannot be a guarantee than one option is more sustainable than the other.

4.4. Limitations and Challenges of Using Integrated Metrics

Integrated metrics used to assess product systems based on a life cycle approach are partly limited to the same LCA models and frameworks in which LCIA indicators are based. Therefore, they are subject to the same shortcomings, including incomplete data availability, poor quantification of direct impacts on exposed populations, lack of site-specific analysis, and failure to capture all environmental concerns, such as effects of product systems on biodiversity [81]. When specific impacts and/or chemicals are of particular concern, tools from environmental impact assessment and risk assessment can fill in these gaps. Although many impacts are excluded from widely-used LCIA methodologies, LCA practitioners are ever working to develop new methods for impacts not yet covered under LCA, such as biodiversity [82] and indoor air exposure [83].
When impacts are estimated using LCIA, endpoint and furthermore damage indicators present information further along the chain of causality than midpoint indicators. Generally, the further along the chain of causality that indicators are reported, the more uncertainty and subjectivity characterize the LCA results [84]. Integrated metrics incorporate multiple system attributes relevant to their theoretical models, and thus may embody an increased amount of uncertainty like endpoint and damage indicators. This includes uncertainty in the models used to relate resources or impacts with the reporting unit (e.g., land, money), as well as the data uncertainty associated with the LCA or other models. Attempts have been made to provide methods for uncertainty estimation for EF [85] and EME [86,87], but these methods are complex, require a significant amount of additional data on systems (to create probability distributions for both inventory data and characterization factors), and still fall short of quantifying all important sources of uncertainty. Nevertheless, uncertainty must always be considered qualitatively and/or quantitatively to help guide good decision making, and to gauge the degree of precision with which alternatives can be compared. Although integrated metrics may add uncertainty, such methods provide system-level information that is essential in understanding life cycle impacts in a systems context in which sustainability can be evaluated and compared in a relative manner. Moreover, it should be noted the pertinent use of integrated metrics is not for examining fine details, but for providing a broader, systems-based framing of results related to system condition.

4.5. Future Work

Initial development of the methodology and first applications of these four integrated metrics to a consumer products system has identified areas for improvement of these approaches. In particular, there are limitations in current LCA software related to the inability of easily characterizing geographically-distinct processes. As all integrated metrics incorporate spatially-explicit and some time-dependent information, providing this capacity to current LCA software, or handling these differences outside the software, is essential for more meaningful computation of the indicators and for application to other systems that are more diverse. Further, a better understanding of the uncertainty involved when using the integrated metrics in life cycle approaches is necessary before recommending their use in decision making.
Implementation of the EF, EME, GNVA, and FI for comparative assessment will aid in better understanding the benefits and limitations of these metrics. The details of application of GNVA and FI to product systems remains to be fully described and use of EME and EF will be further improved upon existing applications in the LCA context. Computation of these metrics is now in progress to complement LCA studies of paper towels produced in multiple facilities in the U.S.

5. Conclusions

Indicators currently used in life cycle assessment measure potential impacts to the environment or society. However, they fall short of integrating multiple aspects of product systems together into quantitative measures that align with sustainability principles without use of subjective weighting procedures. In this paper, we introduced the concept of integrated metrics and mathematically formulate how they can be used in the context of life cycle assessment. We furthermore summarized four metrics that can provide this information in land (Ecological Footprint), energy (Emergy) and monetary (Green Net Value Added) equivalents as well as an index of system order (Fisher Information). We explained the sustainability-relevant information that each metric provides and identified the indicators from each metric that are applicable to evaluating products. The integrated metrics are best implemented (1) as a group to capture a wider array of sustainability-relevant information, (2) to supplement indicators of specific impact, and (3) for relative comparison (and not absolute valuation) of product systems. Further research is needed to refine their applications in the product system context and demonstrate their usefulness for sustainable product evaluation and design.

Supplementary Materials

Supplementary materials can be accessed at: https://0-www-mdpi-com.brum.beds.ac.uk/2071-1050/6/3/1386/s1.

Acknowledgments

This manuscript was developed under the U.S. EPA’s Office of Research and Development Chemical Safety and Sustainability research program in collaboration with The Procter & Gamble Company (P&G).

Author Contributions

Wesley Ingwersen and Heriberto Cabezas conceptualized, framed and drafted the introduction, motivation, discussion, and conclusion sections of the manuscript (Section 1, Section 3, Section 4 and Section 5). Anne V. Weisbrod helped improve its flow, progression, and clarity. Tarsha Eason, Bayou Demeke, Xin (Cissy) Ma, Seung-Jin Lee and Troy Hawkins drafted sections with the introductions to the selected integrated metrics (Section 2). Jane C. Bare co-wrote the section on LCA (1.2). Manuel Ceja provided the business connection and support for development of the manuscript. All authors provided corrections and suggestions for improving the text.

Conflict of Interest

The authors declare no conflict of interest.

Disclaimer

This article does not reflect the endorsement or opinion of the U.S. Environmental Protection Agency or P&G.

References

  1. Haberl, H.; Erb, K.H.; Krausmann, F.; Gaube, V.; Bondeau, A.; Plutzar, C.; Gingrich, S.; Lucht, W.; Fischer-Kowalski, M. Quantifying and mapping the human appropriation of net primary production in earth’s terrestrial ecosystems. Proc. Natl. Acad. Sci. USA 2007, 104, 12942–12947. [Google Scholar]
  2. Running, S. A measurable planetary boundary for the biosphere. Science 2012, 337, 1458–1459. [Google Scholar] [CrossRef]
  3. Wackernagel, M.; Schulz, N.B.; Deumling, D.; Linares, A.C.; Jenkins, M.; Kapos, V.; Monfreda, C.; Loh, J.; Myers, N.; Norgaard, R.; et al. Tracking the ecological overshoot of the human economy. Proc. Natl. Acad. Sci. USA 2002, 99, 9266–9271. [Google Scholar] [CrossRef]
  4. UN. A 10-Year Framework of Programmes on Sustainable Consumption and Production Patterns. In Proceedings of the Rio+20 UN Conference on Sustainable Development, Rio de Janeiro, Brazil, 20–22 June 2012.
  5. NAS. Sustainability and the U.S. EPA; Committee on Incorporating Sustainability in the U.S. Environmental Protection Agency, National Research Council, National Academy of Sciences: Washington, DC, USA, 2011. [Google Scholar]
  6. NAS. Science in the EPA—The Road Ahead; National Academies Press: Washington, DC, USA, 2012. [Google Scholar]
  7. US EPA. Life Cycle Assessment: Principles and Practice; National Risk Management Research Laboratory, US Environmental Protection Agency: Cincinnati, OH, USA, 2006. [Google Scholar]
  8. ISO 14044: Environmental Management—Life Cycle Assessment—Requirements and Guidelines; International Standards Organization: Geneva, Switzerland, 2006.
  9. Bare, J.; Gloria, T. Environmental impact assessment taxonomy providing comprehensive coverage of midpoints, endpoints, damages, and areas of protection. J. Clean Prod. 2008, 16, 1021–1035. [Google Scholar]
  10. Bare, J. Life cycle impact assessment research developments and needs. Clean Technol. Envir. 2010, 12, 341–351. [Google Scholar] [CrossRef]
  11. Benoît, C.; Mazijn, B. Guidelines for Social Life Cycle Assessment of Products. Available online: http://www.unep.fr/shared/publications/pdf/DTIx1164xPA-guidelines_sLCA.pdf (accessed on 21 December 2013).
  12. Zamagni, A.; Pesonen, H.L.; Swarr, T. From LCA to life cycle sustainability assessment: Concept, practice and future directions. Int. J. LCA 2013, 18, 1637–1641. [Google Scholar] [CrossRef]
  13. Valdivia, S.; Ugaya, C.M.L.; Sonnemon, G.; Hildenbrand, J. Towards a Life Cycle Sustainability Assessment: Making Informed Choices on Products; UNEP: Paris, France, 2011. [Google Scholar]
  14. Norris, G.A. Integrating life cycle cost analysis and LCA. Int. J. LCA 2001, 6, 118–121. [Google Scholar]
  15. Weidema, B.P. The integration of economic and social aspects in life cycle impact assessment. Int. J. LCA 2006, 11, 89–96. [Google Scholar] [CrossRef]
  16. Mazijn, B.; Doom, R.; Peeters, H.; Spillemaeckers, S.; Vanhoutte, G.; Taverniers, L.; Lavrysen, L.; VanBraeckel, D.; Rivera, D. Ecological, Social and Economical Aspects of Integrated Product Policy—Integrated Product Assessment and the Development of the Label “Sustainable Development”: Final Report. Available online: http://www.bernardmazijn.be/fileadmin/pdf/sd-label_products_bernardmazijn.pdf (accessed on 13 November 2013).
  17. Dreyer, L.C.; Hauschild, M.Z. A framework for social life cycle impact assessment. Int. J. LCA 2006, 11, 88–97. [Google Scholar] [CrossRef]
  18. Dreyer, L.C.; Hauschild, M.Z.; Schierbeck, J. Characterisation of social impacts in LCA. Int. J. LCA 2010, 15, 247–259. [Google Scholar] [CrossRef]
  19. Hunkeler, D. Societal LCA methodology and case study. Int. J. LCA 2006, 11, 371–382. [Google Scholar] [CrossRef]
  20. Norris, G.A. Social impacts in product life cycles: Towards life cycle attribute assessment. Int. J. LCA 2006, 11, 97–104. [Google Scholar] [CrossRef]
  21. Labuschagne, C.; Brent, A.C. Social indicators for sustainable product and technology life cycle management in the process Industry. Int. J. LCA 2006, 11, 3–15. [Google Scholar]
  22. Fiksel, J.; Eason, T.; Frederickson, H. A Framework for Sustainability Indicators at EPA; National Risk Management Research Laboratory: Cincinnati, OH, USA, 2012. [Google Scholar]
  23. Samson, R.; Lafontaine, M.; Saad, R.; Tom, M.; Charron-Doucet, F.; Clement, E.; Couture, J.M.; Lamarche, V.; Gilbert, D.; Reveret, J.P.; et al. Environmental and Socioeconomic Life Cycle Assessment of Canadian Milk. Available online: https://www.dairyresearch.ca/file.php?filename=/ var/www/cdrplive/files/news/19/LCA-DFCExecSum_e.pdf (accessed on 3 December 2013).
  24. Friedberg, S. Calculating sustainability in supply chain capitalism. Econ. Soc. 2013, 42, 571–596. [Google Scholar]
  25. Hoof, G.; Vieira, M.; Gausman, M.; Weisbrod, A. Indicator selection in life cycle assessment to enable decision making: Issues and solutions. Int. J. LCA 2013, 18, 1–13. [Google Scholar]
  26. Mark Goedkoop, M.; Sprienm, R. PRe The Eco-Indicator 99: A damage oriented method for life cycle impact assessment. Available online: http://www.pre-sustainability.com/download/misc/EI99_annexe_v3.pdf (accessed on 12 September 2013).
  27. Itsubo, N.; Inaba, A. LIME—A Comprehensive Japanese LCIA Methodology Based on Endpoint Modeling. In Proceedings of the 6th International Conference on EcoBalance, Tsukuba, Japan, 25–27 October 2004.
  28. Morgan, M.G.; Henrion, M. Uncertainty: A Guide to Dealing with Uncertainty in Quantitative Risk and Policy Analysis; Cambridge University Press: New York, NY, USA, 1990. [Google Scholar]
  29. Morgan, M.G.; Keith, D.W. Subjective Judgments by Climate Experts. Env. Sci. Tech. 1995, 29, 465A–476A. [Google Scholar]
  30. Morgan, M.G.; Florig, H.K.; DeKaye, M.L.; Fischbeck, P. Categorizing risks for risk ranking. Risk Anal. 2000, 20, 49–58. [Google Scholar]
  31. Tversky, A.; Kahneman, D. Judgment under uncertainty: Heuristics and biases. Science 1974, 185, 1124–1131. [Google Scholar]
  32. Margni, M.; Curran, M.A. Life cycle impact assessment. In Life Cycle Assessment Handbook: A Guide for Environmentally Sustainable Products; Curran, M.A., Ed.; Scriviner: Beverely, MA, USA, 2012. [Google Scholar]
  33. Cabezas, H. Sustainability indicators and metrics. Sustainability: Multidisciplinary Perspectives; Cabezas, H., Diwekar, U.M., Eds.; Bethem Science: Sharjah, UAE. Available online: http://public.eblib.com/EBLPublic/PublicView.do?ptiID=1049021 (accessed on 3 November 2013).
  34. Saisana, M.; Tarantola, S. State-of-the-Art Report on Current Methodologies and Practices for Composite Indicator Development. Available online: http://en.youscribe.com/catalogue/reports-and-theses/state-of-the-art-report-on-current-methodologies-and-practices-for-1122162 (accessed on 1 November 2013).
  35. Environmental Sustainability Index: Benchmarking National Environmental Stewardship. Available online: http://www.yale.edu/esi/ESI2005_Main_Report.pdf (accessed on 17 December 2013).
  36. Campbell, D.E.; Garmestani, A.S. An energy systems view of sustainability: Emergy evaluation of the San Luis Basin, Colorado. J. Environ. Manag. 2012, 95, 72–97. [Google Scholar] [CrossRef]
  37. Eason, T.; Cabezas, H. Evaluating the sustainability of a regional system using Fisher information in the San Luis Basin, Colorado. J. Environ. Manag. 2012, 94, 41–49. [Google Scholar] [CrossRef]
  38. Heberling, M.T.; Templeton, J.J.; Wu, S. Green Net Regional Product for the San Luis Basin, Colorado: An economic measure of regional sustainability. J. Environ. Manag. 2012, 111, 287–297. [Google Scholar] [CrossRef]
  39. Hopton, M.E.; Cabezas, H.; Campbell, D.; Eason, T.; Garmestani, A.S.; Heberling, M.T.; Karunanithi, A.T.; Templeton, J.J.; White, D.; Zanowick, M. Development of a multidisciplinary approach to assess regional sustainability. Int. J. Sustain. Dev. World Ecol. 2010, 17, 48–56. [Google Scholar]
  40. Hopton, M.E.; White, D. A simplified ecological footprint at a regional scale. J. Environ. Manag. 2012, 111, 279–286. [Google Scholar] [CrossRef]
  41. US EPA. San Luis Basin Sustainability Metrics Project: A Methodology for Evaluating Regional Sustainability; United States Environmental Protection Agency, Office of Research and Development, National Risk Management Research Laboratory: Cincinnati, OH, USA, 2010. [Google Scholar]
  42. Foley, J.A.; DeFries, R.; Asner, G.P.; Barford, C.; Bonan, G.; Carpenter, S.R.; Chapin, F.S.; Coe, M.T.; Daily, G.C.; Gibbs, H.K. Global consequences of land use. Science 2005, 309, 570–574. [Google Scholar] [CrossRef]
  43. Haberl, H.; Wackernagel, M.; Wrbka, T. Land use and sustainability indicators. An introduction. Land Use Pol. 2004, 21, 193–198. [Google Scholar] [CrossRef]
  44. Wackernagel, M.; Rees, W. Our Ecological Footprint—Reducing Human Impact on the Earth; New Society Publishers: Gabriola Island, BC, Canada, 1996; p. 160. [Google Scholar]
  45. Contribution of Working Group I to the Fourth Assessment Report of the Intergovernmental Panel on Climate Change, 2007; Solomon, S.; Qin, D.; Manning, M.; Chen, Z.; Marquis, M.; Averyt, K.B.; Tignor, M.; Miller, H.L. (Eds.) Cambridge University Press: New York, NY, USA, 2007.
  46. Bare, J.C.; Norris, G.A.; Pennington, D.W.; McKone, T. TRACI: The tool for the reduction and assessment of chemical and other environmental impacts. J. Ind. Ecol. 2002, 6, 49–78. [Google Scholar] [CrossRef]
  47. Lee, S.-J.; Hawkins, T.; Ingwersen, W.; Young, D. Exploring the use of ecological footprint in life cycle impact assessment: Findings from a comparison of transportation fuels. J. Ind. Ecol. 2014. accepted. [Google Scholar]
  48. Rugani, B.; Huijbregts, M.A.J.; Mutel, C.; Bastianoni, S.; Hellweg, S. Solar energy demand (SED) of commodity life cycles. Environ. Sci. Technol. 2011, 45, 5426–5433. [Google Scholar] [CrossRef]
  49. Ness, B.; Urbel-Piirsalu, E.; Anderberg, S.; Olsson, L. Categorising tools for sustainability assessment. Ecol. Econ. 2007, 60, 498–508. [Google Scholar] [CrossRef]
  50. Ingwersen, W.W. Emergy as a life cycle impact assessment indicator: A gold mining case study. J. Ind. Ecol. 2011, 15, 550–567. [Google Scholar] [CrossRef]
  51. Atkinson, G. Measuring corporate sustainability. J. Environ. Plann. Manag. 2000, 43, 235–252. [Google Scholar] [CrossRef]
  52. Riahi-Belkaoui, A. Net value added and earnings determination. Rev. Quant. Finance Acc. 1999, 13, 393–399. [Google Scholar] [CrossRef]
  53. Krewitt, W.; Heck, T.; Trukenmuller, A.; Friedrich, R. Environmental damage costs from fossil electricity generation in Germany and Europe. Energy Pol. 1999, 27, 173–183. [Google Scholar] [CrossRef]
  54. Muller, N.Z.; Mendelsohn, R. Measuring the damages of air pollution in the United States. J. Environ. Econ. Manag. 2007, 54, 1–14. [Google Scholar] [CrossRef]
  55. Muller, N.Z.; Mendelsohn, R. The Air Pollution Emission Experiments and Policy Analysis Model (APEEP). Available online: http://www.econ.yale.edu/~nordhaus/Resources/muller_JEEM_Appendix.pdf (accessed on 4 April 2013).
  56. Muller, N.Z.; Mendelsohn, R.; Nordhaus, W. Environmental accounting for pollution in the United States economy. Amer. Econ. Rev. 2011, 101, 1649–1675. [Google Scholar] [CrossRef]
  57. Tol, R.S.J. The Social Cost of Carbon: Trends, Outliers and Catastrophes. Available online: http://www.economics-ejournal.org/economics/discussionpapers/2007-44 (accessed on 2 February 2013).
  58. US-EPA. Guidlines for Preparing Economic Analysis. Available online: http://yosemite.epa.gov/ee/epa/eerm.nsf/vwAN/EE-0568-50.pdf/$file/EE-0568-50.pdf (accessed on 4 February 2013).
  59. Fann, N.; Baker, K.R.; Fulcher, C.M. Characterizing the PM2.5-related health benefits of emission reductions for 17 industrial, area and mobile emission sectors across the U.S. Environ. Int. 2012, 49, 141–151. [Google Scholar] [CrossRef]
  60. Voinov, A.; Farley, J. Reconciling sustainability, systems theory and discounting. Ecol. Econ. 2007, 63, 104–113. [Google Scholar] [CrossRef]
  61. Fath, B.D.; Cabezas, H.; Pawlowski, C.W. Regime changes in ecological systems: An information theory approach. J. Theor. Biol. 2003, 222, 517–530. [Google Scholar] [CrossRef]
  62. Fisher, R.A. On the mathematical foundations of theoretical statistics. Philos. Trans. R. Soc. London. 1922, 222, 309–368. [Google Scholar] [CrossRef]
  63. Mayer, A.L.; Pawlowski, C.W.; Fath, B.D.; Cabezas, H. Applications of fisher information to the sustainable management of environmental systems. In Exploratory Data Analysis Using Fisher Information; Frieden, B.R., Gatenby, R.A., Eds.; Springer: London, UK, 2007; pp. 217–244. [Google Scholar]
  64. Karunanithi, A.T.; Cabezas, H.; Frieden, B.R.; Pawlowski, C.W. Detection and assessment of ecosystem regime shifts from fisher information. Ecol. Soc. 2008, 13. Article 22. [Google Scholar]
  65. Eason, T.; Garmestani, A. Cross-scale dynamics of a regional urban system through time. Région Dével. 2012, 36, 55–77. [Google Scholar]
  66. Eason, T. A Framework for Sustainability Indicators at EPA; US Environmental Protection Agency: Cincinnati, OH, USA, 2012. [Google Scholar]
  67. Gonzalez-Mejia, A.M. Fisher Information—Sustainability Analysis of Several US Metropolitan Statistical Areas. Ph.D. Thesis, University of Cincinnati, Cincinnati, OH, USA, 2011. [Google Scholar]
  68. Gonzalez-Mejía, A.M.; Eason, T.N.; Cabezas, H.; Suidan, M.T. Assessing Sustainability in Real Urban Systems: The Greater Cincinnati Metropolitan Area in Ohio, Kentucky, and Indiana. Environ. Sci. Tech. 2012, 46, 9620–9629. [Google Scholar] [CrossRef]
  69. Haberl, H.; Erb, K.-H.; Gingrich, S.; Kastner, T.; Krausmann, F. Human appropriation of net primary production, stocks and flows of carbon, and biodiversity. In Ecosystem Services and Carbon Sequestration in the Biosphere; Springer: New York, NY, USA, 2013; pp. 313–331. [Google Scholar]
  70. Gong, M.; Wall, G. On exergy and sustainable development—Part 2: Indicators and methods. Int. J. Exergy 2001, 1, 217–233. [Google Scholar] [CrossRef]
  71. Fath, B.D.; Scharler, U.M.; Ulanowicz, R.E.; Hannon, B. Ecological network analysis: Network construction. Ecol. Model. 2007, 208, 49–55. [Google Scholar] [CrossRef]
  72. Zhang, Y.; Baral, A.; Bakshi, B.R. Accounting for ecosystem services in life cycle assessment, part II: Toward an ecologically based LCA. Environ. Sci. Technol. 2010, 44, 2624–2631. [Google Scholar] [CrossRef]
  73. Andersen, M.; Skjoett-Larsen, T. Corporate social responsibility in global supply chains. Supply Chain Manag. 2009, 14, 75–86. [Google Scholar] [CrossRef]
  74. Vance, L.; Cabezas, H.; Heckl, I.; Bertok, B.; Friedler, F. Synthesis of sustainable energy supply chain by the P-graph framework. Ind. Eng. Chem. Res. 2012, 52, 266–274. [Google Scholar]
  75. Michalek, J.J.; Chester, M.; Jaramillo, P.; Samaras, C.; Shiau, C.-S.N.; Lave, L.B. Valuation of plug-in vehicle life-cycle air emissions and oil displacement benefits. Proc. Natl. Acad. Sci. USA 2011, 108, 16554–16558. [Google Scholar] [CrossRef]
  76. National Research Council. Hidden Costs of Energy: Unpriced Consequences of Energy Production and Use; The National Academies Press: Washington, DC, USA, 2010. [Google Scholar]
  77. Odum, H.T. Environmental Accounting; John Wiley & Sons: New York, NY, USA, 1996. [Google Scholar]
  78. Mayer, A.L. Strengths and weaknesses of common sustainability indices for multidimensional systems. Environ. Int. 2008, 34, 277–291. [Google Scholar] [CrossRef]
  79. Raugei, M.; Rugani, B.; Benetto, E.; Ingwersen, W.W. Integrating Emergy into LCA: Potential added value and lingering obstacles. Ecol. Model. 2014, 271, 4–9. [Google Scholar] [CrossRef]
  80. Finnveden, G. Valuation methods within LCA—Where are the values? Int. J. Life Cycle Assess. 1997, 2, 163–169. [Google Scholar] [CrossRef]
  81. Reap, J.; Roman, F.; Duncan, S.; Bras, B. A survey of unresolved problems in life cycle assessment. Int. J. Life Cycle Assess. 2008, 13, 374–388. [Google Scholar] [CrossRef]
  82. Schmidt, J.H. Development of LCIA characterisation factors for land use impacts on biodiversity. J. Clean Prod. 2008, 16, 1929–1942. [Google Scholar] [CrossRef]
  83. Pfister, S.; Koehler, A.; Hellweg, S. Assessing the environmental impacts of freshwater consumption in LCA. Environ. Sci. Tech. 2009, 43, 4098–4104. [Google Scholar] [CrossRef]
  84. Lenzen, M. Uncertainty in Impact and Externality Assessments—Implications for Decision-Making. Int. J. LCA 2006, 11, 189–199. [Google Scholar] [CrossRef]
  85. Beynon, M.J.; Munday, M. Considering the effects of imprecision and uncertainty in ecological footprint estimation: An approach in a fuzzy environment. Ecol. Econ. 2008, 67, 373–383. [Google Scholar] [CrossRef]
  86. Ingwersen, W.W. Uncertainty characterization for emergy values. Ecol. Model. 2010, 221, 445–452. [Google Scholar] [CrossRef]
  87. Li, L.; Lu, H.; Campbell, D.E.; Ren, H. Methods for estimating the uncertainty in emergy table-form models. Ecol. Model. 2011, 222, 2615–2622. [Google Scholar] [CrossRef]

