Article

Socio-Economic Survey as a Support Tool during the Scaling Up of Improved Stoves in the Logone Valley (Chad/Cameroon)

CeTAmb LAB, Research Laboratory on Appropriate Technologies for Environmental Management in Resource-Limited Countries, University of Brescia, via Branze 43, Brescia 25123, Italy
*
Author to whom correspondence should be addressed.
Sustainability 2014, 6(3), 1427-1447; https://0-doi-org.brum.beds.ac.uk/10.3390/su6031427
Submission received: 2 October 2013 / Revised: 6 March 2014 / Accepted: 12 March 2014 / Published: 19 March 2014

Abstract

:
Field assessment plays a key role in the evaluation of the energy access modalities and of the socio-economic features that may influence the beneficiaries’ choices and preferences in the adoption and use of an energy technology. This work presents the findings of a survey conducted during the implementation of a cooperation project in the Logone Valley (Chad/Cameroon). After an initial period of promotion of an improved cookstove (ICS), a survey was conducted that was aimed at identifying different beneficiary groups, matching their preferences and cooking habits to the technology proposed, in order to best tailor the scaling-up strategy. In-depth analysis of the data gathered identified two household-user behaviors and the relative influencing features: in the urban area, the increased adoption rates confirmed the appropriateness of the technology proposed and its sustainability, whereas in the rural area, ICS use was not perceived by the final users as advantageous and lower adoption rates were observed. Thus, due to the outcome of the survey, the project action was re-oriented in order to achieve a higher impact on the territory and on the population.

1. Introduction

Sustainability of environmental cooperation projects in low- and middle-income countries is a main challenge that takes its roots in the initial assessment phase and may be guaranteed also by means of continuous monitoring during the implementation phases. This approach applies to several environmental matrixes involved in development cooperation interventions, such as drinking water [1,2] sanitation [3], and solid waste [4,5]. A prerequisite for the success of such interventions is a perfect knowledge of the issue that the project is facing and of the local context, not only in terms of measurable indicators (i.e., resource measures, statistical data, etc.), but also in terms of specific population habits and practices according to their socio-economic features.
In the case of energy access projects, attention to these aspects and adoption of assessment and monitoring tools is particularly important. There are 2.6 billion people, mainly in developing countries, using traditional solid fuels (wood, charcoal, waste biomass, etc.) as a main household energy source [6]. This is associated with a number of socio-economic and environmental issues that relate to poverty and gender, land use change and deforestation, indoor air pollution and public health, as well as to climate change and greenhouse gas emissions [7]. This has played as input for a number of international cooperation interventions and initiatives, as well as for energy policies at a regional and national scale, often not focused on the specific needs of the real population, but more oriented towards modernity or innovation [8,9]. This has often resulted in the promotion of inappropriate technologies or unaffordable modern fuels [10,11,12,13], proposed without taking into account the socio-economic patterns and the habits/preferences of the beneficiary target population that will actually have to use the new household energy technology [14,15,16].
On-field assessment therefore plays a relevant role in the evaluation of the energy access modalities and of the socio-economic features that may influence the beneficiaries’ choices and preferences in the adoption and use of an energy technology. Understanding the key drivers and priorities of energy access is fundamental in planning and implementing sustainable strategies and policies to effectively address them [17,18]. In particular, both the start-up and the scale-up of energy access solutions and technologies need a wide approach: innovative business and market models [19,20] in the preliminary phase and cost-benefit analysis [21,22] in the implementation and evaluation phases are methodological tools already applied, but often they do not consider all the factors for the success and sustainability of the actions, that are too focused on output, service delivery or dissemination [23]. In fact, the socio-behavioral aspects and the common practices and habits need to be observed and correlated to the socio-economic features of the beneficiaries and to the measurable indicators meaningful for the action (direct costs and benefits, including when possible fuel expenditure and savings, income generation, health impacts, environmental conservation, reduction in greenhouse gas emissions, etc.) [24,25,26,27]. Comprehensive qualitative and quantitative surveys can highlight those factors perceived by project stakeholders and beneficiaries as being most critical to the program’s success to date as well as the factors considered most likely to have an impact on its future success. Thus, there is the necessity to design and use monitoring and evaluation indicators that adequately assess the needs of beneficiaries and describe the living conditions of families and communities, targeted by energy-access programs and initiatives. In this direction, many efforts have been made by international organizations and scientists in proposing different indexes that indicate the different dimensions of household energy access [28,29,30,31,32,33].
This paper presents the results of field observations conducted by the authors within the activities of an International Development Cooperation project (ENV/2006/114-747) carried out by the Italian NGO ACRA (Association for Rural Cooperation in Africa and Latin America) and funded by the EU in the Logone River Valley at the border between Chad and Cameroon. The project supported the creation of community-based committees for the participative management of natural resources. The reduction of wood consumption for household use was among the aims of the project. Appropriate technologies for household energy supply were considered to achieve the objective of reducing wood consumption, in particular through the promotion of existing effective improved stove models [34]. The dissemination of low-technology but high-efficiency models was implemented, keeping in mind the socio-economic conditions both of the local population (minimal investment capacity due to very low levels of income and traditional cooking practices) and the skills and the tools available for small local workshops. After the first period of implementation of the project, a survey was conducted with the aim of identifying different beneficiary groups, matching their preferences and cooking habits to the improved cookstove model proposed, in order to have an intermediate evaluation and plan the following steps.
This paper presents the findings of such a survey and the conclusions drawn, that were useful in the following phases of the project implementation. In itinere assessment is a useful tool for the practical implementation of international cooperation projects, in particular when data gathered are analyzed with a rigorous and comprehensive approach. Often these surveys are conducted with the sole purpose of identifying the local needs in the initial assessment phase in order to gain information for the writing of the project proposal, without a deep analysis of the data collected; sometimes the survey is meant to quantify project indicators in the final evaluation. In this case, the authors want to show the usefulness of such a method in the implementation phase, especially in terms of addressing the action in a more tailored way to the local features. Moreover, a good knowledge of the local context allows the placing of interventions which have a higher chance of becoming sustainable in the long run, especially for their compatibility with local-specific conditions. Finally, this paper contributes data about energy access patterns, which are seldom available in the international literature, and therefore may be taken as a reference case study for other similar works.

2. Material and Methods

2.1. Study Area

The Chadian energy sector is largely underdeveloped. The exorbitant cost and scarcity of electricity poses a major obstacle to national economic development. Biomass is the primary energy source for the majority of the country’s rural population, with over 93% using traditional biomass fuels. The wood resources of the country have suffered very significant damage due to considerable pressures: drought, agricultural clearing, bush fires, the impact of transhumance and collection of firewood for urban needs. However, Chad is implementing a village-based management program, with the help of an autonomous private agency, AEDE (Agence pour l’Energie Domestique et l’Environnement), and the introduction of a new “law and decree” to support the efficient management of the wood fuel sector [35]. A plan for household energy supply proposed by AEDE elaborated a strategy aimed at the reduction of wood energy demand at a household level. That strategy foresees wood consumption reduction through the adoption of improved stoves and charcoal substitution with liquefied petroleum gas (LPG) [36]. The LPG market was strongly subsidized, but in peri-urban areas, the supply of such a modern fuel experienced shortages and price increases, resulting in undesired effects. Many households that adopted LPG early on ended up “moving down the energy ladder,” and returned to cooking with charcoal. Similar cases have been documented in many developing countries such as Nigeria [37]. The increasing demand for charcoal, which was produced in rural areas through low efficiency of carbonization processes, led in 2009 to the total ban of the production, import and sale of that traditional solid fuel, in order to face the overexploitation of forest resources. This restriction has caused a huge increase in the price of the fuel, thereby making it too expensive for most families to afford. Any more modern alternative was likely to provide the local population with an affordable and reliable energy source. LPG, even when sold at a subsidized price, was consequently unaffordable for the large share of a population that cannot afford to invest in both the gas burner and the bottle. Moreover, the only available fuel was dry wood, whereby the price more than doubled from 15 Centrafricain (CFA) francs/kg in 2008 to 40 CFA francs/kg in 2011 (according to price observations on site by the author [34]), resulting in serious issues in fuel supply for the local population. Figure 1 shows the trend in fuelwood price observed by the author on site (years 2008–2011) or reported by other previous studies [36] (years 2002–2007), compared to the one calculated according to the inflation rate provided by the World Bank website for each year [38]. The effect of the ban of charcoal in 2009 is clearly the cause of a disproportionate increase in the price (+135% in the period 2008–2011).
Figure 1. Differences between wood prices observed on site by the authors and calculated according to inflation rates by the World Bank [38].
Sustainability 06 01427 g001
According to data collected by the authors in a preliminary survey on site, the vast majority of people (98%) rely on wood for daily cooking; 69% of them use a rudimental three-stone fire. The access to modern fuels is very limited (1.8%), even lower than the already low national average (2.5% for Chad, 2.6% for rural areas in Cameroon) [39].

2.2. Survey Methods

Semi-structured interviews were used in quantitative surveys to obtain comparable information representative of the total target group [40]. Random samples were chosen among the rural population living in 13 out of the 132 villages and in the two small towns (urban population) in the intervention area. A total number of 161 semi-structured interviews took place: 115 in rural villages, and 46 in urban areas. Considering the average family size, that results in a population sample of about 1500 people.
World Bank guidelines for questionnaire designs in Living Standard Measurement Studies [41] and Standard Monitoring Packages for Household Energy Projects of the University of Liverpool [42] were taken as a reference in the preparation of the survey. In order to make them understandable and appropriate to the local habits and culture, some questions were rearranged and others were added in order to get some peculiarities of the local context. The interviews were conducted by the authors with the unavoidable translation support of the local staff of ACRA NGO. People were recruited in their own household location, in order to observe directly their cooking place and tools. Questions were structured in order to avoid bias due to undesired effects on the respondents such as social-desirability (people tend to answer not according to their own opinion but according to social norms or what the respondent thinks would be the desired answer for the interviewer) and revised after some preliminary tests. The final version of the questionnaire used is reported in the annexes (Table A1).
The interviews consisted of five short question sections. Section 1 allowed gathering the household demographics. Section 2 investigated the local cooking practices: the habits, the number of daily meals, the cooking time and the stove model used. Section 3 aimed at quantifying the need for fuel, gathering information on the fuel provision mode, the frequency and distance for the fuel supply and the eventual fuel expenditure. Section 4 regarded the lighting facilities and expenditure.
A final checklist was included to evaluate the Energy Supply Index (EIS): this index was elaborated by Practical Action and GIZ (Gesellschaft für Internationale Zusammenarbeit) [43] and proposed to indicate the progress in the energy service standards, outlined in Table 1. The index measures the three main supply dimensions of energy access—household fuels, electricity and mechanical power—by assigning a numerical value indicating how difficult is for people to access energy supplies, with 1 being the lowest and 5 the highest level of access. Actually, the EIS was revised in the 2012 version of the Poor People Energy Outlook [44], but it was not possible to elaborate data gathered on field according to the new indications. Nevertheless, some interesting considerations, proposed in the following paragraphs are meaningful and worth being discussed. Data obtained were elaborated analytically in order to highlight correlations between different energy access patterns and socio-economic features. The statistical analysis of data collected was done using the SPSS® software for the calculation of the analysis of correspondence, the comparison of means and the box-plot graphical representation.
Table 1. Checklist used to define the Energy Supply Index [31].
Energy SupplyLevelQuality of Supply
Household fuels1Collecting wood or dung and using a three-stone fire
2Collecting wood and using an improved stove
3Buying wood and using an improved stove
4Buying charcoal and using an improved stove
5Using a modern, clean-burning fuel and stove combination
Electricity1No access to electricity at all
2Access to third party battery charging only
3Own low-voltage DC access for home applications
4240 V AC connection but poor quality and intermittent supply
5Reliable 240 V AC connection available for all uses
Mechanic Power1No access to mechanical power. Hand power only with basic tools
2Mechanical advantage devices available to magnify human/animal effort
3Powered (renewable or fossil) mechanical devices available for some tasks
4Powered (renewable or fossil) mechanical devices available for most tasks
5Mainly purchasing mechanically processed services

3. Results and Discussion

The following paragraph discusses each question cluster used in the questionnaire.

3.1. Socio-Economic Features of the Population Surveyed

The socio-economic features of the population surveyed were investigated according to the information gathered in the first cluster of the questionnaire. On average, the household was composed of nine members (two adult men, three adult women and four children). In particular, two different stakeholders were identified according to their roles in energy management at household level. The household head is usually the man (89%), and the person in charge for the preparation of the meals and for the cooking tasks for the family (in the following called “cooking manager”) is, in the vast majority of the cases, the woman (97%). The socio-economic features of the population sample interviewed are summarized in Table 2. The school level, as the highest national degree of school attended, was also investigated. Education level attained is generally higher in urban areas compared to rural, with men accessing education more frequently than women. A similar situation can be appreciated in urban areas, where, as said, the school level is higher.
Some considerations were elaborated about the income level of the households surveyed. Those interviewed were asked to give an indication of their average weekly income. In some cases, mainly in the rural areas where agriculture is the predominant activity, the people interviewed were not able to provide a monetized value; therefore, an indirect estimation was done on the basis of the seasonal agricultural production (number of bags of pearl millet, peanut or other saleable products multiplied by their relative prices observed in the local markets) and the number of livestock (for each animal, its value and useful life were considered. Chicken: 1500 CFA francs, 1 year; Goat: 10,000 CFA francs, 4 years; Cow: 110,000 CFA francs, 10 years). Four income classes were identified, and 65% of the population surveyed lives under the poverty threshold, which is 1.25 US$ per capita per day (about 600 CFA francs) [45], 79% with less than 2 US$ per day (about 1000 CFA francs). These impressive data are in line with the Chadian national ones that assess 63% of the Chadian population living under the poverty line and 83% with less than 2 US$ per day [38]. The average value in rural areas (345 CFA francs = 0.7 US$ per capita per day) is five times lower than the average one in the urban areas (1814 CFA francs = 3.6 US$ per capita per day). The influence on the household income level of the social data presented above was also investigated. Due to the high uncertainty variability of salaries for the different occupation types considered, and the weak involvement of the rural population in the monetized economy, no significant correlation between the occupation type and the income level was found, whereas a good positive correlation between the school level of the household head and the income level was observed.
Table 2. Socio-economic features of the population sample interviewed.
Cooking managerHousehold head
rural areaurban arearural areaurban area
Occupation
  farmer24%0%77%0%
  shop holder4%4%0%9%
  teacher1%2%3%11%
  student0%9%4%0%
  employee0%17%5%50%
  house manager71%59%5%13%
  not answered0%9%6%17%
Educational level
  None71%9%50%4%
  Primary26%14%35%9%
  Secondary2%67%12%56%
  Superior1%10%3%31%

3.2. Cooking Habits

Different cooking places were observed on site (see Annexes, Figure A1): outdoors in the open air, under a ventilated stand or in a closed room. The choice of the place depends on the household layout, the season, and the preferences of the cook. It was observed that in the rainy season (in the Logone Valley usually from May to September), a large share of the population cooks indoors (83% in the rural areas, 63% in the urban areas). In the dry season, cooking outside (in the open air or under a ventilated stand) is the preferred option (88% in the rural areas, 65% in the urban areas). This seasonal switch is more noticeable in the rural areas, probably due to the household layout, where, even if each household has a dedicated kitchen room, in the hot season, cooking outdoors results in more comfort. In the urban areas, people live in defined compounds and often have a conventional kitchen room inside the main building for both seasons.
A number of different stove models were observed (see Annexes, Figure A2). The most common system used is the three-stone fire, used in 64% of the households. Some different configurations of a self-constructed fireplace were observed on site, mainly in the rural context. The traditional fireplace consists of a mud structure with a frontal inlet for the fuel and two pot places, built against a wall both indoors and outdoors. The “Centrafricain” improved cookstove (ICS), promoted by the project, was also observed in the field: it is a simple stove with a metal structure and a clay belt surrounding the combustion chamber. It is produced by properly trained local handicrafts with materials available locally. Several tests performed on-site by the authors [34] assessed its effectiveness in reducing wood consumption in the daily local cooking practices.
In rural areas, 95% of the population uses open fire and traditional systems, which are not or slightly improved. Before the project, access to ICS models was very low (15% of the urban population, in line with national statistics [39]); at the time of the survey, a high share of the population was provided with ICS in the urban areas (46%), in comparison with the country level. That may indicate, on the one hand, the success of the intervention in the urban context, driven by some socio-economic factors, such as the direct impact on the household budget thanks to fuel savings due to the adoption of the ICS; on the other hand, it was not very widespread in rural areas, due to a number of barriers. Among the 161 households surveyed, 28% used more than one stove model. In particular, 78% out of these were rural households that normally used the three-stone fire, while in the rainy season, they used the traditional fixed system installed indoors. Only 2% used an improved stove as an alternative system, and only 1% sometimes used LPG.
Figure 2a shows the distribution of the users of a certain cooking system according to the educational level of the household head. While the use of traditional fireplaces and three-stone fires occur mainly in households where the head has a low educational level, the use of improved systems is more typical of a higher level of education by the household head. A similar trend can be appreciated also according to the educational level of the cooking manager (Figure 2b). These observations may be interpreted as indicators of the importance of awareness about energy issues also at household level that currently are understood by the more educated part of the population, but have to be understood by the whole population in order to achieve a real development in this sector.

3.3. Fuel Use Patterns

Almost the totality of households (99%) uses wood as the main fuel for cooking purposes. In addition, 48% uses a complementary fuel. For 76% of these, the main secondary fuel used is millet reeds, used in the rural areas during the harvesting season, when these crop residues are easily available in the field. Charcoal (15%), petrol (6%) and LPG (2%) are the other secondary fuels, used mainly by urban households.
Fuel procurement mode was also investigated. There is a clear difference between the rural area, where 63% of the households interviewed collect for free the wood required for their daily cooking needs, and the urban area, where 93% purchase the cooking fuel. Moreover, 30% of rural people collect wood and other biomass fuel (millet reeds) during the dry season and purchase wood during the rainy season, when the entire day is dedicated to the work in the crop fields and no time is available for fuel collection. People using the three-stone fire mainly collect their own fuel (57%), rather than purchasing it (22%). People using an improved system usually (88%) purchase the fuel.
Fuel procurement happens on average two times per week, either if collected or purchased. Usually the person in charge of this activity is the woman (93%); only in some cases are they helped by children or the man. Regarding this aspect, there are little differences between the rural and the urban context, or according to the fuel procurement mode. It can be observed that the man’s involvement in the fuel procurement occurs mainly when the fuel is purchased.
Figure 2. Distribution of the share of users of a cooking system according to educational level of the household head and of the cooking manager.
Sustainability 06 01427 g002
The weekly burden of time and distance to be walked according to the fuel procurement mode was studied. Both the distance and the time spent to gather fuel by rural users is significantly higher than for (urban) people who purchase fuel. In urban areas, fuel is purchased in the local market during the weekly shopping time or brought directly to the household by the sellers. Users who gather wood of other biomass fuel only during certain periods (as explained before) do not have an additional burden of time and distance, as they find the fuel directly in the field or along the way back home. The total burden of time related to household energy activities (i.e., cooking time and fuel procurement time) is therefore higher for rural (36 h per week) than for urban households (29 h per week); this difference is significantly higher for fuel collectors, who spend 47 h per week in the household-energy-related activities, compared with the 28 h spent by the wood purchaser.
Figure 3 reports the different fuel procurement modes of the households interviewed according to their income class. The share of households relying on collection for their fuel procurement decreases with the increasing income level. Respectively, the share of population with a higher income level is likely to purchase the cooking fuel, this procurement mode being more convenient and easy in comparison with the drudgery of the collection activity.
Figure 3. Fuel procurement modes of the households interviewed according to income class.
Sustainability 06 01427 g003
Other fuel procurement patterns observed in the population sampled are:
  • On average, three-stone fire and traditional fireplace users spend more time (about 2.5 h per time) than ICS users (0.5 h). This is likely to be linked to the different income levels of these two groups, as deducible by the observations above and by the less frequent need for supply due to lower consumption;
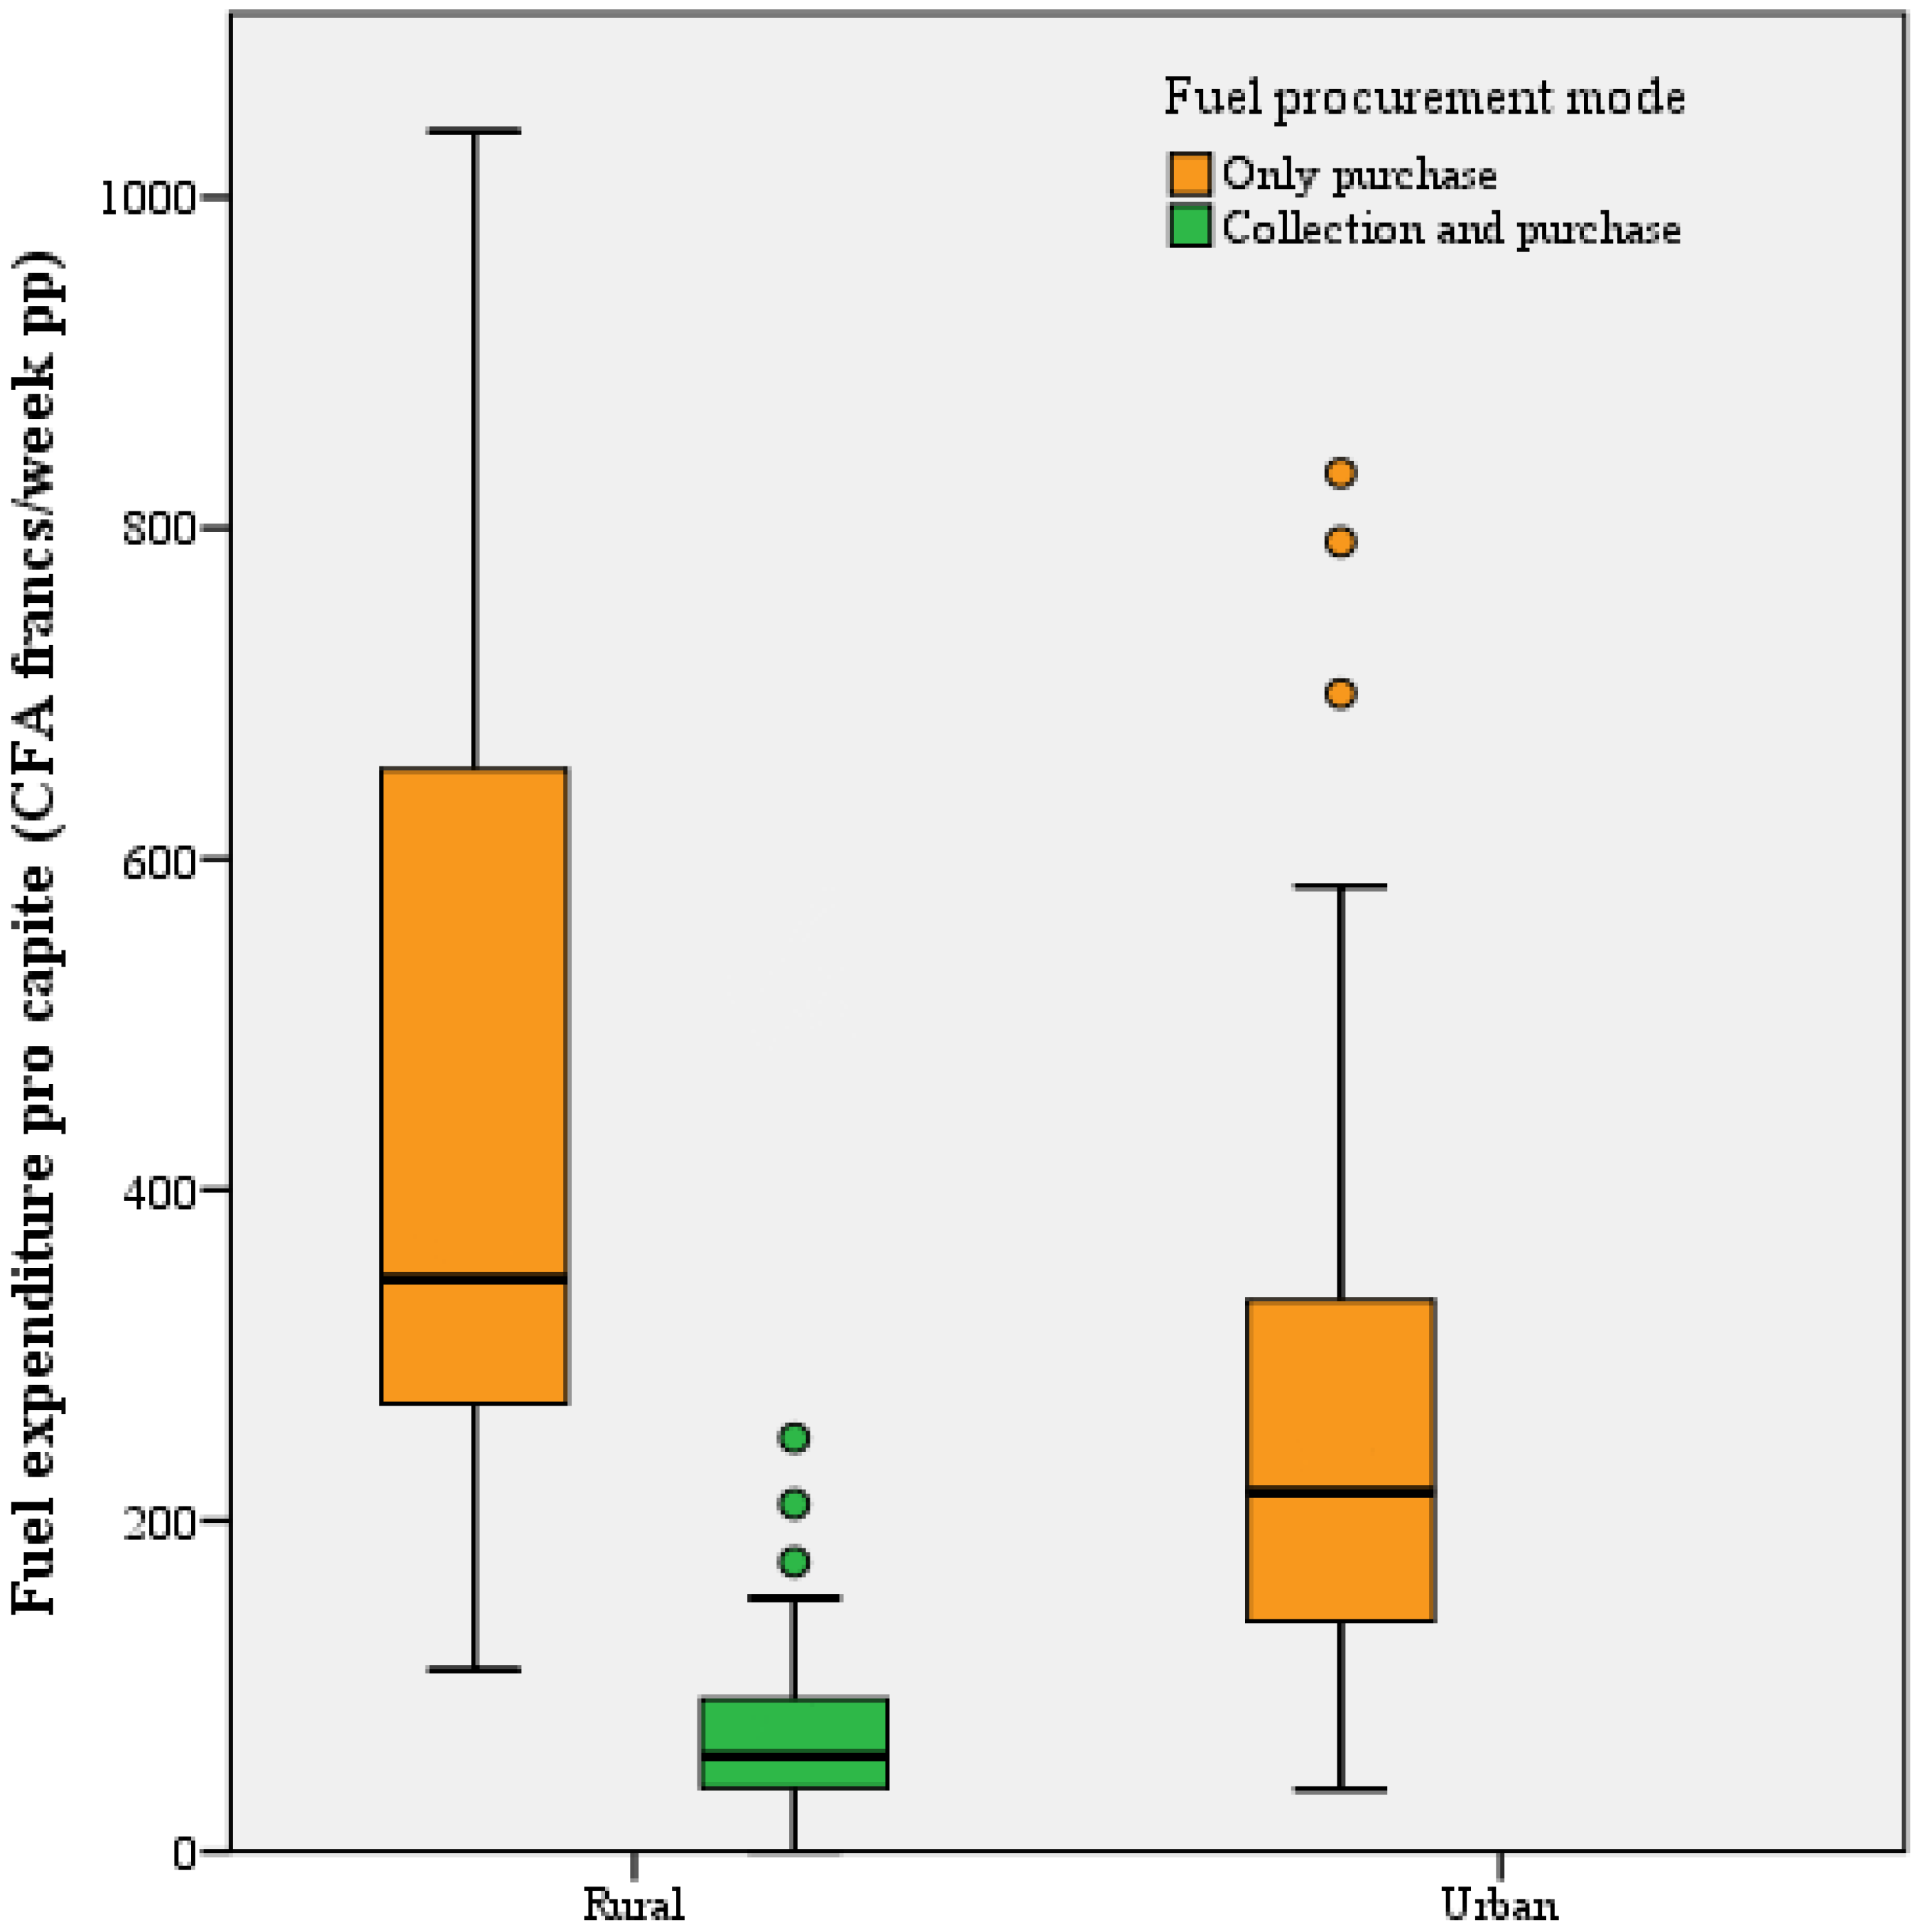
  • A higher fuel procurement time can be observed in the population using only wood as household fuel (about 4 h per time), while the group using supplementary fuels, in particular agricultural residues such as millet reeds and charcoal (probably illegally self-produced), have a significantly lower time engagement (0.5 h per time). That is probably due to the fact that such secondary fuels are collected or produced close to the household;
Fuel expenditure was investigated with a particular focus on the group of interviewed people that, partially or totally, purchase fuel. The average expenditure in the households that only purchase fuel is 329 CFA francs/week per person, while lower per capita fuel expenditure (85 CFA francs/week per person) was observed in the group that partially collects fuel; that indicates the economic advantages of such a practice in the fuel procurement. A minimal average expenditure (26 CFA francs/week per person) was observed also in the sub-sample households that mainly collect their fuel. That is due to the common practice of the occasional use of petrol as emergency fuel or for fast food-reheating. A significant difference was observed according to the urban/rural divide, as illustrated in Figure 4. In the rural area, the median per capita fuel expenditure is higher (346 CFA francs/week per person) in comparison to the one in the urban area (217 CFA francs/week per person). That is likely to be due to the fact that in the urban area, ICS are more common than in the rural areas.
The correlation of fuel expenditure with the income level of the population surveyed was also investigated, as illustrated by the data reported in Table 3. This trend is more evident in the rural areas where the median weekly fuel expenditure per person is higher in the high income class in both the populations grouped according to procurement mode. In the urban areas, this trend is slighter: that may indicate that the energy needs are almost independent from the income level, but are similar and reflect the cooking habits and practices, which are transverse to all the population sampled.
Figure 4. Total weekly fuel expenditure per person according to income class.
Sustainability 06 01427 g004
Table 3. Fuel expenditure per person according to income class.
Fuel expenditure per person (median) [CFA francs/week pp]
Fuel procurement modeCollection/PurchaseOnly purchase
AreaRuralUrbanRuralUrban
Income class<1.25 US$/day46-271194
1.25–2 US$/day72-808163
2–5 US$/day---225
>5 US$/day77-1040272
Main social-economic feature influence on the total fuel expenditure was also investigated. Figure 5b shows the decreasing fuel expenditure observed in both groups “Collectors and purchasers” and “Only purchasers” with the increasing educational level of the cooking manager. A similar trend cannot be observed clustering the sample according to the educational level of the household head (Figure 5a). Lower fuel expenditure was observed in households where the head is female rather than male (−33%–70%). The woman, even when household head, is in charge of the daily family budget management (including the cooking expenditure); she therefore has a higher and more direct control of such expenses.
The influence on fuel expenditure of cooking habits and practices was also investigated. The main factor, as already discussed, is the fuel procurement mode. It is self-evident that fuel gathering has a positive impact in reducing the household fuel expenditure.
Figure 5. Total weekly fuel expenditure per household according to educational levels of the household head (a) and of the cooking manager (b). Note the different scales for the two series of data.
Sustainability 06 01427 g005
Other household energy patterns that influence the fuel expenditure are the cooking system and the fuel mix in use. The use of an improved system ranges in a lower interval (50–3000 CFA francs/week) in comparison to the use of the three-stone fire (500–5000 CFA francs/week). The average and median value of expenditure for the ICS users results equal to 1500 CFA francs/week, while for the three-stone fire users, the median value is 2300 CFA francs/week, while the arithmetic mean is 3700 CFA francs/week. The higher variability of this range is likely to be due to the higher influence of user behaviors on fire operations, and therefore on fuel consumption, whereas in the improved systems, it is more limited.
The influence of the fuel mix in use on the total household fuel expenditure was also investigated. Since would is, the primary fuel used by almost all the households surveyed, some meaningful elaborations can be made according to the secondary fuel in use. In the sub-sample of households who both collect and purchase their own fuel, the savings due to the supplementary seasonal use of millet reeds in the household fuel mix are noticeable, resulting in a total fuel expenditure 66% lower than the one registered for the complementary share group (400 CFA francs/week against 1200 CFA francs/week). This promising opportunity was investigated deeper by the authors, who also studied the possible introduction of an original improved cookstove for the recovery of a locally available waste biomass (rice husk) [46] as a household fuel. In the sub-sample of “fuel purchaser”, the fuel mix is more variegated. The highest median values were found for the more modern fuel users (LPG 3150 CFA francs/week and petrol 2600 CFA francs/week). In the “fuel purchasers” group, the LPG, petrol and charcoal users’ median fuel expenditure was higher than the one of “only-wood users”. Different fuel mixes rank in an order very similar to the one of the energy ladder: the more modern the fuels in use in the household energy mix, the higher the relative expenditure, which may be assumed to be an indicator of the income level, as already discussed.
Figure 6 highlights how fuel expenditure has a significantly higher impact on the household income budget in the poorer population rather than in the richer one. This disproportion is particularly evident for the share of population living with less than 1.25 US$ per day. For this group, the fuel expenditure engages on average 8%–9% of the household income, while for the richest group, such a budget accounts only for 1%–2%.
Figure 6. Share of fuel expenditure on household budget.
Sustainability 06 01427 g006

3.4. Energy Supply Index Assessment

The Energy Supply Index (ESI) [31] was assessed for each household based on the responses given and observations of the interviewer. Table 4 reports the average ESI values observed in rural and urban areas.
Table 4. Average ESI values observed on site.
FuelsElectricityMechanic power
Rural1.311.231.03
Urban2.653.042.43
Total1.701.751.43
The average ESI values indicate the low level of energy supply of the context studied. As better detailed in the previous paragraphs, in rural areas, the fuel procurement consists mainly of collecting wood and using a three-stone fire, while in the urban areas, a higher share of the population has access to improved systems and can buy wood, resulting in a higher average ESI value for the urban areas (ESIfuel, urban = 2.65) than in the rural ones (ESIfuel, rural = 1.31). A similar situation has been registered with regard to electricity access, which is practically absent in the rural areas (ESIelectricity, rural = 1.23), while in urban areas, a small share of the population has access to a poor quality and intermittent supply connection (ESIelectricity, urban = 3.04). Also, the access to mechanical power is dramatically low, as indicated by low ESI for this aspect (ESImec = 1.43). This fact has strong implications on the production and manufacturing activities that are seriously limited in their capacities, tools and skills. Clustering the sample according to the educational level of both household head and cooking managers highlights the increasing ESI values with the increasing educational level, as shown in Figure 7. A similar trend can be appreciated for the income class divide.
Figure 7. ESI assessment according to the educational level of household head.
Sustainability 06 01427 g007
Figure 8 shows the relation between the total fuel expenditure and the relative ESIfuel values assessed for the households surveyed. It is evident that a higher median value of fuel expenditure corresponds to a higher value of the index, even if the variability of the ranges is quite high. The ESIfuel category correspondent to the users of modern fuels shows a limited range only due to the low number of cases (therefore not really significant) registered in the survey.
Figure 8. Total fuel expenditure according to ESIfuel values assessed in the household surveyed.
Sustainability 06 01427 g008

4. Discussion

The outcomes of the survey highlighted the strengths and the weaknesses of the promotion of improved cookstove systems for the reduction of wood consumption at household level. In the case study, local population practices, habits and preferences related to cooking technologies and fuels were assessed in response to the survey. A deep analysis of the data gathered allowed the identification of two household user behaviors and the relative features that influenced the implementation of the action promoted by the project. A significant difference was found according to the urban/rural divide, where opposite energy access patterns (fuel procurement, cooking habits as detailed in the Results section) were observed. This fact influences the energy choices by the local population, determining the barriers in the adoption of improved cooking systems in the intervention areas.
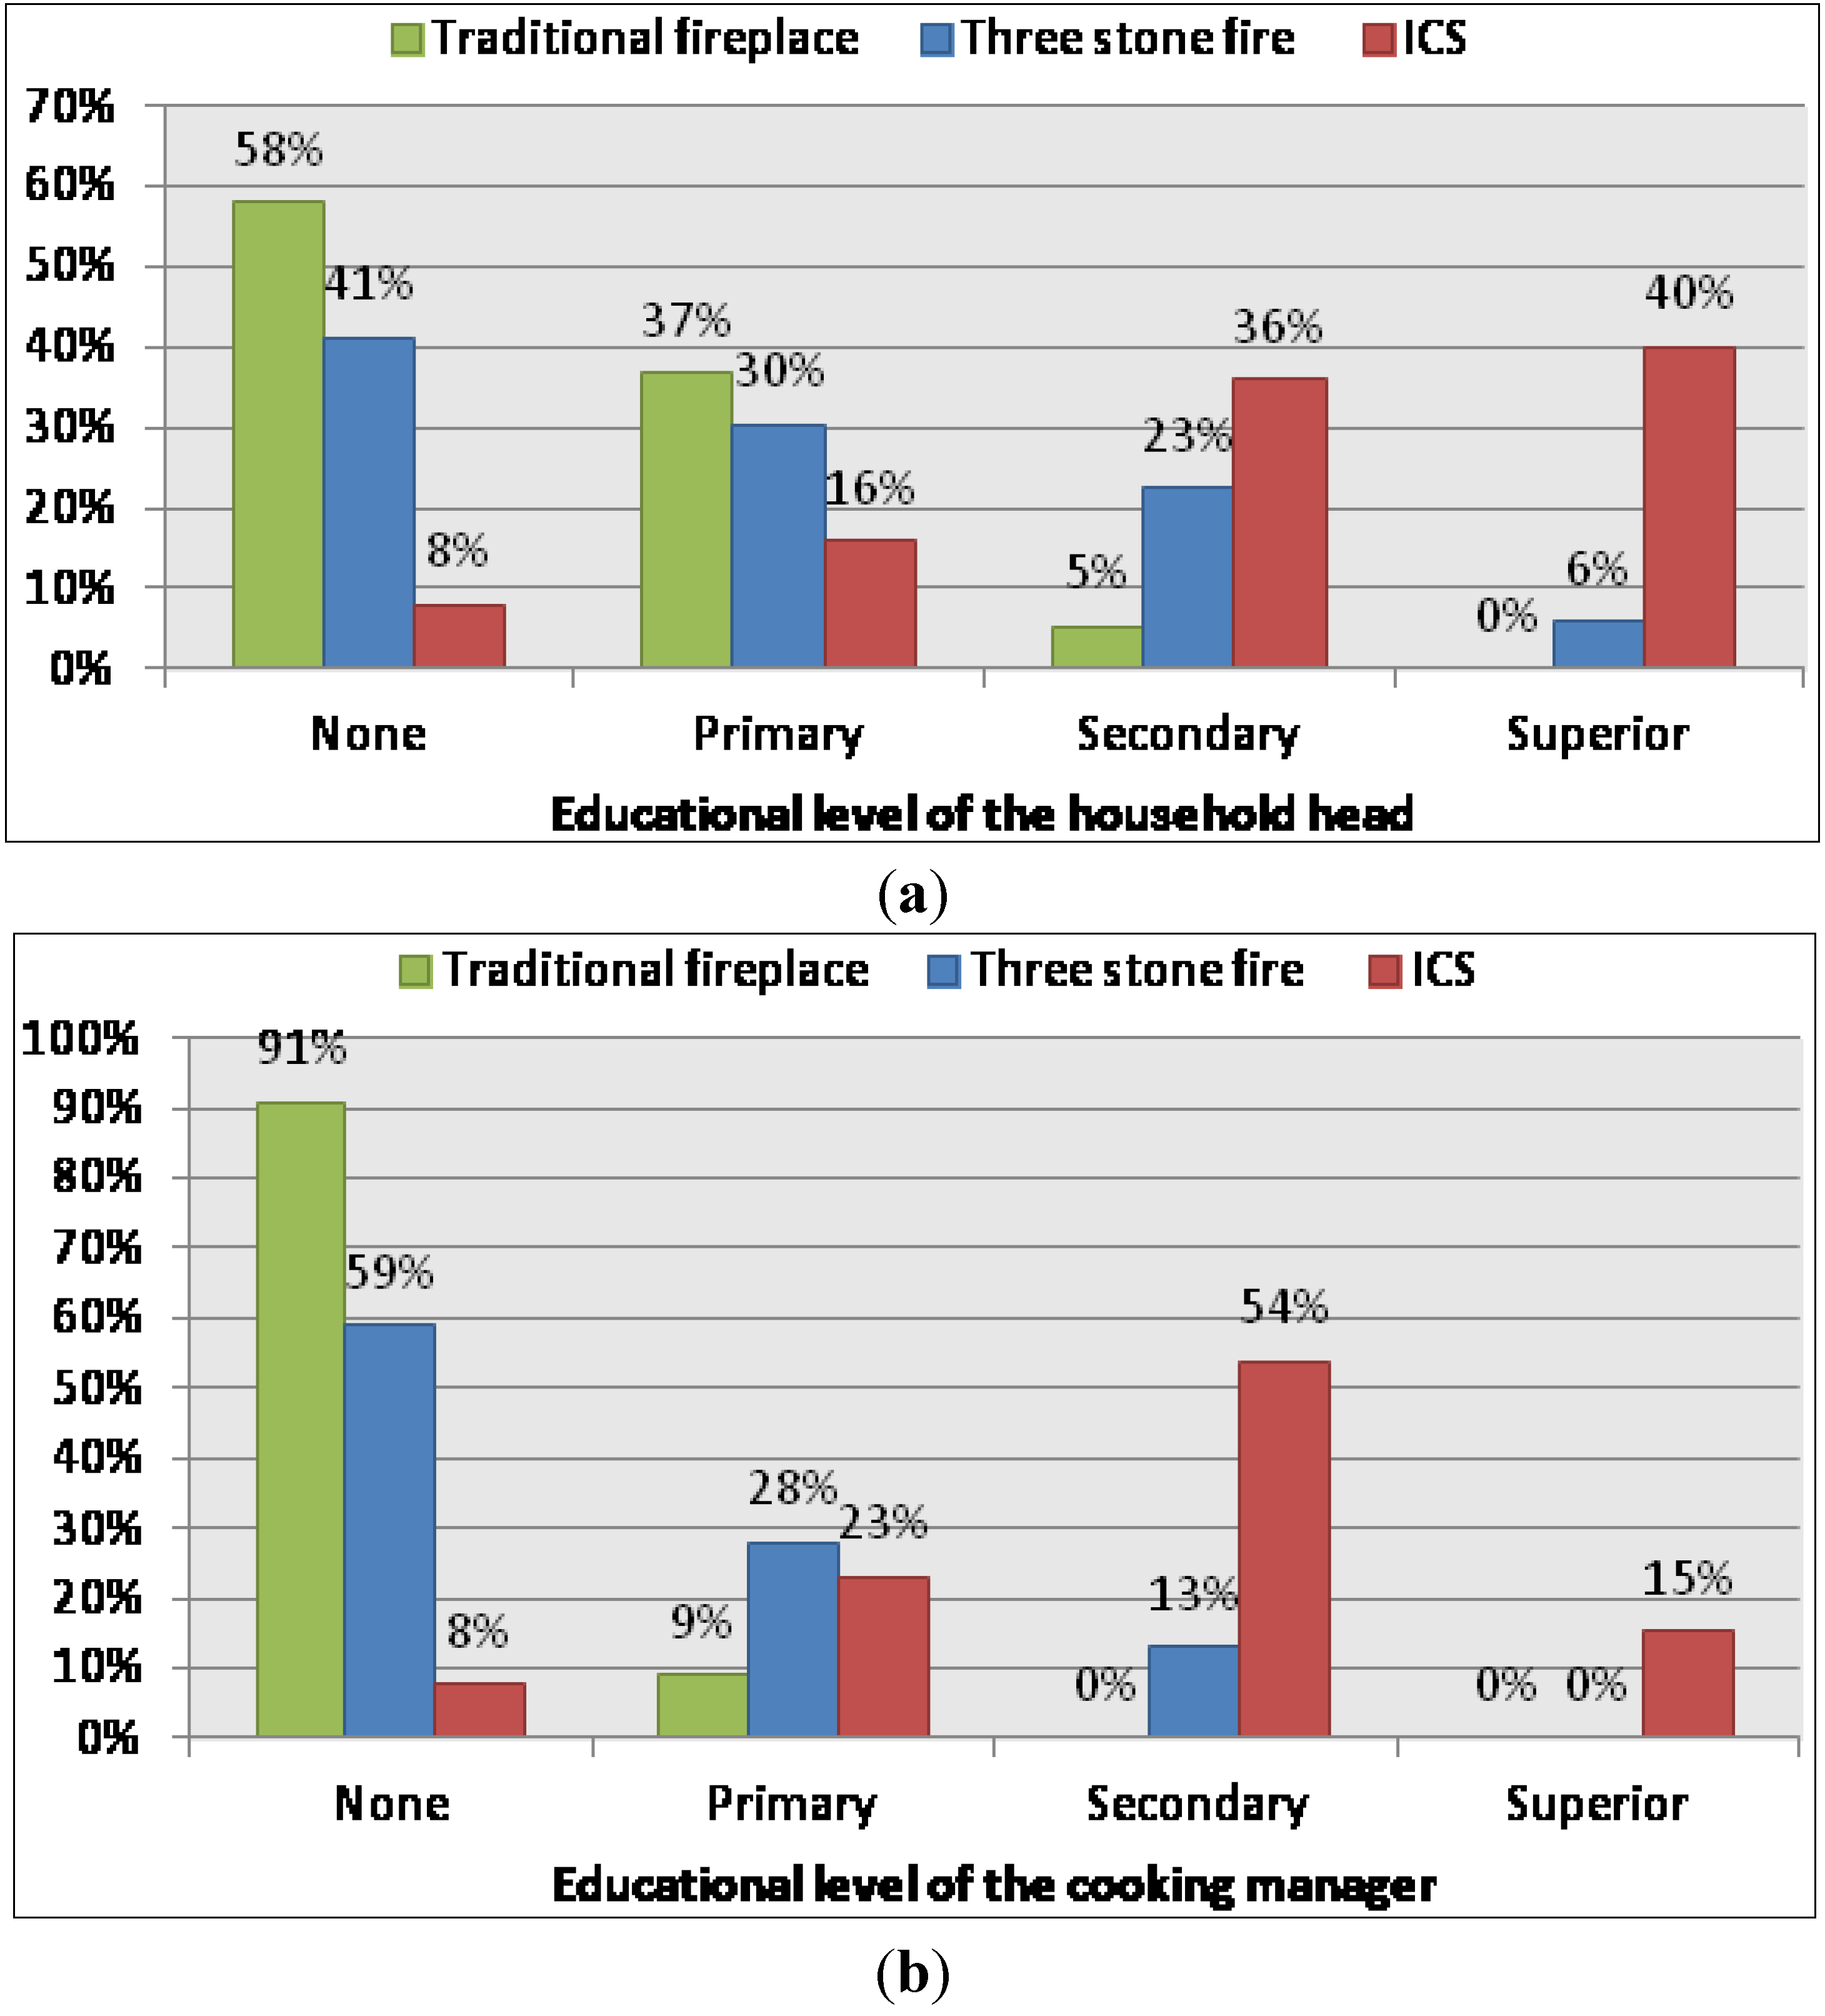
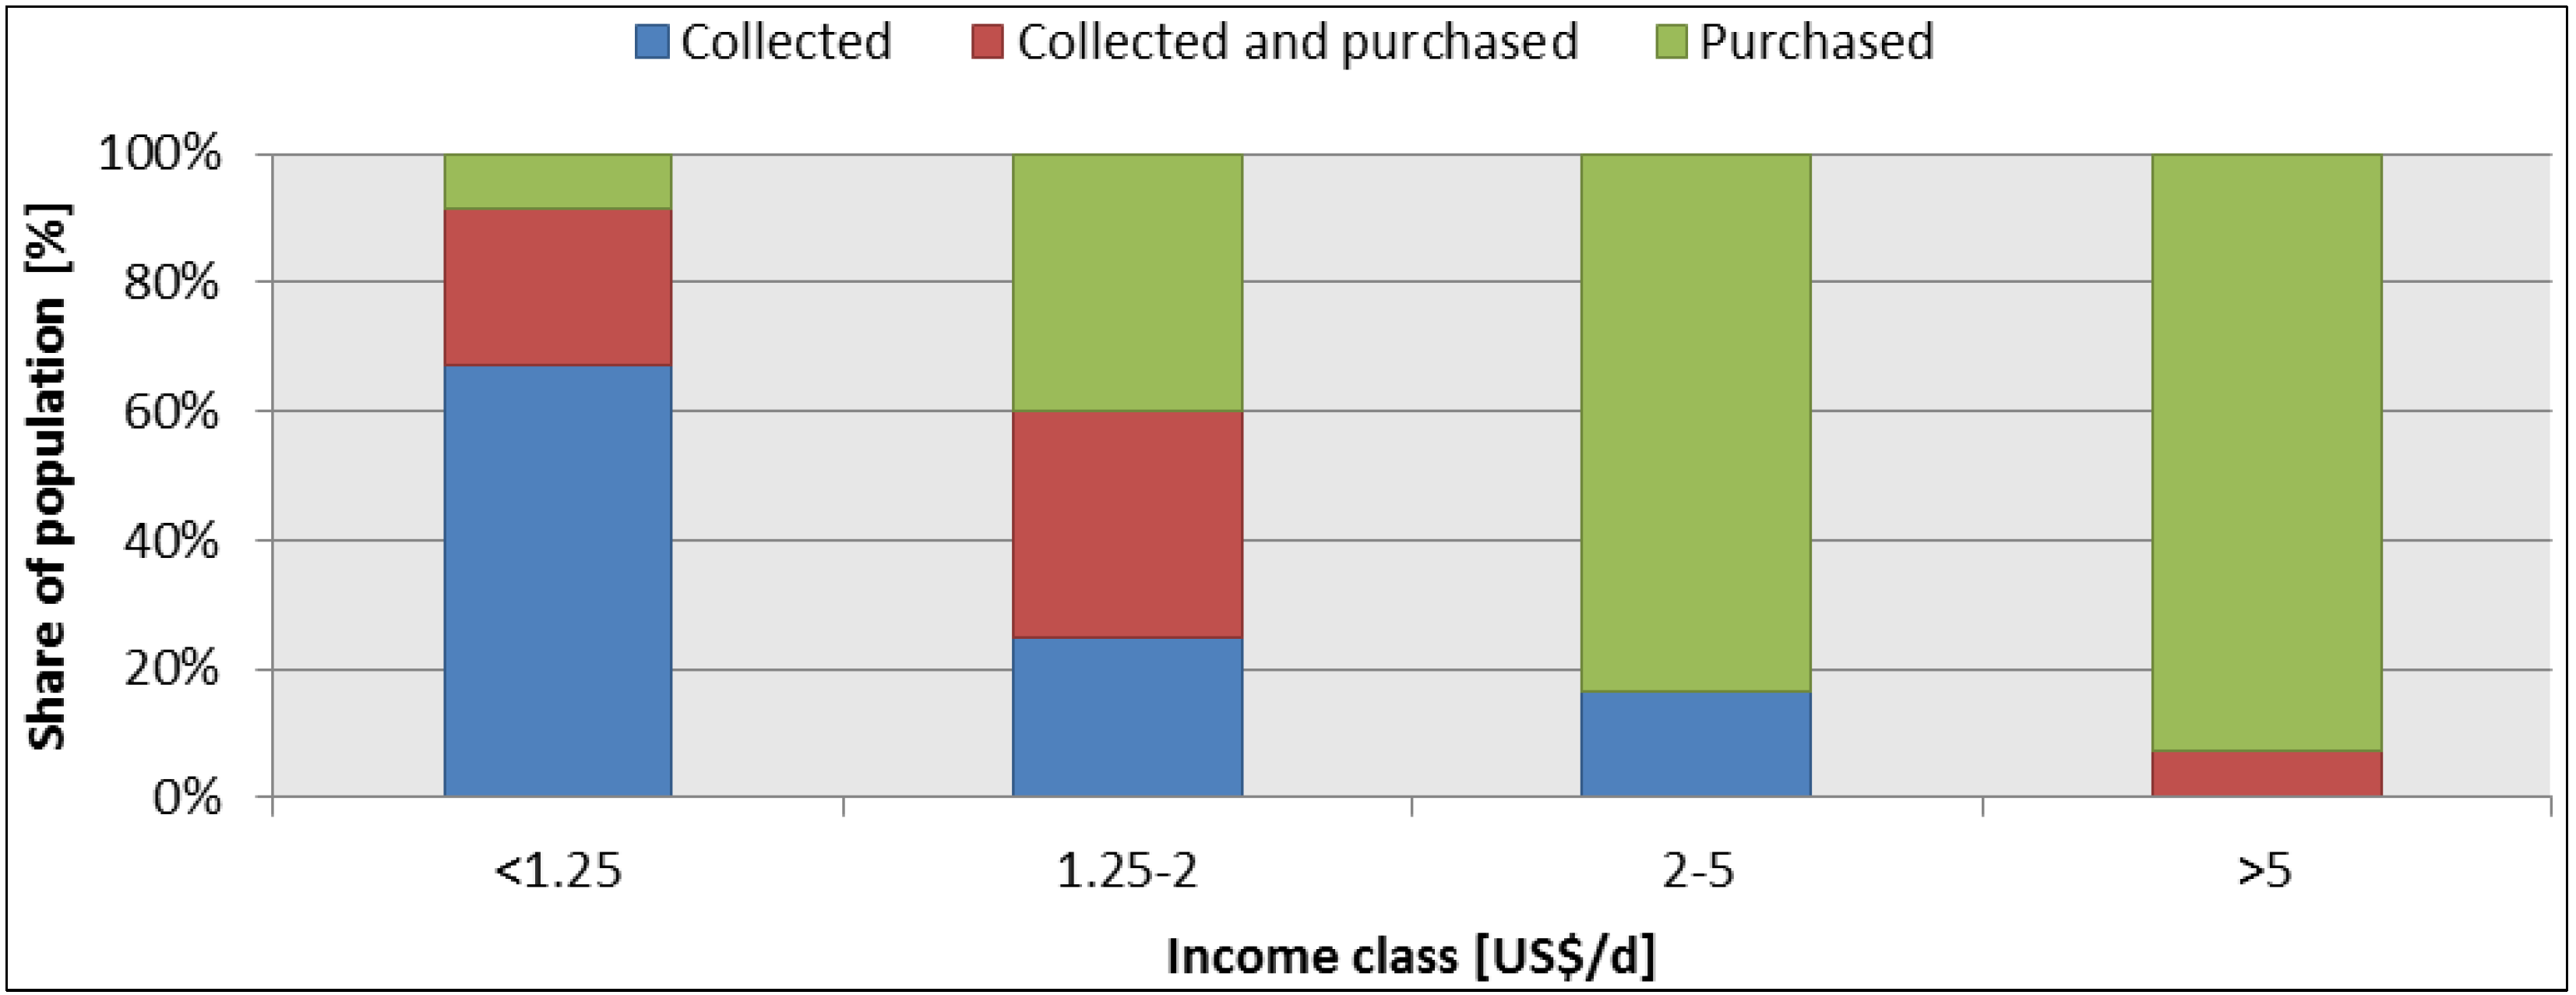
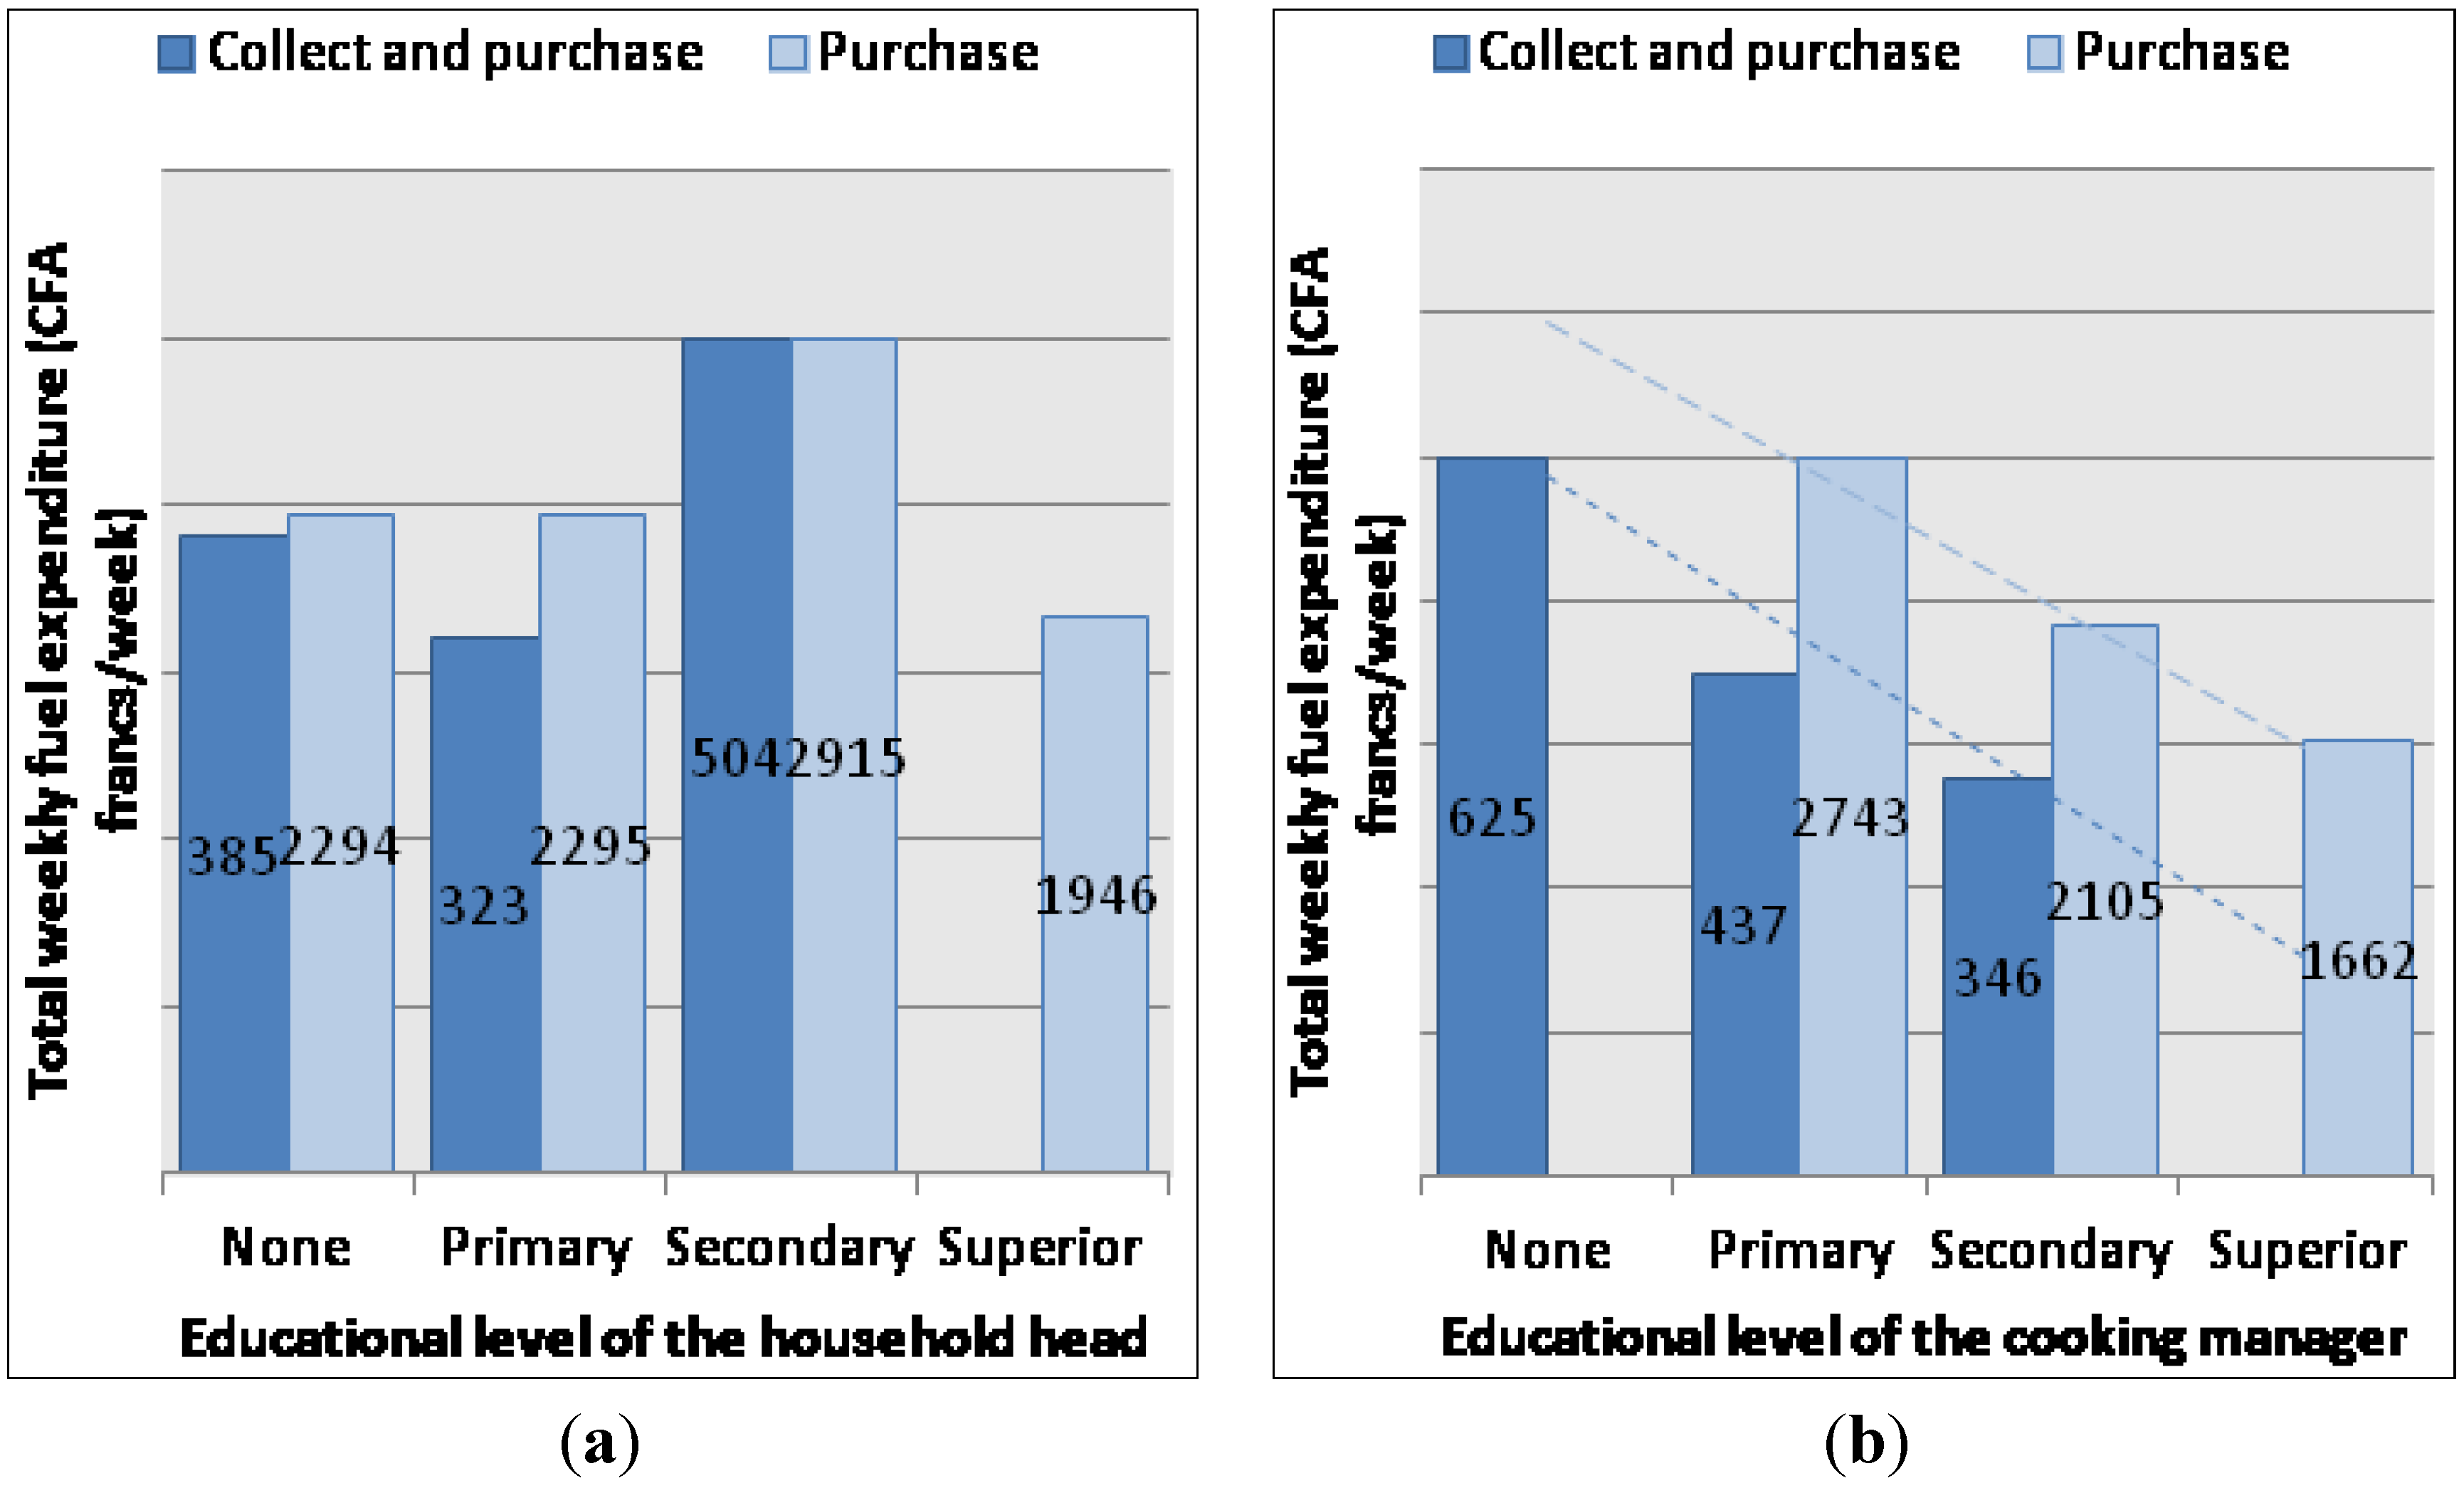
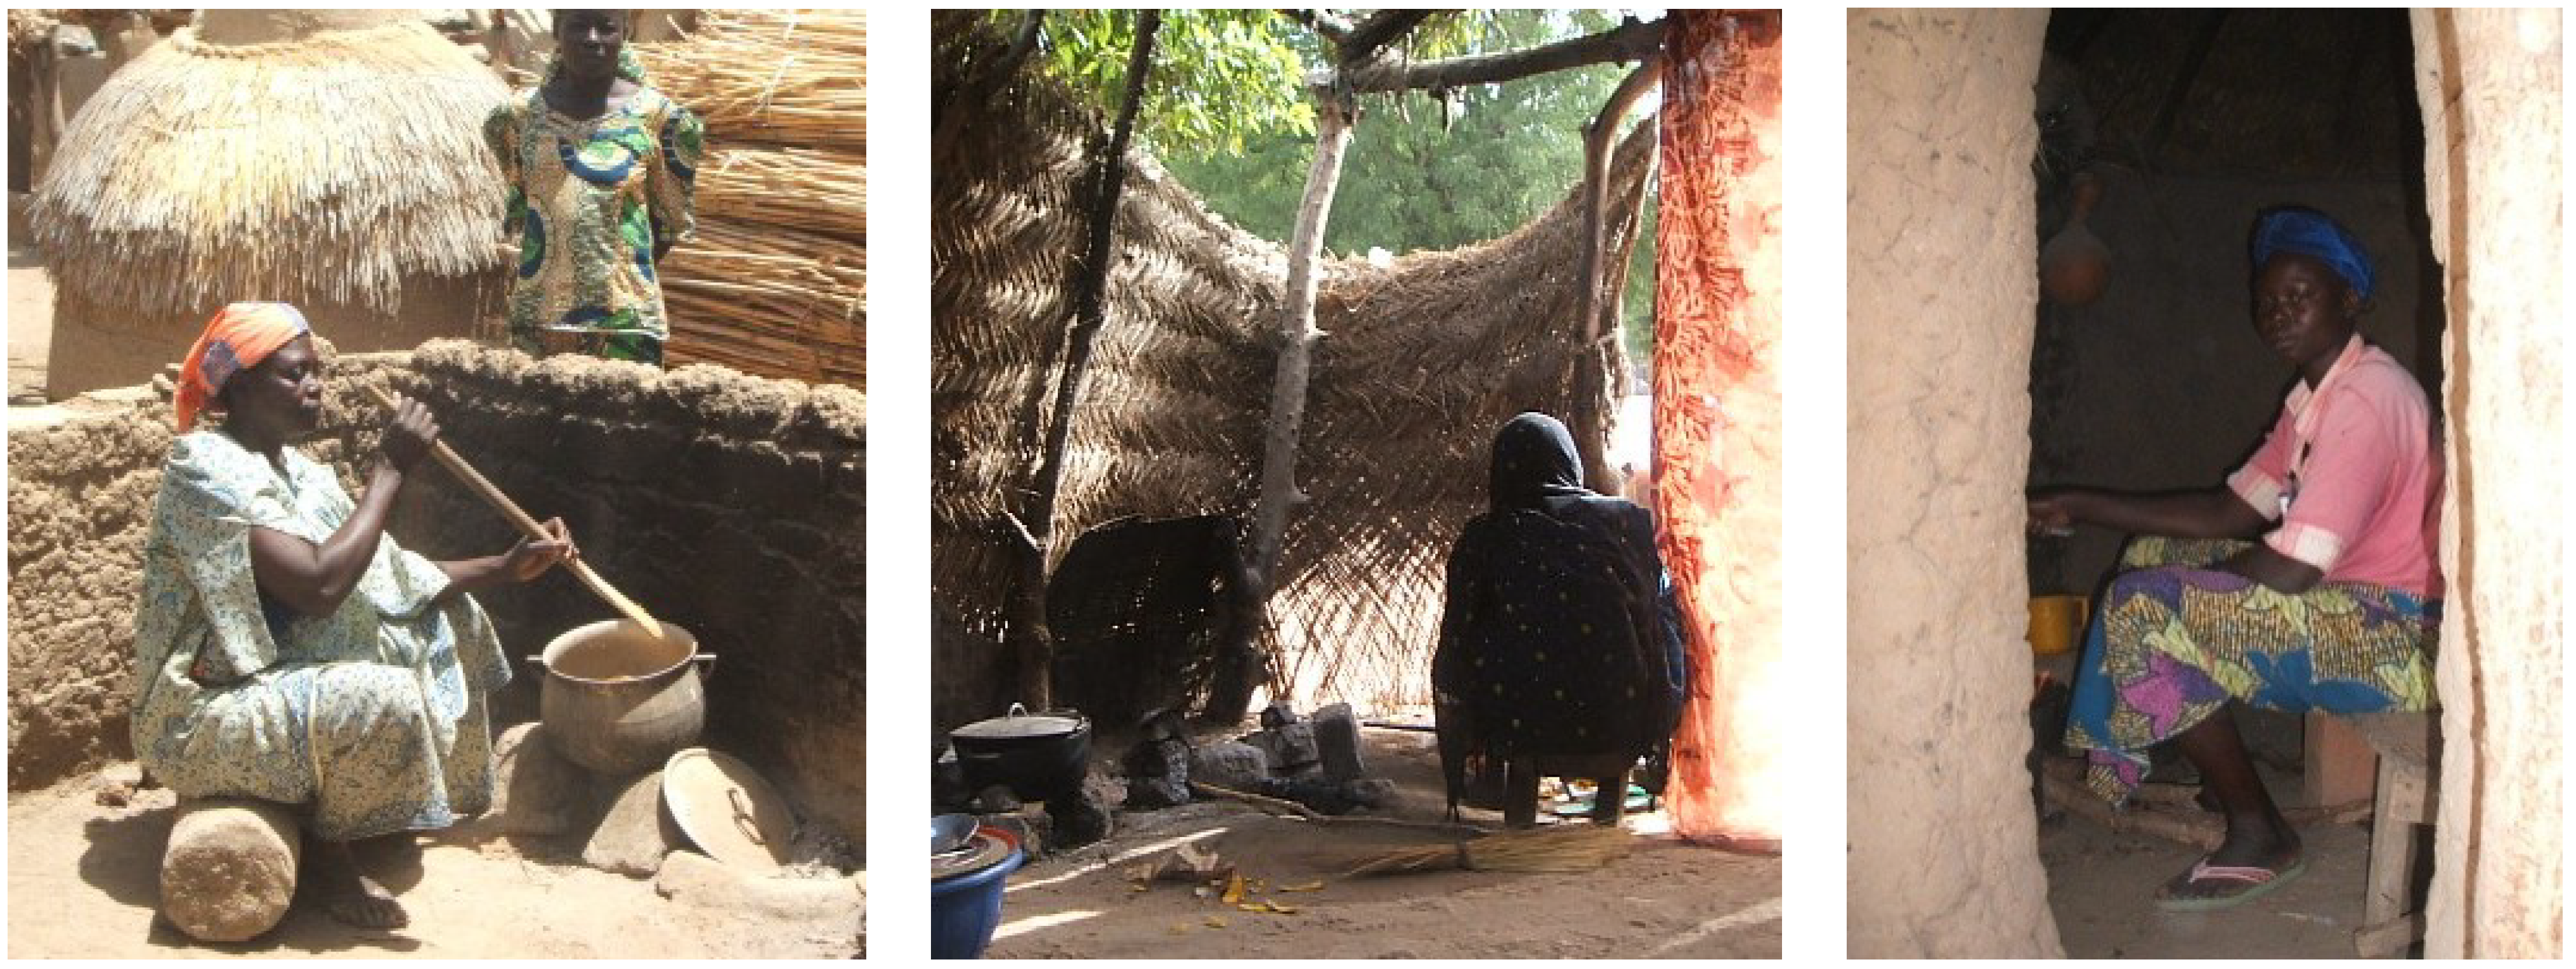
  • In the urban area, local people were forced by the 2008 national ban to no longer use their traditional preferred solid fuel, i.e., charcoal. This resulted in a down-climb on the energy ladder, a return to the purchase and use of firewood rather than the upgrade to LPG. In this context, the purchase of fuel is perceived as more convenient in comparison to the collection, even if this is free. Therefore, with the possibilities given by a higher income level, households tend to switch from that more rudimental procurement mode that implies a greater amount of drudgery (see Figure 3) to this “more modern” procurement mode, and to use improved cooking systems. Therefore, a primary reason for the project’s success was its strong focus on meeting household needs and on its ability to make the ICS model proposed (the “Centrafricain” ICS) as affordable as possible. Increasing user adoption rates and appreciation indicates the appropriateness of the ICS model proposed in the urban contexts of the intervention area. Fuel consumption reduction and adaptability to the local cooking practices are the main features that the users indicated as strengths of the technology [47]. At the same time, survey outcomes highlighted that the adoption of ICS was more likely in households with higher educational levels (Figure 2), which also often resulted as being richer (see Section 1 of “Results”). Thus, a need for actions was identified, aiming at promoting awareness and at making fuel-savings cooking technologies accessible for lower income classes.
  • In rural areas, lower ICS adoption rates were observed. This is likely to be due to the fact that wood is collected for free, impacting the household activity in terms of time but not in terms of budget. Therefore, fuel saving is not seen as a priority and ICS is not perceived by the final users as having many advantages. The rural population has a lower educational level (as highlighted by the survey outcomes, see section one of the results) that probably reflects a limited awareness and knowledge of environmentally friendly and energy-saving practices. Moreover, the low household income level did not leave room in the budget for purchasing the ICS model promoted by the project.
  • In order to overcome the identified barriers in the adoption of improved cooking systems, two different actions were put in field. On one hand, the advertising campaign about the advantages of the use of improved cooking systems was strengthened in order to increase the awareness of the local population and to make the message accessible also for that share of population with a lower educational level. On the other hand, an alternative “lower-tech” and cheaper ICS model (the “ceramic” ICS), more similar to the traditional rural fireplace and producible directly by the users, was proposed in order to be more affordable. Such a model was more appreciated by the rural population and by the low-income class in the urban population. This allowed the project to penetrate also into the rural areas, achieving a higher impact on the intervention territory and on the beneficiary population.
  • These aspects have been fundamental for the scaling-up of the stove models and for the sustainability of the action. A self-standing market and a continuative adoption by households was observed, in particular, in urban areas, where fuel is purchased and the savings due to a lower wood consumption have a direct impact on household income.

5. Conclusions

It is therefore fundamental to implement tools such as initial and in itinere assessments and index measurements during all the phases of the project, providing evidence from the field for the identification of the more appropriate context-tailored energy solutions. In the case study presented in this paper, the results were taken into account in order to re-orient the following phases of the project, addressing in a better way the needs and capacities of the potential beneficiaries and proposing solutions more tailored to their habits and possibilities. In a broader sense, such outcomes may be the elements upon which building policies, which are key to ensuring energy development, begin to take into consideration sustainability concerns. In particular, the measurement of the energy index according to standards and protocols shared in the international scientific community may provide useful comparative tools for the assessment of energy access levels in different stages of a project, as well as in different geographical contexts. This would build an information database essential for planning appropriate scaling-up strategies at a regional level in strict contact with the local authorities, in order to better address the cooking systems proposed for the household needs, both in rural and urban areas [33].

Acknowledgments

This research was developed within the Ph.D. course “Appropriate Methods and Technologies for International Development Co-Operation” of the University of Brescia, supported by the Alberto Archetti Fund. This paper is based on data from the activities conducted by the authors within the activities of an International Development Cooperation project (ENV/2006/114-747) carried out by the Italian NGO ACRA and funded by the EU.

Author Contributions

Francesco Vitali gathered context-specific data in the Logone Valley, elaborated on the data and wrote the paper under the coordination of his Ph.D. supervisor Mentore Vaccari.

Conflicts of Interest

The authors declare no conflict of interest.

References

  1. Collivignarelli, C.; Vaccari, M.; Vitali, F. Issues and recommendations for drinking water supply in an average Bosnian town: The case study of Zavidovici. J. Water Supply Res. Technol.—AQUA 2011, 60, 16–26. [Google Scholar]
  2. Sorlini, S.; Palazzini, D.; Sieliechi, J.M.; Ngassoum, M.B. Assessment of physical-chemical drinking water quality in the Logone Valley (Chad-Cameroon). Sustainability 2013, 5, 3060–3076. [Google Scholar] [CrossRef]
  3. Giardina, D.; Prandini, F.; Sorlini, S. Integrated assessment of the water, sanitation and hygiene situation in haitian schools in the time of emergency. Sustainability 2013, 5, 3702–3721. [Google Scholar] [CrossRef]
  4. Di Bella, V.; Ali, M.; Vaccari, M. Constraints to healthcare waste treatment in low-income countries—A case study from Somaliland. Waste Manag. Res. 2012, 30, 572–575. [Google Scholar] [CrossRef]
  5. Vaccari, M.; di Bella, V.; Vitali, F.; Collivignarelli, C. From mixed to separate collection of solid waste: Benefits for the town of Zavidovići (Bosnia and Herzegovina). Waste Manag. 2012, 33, 277–286. [Google Scholar]
  6. International Energy Agency. World Energy Outlook 2012; International Energy Agency: Paris, France, 2012. [Google Scholar]
  7. Bailis, R. Wood in household energy use. Encycl. Energy 2004, 6, 509–526. [Google Scholar] [CrossRef]
  8. Hallding, K.; Li, Y.; Wang, L.; Chen, Y. Learning from previous failures: Scaling up biogas production in the Chinese countryside. Clim. Dev. 2012, 4, 199–209. [Google Scholar] [CrossRef]
  9. Pattnaik, B.K. Science, technology and quality-of-life in the developing-world—A critical perspective. Indian J. Soc. Work 1994, 55, 391–404. [Google Scholar]
  10. Dang, H. Fuel substitution in sub-Saharan Africa. Environ. Manag. 1993, 17, 283–288. [Google Scholar] [CrossRef]
  11. Rao, P.S.C.; Miller, J.B.; Wang, Y.D.; Byrne, J.B. Energy-microfinance intervention for below poverty line households in India. Energy Policy 2009, 37, 1694–1712. [Google Scholar] [CrossRef]
  12. Neudoerffer, R.C.; Malhotra, P.; Ramana, P.V. Participatory rural energy planning in India: A policy context. Energy Policy 2001, 29, 371–381. [Google Scholar] [CrossRef]
  13. Gangopadhyaya, S.; Ramaswamia, B.; Wilima, W. Reducing subsidies on household fuels in India: How will it affect the poor? Energy Policy 2005, 33, 2326–2336. [Google Scholar] [CrossRef]
  14. Biermann, E.; Grupp, M.; Palmer, R. Solar cooker acceptance in South Africa: Results of a comparative field test. Sol. Energy 1999, 66, 401–407. [Google Scholar] [CrossRef]
  15. Toonen, H.M. Adapting to an innovation: Solar cooking in the urban households of Ouagadougou (Burkina Faso). Phys. Chem. Earth 2009, 34, 65–71. [Google Scholar] [CrossRef]
  16. Aggarwal, R.K.; Chandel, S.S. Review of improved cookstoves programme in Western Himalayan State of India. Biomass Bioenergy 2004, 27, 131–144. [Google Scholar] [CrossRef]
  17. Rehman, I.H.; Kar, A.; Banerjee, M.; Kumar, P.; Shardul, M.; Mohanty, J.; Hossain, I. Understanding the political economy and key drivers of energy access in addressing national energy access priorities and policies. Energy Policy 2012, 47, 27–37. [Google Scholar] [CrossRef]
  18. Khennas, S. Understanding the political economy and key drivers of energy access in addressing national energy access priorities and policies: African Perspective. Energy Policy 2012, 47, 21–26. [Google Scholar] [CrossRef]
  19. Zerriffi, H. Innovative business models for the scale-up of energy access efforts for the poorest. Curr. Opin. Environ. Sustain. 2011, 3, 272–278. [Google Scholar]
  20. Bailis, R.; Cowan, A.; Berrueta, V.; Masera, O. Arresting the killer in the kitchen: The promises and pitfalls of commercializing improved cookstoves. World Dev. 2009, 37, 1694–1705. [Google Scholar] [CrossRef]
  21. World Bank. The Welfare Impact of Rural Electrification: A Reassessment of the Costs and Benefits; Independent Evaluation Group, The World Bank: Washington, DC, USA, 2008. [Google Scholar]
  22. Hutton, G.; Rehfuess, E.; Tediosi, F. Evaluation of the costs and benefits of household energy and health interventions at global and regional levels. Energy Sustain. Dev. 2007, 11, 34–43. [Google Scholar] [CrossRef]
  23. Pachauri, S.; Spreng, D. Measuring and monitoring energy poverty. Energy Policy 2011, 39, 7497–7504. [Google Scholar]
  24. García-Frapolli, E.; Schilmann, A.; Berrueta, V.M.; Riojas-Rodríguez, H.; Edwards, R.D.; Johnson, M.; Guevara-Sanginés, A.; Armendariz, C.; Masera, O. Beyond fuelwood savings: Valuing the economic benefits of introducing improved biomass cookstoves in the Purépecha region of Mexico. Ecol. Econ. 2010, 69, 2598–2605. [Google Scholar] [CrossRef]
  25. Urmee, T.; Harries, D. Determinants of the success and sustainability of Bangladesh’s SHS program. Renew. Energy 2011, 36, 2822–2830. [Google Scholar] [CrossRef]
  26. Bhattacharyya, S.C. Energy access programmes and sustainable development: A critical review and analysis. Energy Sustain. Dev. 2012, 16, 260–271. [Google Scholar] [CrossRef]
  27. Hailu, Y.G. Measuring and monitoring energy access: Decision-support tools for policymakers in Africa. Energy Policy 2012, 47, 56–63. [Google Scholar] [CrossRef]
  28. International Atomic Energy Agency (IAEA); UN Department of Economic and Social Affairs; IEA; Eurostat and European Environment Agency. Energy Indicators for Sustainable Development: Guidelines and Methodologies; IAEA: Vienna, Austria, 2005. [Google Scholar]
  29. Khandker, S.R.; Barnes, D.F.; Samad, H.A. Are the energy poor also income poor? Evidence from India. Energy Policy 2012, 47, 1–12. [Google Scholar] [CrossRef]
  30. Kemmler, A.; Spreng, D. Energy indicators for tracking sustainability in developing countries. Energy Policy 2007, 35, 2466–2480. [Google Scholar]
  31. Practical Action. Poor People’s Energy Outlook 2010; Practical Action: Rugby, UK, 2010. [Google Scholar]
  32. Koswari, R.; Zeriffi, H. Three dimensional energy profile: A conceptual framework for assessing household energy use. Energy Policy 2011, 39, 7505–7517. [Google Scholar] [CrossRef]
  33. Leach, G. The energy transition. Energy Policy 1992, 20, 116–123. [Google Scholar] [CrossRef]
  34. Vaccari, M.; Vitali, F.; Mazzù, A. Improved cookstove as an appropriate technology for the Logone Valley (Chad-Cameroon): Analysis of fuel and cost savings. Renew. Energy 2012, 47, 45–54. [Google Scholar]
  35. Reegle. Policy and Regulatory Overviews. Available online: http://www.reegle.info/policy-and-regulatory-overviews/TD (accessed on 2 October 2013).
  36. Agence pour l’Energie Domestique et l’Environnement (AEDE). Plan Directeur d’Approvisionnement en énergie domestique de N’Djamena; Ministère de l’Environnement et de l’Eau République du Tchad: N’Djamena, Chad, 2002. (In French)
  37. Maconachiea, R.; Tankob, A.; Zakariyac, M. Descending the energy ladder? Oil price shocks and domestic fuel choices in Kano, Nigeria. Land Use Policy 2009, 26, 1090–1099. [Google Scholar] [CrossRef]
  38. The World Bank. Chad/Data. Available online: http://data.worldbank.org/country/chad (accessed on 2 October 2013).
  39. Legros, G.; Havet, I.; Bruce, N.; Bonjour, S. The Energy Access Situation in Developing Countries. A Review Focusing on the Least Developed Countries and Sub-Saharan Africa; WHO (World Health Organization): Geneva, Switzerland; UNEP (United Nations Environment Programme): Nairobi, Kenya, 2009. [Google Scholar]
  40. Trochim, W.M.K. The Research Methods Knowledge Base, 2nd ed. 2006. Available online: http://www.socialresearchmethods.net/kb (accessed on 2 October 2013).
  41. O’Sullivan, K.; Barnes, D.F. Energy Policies and Multi-Topic Household Surveys. Guidelines for Questionnaires Design in Living Standards Measurement Studies; World Bank Working Paper No. 90; World Bank Publications: Washington, DC, USA, 2007. [Google Scholar]
  42. Bruce, N.G.; Jagoe, K.; Bromley, H. Standard Monitoring Packages for Household Energy and Health Field Projects; Final Report; Liverpool University: Liverpool, UK, 2007. [Google Scholar]
  43. Practical Action and GIZ. Total Energy Wiki. Available online: https://energypedia.info/wiki/Totalenergywiki (accessed on 2 October 2013).
  44. Practical Action. Poor People’s Energy Outlook 2012: Energy for Earning a Living; Practical Action: Rugby, UK, 2012. [Google Scholar]
  45. Ravallion, M.; Chen, S.; Sangraula, P. Dollar a day. World Bank Econ. Rev. 2009, 23, 163–184. [Google Scholar] [CrossRef]
  46. Vitali, F.; Parmigiani, S.; Vaccari, M.; Collivignarelli, C. Agricultural waste as household fuel: Techno-economic assessment of a new rice-husk cookstove for developing countries. Waste Manag. 2013, 33, 2762–2770. [Google Scholar] [CrossRef]
  47. Vitali, F.; Vaccari, M. Appropriate technology for household energy access: The case of the Centrafricain stove in the Logone Valley (Chad, Cameroun). In Technologies for Sustainable Development. A Way to Reduce Poverty? Proceedings of 2012 Conference of the EPFL-UNESCO Chair in Technologies for Development, Lausanne, Switzerland, 29–31 May 2012; Bolay, J., Hostettler, S., Hazboun, E., Eds.; Springer: Berlin, Germany, 2013. [Google Scholar]

Annexes

Table A1. Questionnaire used during the survey.
Household energy survey
Vallée du Logone (Tchad–Cameroun)—February–March 2011
0Identification
Place Questionnaire n°Date
1Household features
1.aPerson who cooks Head of household
Occupation Occupation
School attendance□ None  □ Primary
□ Secondary  □ Higher
School attendance□ None  □ Primary
□ Secondary □ Higher
1.bNumber of peopleNumber total:
Children (<14 year)
Women (>14 year)
Men (>14 year)
1.cIncome(francs/month)
Income level □ Subsistence  □ Low  □ Average  □ High
Main activity
Agricultural Production (sacks/year)Corn    (price per sack ____________________)
Sorghum   (____________________)
…..    (____________________)
FeedstockNr chicken_________ Nr goats __________ Nr cows ____________
2Cooking habits
2.aIn the year
Cooking placeRainy season
Dry season
2.bDuring the day
Number of cooking event during the day (note time required for each preparation)
2.cNr of people per meal (including guests)
2.dCookstove model used[ ] Traditional[ ] Improved: centrafricain[ ] Other
3Fuel need
3.aMain fuel used□ Firewood□ Charcoal□ Gas
□ Kerosene□ Petrol□ Other (  )
Notes
3.bFuel supply□ always collected□ mainly collected□ collected/purchased
□ always purchased□ mainly purchased
3.cIf purchased, fuel expenditure (for the main one)(francs/week)
Unit cost of the fuel
Mode of purchase (quantity and frequency)
3.dIf purchased, fuel expenditure (for the others)(francs/week)
Unit cost of the fuel
Mode of purchase (quantity and frequency)
3.eDistance for fuel supply(km)
(times/week)
3.fIf collected, time required for the activity(h/time)
(times/week)
3.gFamily member who buys or collects the fuel□ Head  □ Woman  □ Children
Figure A1. Cooking places observed on site: from left to right, outdoors in the open air, under a ventilated stand, indoors in a closed room.
Sustainability 06 01427 g009
Figure A2. Stove models observed on site: on the right in the down corner the “Centrafricain” ICS promoted by the project.
Sustainability 06 01427 g010

