Article

Evaluation of Urban Eco-Security—A Case Study of Mianyang City, China

1
School of Architecture and Environment, Sichuan University, Chengdu 610064, China
2
School of Civil Engineering and Architecture, Southwest University of Science and Technology, Mianyang 621010, China
3
School of Economics and Management, Sichuan Normal University, Chengdu 610101, China
*
Author to whom correspondence should be addressed.
Sustainability 2014, 6(4), 2281-2299; https://0-doi-org.brum.beds.ac.uk/10.3390/su6042281
Submission received: 20 December 2013 / Revised: 26 March 2014 / Accepted: 2 April 2014 / Published: 21 April 2014

Abstract

:
Currently, a series of ecological environmental problems have been brought about by high-intensity intervention of human beings, and ecological security is regarded as one of the most important national survival strategies. A methodology of urban eco-security evaluation has been introduced, including a conceptual framework of pressure-state-response (PSR) model, setting-up of the indicator system of urban eco-security evaluation (ISUESE) and empirical research. By virtue of the mean-deviation method, the weight coefficient of every indicator is confirmed. It has been found that the top three indicators are: per capita area of paved road, per capita area of cultivated land and green coverage rate of built-up area, which has a relatively prominent status in he urban ecological security. A calculation procedure of fuzzy comprehensive evaluation (FCE) method is applied in empirical research. The Mianyang statistical data during the period of 2005–2012 shows that eco-security keeps a favorable trend, but criticality security and slight insecurity are dominant. It has also been found that insecurity membership degree (MD) of environment pressure accounts for a very large proportion of total pressure. Membership degrees of criticality security and security in environment state are increasing gradually, and as far as environment response is concerned, security is significantly increased.

1. Introduction

The environment challenges resulting from urbanization have had an erosive effect on the ecological system during the last century and are expected to continue through the next several decades, for example, excessive demand on natural resources, especially owing to population growth and industrial development, can bring about local instability and conflict. In short, cities are being faced with population growth, natural resources shortage, environmental pollution, ecological destruction and other ecological environmental crises, which have gradually become ecological security problems. Based on this urgent situation, ecological security has become as important as military security, economic security, political security and national security, etc., in recent years [1]. From its birth to today, ecological security, first proposed by the government of the United States, has drawn considerable attention from worldwide stakeholders, and some scholars have researched on it.
There exists qualitative and quantitative studies in the literature about ecological security. Qualitative research includes the concept of ecological security [2,3,4,5], the relationship between eco-security and state-security, and environmental indicator [6]. Xiao, et al. [7] pointed out that previous research on ecological security highlighted the ecological health diagnosis, regional ecological risk analysis, landscape security and security management. Moreover, eco-security evaluation has close connections with ecosystem health evaluation, ecological risk evaluation, ecosystem service evaluation and ecological carrying capacity [8,9,10,11,12], and these ideas inform our work about the indicator of eco-security evaluation pattern, and ecological security monitoring and prediction. Evaluation methods, such as a mathematical model, ecological model, landscape ecological model and digital terrain model, are employed for the assessment of eco-security, but all have pros and cons [13,14,15,16,17,18]. In general, there is no universally accepted definition of ecological security, its parameters, and appropriate research methods, and also there has been no unified and well-recognized indicator system [19].
The PSR model as a systematic model, which can integrate great variety of factors influencing urban ecological system, is used to structure the cause and effect relationships that are associated with environmental issues. They apply “pressure” on the environment, which can modify its “state” with possible “impacts” on human health or on ecosystem quality. These impacts may lead to a “response” from our societies [20]. Seen from a logical viewpoint, it is easy to understand that the PSR framework plays a vital role in classifying and organizing the selected indicators in order to form a robust set of indicator systems.
This study adopts the fuzzy comprehensive evaluation method because it can simplify the evaluation process and provide comparatively objective results by simplifying the indices without losing key index information [19]. The process of FCE method includes forming an evaluation indicator system, determining the factor set, fuzzy weight, the evaluation set, the fuzzy evaluation matrix, and calculating the comprehensive evaluation results. The method can quantify uncertainties for a relatively objective, correct evaluation by virtue of fuzzy mathematics theory. Among this, the weight which decides the relative importance degree of each indicator in the ecological security system is determined by mean-deviation method as an objective weight. Compared with subject weight, objective weight does not depend on a person’s subjective judgment with a characteristic of strong objectivity, such as the method of primary component analysis, deviation method, entropy method and mean-deviation method.
The purpose of this paper is to present a theoretical and methodological framework for urban eco-security evaluation by developing a multilayer, multicriteria indicator system based on the PSR model, which enables decision makers to understand the dynamics changes of urban eco-system under the human intervention and make scientifically-based and effective decisions on Mianyang city’s sustainable development. This paper is organized as follows: Section 2 develops an evaluation model of urban eco-security and its empirical research taking Mianyang city as an example, involving introducing the study area and method of data processing, constructing the indicator system of urban ecological security evaluation (ISUESE) based on PSR model, defining the standard of indicator system, calculating the indicator weight coefficient and presenting a detailed calculation procedure of the FCE method. In Section 3, based on the above result, a meaningful discussion is made, supported by figures and charts. Finally, conclusions are drawn in Section 4.

2. Methods and Data

2.1. The study Area and Data

2.1.1. The study Area

Mianyang city lies between longitudes 103°45′E and 105°43′E, and between latitudes 30°42′N and 33°03′N, in the northwest of Sichuan province in China. Affected by landform, Mianyang city has an abundant rainfall, 3000 rivers and creeks with a range of size, and mountains with rich vegetation, merged into an urban space pattern, which make Mianyang City a pleasant natural environment. The city covers 20249 km2, while the urban district is 1570 km2. Sixty-one percent of the city is mountainous. During the eight years from 2005 to 2012, development land was expanded from 49 km2 to 102.85 km2. Meanwhile, its proportion jumped from 3.12% to 6.55%. According to the development plan of Mianyang city, the urbanization will reach 50% by 2020. The electronic information industry is the leading industry, while industries of food, pharmaceutical, metallurgical machinery, automobile, materials and new energy are the pillar ones. During the 21st century, Mianyang industry could not follow the transformation and upgrading of international and domestic industry, which has made the industrial structural contradiction increasingly prominent, with few products with high added value and technical content. This especially effected the electronic information industry which accounts for nearly 40% of Mianyang’s industry and the metallurgical machinery industry which accounts for nearly 15%. Neither industries have made substantial progress.

2.1.2. The Data and Processing

The data of this research is selected from 2005 to 2012. The data comes from China City Statistical Yearbook, the China City Construction Statistical Yearbook, Sichuan Statistical Yearbook, and Mianyang Statistics Yearbook. Regarding some missing data, such as proportion of research and development investment to GDP, there are two types of methods for dealing with the data. One is the average method of both ends, which responds to time series change with low accuracy; the other is the gray system theory (GST), which can embody time series variation with higher accuracy. The GM (1, 1) prediction model from GST is applied to estimate the missing data in the study. Most importantly, it can avoid the shortcoming that statistical model is only used for large data sequences [21,22].

2.2. PSR Model

The model has the functions of prediction, explanation and extrapolation in eco-security research [23]. PSR model was presented by the Organization for Economic Co-operation and Development (OECD) [24]. This framework is one of the most commonly used models for environmental impacts assessment [25], which can be used to construct indicator system and is helpful for decision-making and decision-evaluation. The PSR indicates the causality among factors within the human-nature system, accurately reflecting the correlation between ecological security and nature-economy-society, which laid the logical basis for the eco-security indicator system. Generally, the pressure indicator can indicate the root of ecological environmental problems, the state indicator is used to measure the natural environmental situation resulting from human activities, and the ability to overcome the crisis to ensure ecological security is always the response indicator. From a macro perspective, ISUESE should not only show the status and level of city ecological security, the causality and mutual influence between each subsystem, but also display the safety awareness, behavior capacity and countermeasures by human beings. The PSR model integrates independent indicators with a systematic idea, which provides a good method for selecting indicators and constructing ISUESE.

2.2.1. The Indicator System of Urban Ecological Security Evaluation

2.2.1.1. Indicator Selection

Indicators selected cannot only analyze, compare, judge, and evaluate the state and process of ecological security, but also predict the developing trends of ecological security. In this paper, evaluation indicators are determined from:
(1)
Some decisive indicators affecting a certain urban eco-security and highlighting city problems and those indicators from national standards, industrial standard and local industry standards.
(2)
The indicators from the relevant literatures about urban sustainable development evaluation, urban ecosystem health evaluation, ecological city evaluation and other human settlement research.
(3)
The indicators obtained easily. A lack of data may reduce the scope of assessment and increase uncertainty [20].
Concretely speaking, except for social, economic and ecological indicators in a common sense, it emphasizes the following indicators [26]:
Firstly, the indicators which can reflect the urban hinterland and confirm the urban ecological security level with more objective and reasonableness, such as forest coverage rate, per capita cultivated area.
Secondly, the indicators of human ecology, such as the population density and the population natural growth rate.

2.2.1.2. Indicator System

There are a majority of indicators affecting urban eco-security, and each indicator provides different information. For this reason it is necessary to establish a systematic, comprehensive indicator system to provide an effective evaluation on the overall urban eco-security. To sum up, values of the indicator system are: Evaluation, prediction and decision-making. Firstly, an indicator system will be used to measure the differences between the objective and the progress of urban development, and make a comparative study among different periods, i.e., the way in which one can discover and solve problems in time. Secondly, based on the existing data, ISUESE can explore the urban development rule, predict the trend in the future, and provide the rationale for policy made. Thirdly, it is through indicator systems that the government has an understanding of the advantages and disadvantages experienced during the urban modernization process, which gives orientation for urban development strategy and public policy. The objectives for developing the comprehensive indicator system are as follows [27]:
  • The indicator system must be able to reflect every aspect of the urban eco-security.
  • The data for the indicators must be able to be collected from the reliable sources and be consistent.
  • The indicator system must be able to accommodate the relationship between the evaluation indicators and the evaluation criteria, especially to generate corresponding evaluation indicators based on evaluators’ criteria.
According to these objectives, the ISUESE is divided into four layers, which are seen as the target layer (TL), criterion layer (CL), factor layer (FL) and indicator layer (IL). TL is the direct indicator which evaluates the urban ecological security, and it always shows a comprehensive characterization of urban eco-security. CL is usually thought of as the main element restricting city ecological security, including environment pressure, environment state and environment response. FL is a reflection of CL. IL always is seen as measurement indicators, which are the basic layer of UESE. Indicator system is shown (Table 1).
Table 1. Urban eco-security evaluation (UESE) indicator system and classification standard.
Target layer(TL)Criterion layer(CL)Factor layer(FL)Indicator layer (IL)Marking valueInsecuritySlight insecurityCriticality securitySlight securitySecurity
Indicator of urban ecological security
(TL)
Environment pressure
(CL1)
Population pressurepopulation density IL13500.03500.02750.01500.0750.0500.0
population natural growth rate IL20.75.04.02.351.20.7
land pressureper capita housing area IL330.06.09.016.025.030.0
per capita paved road area IL430.05.010.015.020.030.0
per capita cultivated land areaIL50.0530.0200.0300.050.080.10
water resource pressurelocal water resources quantity IL63000.0 1000.01350.01950.0 2600.03000.0
per capita daily water consumption IL7300.0120.0200.0290.0365.0455.0
Indicator of urban ecological security
(TL)
Environment pressure
(CL1)
ecological environment pressureSO2 emissions intensity per 104 Yuan GDP IL81.007.005.503.001.501.00
industrial dust emission intensity per 104 Yuan GDP IL90.102.001.500.750.300.10
social economic development pressureper capita GDP IL1010.01.02.55.08.010.0
doctors per 104 people IL1150.020.025.035.045.050.0
public transit vehicles per 104 people IL1230.010.015.020.025.030.0
Environment State(CL2)life qualityEngel coefficient of urban residents IL1320.060.050.040.030.020.0
energy stateenergy consumption per 104 Yuan IL140.101.51.250.750.300.10
water consumption per 104 Yuan IL1550.0300.0225.0175.075.050.0
resource qualityforest coverage rate IL1650.020.025.035.045.050.0
built-up area green coverage rate IL1740.015.020.027.535.040.0
per capita public green area IL1820.05.07.512.517.520.0
environment qualityregional environmental noise IL1960.060.057.552.547.545.0
Ratio of air pollution indicator to the second grade in all year IL20100.050.065.080.090.0100.0
Environment response (CL3)pollution control comprehensive utilization rate of industrial solid wastes IL21100.030.050.070.090.0100.0
town’s life sewage centralized treatment rate IL22100.020.035.065.090.0100.0
industrial wastewater discharge treatment rate IL23100.080.085.092.597.5100.0
economic investmentproportion of environment protection investment to GDP IL244.01.01.52.53.54.0
proportion of Research & development investment to GDP IL256.01.01.53.05.06.0
Indicator of urban ecological security
(TL)
Environment response (CL3)industrial structure optimizationpercentage of the tertiary industry to GDP IL2680.020.030.050.065.080.0
intelligence investmentcollege students number per 104 people(persons) IL271500.0300.0450.0700.01050.01500.0
The Units of IL as following, IL1: persons/km2; IL2: ‰; IL3IL4: m2; IL5: hm2s; IL6: m3; IL7:L; IL8IL9: kg; IL10: 104 Yuan; IL11: the number of persons; IL12: the number of vehicles ; IL13: %; IL14: ton of standard coal equivalent ; IL15: m3; IL16IL17: %; IL18: m2; IL19: db(A); IL20IL26: %; IL27: capita.

2.2.2. The Standard of Indicator System

2.2.2.1. Marking value Defined

The so-called evaluation standard is a set of quantitative reference systems which can reveal the superiority and inferiority of ecological environment quality, and can reflect the intensity and scope of impact on eco-security and environment. Presently, there is no unitary city security standard. The marking value is defined according to the following principles [26]:
(1)
The existing national standard, international standard or industrial standard, for example Ambient Air Quality Standards (GB3095-2012), Environmental Quality Standard for Noise (GB3096-2008). Indicators of pollution control are from international standard.
(2)
Standard value for the National Environmental Protection Model City in China.
(3)
Trend extrapolation for the performance value of eco-city at abroad and home. Eco-city is a single framework which comprises a collection of apparently disconnected ideas about urban planning, transportation, health, housing, energy, economic development, natural habitats, public participation, and social justice. With sustainability as the goal, the use of indicators for urban monitoring and regulation is becoming more and more in demand [28]. Li et al. determined five target layers, including: Resource saving, friendly environment, sustainable economic, social harmony and innovation-led [29]. Xie et al. determined indicator systems of four targets: Ecological environment health, economic sustainable development and social harmony [30]. Song et al. put forward a set of indicator systems for reflecting structure, function and coordination of urban ecosystem and establishing the assessment criterion of eco-city [31]. These literatures all selected the indicators for expressing the relationship among environment, economy and society within the urban ecosystem, and the standard value of some indicators were suggested. They also integrated both domestic and foreign study progress, which must contribute to our work.

2.2.2.2. Classification Standard

Based on the relevant research literatures or reports [32,33,34,35], classification standard of eco-security is developed, which is divided into five levels, namely: Insecurity (I), slight insecurity (SI), criticality security (CS), slight security (SS) and security (S) (Table 1). After marking values of security are defined, standard values of SS, CS and I are determined respectively with reference to the existing value of Chinese developed city, national average value and minimum. The standard value of SI is assigned by means of the median value between I and CS.

2.2.3. Indicator Weights

To compare urban eco-security level in different periods, the result expected is a ranking in a numerical comparison. It is clear that the ranking obtained depends upon the weight of importance assigned to each indicator [36]. Furthermore, weight distribution is indispensable to evaluation researches [37,38] and different weight will lead to a different evaluation conclusion, so it is necessary to choose a suitable weighted method including subjective weight and objective weight. The objective weighting process is carried out independent of subjective preferences of various decision makers [39]. The mean-deviation method, as an objective weighting, is commonly applied in comprehensive evaluation [40]. A case was also proved that mean-deviation method provided an analytical and effective way to determine the weights of variables in group decision making [41]. The normal steps for this method are as follows:
Firstly, data standardization.
Weighted method requires standardization of all performance measures into commensurate units. The performance measures are standardized using the following Equations (1) and (2) [42]:
yij = (xij–xjmin)/ (xjmax–xjmin) (for criteria where more is better)
yij = (xjmax–xij)/(xjmax–xjmin) (for criteria where more is worse)
where, i = the total alternatives (i = 1, 2, 3, …, m); j = the number of evaluation indicators ( j = 1, 2, 3, …, n);yij = the standardized performance measure of the ith alternative against the jth indicator;xij = the performance measure for the ith alternative against the jth indicator; xjmin = the minimum performance measure for all alternatives against the jth indicator; and xjmax = the maximum performance measure for all alternatives against the jth indicator.
Secondly, calculation of weight coefficient.
Before calculating the weight coefficient, the arithmetic mean and the mean deviation of the jth indicator should be obtained according to the Equations (3) and (4).
Sustainability 06 02281 i001
Sustainability 06 02281 i002
where, E(Ij) denotes the mean value of the jth indicator from 2005 to 2012; m is equal to 8 years; σ(Ij) denotes the mean deviation of the jth indicator. According to (1), (2), (3) and (4), mean deviation of every indicator can be obtained.
Then, the weight coefficient can be calculated according to the Equation (5),
Sustainability 06 02281 i003
where, Wj is σ(Ij) is weight coefficient of the jth indicator. n is the number of indicators (n=1, 2, 3, …, 27). The weight coefficients of all indicators are calculated and listed in Table 2.

2.2.4. Fuzzy Comprehensive Evaluation Method

Security or insecurity is only a relative concept. It is difficult for decision makers to get an accurate answer. The FCE method can be used to identify and deal with fuzzy or uncertain factors [43]. Fuzzy evaluation is the process of evaluating an objective utilizing the fuzzy set theory which provides a rigorous and flexible approach to complex urban eco-security problems [42]. The fuzzy set approach uses imprecise and uncertain information to give a membership degree to each element of the universe [44], which must rely on membership function with reference to the standard of indicator system. Moreover, a fuzzy set is a class with un-sharp boundaries (i.e., a class where transition from membership to non-membership is gradual rather than abrupt [45]). FCE method is used to evaluate the ecological security of Mianyang city, and the normal steps for this method are as follows [43,46].
Firstly, determining the factor set X.
X = {x1, x2, x3.., xj} (j = 1, 2, 3, …, 27 ). Where, X is factor set; xj denotes the indicators.
Secondly, establishing the evaluation set V.
The evaluation set V = {V1, V2, V3, ....., Vk} ( k = 1, 2, 3, 4, 5 ) is defined as V= {insecurity, slight insecurity, criticality security, slight security, security}, which reflects security levels from low to high.
Thirdly, determining the fuzzy membership function of fuzzy evaluation matrix R.
When determining the membership function for an indicator, the specific characteristics of all indicators should be considered. Generally speaking, the indicators are classified into two types: The cost type (the smaller the better) and the benefit type (the larger the better). Their membership function is shown respectively as following in Equations (6) and (7), which describes quantitatively the value of subordination of each indicator relative to the five assessment levels by a set of equation of subordination functions.
Cost type:
Sustainability 06 02281 i004
Benefit type:
Sustainability 06 02281 i005
where the parameters a, b in the membership functions are seen in Table 1, and are the standard value of every security level. After determining the membership functions, the membership degree of indicator j to grading k is evaluated and hence the fuzzy evaluation matrix R of all j indicators can be calculated as following in Equation (8),
Sustainability 06 02281 i006
where, rjk denotes the membership degree of the jth indicator against the kth level; j is the number of indicators; k is five security levels, namely I, SI, CS, SS and S.
Fourthly, compound operation of fuzzy matrix
Compound operation is shown in Equation (9),
B = (bj) 1×5 = A。R = (wj) 1×27 。R
where A is referred to as the overall weight vector in this paper, namely A= (w1, w2, w3... w27), and wj is the relative importance degree of indicator j (see Table 2); R is the result of Equation (8). “。” is the generalized fuzzy operators. Thereinto, bj can be calculated as the Equation (10),
Sustainability 06 02281 i007
Fifthly, evaluation result.
The degree of urban ecological security is quantified as V= {2, 3, 5, 8, and 9}, and the evaluation results can be obtained as the Equation (11),
Sustainability 06 02281 i008
where, P can indicate the eigenvalue of ecological security level. Assumedly, if P∈ [2,3], the evaluation result is insecurity; if P∈ [3,5], the evaluation result is slight security; if P∈ [5,7], the evaluation result is critical security; if P∈ [7,8], the evaluation result is slight security; if P∈ [8,9], the evaluation result is security.

3. Results and Discussion

3.1. Indicator Weight Analysis

By virtue of the mean-deviation method, weight coefficient is objectively confirmed, and then weight coefficient in CL can be calculated according to the Equation (5), and the results are shown (Table 2).
In IL, it is found that the top three indicators are per capita area of paved road (0.0466), per capita area of cultivated land (0.0466) and green coverage rate of built-up area (0.0424), which shows they play relatively important roles when the urban ecological security is evaluated. On the other hand, the forest coverage rate and Engel coefficient of urban residents weigh less (0.0288, 0.0305).
Table 2. Distribution of weight coefficient.
Indicator layer(IL)Weight Coefficient in TLWeight Coefficient in CLIndicator layer(IL)Weight Coefficient in TLWeight Coefficient in CL
IL10.03720.0808IL150.03630.1281
IL20.03210.0697IL160.02880.1017
IL30.03540.0769IL170.04240.1497
IL40.04660.1012IL180.03990.1408
IL50.04460.0968IL190.03880.1370
IL60.03680.0799IL200.03330.1175
IL70.04010.0871IL210.03660.1429
IL80.04020.0873IL220.03760.1468
IL90.03620.0786IL230.04090.1597
IL100.03960.0860IL240.03290.1285
IL110.03960.0860IL250.03710.1449
IL120.03220.0699IL260.03550.1386
IL130.03050.1077IL270.03550.1386
IL140.03330.1175
In IL, it is found that the top three indicators are per capita area of paved road (0.0466), per capita area of cultivated land (0.0466) and green coverage rate of built-up area (0.0424), which shows they play relatively important roles when the urban ecological security is evaluated. On the other hand, the forest coverage rate and Engel coefficient of urban residents weigh less (0.0288, 0.0305).
In FL, the top four indicators, namely, land pressure, pollution control ability, social economic development pressure and resource quality, should be more prominent than the other indicators and they will have more influence on evaluation results.
In CL, per capita area of paved road and per capita area of cultivated land have greater significance in the environment pressure, green coverage rate of built-up area and per capita public green area have relatively bigger weight in the environment state, while in environment response, discharge standard rate of industrial wastewater and centralized treatment rate of urban sewage weigh more.

3.2. Dynamic Changes of Urban Ecological Security

To understand Mianyang’s relative performance on changes in urban eco-security level, evaluation results from 2005 to 2012 are selected for comparison. Table 3 presents changes in insecurity, slight insecurity, criticality security, slight security and security during eight years, and Mianyang city’s ecological system does not perform well; the overall eco-security status is just between slight insecurity and criticality security. After dominance in insecurity from 2005 to 2007, volatility between slight insecurity and security over the 2008 and 2009 period, slight insecurity tries its best to convert into criticality security. The MD of security increases, and accordingly the eigenvalue of urban eco-security level is on the rise with a stable trend. Eigenvalues drop from 4.85 in 2007 to 4.82 in 2008, because industrial wastewater discharge treatment rate, ranking the fourth in weight, is a minimum of 88.26% and a maximum of 97.19%. Meanwhile, its MD calculated from membership function is 0.062 and 0.43 respectively during the 2007–2008 period, which directly leads to changes of eigenvalues. In addition, population natural growth rate mounts dramatically from 1.17‰ in 2007 to 3.46‰ in 2008, which results in the population pressure. Obviously, the decline in 2008 originates from human factors, so it is necessary to make some measures to control it.
Table 3. Fuzzy comprehensive evaluation (FCE) results.
YearMembership degreeEigenvalueResult
ISICSSSS
20050.30890.20950.20070.18380.09714.59SI
20060.26040.24000.21790.18610.09554.68SI
20070.30610.17340.19490.18640.13934.85SI
20080.20240.28230.22560.16310.12664.82SI
20090.26310.20450.22540.13190.17514.9SI
20100.16260.28150.23090.10830.21675.14CS
20110.15030.26850.19630.11860.26635.43CS
20120.15620.24100.21200.13600.25485.48CS

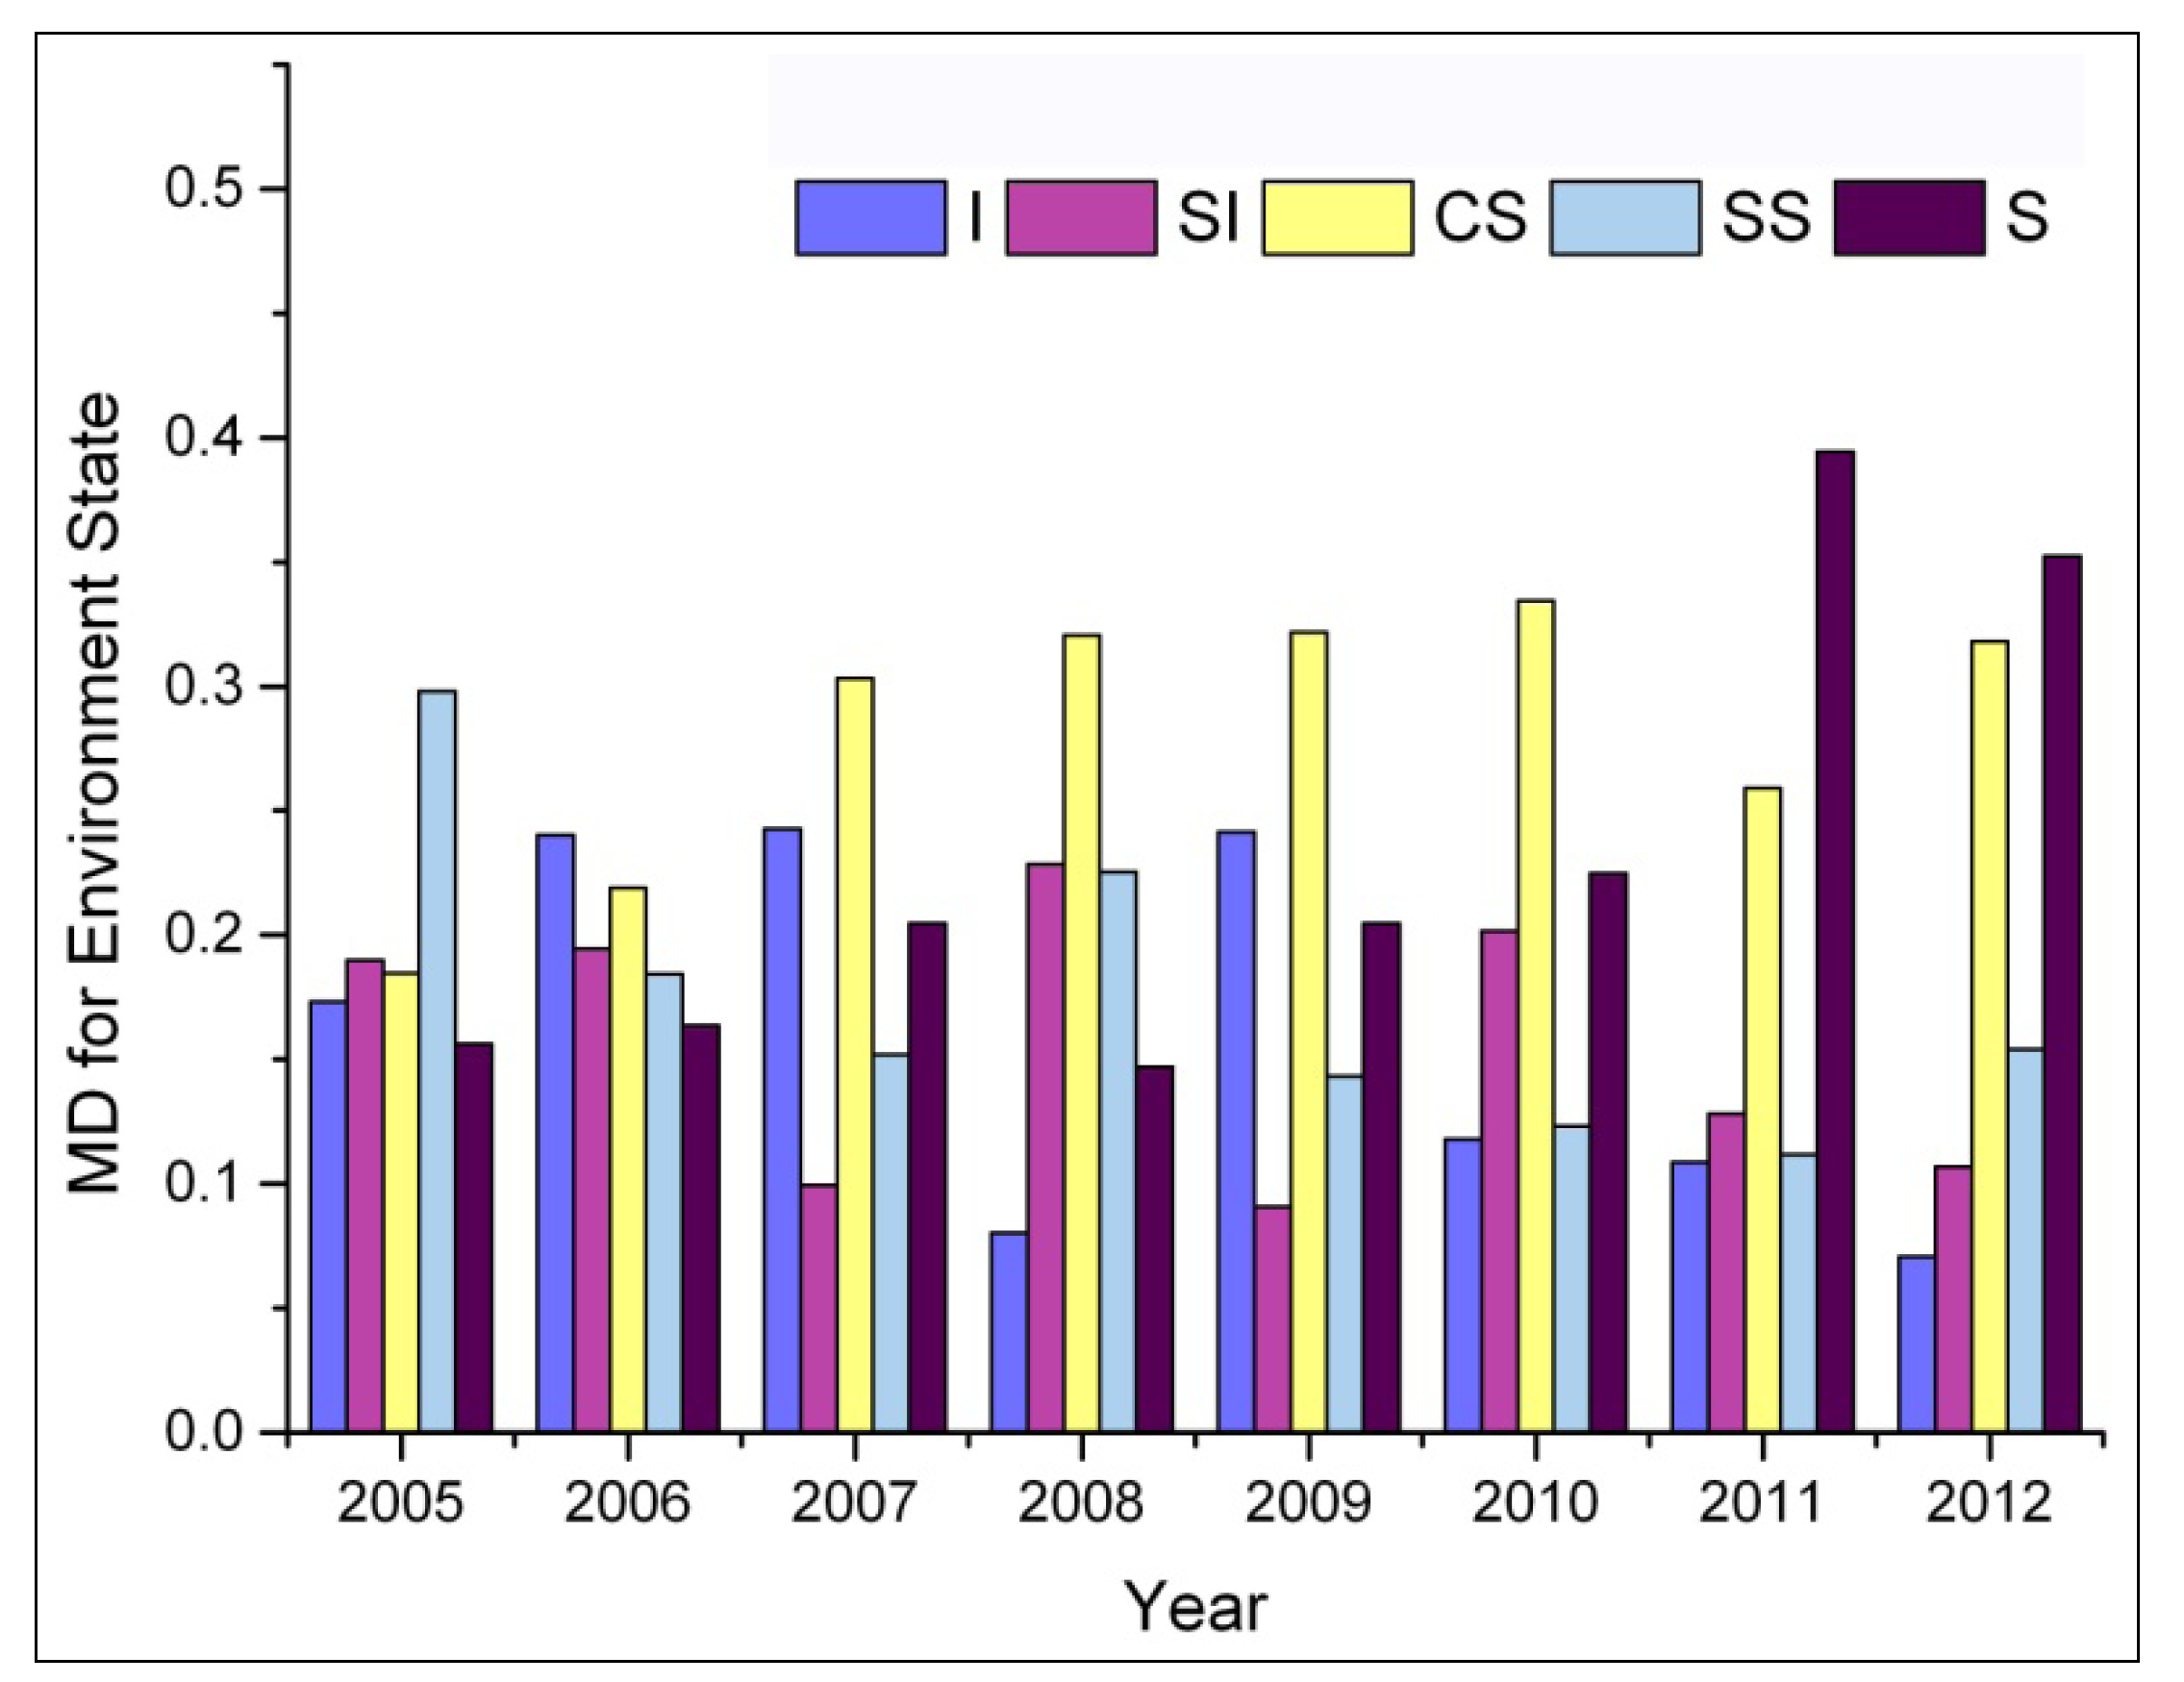
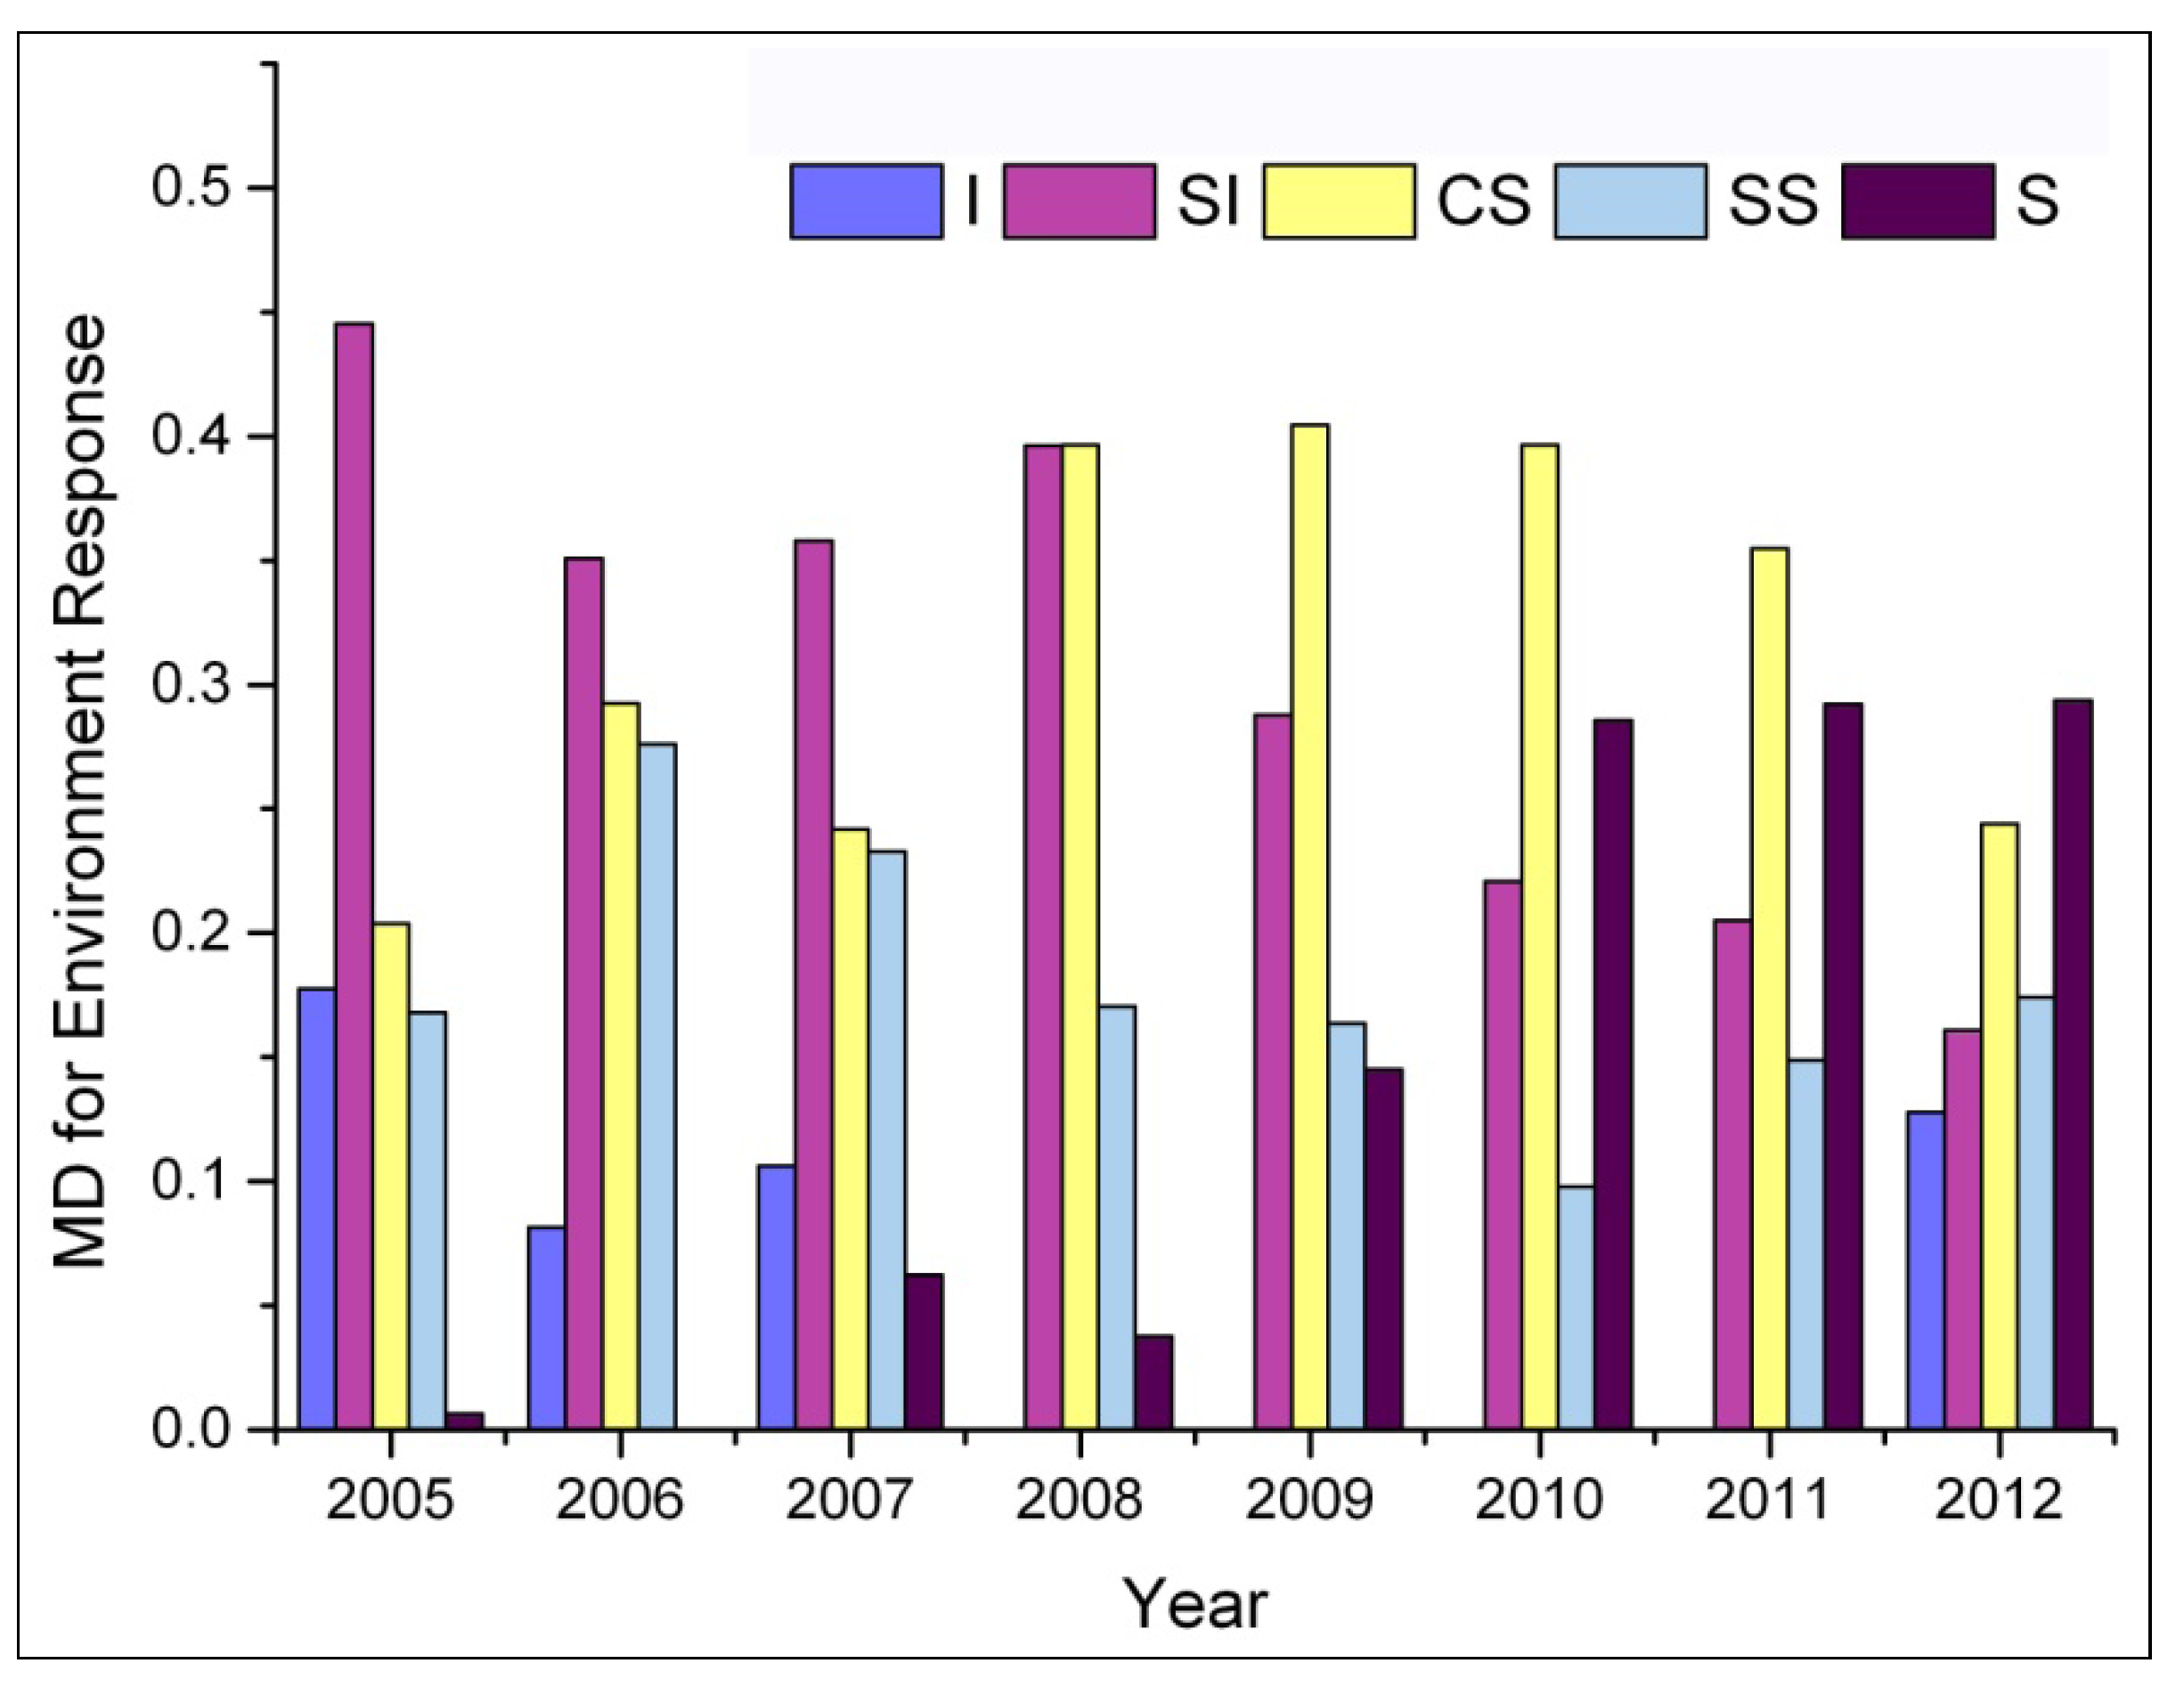
3.3. Fuzzy Comprehensive Evaluation for Criterion Layer

To understanding changes in environment pressure, environment state and environment response over the 2005–2012 period, data are obtained (Table 4) and analyzed (Figure 1, Figure 2 and Figure 3).
Figure 1. MD for environment pressure.
Sustainability 06 02281 g001
Table 4 shows that there is a serious environmental problem with slight insecurity from 2005 to 2012. Criticality security prevailed in its environment state, and eigenvalues of eco-security level in the environment response were located in slight insecurity and criticality security. It is obvious that the total eco-security of Mianyang city is in an unsustainable status. For this reason, the following analysis will show the importance of those indicators affecting the evaluation result, which will give decision maker directions of urban development.
Table 4. Membership degree (MD) of eco-security level in criterion layer.
CLYearMDEigenvalueResult
ISICSSSS
Environment pressure20050.46580.09090.20940.12330.11154.2416SI
20060.37290.20620.17670.13820.10704.3163SI
20070.45680.11650.10270.18290.14214.5187SI
20080.39050.25260.07290.12140.16364.3469SI
20090.42360.22820.06730.10790.17404.2973SI
20100.28130.36460.07560.10550.17404.4441SI
20110.26020.39020.06990.10660.17404.4598SI
20120.22470.36840.12960.10420.17404.6028SI
Environment state20050.17320.18990.18470.29790.15635.6294CS
20060.24040.19470.21890.18440.16365.1070CS
20070.24260.09930.30320.15200.20485.3588CS
20080.08020.22850.32070.22550.14715.5773CS
20090.24150.09080.32170.14320.20485.3527CS
20100.11800.20160.33440.12320.22485.5216CS
20110.10860.12820.25900.11170.39456.3411CS
20120.07080.10670.31810.15400.35246.4556CS
Environment response20050.17750.44530.20390.16790.00644.1112SI
20060.08160.35090.29260.27600.00004.8863SI
20070.10610.35790.24190.23270.06244.9185SI
20080.00000.39620.39660.17050.03774.8750SI
20090.00000.28770.40470.16370.14505.5007CS
20100.00000.22080.39660.09790.28586.0002CS
20110.00000.20500.35500.14880.29226.2102CS
20120.12800.16090.24410.17420.29385.9971CS
Figure 1 shows that Mianyang city has experienced a moderately higher increase in the security level of environment pressure. The MD of insecurity decreases while slight insecurity still accounts for a larger proportion. Going deeper into the factor layer, it is found that Mianyang city is suffering from the limitations of land resource, water resource, ecological environment and social-economic development capacity. After analysis of indicator layer, there is a sharp contrast between performance value and the standard value of indicators. (1) Land pressure. Paved road area per capita tends to be low, 7.98 of performance value against 30 of marking value. With vehicle possessing quantity soaring and traffic jams frequent, contradiction between the demand and the supply of traffic infrastructure is becoming increasingly acute which warns the decision maker to improve the traffic conditions. (2) Water resource pressure. Per capita daily water consumption decreases year by year, the MD of slight insecurity appears to be on the high with a shortage of high quality water. (3) Ecological environment pressure. SO2 emissions intensity per 104 Yuan GDP (maximum of 16.61, minimum of 4.56) and industrial dust emission intensity per 104 yuan (maximum of 7.27, minimum of 2.03) shows a decline tendency, but comparing them with emission standards, protection ecological environment has admitted no delay. Otherwise, bad air quality will endanger residents’ health. Measures must be taken to improve technology, optimize the industrial structure and rationalize the land layout. (4) Pressure on social-economic development ability. The low per capita GDP reflects the bad living standard. The existing allocation standards for medical facilities are not enough to guarantee the physical health with doctors per 104 people maximum of 23.42 against the marking value of 50. In the public transit vehicles per 104 people, there is a wide gap between performance value (maximum of 8.13, minimum of 5.55) and the marking value of 30.
The above analysis shows that, with population size and land scale expanding, urban ecological environmental pressure gets more complicated and diversified. Further quantitative analysis helps decision makers to discriminate between the key problems.
Figure 2. MD for environment state.
Sustainability 06 02281 g002
Figure 2 shows that the MD of criticality security and security are dominant, and environmental state has a good trend. However, the MD of security dropped from 0.53 in 2007 to 0.041 in 2008 because the ratio of air pollution indicator to the second grade in all years decreased by 5 percent. Comparatively, the MD of security in 2011 increased dramatically because the MD of forest coverage rate and built-up area green coverage rate increased, the former from 0.14 in 2010 to 1 in 2011 and the latter from zero in 2010 to 0.612 in 2011, greatly improving Mianyang’s natural environment. Moreover, there are two indicators mainly affecting the urban eco-security: One is energy consumption per 104 Yuan with the marking value 0.1 ton of standard coal equivalent against minimum of 1.36 and maximum of 1.40 between insecurity and slight insecurity. Another is per capita public green area (marking value: 20 m2) against minimum of 5.31 and maximum of 10.39 located in insecurity and slight insecurity.
These findings from comparison show that Mianyang city has experienced a moderately higher increase in forest coverage rate, and there is a significant gap between performance value and marking value in per capita public green area and the energy consumption by per 104 Yuan GDP. So Mianyang city needs to improve the public green space for a good natural ecological environment and optimize energy structure or adjust its industrial structure [47]. Besides, Engel coefficients of urban residents always tend to be in a stable, criticality state, which shows a greater potential for life quality.
Figure 3 shows that the MD of security is significantly increased from 2008 to 2012, which results from the proportion of research and development investment to GDP and industrial wastewater discharge treatment rate increasing through adding economic invest and controlling pollution. Insecurity has a greater variation range whose values were zero from 2008 to 2011. The reason for this is that the insecurity MD of the town's life sewage centralized treatment rate decreased from 0.722 in 2007 to zero, thereupon the MD of insecurity for all indicators maintained at zero till 2011.The situation was reversed when proportion of environment protection investment to GDP in 2012 abruptly decreased to insecurity from 2.23% in 2011 to 0.79% in 2012. The MD of slight insecurity is in decline with a certain rule. Criticality security peaked in 2009, and subsequently started to drop.
Figure 3. MD for environment response.
Sustainability 06 02281 g003
Based on the above, the evaluation results of environment response showed that some progress has been made to strengthen urban ecological security in Mianyang city. However, some further efforts must be promoted as follows: (1) Adjusting industrial structure to increase percentage of the tertiary industry to GDP; (2) quickening environment infrastructure construction for the town’s life sewage centralized treatment rate, and adding up economic input into environment protection and research and development investment; (3) controlling the pollution by clean production and circuit economy, especially comprehensive utilization of waste water, waste gas and solid waste.

4. Conclusions

ISUESE is divided into four layers (including the target layer, criterion layer, factor layer and indicator layer) and 27 indicators. The study analyzes the importance degree of every indicator in the whole evaluation system with a weight coefficient, and points out the ecological security characteristics and causation from 2005 to 2012 in Mianyang city. According to the results and discussion, the following conclusions can be made:
Firstly, the top three indicators in terms of ecological security are; per capita area of paved road, per capita area of cultivated land and green coverage rate of built-up area, which shows that these indicators weigh more in the UESE. In the next place are: Discharge treatment rate of industrial wastewater, SO2 emissions intensity per 104 Yuan GDP and per capita daily water consumption, while the forest coverage rate and Engel coefficient of urban residents weigh less.
Secondly, evaluation results show that eco-security takes on a favorable trend, but criticality security and slight insecurity are dominant. It is also found that insecurity membership degree of environment pressure accounts for a very large proportion. Membership degree of criticality security and security in environment state are increasing gradually, and as far as environment response in concerned, security is significantly increased.
Thirdly, in Mianyang city, some measures should be made for improving the urban eco-security through environmental protection, reasonable resource development, urban infrastructure construction, urban industrial structure adjustment, pollution abatement, and so on.
This study provides us with a method for finding out ecological environmental problems, and a useful tool for supervising advantages and disadvantages of urban development decision-making, which has proved effective for forecasting urban ecological security.
Fourthly, some thoughts which are worth further discussing have to be pointed out: (1) It is noted that, due to the fact that partial data is difficult to collect, some of the key ecological security indicators will be ignored in establishing an indicator system, which may introduce a little error to the evaluation results. (2) The most problem in urban eco-security evaluation is from security standard [48]. In fact, determination of standard value and evaluation set are quite important, and the author hopes that the future study will have a breakthrough. (3) Ecological security involves multi-disciplines, so the author also hopes to be able to combine sociology, urban planning, and ecological environment to explore more indicators of urban ecological security, expand connotation and denotation of security and establish a universal and flexible ISUESE.

Author Contributions

In the manuscript, Chun-rong Zhao and Bo Zhou conceived and designed the study, Xin Su was responsible for collecting and analyzing the data, and drafting the article or revising it was mainly carried out by Chun-rong Zhao. All co-authors approve of the version to be published.

Conflicts of Interest

The authors declare no conflict of interest.

References

  1. Zhao, Y.; Zou, X.; Cheng, H.; Jia, H.; Wu, Y.; Wang, G.; Zhang, C.; Gao, S. Assessing the ecological security of the Tibetan plateau: Methodology and a case study for Lhaze County. J. Environ. Manag. 2006, 80, 120–131. [Google Scholar] [CrossRef]
  2. Ezeonu, I.C.; Ezeonu, F.C. The environment and global security. Environmentalist 2000, 20, 41–48. [Google Scholar] [CrossRef]
  3. McNelis, D.N.; Schweitzer, G.E. Environment security: An evolving concept. Available online: http://0-pubs-acs-org.brum.beds.ac.uk/doi/pdf/10.1021/es0122849 (accessed on 15 July 2013).
  4. Pirages, D. Ecological security: Micro-threats to human being. Available online: http://www.bsos.umd.edu/harrison/papers/paper13.html (accessed on 16 July 2013).
  5. Rogers, K.S. Ecological security and multinational corporations. Available online: http://www.ciaonet.org/wps/ecs07.html (accessed on 23 July 2013).
  6. Hammond, A.; Adriaanse, A.; Rodenburg, E.; Bryant, D.; Woodward, R. Environmental indicators: A systematic approach to measuring and reporting on environmental policy performance in the context of sustainable development. Available online: http://pdf.wri.org/environmentalindicators_bw.pdf (accessed on 16 July 2013).
  7. Xiao, D.N.; Chen, W.B.; Guo, F.L. On the basic concepts and contents of ecological security. Chin. J. Appl. Ecol. 2002, 13, 354–358. [Google Scholar]
  8. Cuadra, M.; Björklund, J. Assessment of economic and ecological carrying capacity of agricultural crops in Nicaragua. Ecol. Indic. 2007, 7, 133–149. [Google Scholar] [CrossRef]
  9. Graymore, M.; Sipe, N.G.; Rickson, R.E. Sustaining human carrying capacity: A tool for regional sustainability assessment. Ecol. Econ. 2010, 69, 459–468. [Google Scholar] [CrossRef]
  10. Schaeffer, D.J.; Herricks, E.E.; Kerster, H.W. Ecosystem health: Measuring ecosystem health. Environ. Manag. 1988, 12, 445–455. [Google Scholar] [CrossRef]
  11. Viglizzo, E.F.; Paruelo, J.M.; Laterra, P.; Jobbagy, E.G. Ecosystem service evaluation to support land-use policy. Agri. Ecosyst. Environ. 2012, 154, 78–84. [Google Scholar] [CrossRef]
  12. Wachemagel, M.; Yount, J.D. Footprint for sustainability: The next step. Environ. Dev. Sustain. 2002, 2, 21–42. [Google Scholar]
  13. Wang, X.; Zhong, X.; Gao, P. A GIS-based decision support system for regional eco-security assessment and its application on the Tibetan Plateau. J. Environ. Manag. 2010, 91, 1981–1990. [Google Scholar] [CrossRef]
  14. Gong, J.Z.; Xia, B.C.; Guo, L. Assessmentand prediction models of urban ecological security. Acta Sci. Natur. Univ. Sunyatseni 2006, 45, 107–111. [Google Scholar]
  15. Li, Y.; Sun, X.; Zhu, X.; Cao, H. An early warning method of landscape ecological security in rapid urbanizing coastal areas and its application in Xiamen, China. Ecol. Model. 2010, 221, 2251–2260. [Google Scholar] [CrossRef]
  16. Gong, J.; Liu, Y.; Xia, B.; Zhao, G. Urban ecological security assessment and forecasting, based on a cellular automata model: A case study of Guangzhou, China. Ecol. Model. 2009, 220, 3612–3620. [Google Scholar] [CrossRef]
  17. Wang, H.; Wang, H.; Zhang, X.W. Research review on ecological security assessment. Chin. J. Ecol. 2006, 25, 74–78. [Google Scholar]
  18. Li, X.B.; Tian, M.R.; Wang, H.; Wang, H.; Yu, J.J. Development of an ecological security evaluation method based on the ecological footprint and application to a typical steppe region in China. Ecol. Indic. 2014, 39, 153–159. [Google Scholar] [CrossRef]
  19. Huang, Q.; Wang, R.H.; Ren, Z.Y.; Li, J.; Zhang, H.Z. Regional ecological security assessment based on long periods of ecological footprint analysis. Resour. Conservat. Recycl. 2007, 51, 24–41. [Google Scholar] [CrossRef]
  20. Loiseau, E.; Junqua, G.; Roux, P.; Bellon-Maurel, V. Environmental assessment of a territory: An overview of existing tools and methods. J. Environ. Manag. 2012, 112, 213–225. [Google Scholar] [CrossRef]
  21. Kayacan, E.; Ulutas, B.; Kaynak, O. Grey system theory-based models in time series prediction. Expert. Syst. Appl. 2010, 37, 1784–1789. [Google Scholar] [CrossRef]
  22. Li, B.; Wei, Y. Optimized grey derivative of GM (1, 1). Syst. Eng. Theor. Pract. 2009, 29, 100–105. [Google Scholar] [CrossRef]
  23. Norton, S.B.; Rodier, D.J.; van der Schalie, W.H.; Wood, W.P.; Slimak, M.W.; Gentile, J.H. A framework for ecological risk assessment at the EPA. Environ. Toxicol. Chem. 1992, 11, 1663–1672. [Google Scholar] [CrossRef]
  24. Martins, J.H.; Camanho, A.S.; Gaspar, M.B. A review of the application of driving forces-Pressure-State-Impact-Response framework to fisheries management. Ocean. Coast. Manag. 2012, 69, 273–281. [Google Scholar] [CrossRef]
  25. Wang, Q.; Yuan, X.; Zhang, J.; Mu, R.; Yang, H.; Ma, C. Key evaluation framework for the impacts of urbanization on air environment—A case study. Ecol. Indic. 2013, 24, 266–272. [Google Scholar] [CrossRef]
  26. Yang, J.P.; Lu, J.B. Analysis of Urban Ecosystem Security; Chemistry Industrial Press: Beijing, China, 2002. (In Chinese) [Google Scholar]
  27. Feng, S.; Xu, L.D. An intelligent decision support system for fuzzy comprehensive evaluation of urban development. Expert Syst. Appl. 1999, 16, 21–32. [Google Scholar] [CrossRef]
  28. Roseland, M. Dimensions of the eco-city. Cities 1997, 14, 197–202. [Google Scholar] [CrossRef]
  29. Li, H.L.; Li, Y. Chinese eco-city indicator construction. Urban Stud. 2011, 18, 81–86. [Google Scholar]
  30. Xie, P.F.; Zhou, L.L.; Liu, Y.; Zhang, A.H.; Pang, T.; Song, F.X. Research on eco-city index and best practices. Urban Stud. 2010, 17, 12–18. [Google Scholar]
  31. Song, Y.C.; Qi, R.H.; You, W.H.; Wang, X.R.; Zhu, L.B. A study on indices system and assessment criterion of eco-city. Urban Environ. Urban Ecol. 1999, 12, 16–19. [Google Scholar]
  32. Su, M.; Fath, B.D.; Yang, Z. Urban ecosystem health assessment: A review. Sci. Total. Environ. 2010, 408, 2425–2434. [Google Scholar] [CrossRef]
  33. Guan, D.J.; Su, W.C. Study on evaluation method for urban ecosystem health and its application. J. Environ. Sci. 2006, 26, 1716–1722. (In Chinese) [Google Scholar]
  34. Spiegel, J.M.; Bonet, M.; Yassi, A.; Molina, E.; Concepcion, M.; Mast, P. Developing ecosystem health indicators in Centro Habana: A community-based approach. Ecosyst. Health 2001, 7, 15–26. [Google Scholar] [CrossRef]
  35. Gao, C.B.; Chen, X.G.; Wei, C.H.; Peng, X.C. Application of entropy weight and fuzzy synthetic evaluation in urban ecological security assessment. Chin. J. Appl. Ecol. 2006, 17, 1923–1927. [Google Scholar]
  36. Diakoulaki, D.; Mavrotas, G.; Papayannakis, L. Determining objective weights in multiple criteria problems: The critic method. Computers. Ops. Res. 1995, 22, 763–770. [Google Scholar]
  37. Grupp, H.; Schubert, T. Review and new evidence on composite innovation indicators for evaluating national performance. Res. Pol. 2010, 39, 67–78. [Google Scholar] [CrossRef]
  38. Grupp, H.; Mogee, M.E. Indicators for national science and technology policy: How robust are composite indicators? Res. Pol. 2004, 33, 1373–1384. [Google Scholar] [CrossRef]
  39. Deng, H.P.; Yeh, C.H.; Willis, R.J. Inter-company comparison using modified TOPSIS with objective weights. Comput. Oper. Res. 2000, 27, 963–973. [Google Scholar] [CrossRef]
  40. Wang, M.T. Standard and mean deviation methods for determining the weight coefficients in multiindex comprehensive evaluation. Chin. Soft. Sci. 1999, 14, 100–107. [Google Scholar]
  41. Xu, Y.J.; Da, Q.L. Standard and mean deviation methods for linguistic group decision making and their applications. Exp. Syst. Appl. 2010, 37, 5905–5912. [Google Scholar] [CrossRef]
  42. Ananda, J.; Herath, G. A critical review of multi-criteria decision making methods with special reference to forest management and planning. Ecol. Econ. 2009, 68, 2535–2548. [Google Scholar] [CrossRef]
  43. Liang, Z.H.; Yang, K.; Sun, Y.W.; Yuan, J.H.; Zhang, H.W.; Zhang, Z.Z. Decision support for choice optimal power generation projects: Fuzzy comprehensive evaluation model based on the electricity market. Energ. Pol. 2006, 34, 3359–3364. [Google Scholar] [CrossRef]
  44. Deschrijver, G.; Kerre, E.E. On the position of intuitionistic fuzzy set theory in the framework of theories modelling imprecision. Inform. Sci. 2007, 177, 1860–1866. [Google Scholar] [CrossRef]
  45. Gupta, A.P.; Harboe, R.; Tabucanon, M.T. Fuzzy multiple-criteria decision-making for crop area planning in Narmada river basin. Agr. Syst. 2000, 63, 1–18. [Google Scholar] [CrossRef]
  46. Hai, R.T.; Wang, W.X. Assessment, Planning and Management of Ecological Environment; China Environment Science Press: Beijing, China, 2004. [Google Scholar]
  47. Zhang, J.; Deng, S.; Shen, F.; Yang, X.; Liu, G.; Guo, H.; Li, Y.; Hong, X.; Zhang, Y.; Peng, H.; et al. Modeling the relationship between energy consumption and economy development in China. Energy 2011, 36, 4227–4234. [Google Scholar] [CrossRef]
  48. Zhou, W.H.; Wang, R.S. Methodology assessment of urban ecological security: A case study of Beijing. Chin. J. Ecol. 2005, 7, 848–852. [Google Scholar]

