Household, Personal and Environmental Correlates of Rural Elderly’s Cycling Activity: Evidence from Zhongshan Metropolitan Area, China

Abstract
:1. Introduction
2. Data and Methods
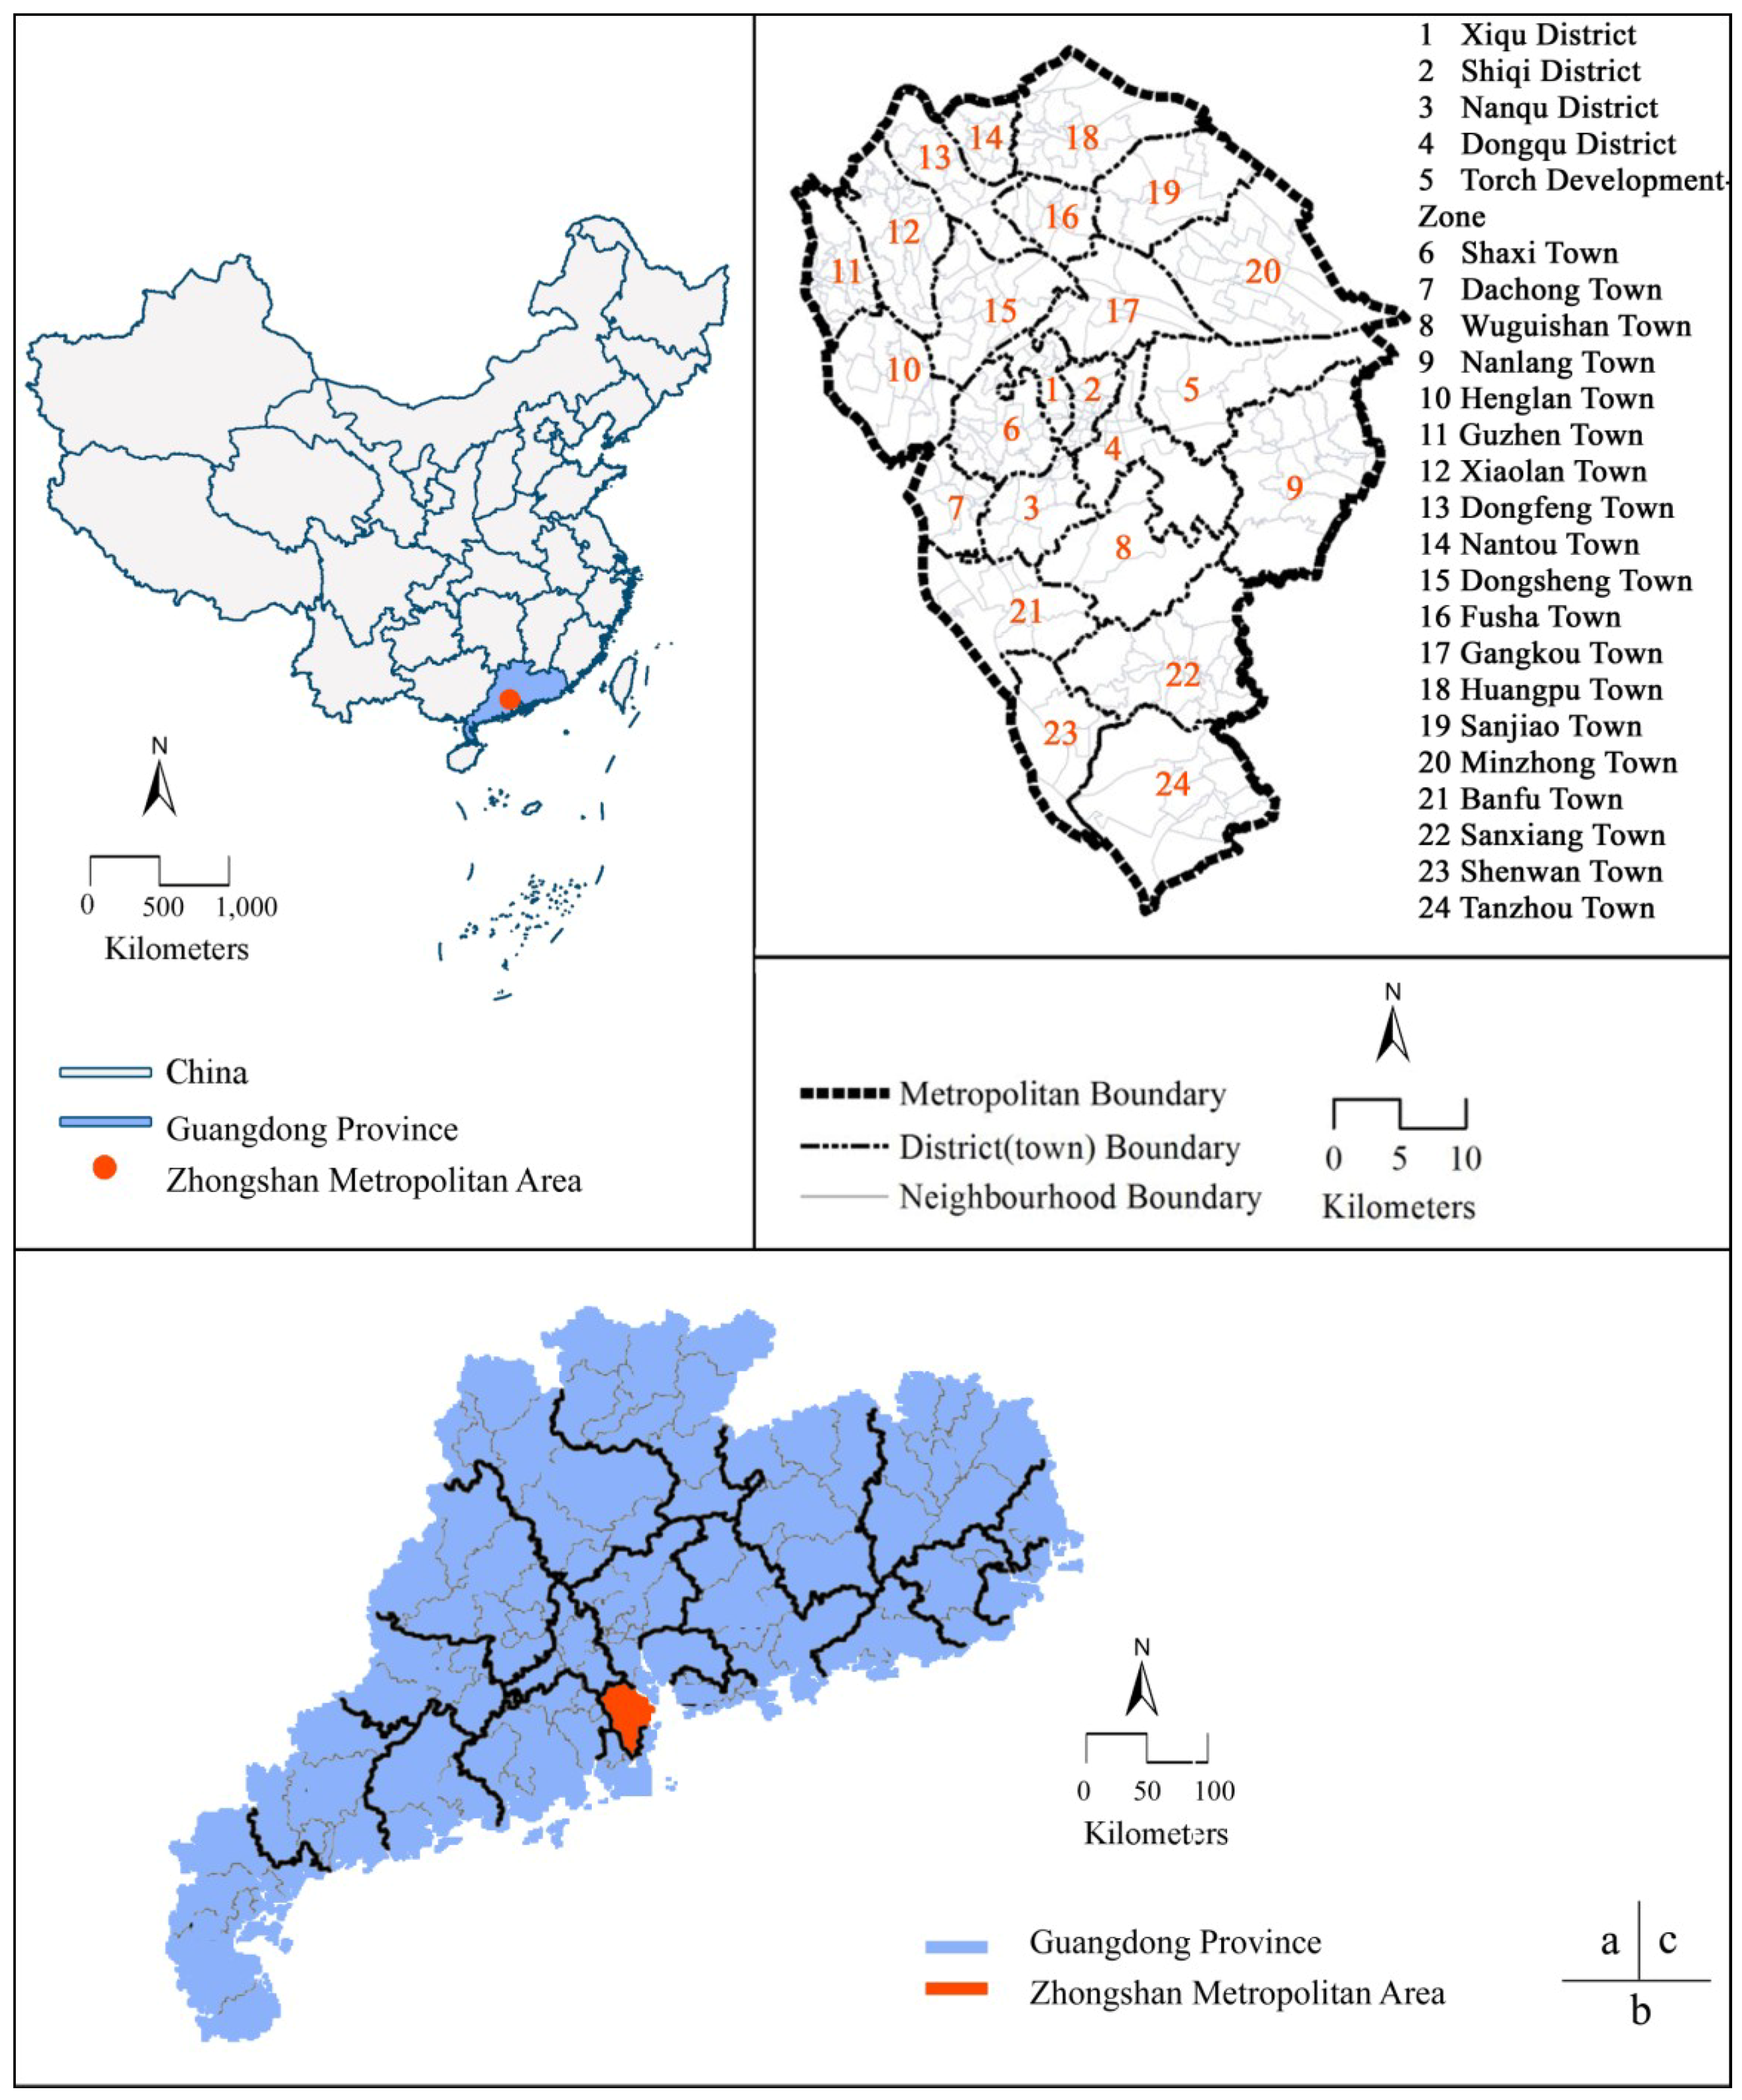
2.1. Study Area

2.2. Data Collection
2.3. Characterization of Social Environment Attributes
2.4. Characterization of Built Environment Attributes

| Five Variables | Meaning | Commonly used attributes |
|---|---|---|
| Density | The variable of interest per unit of area | Population density, dwelling units density, employment density |
| Design | Street network characteristics within an area | Average block size, proportion of four-way intersections, number of intersections per square mile, bike lane density, average building setbacks, average street widths, numbers of pedestrian crossings, street trees |
| Diversity | The number of different land uses in a given area and the degree to which they are represented | Entropy measures of diversity, jobs-to-housing ratios, jobs-to-population ratios |
| Distance to transit | The level of transit service at the residences or workplaces | Distance from the residences or workplaces to the nearest rail station or bus stop, transit route density, distance between transit stops, number of stations per unit area, bus service coverage rate |
| Destination accessibility | Ease of access to trip attractions | Distance to the central business district, number of jobs or other attractions reachable within a given travel time, distance from home to the closest store |

2.5. Model Specification
3. Results
3.1. Descriptive Statistics
| Variable | Description | Mean | S. D. | Min. | Max. |
|---|---|---|---|---|---|
| Dependent variables | |||||
| Frequency | Frequency of rural elderly’s cycling trips, times per day, count | 0.46 | 1.00 | 0 | 6 |
| Duration | Duration of rural elderly’s cycling trips, minutes per day, count | 5.90 | 14.68 | 0 | 120 |
| Household attributes (Independent variables) | |||||
| HHSIZE_1 | Household size is one person, binary, 1 = yes | 0.23 | 0.42 | 0 | 1 |
| HHSIZE_2 | Household size is two persons, binary, 1 = yes | 0.35 | 0.48 | 0 | 1 |
| HHSIZE > 2 | Household size is three or more persons, binary, 1 = yes | 0.43 | 0.49 | 1 | 1 |
| HIGHINC | High household income(>60000 RMB/year), binary, 1 = yes | 0.12 | 0.32 | 0 | 1 |
| MEDINC | Medium household income (20000-60000 RMB/year), binary, 1 = yes | 0.41 | 0.49 | 0 | 1 |
| LOWINC | Low household income (<20000 RMB/year), binary, 1 = yes | 0.48 | 0.50 | 0 | 1 |
| EMPLOYED | Number of persons employed in a household, count | 1.22 | 1.13 | 0 | 5 |
| BIKES | Number of bikes in a household, count | 0.60 | 0.69 | 0 | 5 |
| E-BIKES | Number of electric bikes in a household, count | 0.24 | 0.47 | 0 | 3 |
| MOTORS | Number of motorcycles in a household, count | 0.70 | 0.84 | 0 | 5 |
| CARS | Number of private cars in a household, count | 0.13 | 0.41 | 0 | 4 |
| Personal demographic and attitudinal attributes (Independent variables) | |||||
| GENDER | 1 = Male, 0 = Female, binary | 0.63 | 0.48 | 0 | 1 |
| AGE | Age of the respondent in years, count | 67.17 | 6.77 | 60 | 95 |
| PROBIKE | The respondent favors bicycle over other non-motorized modes, binary, 1 = yes | 0.16 | 0.37 | 0 | 1 |
| PROWALK | The respondent favors walking over other non-motorized modes, binary, 1 = yes | 0.23 | 0.42 | 0 | 1 |
| PROEBIKE | The respondent favors e-bike over other non-motorized modes, binary, 1 = yes | 0.07 | 0.25 | 0 | 1 |
| Social environment attributes (Independent variables) | |||||
| P_EMPLOYED | Proportions of employed population in the neighborhood, continuous | 0.62 | 0.08 | 0.44 | 0.81 |
| P _ELDERLY | Proportions of elderly population in the neighborhood, continuous | 0.13 | 0.06 | 0.05 | 0.28 |
| P_HIGHINC | Proportions of high-income household in the neighborhood, continuous | 0.08 | 0.27 | 0 | 1 |
| P_MEDINC | Proportions of medium-income household in the neighborhood, continuous | 0.67 | 0.47 | 0 | 1 |
| P_LOWINC | Proportions of low-income household in the neighborhood, continuous | 0.25 | 0.43 | 0 | 1 |
| Built environment attributes (Independent variables) | |||||
| BIKELANE | Bike lane density, km/km2, continuous | 2.58 | 2.09 | 0.25 | 9.58 |
| POPDEN | Population density, 1000 persons/km2, continuous | 2.31 | 2.06 | 0.16 | 13.00 |
| MIXTURE | Land-use mixture | 0.67 | 0.17 | 0.07 | 0.99 |
| BUSSERV | Bus stop density, number of bus stops per km2, continuous | 0.28 | 0.21 | 0.00 | 0.96 |
| CBDDIST | Euclidean distance from the centroid of the neighborhood to the central business district, in km, continuous | 2.01 | 1.03 | 0.04 | 4.29 |
3.2. Negative Binomial Regression Analysis of Frequency and Duration of Rural Elderly’s Cycling Trips
| Variable | Coefficients by Dependent Variables and Model Type | |||
|---|---|---|---|---|
| Frequency of cycling (times/day) | Duration of cycling (min./day) | |||
| Basic | Expanded | Basic | Expanded | |
| Household attributes (HHSIZE > 2 and LOWINC are reference categories) | ||||
| HHSIZE_1 | 0.282 | 0.229 | 0.603 | 0.553 |
| HHSIZE_2 | 0.297 *** | 0.272 | 0.605 *** | 0.512 *** |
| HIGHINC | 0.178 | 0.018 | 0.385 | 0.499 |
| MEDINC | 0.153 | 0.033 | 0.143 | 0.291 |
| N_EMPLOYED | 0.154 * | 0.133 ** | 0.092 | 0.038 |
| BIKES | 0.937 * | 0.921 * | 1.733 * | 1.993 * |
| EBIKES | –0.283 ** | –0.264 *** | –0.479 *** | –0.470 *** |
| MOTORS | –0.211 ** | –0.169 ** | –0.087 | –0.130 |
| CARS | –0.328 ** | –0.342 ** | –0.595 | –0.786 *** |
| Personal attributes | ||||
| MALE | 0.395 * | 0.349 * | 0.402 ** | 0.357 *** |
| AGE | –0.030 * | –0.030 * | –0.055 * | –0.039 ** |
| PROBIKE | 1.359 * | 1.454 * | 1.889 * | 1.932 * |
| PROWALK | –0.828 * | –0.766 * | –0.734 * | –0.813 * |
| PROEBIKE | –2.361 * | –2.358 * | –0.385 * | –0.003 |
| Social environment (R_LOWINC is a reference category) | ||||
| P_EMPLOYED | –1.448 *** | 0.362 | ||
| P_ELDERLY | –4.379 * | –5.183 ** | ||
| P_HIGHINC | 0.208 | 0.021 | ||
| P MEDINC | 0.313 ** | –0.160 | ||
| Built environment | ||||
| BIKELANE | 0.052 ** | 0.134 ** | ||
| POPDEN | 0.074 ** | 0.131 *** | ||
| MIXTURE | 0.536 *** | 1.416 ** | ||
| BUSSERV | –0.616 * | –0.792 *** | ||
| CBDDIST | –0.132 * | –0.141 | ||
| _cons | –0.544 | 0.834 | 2.507 | 1.383 |
| Summary statistics | ||||
| Number of obs | 1572 | |||
| LR chi2 | 450.74 | 481.86 | 184.42 | 200.91 |
| Prob > chi2 | 0.0000 | 0.0000 | 0.0000 | 0.0000 |
| Pseudo–R2 | 0.1704 | 0.1822 | 0.0415 | 0.0452 |
| Log likelihood | –1096.8063 | –1081.1096 | –2128.8315 | –2120.584 |
4. Discussion and Policy Implications
- Disseminating healthy life style involving cycling activity. As it is hard to change attitudes among the elderly, we recommended diversified initiatives (public lectures, cycling campaigns, specialized websites, etc.) that have been proven to be successful in the Ten Thousand Steps a Day program [44]. We even recommend incorporating the promotion of cycling activity into the Ten Thousand Steps a Day program.
- Developing neighborhoods with relatively balanced age structure and avoiding overly aggregation of the elderly population.
- Discouraging vehicle ownership. The findings in this study indicated that more vehicle ownership is related to less cycling, consistent with a previous study in the Chinese context [41]. It is recommended to encourage cycling through policies discourage vehicle ownership.
- Maintaining a compact urban form related to high density and mixed development.
5. Strengths and Limitations
6. Conclusions
Acknowledgment
Author Contributions
Conflicts of Interest
References and Notes
- Nelson, M.E.; Rejeski, W.J.; Blair, S.N.; Duncan, P.W.; Judge, J.O.; King, A.C.; Macera, C.A.; Castaneda-Sceppa, C. Physical activity and public health in older adults: Recommendation from the American College of Sports Medicine and the American Heart Association. Med. Sci. Sport. Exer. 2007, 39, 1435–1445. [Google Scholar] [CrossRef]
- Keysor, J.J. Does late-life physical activity or exercise prevent or minimize disablement?: A critical review of the scientific evidence. Am. J. Prev. Med. 2003, 25, 129–136. [Google Scholar] [CrossRef]
- Wu, Y. China Report of the Development on Aging Cause; Social Sciences Acadamic Press: Beijing, China, 2013. (In Chinese) [Google Scholar]
- National Health and Family Planning Commission of China. Promotiona of Healthy Living Style in China; (In Chinese). National Health and Family Planning Commission of China (NHFPC): Beijing, China, 2007.
- Handy, S.L.; Boarnet, M.G.; Ewing, R.; Killingsworth, R.E. How the built environment affects physical activity: Views from urban planning. Am. J. Prev. Med. 2002, 23, 64–73. [Google Scholar] [CrossRef]
- Saelens, B.E.; Sallis, J.F.; Black, J.B.; Chen, D. Neighborhood-based differences in physical activity: An environment scale evaluation. Am. J. Public Health 2003, 93, 1552–1558. [Google Scholar]
- Brownson, R.C.; Hoehner, C.M.; Day, K.; Forsyth, A.; Sallis, J.F. Measuring the Built Environment for Physical Activity State of the Science. Am. J. Prev. Med. 2009, 36, S99–S123. [Google Scholar]
- McCormack, G.R.; Shiell, A. In search of causality: A systematic review of the relationship between the built environment and physical activity among adults. Int. J. Behav. Nutr. Phys. Activity 2011, 8, 125–135. [Google Scholar] [CrossRef]
- Van Cauwenberg, J.; de Bourdeaudhuij, I.; de Meester, F.; van Dyck, D.; Salmon, J.; Clarys, P.; Deforche, B. Relationship between the physical environment and physical activity in older adults: A systematic review. Health Place 2011, 17, 458–469. [Google Scholar] [CrossRef]
- Saelens, B.E.; Handy, S.L. Built environment correlates of walking: A review. Med. Sci. Sport. Exer. 2008, 40, S550–S566. [Google Scholar] [CrossRef]
- Barnett, E.; Casper, M. A definition of “social environment”. Am. J. Public Health 2001, 91, 465. [Google Scholar]
- Roof, K.; Oleru, N. Public health: Seattle and King County’s push for the built environment. J. Environ. Health 2008, 71, 24–27. [Google Scholar]
- Srinivasan, S.; O’Fallon, L.R.; Dearry, A. Creating healthy communities, healthy homes, healthy people: Initiating a research agenda on the built environment and public health. Am. J. Public Health 2003, 93, 1446–1450. [Google Scholar] [CrossRef]
- Li, F.; Fisher, K.J.; Brownson, R.C.; Bosworth, M. Multilevel modelling of built environment characteristics related to neighbourhood walking activity in older adults. J. Epidemiol. Commun. Health 2005, 59, 558–564. [Google Scholar] [CrossRef]
- Kemperman, A.; Timmerman, H. Influences of built environment on walking and cycling by latent segments of aging population. Transport. Res. Rec. 2009, 2134, 1–9. [Google Scholar]
- Nagel, C.L.; Carlson, N.E.; Bosworth, M.; Michael, Y.L. The relation between neighborhood built environment and walking activity among older adults. Am. J. Epidemiol. 2008, 168, 461–468. [Google Scholar] [CrossRef]
- Sugiyama, T.; Thompson, C.W. Older people’s health, outdoor activity and supportiveness of neighbourhood environments. Landsc. Urban Plan. 2007, 83, 168–175. [Google Scholar] [CrossRef]
- Sugiyama, T.; Thompson, C.W.; Alves, S. Associations between neighborhood open space attributes and quality of life for older people in Britain. Environ. Behav. 2009, 41, 3–21. [Google Scholar] [CrossRef]
- De Leon, C.F.M.; Cagney, K.A.; Bienias, J.L.; Barnes, L.L.; Skarupski, K.A.; Scherr, P.A.; Evans, D.A. Neighborhood Social Cohesion and Disorder in Relation to Walking in Community-Dwelling Older Adults: A Multilevel Analysis. J. Aging Health 2009, 21, 155–171. [Google Scholar] [CrossRef]
- Lee, I.; Ewing, R.; Sesso, H.D. The built environment and physical activity levels: The Harvard Alumni Health Study. Am. J. Prev. Med. 2009, 37, 293–298. [Google Scholar] [CrossRef]
- Clark, A.F.; Scott, D.M. Does the social environment influence active travel? An investigation of walking in Hamilton, Canada. J. Transp. Geogr. 2013, 31, 278–285. [Google Scholar] [CrossRef]
- Chaudhury, H.; Mahmood, A.; Michael, Y.L.; Campo, M.; Hay, K. The influence of neighborhood residential density, physical and social environments on older adults’ physical activity: An exploratory study in two metropolitan areas. J. Aging Stud. 2012, 26, 35–43. [Google Scholar] [CrossRef]
- Siu, V.W.; Lambert, W.E.; Fu, R.; Hillier, T.A.; Bosworth, M.; Michael, Y.L. Built Environment and Its Influences on Walking among Older Women: Use of Standardized Geographic Units to Define Urban Forms. J. Environ. Public Health 2012, 2012, 1–9. [Google Scholar]
- Rodríguez, D.A.; Evenson, K.R.; Diez Roux, A.V.; Brines, S.J. Land use, residential density, and walking: The multi-ethnic study of atherosclerosis. Am. J. Prev. Med. 2009, 37, 397–404. [Google Scholar] [CrossRef]
- Shigematsu, R.; Sallis, J.; Conway, T.; Saelens, B.; Frank, L.; Cain, K.; Chapman, J.; King, A. Age differences in the relation of perceived neighborhood environment to walking. Med. Sci. Sport. Exer. 2009, 41, 314–321. [Google Scholar]
- Zhang, Y.; Li, Y.; Yang, X.; Liu, Q.; Li, C. Built Environment and Household Electric Bike Ownership. Transport. Res. Rec. 2013, 2387, 102–111. [Google Scholar] [CrossRef]
- King, W.C.; Belle, S.H.; Brach, J.S.; Simkin-Silverman, L.R.; Soska, T.; Kriska, A.M. Objective measures of neighborhood environment and physical activity in older women. Am. J. Prev. Med. 2005, 28, 461–469. [Google Scholar] [CrossRef]
- Riva, M.; Gauvin, L.; Apparicio, P.; Brodeur, J.-M. Disentangling the relative influence of built and socioeconomic environments on walking: The contribution of areas homogenous along exposures of interest. Soc. Sci. Med. 2009, 69, 1296–1305. [Google Scholar] [CrossRef]
- Zhang, Y.; Li, Y.; Liu, Q.; Li, C. The Built Environment and Walking Activity of the Elderly: An Empirical Analysis in the Zhongshan Metropolitan Area, China. Sustainability 2014, 6, 1076–1092. [Google Scholar] [CrossRef]
- Badland, H.M.; Garrett, N.; Schofield, G.M. How does car parking availability and public transport accessibility influence work-related travel behaviors? Sustainability 2010, 2, 576–590. [Google Scholar] [CrossRef]
- Frank, L.; Kerr, J.; Chapman, J.; Sallis, J. Urban form relationships with walk trip frequency and distance among youth. Am. J. Health Promot. 2007, 21, 305–311. [Google Scholar] [CrossRef]
- Cerin, E.; Lee, K.-Y.; Barnett, A.; Sit, C.; Cheung, M.-C.; Chan, W.-M.; Johnston, J. Walking for transportation in Hong Kong Chinese urban elders: A cross-sectional study on what destinations matter and when. Int. J. Behav. Nutr. Phys. Activity 2013, 10, 78–87. [Google Scholar] [CrossRef] [Green Version]
- Ewing, R.; Cervero, R. Travel and the Built Environment. J Am. Plann. Assoc. 2010, 76, 265–294. [Google Scholar] [CrossRef]
- Zhang, Y.; Chen, L.; Zhu, W.; Liu, X.; Chen, D. Relationship between physical activity and environment in Shanghai, China: Analysis and evaluation in adults aged 45–80. Med. Sport 2011, 64, 269–284. [Google Scholar]
- National Bureau of Statistics of China. China Statistical Yearbook 2010; (In Chinese). China Statistics Press: Beijing, China, 2010.
- Zhongshan Municipal Bureau of Urban Planning. Zhongshan Transportation Development Planning; Zhongshan Municipal Bureau of Urban Planning: Zhongshan, China, 2010. (In Chinese)
- Martinez, L.M.; Viegas, J.M.; Silva, E.A. A traffic analysis zone definition: A new methodology and algorithm. Transportation 2009, 36, 581–599. [Google Scholar] [CrossRef]
- Ministry of Construction of the People’s Republic of China. Code for Transport Planning on Urban Road (GB 50220–95); (In Chinese). Ministry of Construction of the People’s Republic of China: Beijing, China, 1995.
- Kockelman, K.M. Travel behavior as function of accessibility, land use mixing, and land use balance: Evidence from San Francisco Bay Area. Transport. Res. Rec. 1997, 1607, 116–125. [Google Scholar]
- Ministry of Housing and Urban-Rural Development of the People’s Republic of China. Code for Urban Land Use Classes and Standards of Planning Construction Land (GB50137–2011); (In Chinese). Ministry of Housing and Urban-Rural Development of the People’s Republic of China: Beijing, China, 2011.
- Zhao, P. The Impact of the Built Environment on Bicycle Commuting: Evidence from Beijing. Urban Stud. 2014, 51, 1019–1037. [Google Scholar] [CrossRef]
- Dill, J.; Voros, K. Factors affecting bicycling demand—Initial survey findings from the Portland, Oregon, Region. Transport. Res. Rec. 2007, 2031, 9–17. [Google Scholar]
- Ball, K.; Jeffery, R.W.; Abbott, G.; McNaughton, S.A.; Crawford, D. Is healthy behavior contagious: Associations of social norms with physical activity and healthy eating. Int. J. Behav. Nutr. Phys. Activity 2010, 7, 86–95. [Google Scholar] [CrossRef]
- Yang, Z. Behavior and health. Chin. J. Behav. Med. Brain Sci. 2009, 18, 61–63. (In Chinese) [Google Scholar]
© 2014 by the authors; licensee MDPI, Basel, Switzerland. This article is an open access article distributed under the terms and conditions of the Creative Commons Attribution license (http://creativecommons.org/licenses/by/3.0/).
Share and Cite
Zhang, Y.; Yang, X.; Li, Y.; Liu, Q.; Li, C. Household, Personal and Environmental Correlates of Rural Elderly’s Cycling Activity: Evidence from Zhongshan Metropolitan Area, China. Sustainability 2014, 6, 3599-3614. https://0-doi-org.brum.beds.ac.uk/10.3390/su6063599
Zhang Y, Yang X, Li Y, Liu Q, Li C. Household, Personal and Environmental Correlates of Rural Elderly’s Cycling Activity: Evidence from Zhongshan Metropolitan Area, China. Sustainability. 2014; 6(6):3599-3614. https://0-doi-org.brum.beds.ac.uk/10.3390/su6063599
Chicago/Turabian StyleZhang, Yi, Xiaoguang Yang, Yuan Li, Qixing Liu, and Chaoyang Li. 2014. "Household, Personal and Environmental Correlates of Rural Elderly’s Cycling Activity: Evidence from Zhongshan Metropolitan Area, China" Sustainability 6, no. 6: 3599-3614. https://0-doi-org.brum.beds.ac.uk/10.3390/su6063599