Article

Assessment of Progressive Product Innovation on Key Environmental Indicators: Pampers® Baby Wipes from 2007–2013

1
Procter & Gamble, Temselaan 100, B-1853 Strombeek-Bever, Belgium
2
Procter & Gamble, 6280 Center Hill Ave, Cincinnati, OH 45224, USA
3
Procter & Gamble, Sulzbacher Straße 40, 65824 Schwalbach am Taunus, Germany
*
Author to whom correspondence should be addressed.
These authors contributed equally to this work.
Sustainability 2014, 6(8), 5129-5142; https://0-doi-org.brum.beds.ac.uk/10.3390/su6085129
Submission received: 17 June 2014 / Revised: 14 July 2014 / Accepted: 21 July 2014 / Published: 11 August 2014
(This article belongs to the Section Economic and Business Aspects of Sustainability)

Abstract

:
Companies are increasingly conducting life cycle assessments (LCA) of their products to understand potential product impacts on the environment, prioritize areas of innovation to create more sustainable products, and determine valid claims. This case study shows the results of product innovation by comparing an older (2007) and new (2013) version of a common hygiene product in Europe and the U.S. The standard methodology follows the ISO 14040/44 Guidelines for LCA. Results are reported for the impact indicators with high relevance for the product category: primary energy, global warming, particulates, agricultural land occupation, fossil fuel depletion, and solid waste generation. Generally, raw material supply chains for product and packaging contribute most (up to 82%) to the calculated environmental impact indicators. Improvements vs. the 2007 baby wipe range between 4% and 14% in Europe and between 15% and 36% in the U.S. The improvement is driven by a new substrate technology that provides more surface area for cleaning, which results in lower use of resources. This case study illustrates three key environmental drivers behind this innovation: the corporate focus on R&D capability to design for environmentally improved products, the increased interest from retailers and consumers requiring accurate and relevant information on the performance and sustainability of products, and the company’s interest in deeper technical understanding of contributions from upstream material and process innovations on a product’s environmental profile.

1. Introduction

In 2011, the U.S. Department of Commerce estimated that the consumer goods industry was $432 billion in the US alone [1]. Globally, this industry is growing due to increasing middle class in emerging markets. By 2030, The Brookings Institute estimates that 70% of China’s population could be middle class and consume $10 trillion in goods and services per year, only surpassed by India [2]. Concurrent with these economic projections, the 2012 Living Planet Report estimates that human consumption of earth’s resources is unsustainable, and by 2030, we will need at least two planets to meet demand if we continue with our current consumptions patterns [3]. How could people’s desire to improve their lives with basic common goods be balanced or decoupled from the increasing pressure we put on the planet? This very complicated question has many theoretical answers and practical trials underway. One solution that we begin to address in this paper is how innovation, changing what and how we do everyday tasks, can contribute positively, and can become one way to scientifically assess those changes.
The consumer goods market is highly competitive for many kinds of products, so many producers are constantly making changes to product design, materials, manufacturing processes, and distribution channels, while ensuring compliance with national laws and safety. The innovation of everyday items we use at home, from small appliances and cleaning detergents to toiletries, has traditionally focused on improving performance and/or affordability. With increasing public interest in the environmental impacts of modern lifestyles, scientific methods are being further developed and applied by hundreds of companies to assess the environmental sustainability of their products and whole product categories [4].
A common method used by industry to assess the potential environmental impacts of a product or process is Life Cycle Assessment (LCA). Doing LCA requires a complex computer model that uses large data inventories to evaluate potential impacts throughout the ‘life cycle’ of a product, process, or service. Companies use LCA to compare a range of environmental effects assignable to products and services in order to improve processes, support policy, and provide a sound basis for informed decisions. It enables tests of assumptions about, and alternatives for, how a product or service could impact the environment from beginning—growing or extracting materials from the earth, to end—disposal and disintegration back to earth. LCA is the only holistic framework that exists to do this, defined by ISO 14040/44 Guidelines for Life Cycle Assessment [5,6].
The concept of Life Cycle Assessment emerged in the 1970s as a way to assess the overall use of energy and materials, and was later extended to include environmental emissions to air, water, and solid waste [7]. For more than 2 decades, P&G has been using LCA methods to evaluate >20 categories of the consumer goods it makes, and to help municipal governments assess solid waste management options [8,9,10]. The Company has found LCA useful to understand product category impacts, prioritize improvements toward more sustainable individual products, and determine valid claims/avoid greenwashing about a product.
Pampers® is P&G’s largest global brand, and significant R&D investment has been made to innovate in this product category over the past several years. Also, responding to parents’ interests, the Pampers® brand has set a specific category vision and plans on top of the overall P&G corporate-wide sustainability vision and 2020 goals [11]. P&G’s environmental sustainability goals are centered on conserving resources, use of renewable resources, and eliminating waste at the end of a product’s life.
Detailed input data recently became available from an industry-wide LCA comparing disposable baby wipes, cotton balls, and wash cloths [12]. The study compared an average European baby wipe vs. use of wash cloth and cotton wool balls. While baby wipes are favorable vs. cotton wool balls, the picture vs. wash cloth is more neutral. Wipes are favorable on water use, fossil energy and greenhouse gas emissions, while wash cloths are favorable amongst others on acidification and land use. The study also concluded that careful selection of raw material is a key environmental improvement opportunity for baby wipes. Therefore, there was a strong incentive for the R&D organization to focus substrate innovation on material reduction and to assess options on environmental sustainability beyond cost and performance.
The Pampers
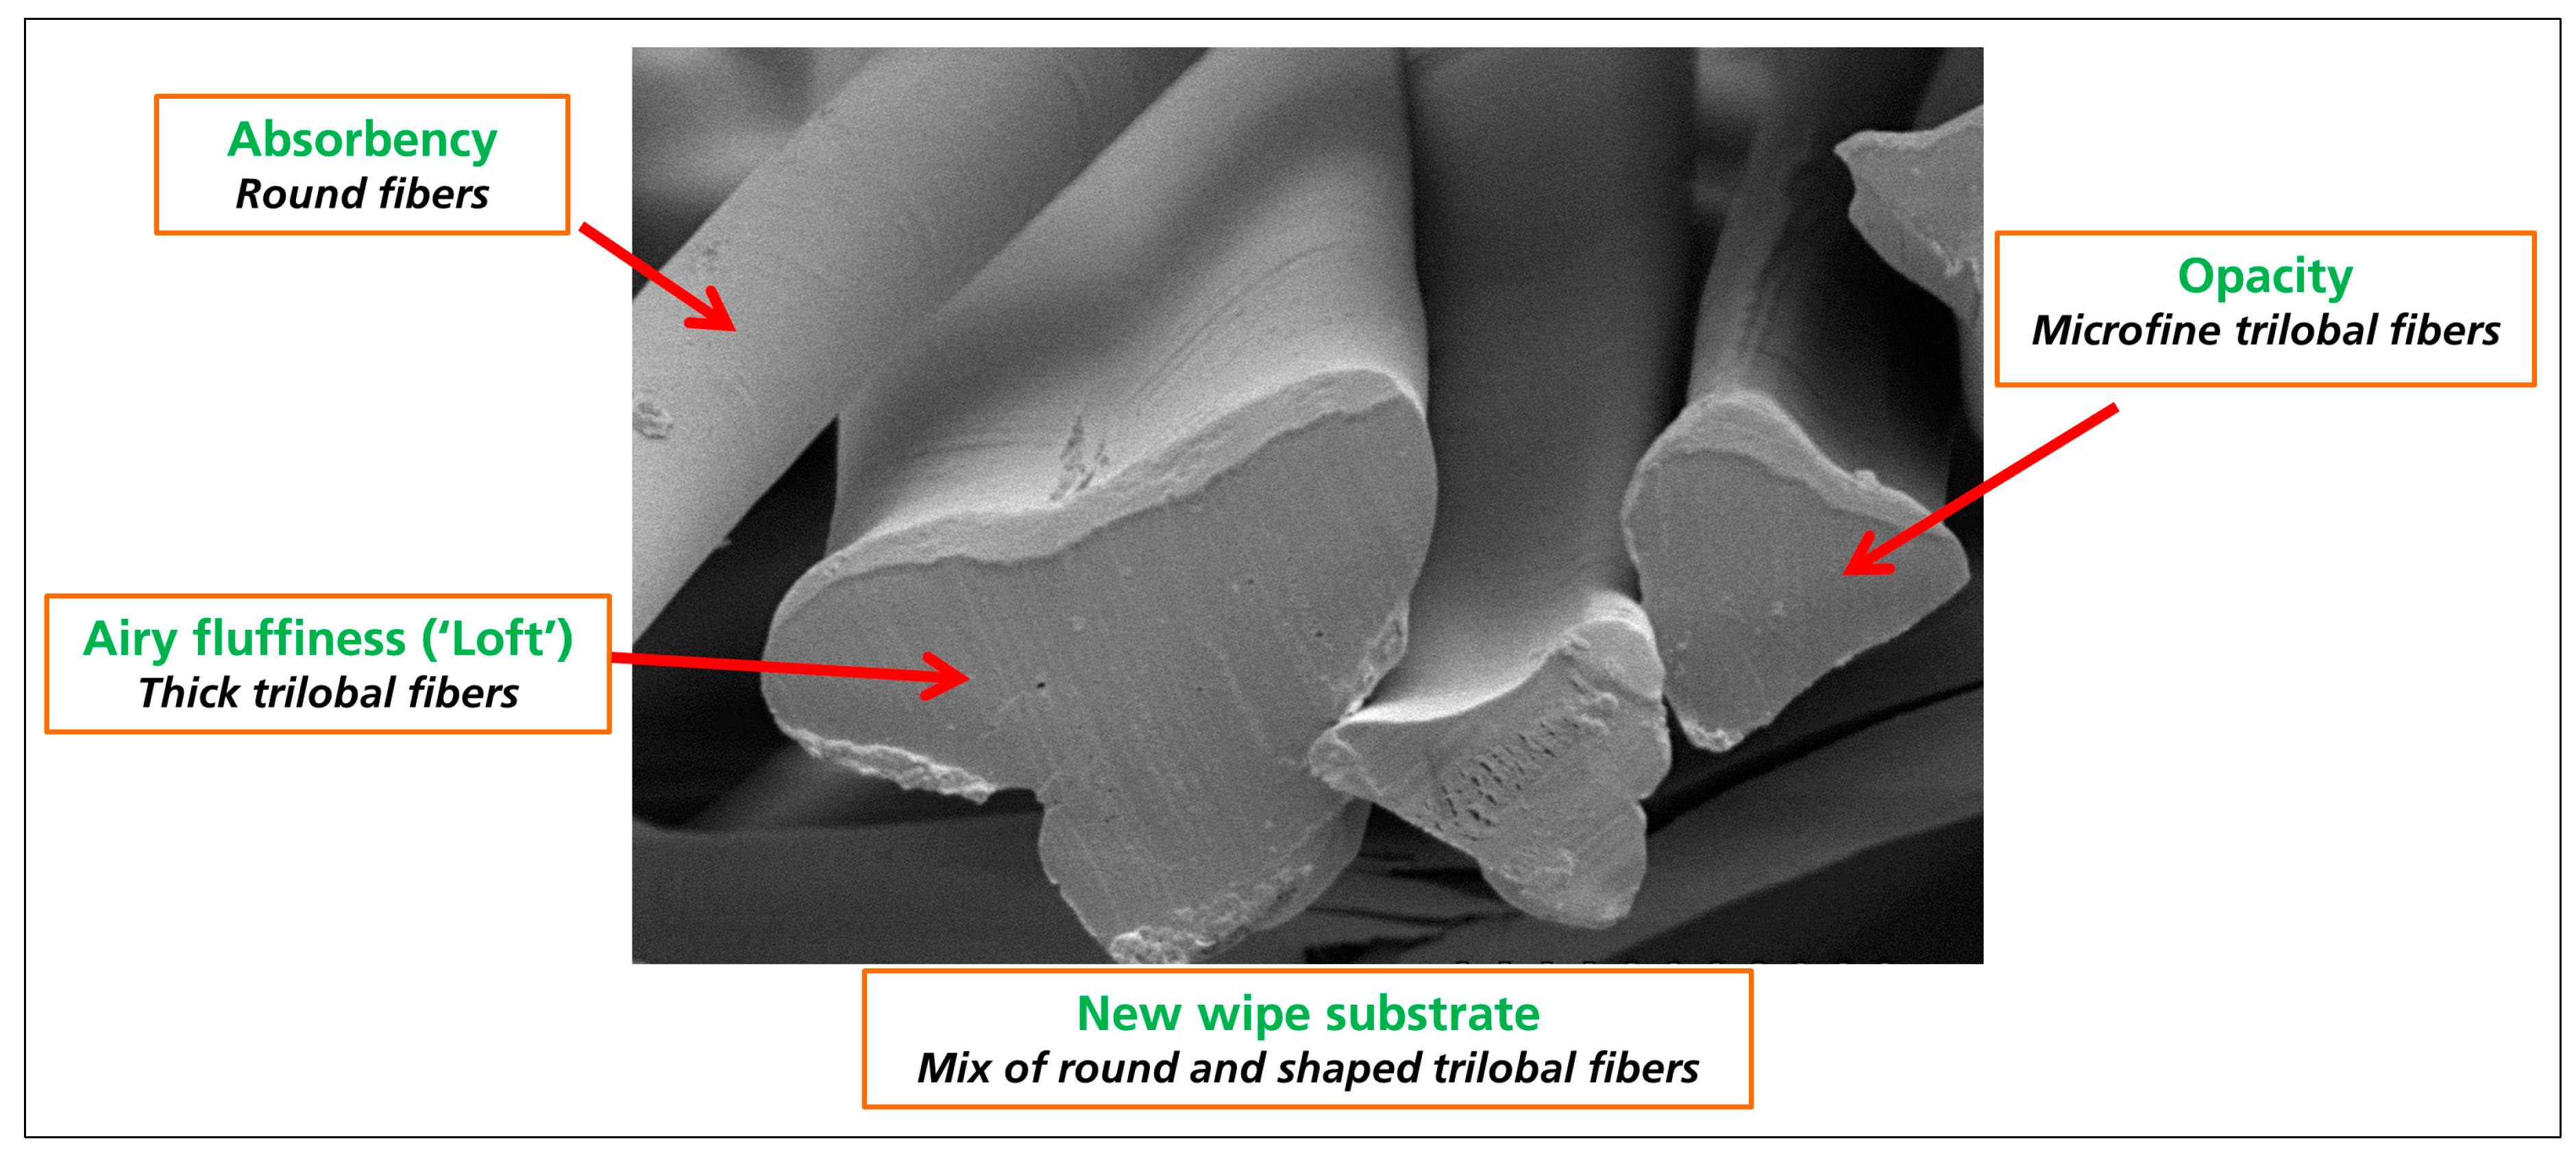
® baby wipes innovation is based on research of the product’s use, which identified that a mom’s priority during diaper changing is to ensure that her baby’s bottom is clean and that sensitive skin is not compromised. A baby wipe is basically a lotion on a nonwoven substrate. The new wipes innovation involves a new cloth-like substrate. The special mix of round and shaped trilobal fibers (see Figure 1) is a patented technology that provides more airy fluffiness (“loft”). This technology also allows our Sensitive wipes to exhibit more absorbency due to a higher amount of viscose fibers.
Figure 1. The different fibers used in the Soft Grip Texture™ technology and how they come together to increase airy fluffiness (“loft”), opacity, and absorbency of the new Pampers wipes while at the same time decreasing the sheet size per wipe.
Sustainability 06 05129 g001
The multi-size trilobal fibers increase the surface area of the substrate by more than 40% and opacity, which positively impacts the user’s trust in the product. This increased surface area allowed the wipe size to be reduced by approximately 7%, and to reduce overall material usage across the brand, while maintaining a soft and absorbent experience for cleaning babies’ skin.
All the wipe variants have maintained their softness suitable for a baby’s sensitive skin, which has been tested via sensory panel tests. Clinical studies confirmed the skin compatibility of the product. “Forearm wiping” studies simulating clean-up of baby’s bottoms with artificial bowel movement show that significantly less wiping is required with New Pampers Sensitive vs. current. Last but not least, consumer responses in use tests confirmed the significant improvement in cleaning for Pampers Sensitive.
Product designers and stewardship experts are working together to pair results of product LCA and performance studies. Company surveys of people in multiple countries indicate that mainstream consumers will not buy a product that does not adequately do the intended job, or is too expensive, whatever its environmental impact profile.
This Pampers innovation allows for a reduction in total material usage, without loss in product performance as proven in lab, clinical and consumer testing. More importantly, the performance of our Pampers Sensitive variant is significantly improved with the new innovation.
This paper describes the environmental sustainability assessment of changes made through 7 years of innovation to a major consumer good, baby wipes, in the largest markets of the U.S. and Europe. The case shows the scientific approach to measure change in what and how we do everyday tasks, with a goal to reduce resource consumption and potential environmental impacts, one step at a time.

2. Experimental Section

Baby wipes consist of a nonwoven substrate immersed with a lotion. The design of the substrate is such that it provides the necessary strength to clean babies during a diaper change, while the lotion is transferred to clean the skin. The lotion consists primarily of water. The product’s design allows consumers to use the product without the need for any other material or appliance during use. After use, the product is disposed with the normal household waste. Pampers® baby wipes in Western Europe (WE) and the United States (U.S.) are available in two variants: Mainline and Sensitive. While the function of both variants is the same, the Sensitive variant does not contain perfume.
The LCA includes all stages in the wipe product’s life cycle, i.e., the production of the wipe’s raw materials (substrate and lotion), the production of packaging raw materials, their conversion into a baby wipe and all packaging, distribution from the P&G plant to the distribution center, and the end of life of both wipe and its packaging after use. The functional unit is 1000 wipes. The scope of the study covers the use of Pampers® baby wipes in WE and the U.S., comparing versions sold during 2007 and 2013. The LCA methodology follows the ISO 14040/44 Guidelines for Life Cycle Assessment.
Table 1 presents key input data for the LCAs of the baby wipes. Supplier specific life cycle inventory data were used for the viscose and lyocell substrates. For the WE LCA, generic data from PlasticsEurope available in Ecoinvent v2.2 [13] are used for the production of polypropylene (PP) granulates, whilst generic PP resin data from NREL (National Renewable Energy Laboratory (U.S.)) [14] are used for the U.S. WE and U.S. supplier specific data were used for the conversion of PP into a nonwoven. A single data set was available for both time periods in the study. As a result, changes of raw material production processes over time are not included. All raw materials in the lotion above 0.3% are included.
Table 1. Key input data for life cycle assessments (LCAs) of Mainline and Sensitive variants of Pampers baby wipes in WE and the U.S. Weights are rounded to two digits.
Key LCA input dataUnitWestern EuropeNorth America
MainlineSensitiveMainlineSensitive
20072013200720132007201320072013
Baby wipe specifications
Dry wipe weightg/wipe1.51.2 (−22%)1.81.6 (−11%)1.81.3 (−25%)1.91.6 (−12%)
Substrate composition PP/viscosePP/viscosePP/lyocellPP/viscosePP/viscosePP/lyocellPP/viscosePP/lyocell
Wet wipe weightg/wipe6.16.4 (+5%)7.38.5 (+16%)7.87.5 (−5%)8.39.2(+12%)
Wipe manufacturing Euskirchen (Germany) for 2007 and 2010Dover, DE (USA) for fiscal year 2010–2011
Plant location and data
Packaging 1 72 ct refill64 ct refill63 ct refill56 ct refill72 ct tub72 ct tub64 ct tub64 ct tub
Pack material 2/wipeg/wipe0.700.70 (-)0.710.81 (+14%)3.22.6 (−18%)3.63.0 (−18%)
Distribution km811 (road)1843 (road)
Distance
End of life EUROSTAT 2007EUROSTAT 2011US EPA 2007US EPA 2011
Cardboard recycling 3%78.483.573.691
Plastics recycling 3%2834.32.4 (PP), 12.4 (PE)8.3 (PP), 15.7 (PE)
Incineration%32.037.918.617.9
Landfill%68.062.181.482.1
1 ct = count, i.e., the number of wipes per pack; 2 Includes primary and transport packaging; 3 For packaging materials.
Packaging is quite different between the two regions. Wipes can be purchased in plastic tubs, which can be later refilled with refill packs. In WE, the majority of sales consists of refill packs, whereas tubs are more important than refill packs in the U.S. Therefore, WE packaging is modeled using only refill packs, whereas U.S. packaging is modeled by using an 80:20 split between tubs and refills. Secondly, the number of wipes per pack (count size) changed in WE between 2007 and 2013. Primary data were used for the pack specifications (including primary and transport packaging) for both time periods, for each wipe variant (Mainline and Sensitive) and each region (WE and the U.S.).
P&G plant specific data were used for conversion of raw materials into a baby wipe. Only one dataset is available for the wipe conversion in the U.S., whereas the production data for WE are available for both 2007 and 2010. Distribution from the P&G manufacturing plant to the retailers’ distribution centers is specific for each region, taking into account the location of the most important customers’ distribution centers. The distance data were taken from a baby diapers LCA model [15] and primary mode of transport is via truck.
Only the use of baby wipes to clean babies while changing diapers is under scope, since this is the core function of the product. No further products, appliances, or materials are included in the LCA.
After use, consumers dispose of used wipes with their normal municipal solid waste. Used baby wipes are not recycled. Data on municipal solid waste management are from Eurostat and U.S. EPA. Statistics are for 2007 (WE [16] and the U.S. [17]) and 2011 (WE [16]) and the U.S. [18]). For the post-consumer packaging, region specific recycling data are used. The avoided burden method is used to model recycling [19]. Ecoinvent v2.2 [13] and the NREL [14] database are used as the background database for the WE and the U.S. model respectively. The LCA model was developed in Simapro v7.3. Table 1 shows the key input data for the Mainline and Sensitive variants in both regions.
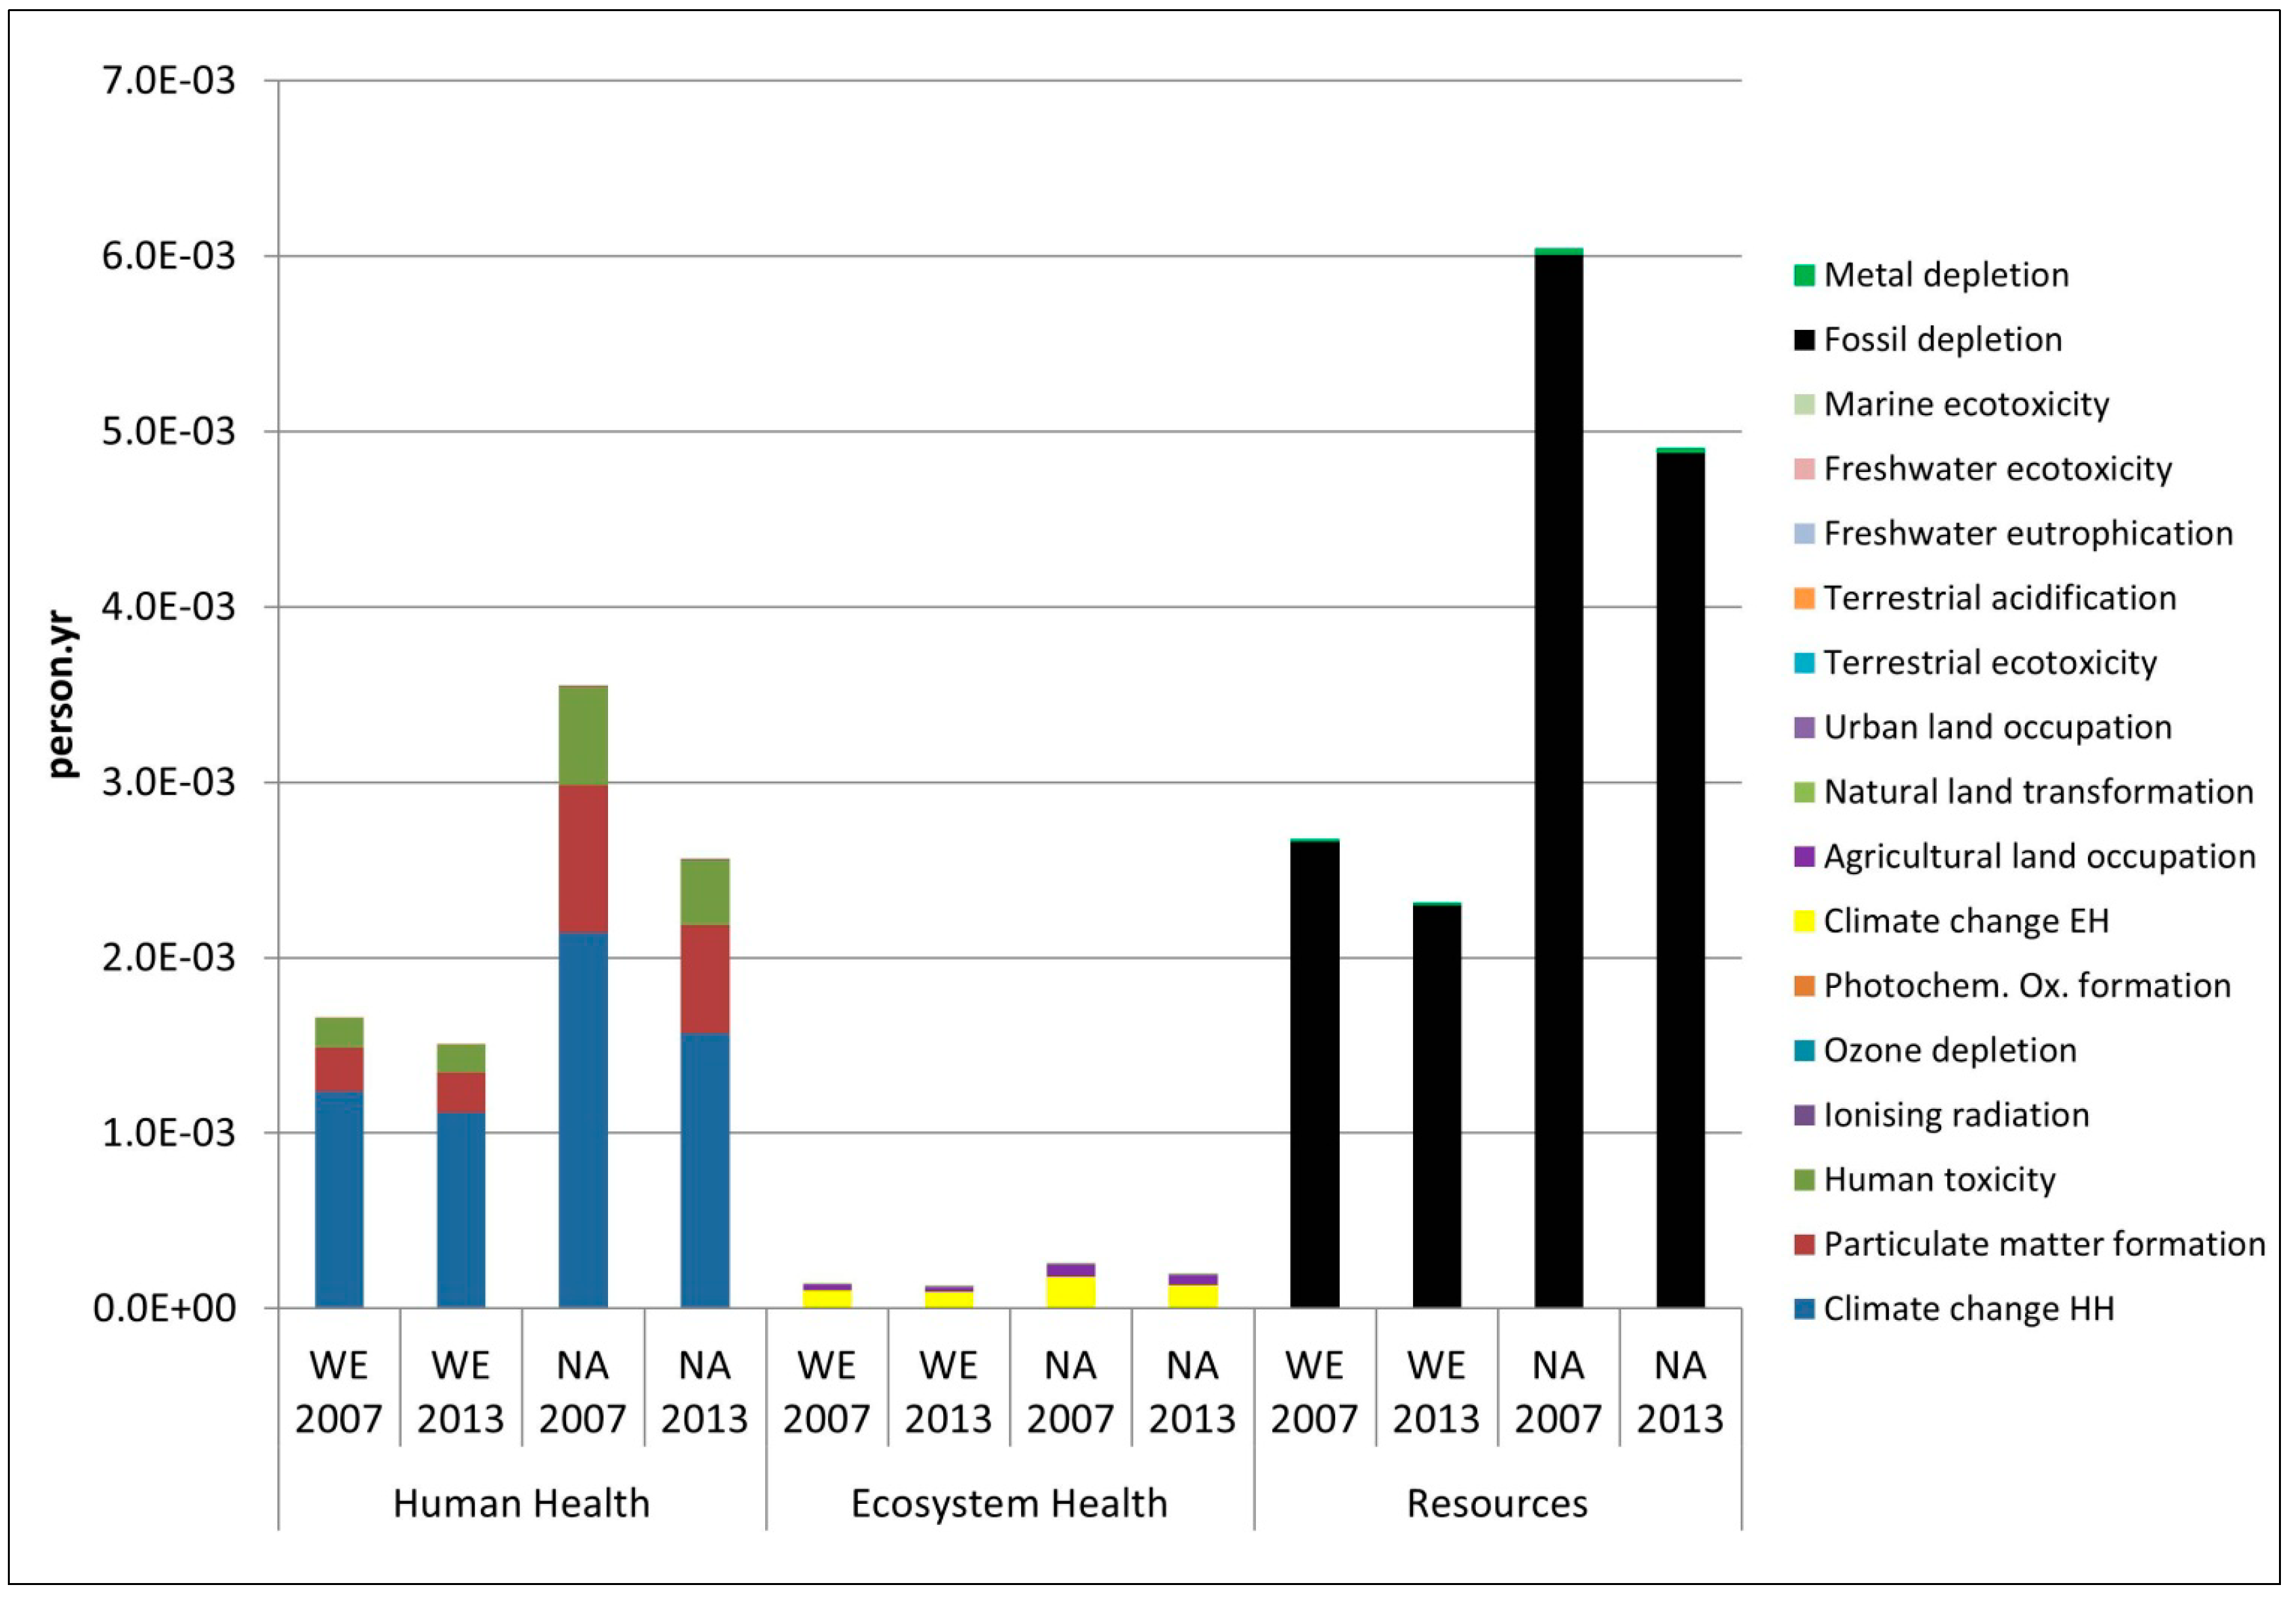
Impact assessment was performed using ReCiPe v1.07. The most relevant indicators were selected after benchmarking the baby wipe indicator results vs. the same indicators from the global annual emissions (year 2000), consistent with Van Hoof et al. [20]. This leads to a consistent indicator selection for the WE and U.S. baby wipe, which is an important benefit to develop global innovation strategies. Single score results are not calculated for reasons explained in [
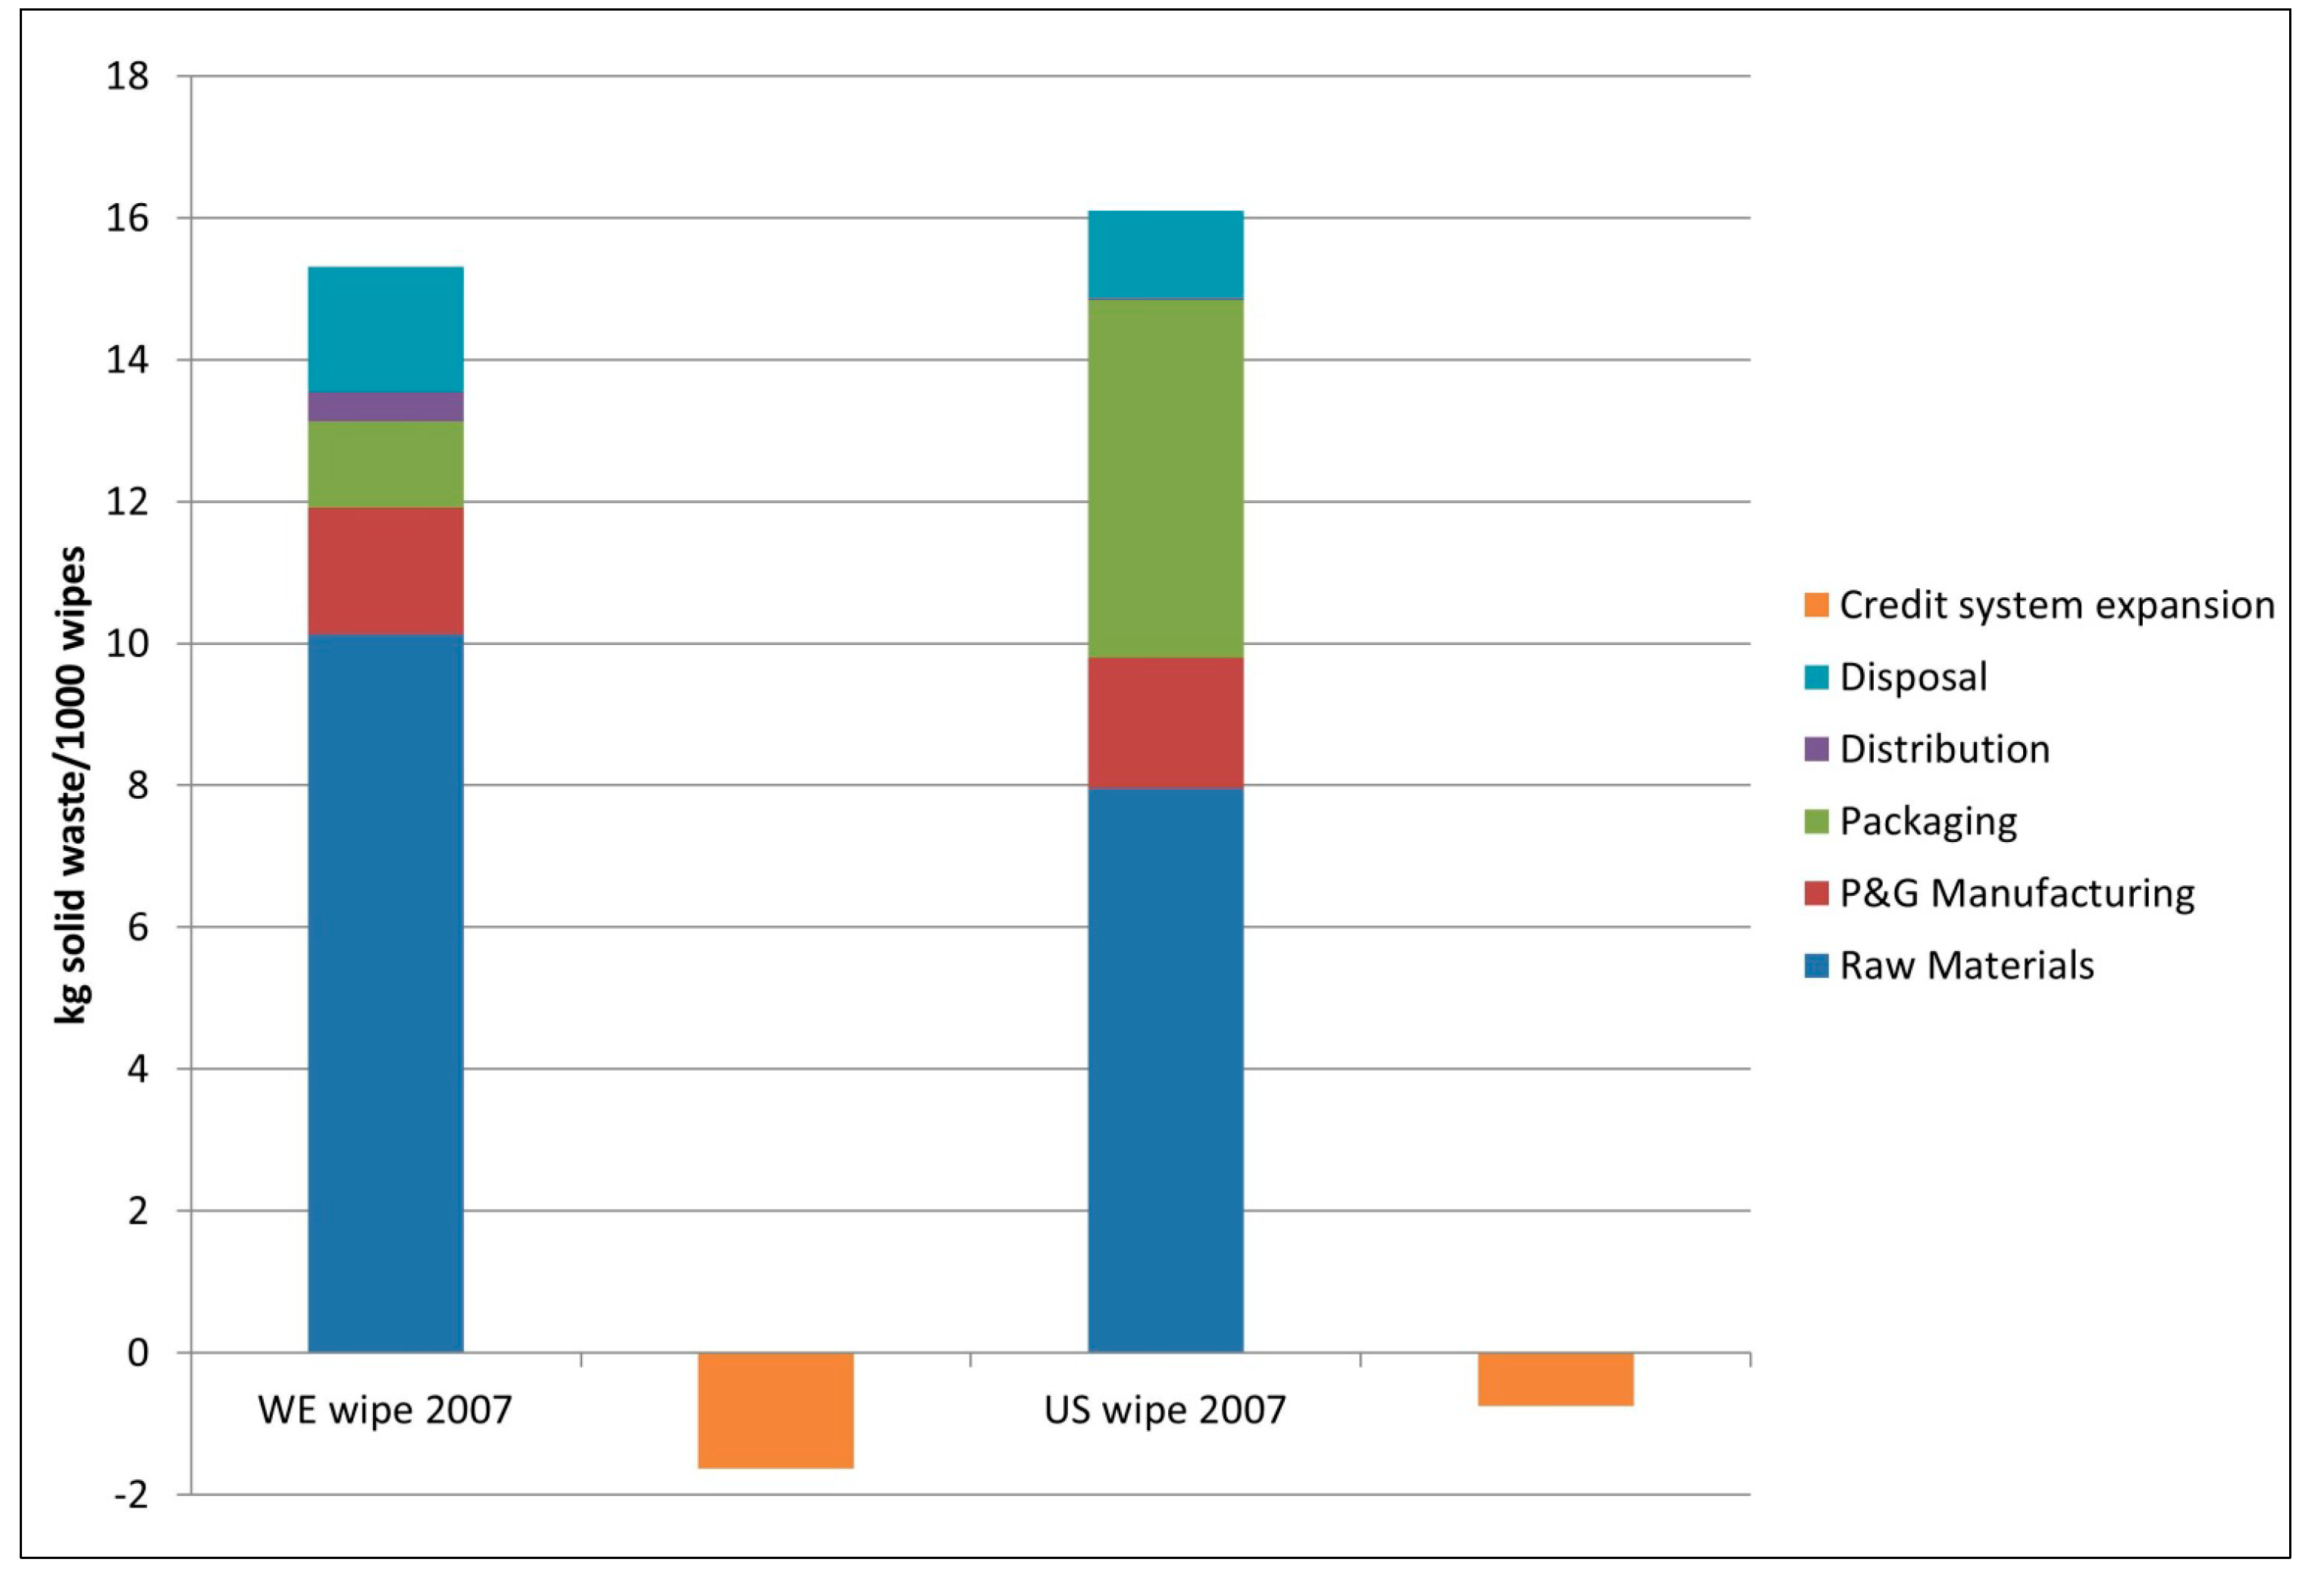
20]. The entire list of impact category results is available in the supplementary information (Tables S1 and S2). Primary energy and solid waste were added to the list of environmental indicators. Primary energy is a key driver for most indicators. Solid waste is an intermediate flow and can be very different in nature (e.g., household waste vs. medical waste) with associated different potential impact. It is added because consumers have an interest in the solid waste generated from disposable products.
LCA results for each of the two wipe variants are weighted into a single metric for each region, using the regional sales volumes for Mainline and Sensitive wipes. For reasons of business competition, these weighting factors are confidential and thus not listed in Table 1.
LCA results for 2013 are considered significantly different when they are 10% above or below the reference value for the 2007 product system.

3. Results and Discussion

3.1. Environmental Assessment

Figure 2 shows the five largest environmental impact indicators within each area of protection (human health, ecosystem health and resources) for baby wipes: Global Warming human health, Particulate Matter and Human Toxicity are the main human health drivers, Global Warming ecosystem health and Agricultural Land Occupation are the main ecosystem health drivers and Fossil Fuel Depletion is the main driver in resource use. Fossil fuel use for materials in the wipe product and package (fossil fuel depletion), or for combustion processes (global warming, particulate matter), is the most important process behind the environmental indicators. Human toxicity is primarily driven by metal emissions (barium and manganese to water). These are associated with extraction of fuels (for barium) and disposal processes (manganese). Carbon disulfide to air is the only non-metal contributing emission, associated with viscose production. Note that workers are not exposed to this emission, but it is an overall production emission that is closely monitored from a human and environmental safety perspective.
Figure 2. Most relevant ReCiPe indicators for 1000 WE and US baby wipes. Individual scores are normalized vs. global population emissions in 2000 following the hierarchist perspective.
Sustainability 06 05129 g002
Agricultural land occupation is also important, exclusively driven by forestry operations. Wood is a raw material used in the wipe raw materials, viscose and lyocell, as well as in the corrugated cardboard cases for shipping tubs and refills to the retailers. Although land occupation is identified as a potential risk mitigation area, LCA does not fully describe sustainable forestry management practices. P&G has sustainable wood pulp procurement practices not accounted for in this modeling method. For tissue and absorbent hygiene products, these involve understanding the sources of the pulp fiber, transparency in sourcing, ensuring that sustainable forest management practices are used by suppliers, and working with stakeholders and independent third-party verification systems (e.g., Programme for the Endorsement of Forest Certification schemes (PEFC), Sustainable Forestry Initiative (SFI), Forest Stewardship Council (FSC)) [21].
Figure 3 and Figure 4 show that the production of the dry wipe raw materials is the most significant life cycle stage affecting the LCA results in both WE and the U.S. For the 2007 wipes, the production stage of wipe raw materials contributes between 40% and 82% (WE) and between 22% and 51% (the U.S.) of all estimated environmental impact indicators. The WE contribution analysis is consistent with LCA results from a European average baby wipe study in 2007 published by EDANA (European Disposables and Nonwovens Association) [12]. In the U.S., packaging is also important, with contributions between 33% and 78% for the 2007 baby wipes. Packaging contributions include both the production of pack raw materials, their conversion into final packing materials, and its post-consumer use treatment.
Further investigation into the contribution analyses identifies that the substrate, not lotion, drives the potential impacts identified through the LCA. The lotion is the primary component of a baby wipe in weight terms (see Table 1), making up between 75 and 82% of the total wipe weight. However, given the lotion is primarily made from water, its contribution in all relevant indicator results is not larger than 5%. Therefore, the making of the nonwoven substrate and its upstream production steps are the major drivers for the LCA results.
Figure 3. Contribution of each life cycle stage to relevant environmental indicators for 2007 and 2013 Pampers baby wipes in Western Europe.
Sustainability 06 05129 g003
Figure 4. Contribution of each life cycle stage to relevant environmental indicators for 2007 and 2013 Pampers baby wipes in the U.S.
Sustainability 06 05129 g004
Packaging has an important contribution in all relevant environmental indicators for U.S. baby wipes, because the plastic tubs are the primary pack system in the U.S. (80% of sales), resulting in 3.6 to 5.1 times more pack materials per wipe compared to WE. Tubs are made from polypropylene, which is technically recyclable, but current recycling practice is limited in the regions under study (Table 1).
Figure 3 and Figure 4 show that the End of Life stage (i.e., black colored portion of the bars) has a small contribution to global warming (WE and the U.S.) and overall solid waste (the U.S.), yet these indicators are of significant interest to some consumers and stakeholders. The apparent small and sometimes negative contribution from the End of Life stage deserves a more detailed analysis as the contribution is actually the net result between emissions from post-consumer treatment of used wipes, and credits from avoided emissions from recovered energy in incinerators. When the avoided emissions are larger than the post-consumer treatment emissions, the contribution of the end of life stage shows a negative value in Figure 3 and Figure 4. This is further explained for solid waste in Figure 5. This shows the 2007 contribution to overall solid waste in WE and the U.S. with the end of life stage contribution disaggregated into solid waste from the disposed wipes and the avoided solid waste from the energy credits in incinerators. Waste from wipe raw materials and packaging production contribute most to the overall solid waste generated. Post- consumer used wipe disposal accounts for about 11% of the total. In WE, the credits are equal to the solid waste from the post-consumer used wipe. In the U.S., due to higher landfill practice, credits are smaller than the solid waste from the used wipe. This explains the difference in net solid waste contribution in Figure 3 and Figure 4. It should be acknowledged that the size of the credits also depends on the choice of the replaced energy. The present study assumed average grid electricity for both regions.
Figure 5. Contribution of life cycle stage to overall solid waste generation for 2007 wipes in WE and the U.S.
Sustainability 06 05129 g005
Figure 6 and Figure 7 show that the 2013 wipes in each region have a smaller environmental footprint than the 2007 products. Through the innovation in new substrate technology, fewer resources are needed and the potential environmental impacts are reduced. For WE, significant improvements between 10% and 14% are observed on all relevant indicators, except on solid waste (−8%), global warming (−7%) and human toxicity (−4%). In the U.S., significant improvements are observed on all relevant indicators ranging between 15% and 36%.
Figure 6. Comparison of most relevant environmental indicators from LCA of Pampers baby wipes in Western Europe between 2007 (100% reference) and 2013.
Sustainability 06 05129 g006
Figure 7. Comparison of most relevant environmental indicators from LCA of Pampers baby wipes in the U.S. between 2007 (100% reference) and 2013.
Sustainability 06 05129 g007
Improvements in the U.S. are larger than WE for two reasons. First, the dry wipe weight reduction over the selected time period is larger (19% vs. 14% in the U.S. vs. WE, Table 1). Second, in the U.S. packaging weight is reduced both for Mainline and Sensitive wipes (−18%, Table 1). As shown in Figure 4, packaging has a significant contribution in all indictors, thereby further increasing improvements from dry wipe weight reductions.

3.2. General Findings

The present case study illustrates the importance of several driving factors behind environmental innovations. Some of these have been reported in the literature as determinants behind eco-innovation [22]. First, the P&G sustainability framework defines clear focus areas enabling R&D to develop environmental sustainability action areas. Conservation of resources is one of them. Traditional R&D focus areas such as material and energy innovation are enlarged with sustainability assessments, which in this and many other cases leads to congruent innovation plans.
Second, with a growing environmental interest from retailers and consumers, it becomes more important to also clearly communicate on innovations leading to environmental benefits. Recent voluntary initiatives by the industry [23] or the EU Commission [24] all aim to avoid greenwashing or the proliferation of green labels. LCA is a good tool to quantify these benefits. Therefore, a second driver is to provide the marketing organization with factual information on environmentally meaningful innovations. Relevant and accurate communication on environmental benefits is necessary to build long lasting brand equities.
Third, the raw material production has a high contribution in the baby wipe LCA results. This shows that sustainable innovation requires collaboration with suppliers. Technology improvements on making fiber and substrates created the necessary performance improvements. The LCA results enabled R&D to engage with suppliers beyond traditional R&D focus areas such as performance and cost. Suppliers with a strong sustainability interest took this as a business opportunity to strengthen their relationships with P&G.

4. Conclusions

The consumer goods industry is large and growing globally, whilst human consumption of earth’s resources is already estimated to be unsustainable. One solution to the predicament is innovation, changing what and how we do everyday tasks. One way to assess those changes scientifically is through life cycle assessments (LCA). Companies, governments, and universities are conducting LCAs to understand potential product impacts of products, processes, or services on the environment, to prioritize areas of innovation to create more sustainable products, or to determine valid claims about what the organizations or affiliated groups are doing.
This case study shows the results of product innovation by comparing the 2007 and 2013 baby wipe formulations and manufacturing processes in Europe and the U.S. The innovation is a patented mix of fibers that provides more airy fluffiness and absorbency that improves the wipe’s performance. The new substrate technology requires fewer resources, and the LCA shows it has quantifiable reduced potential environmental impacts.
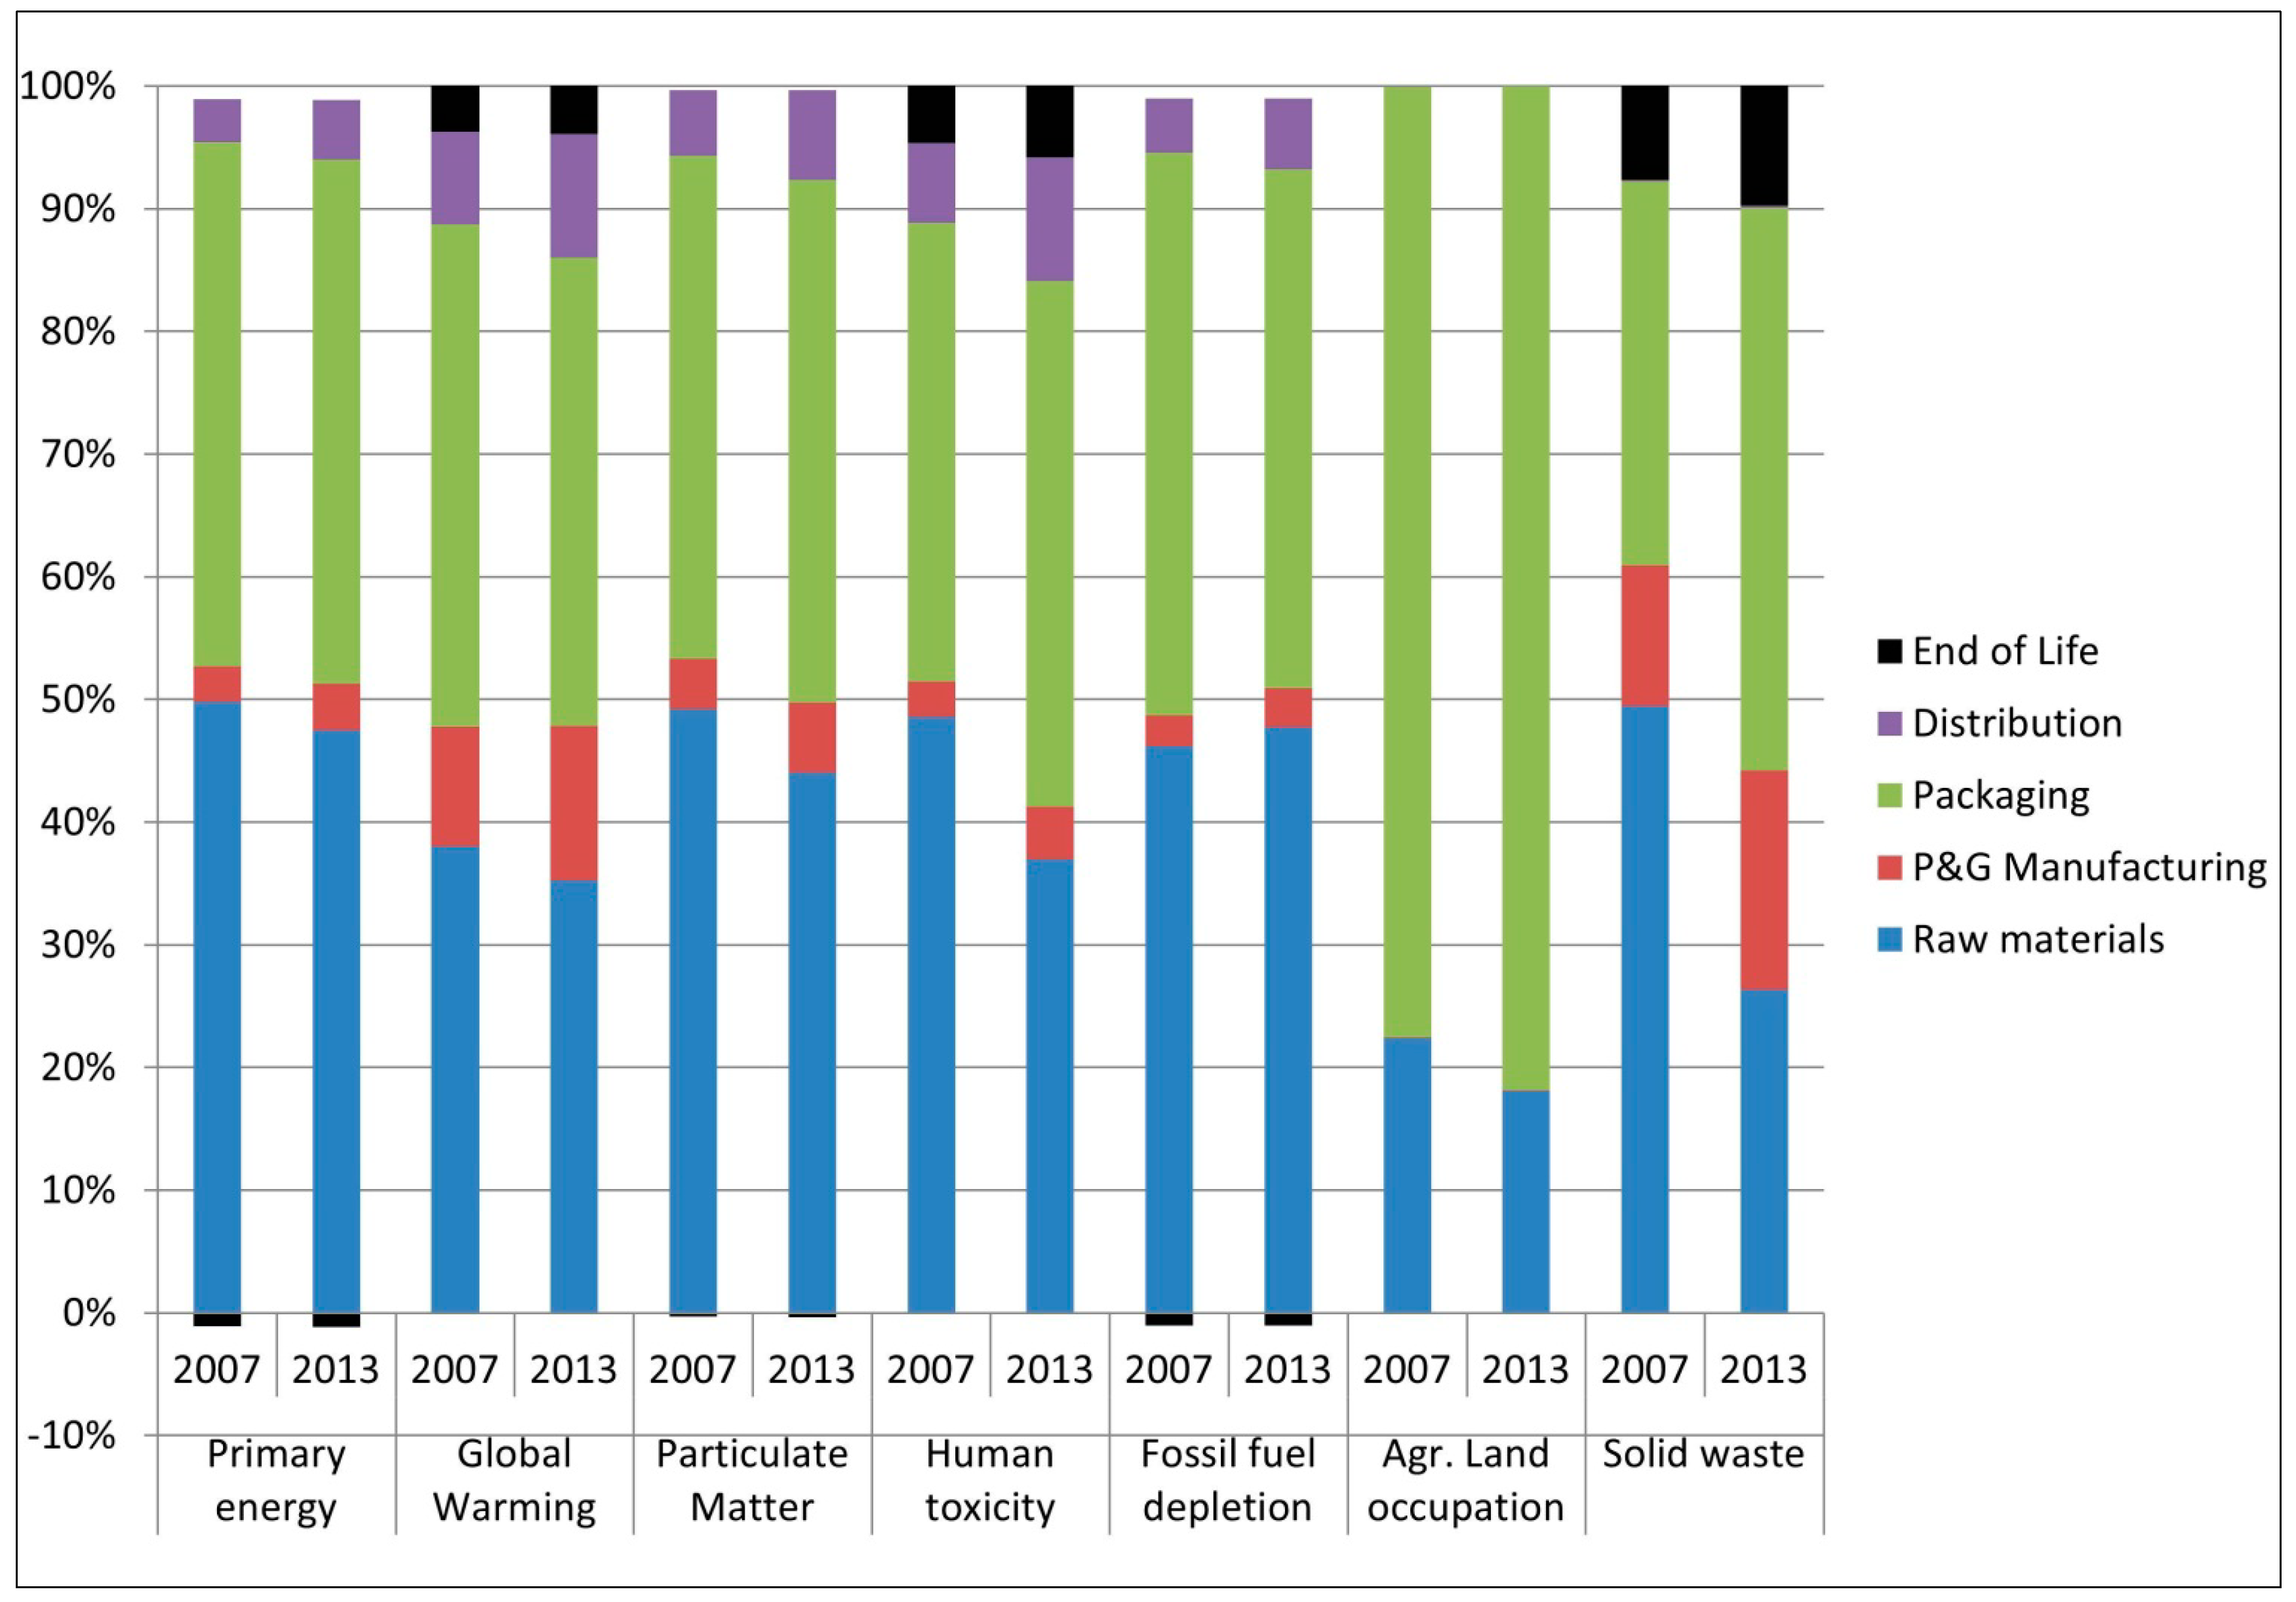
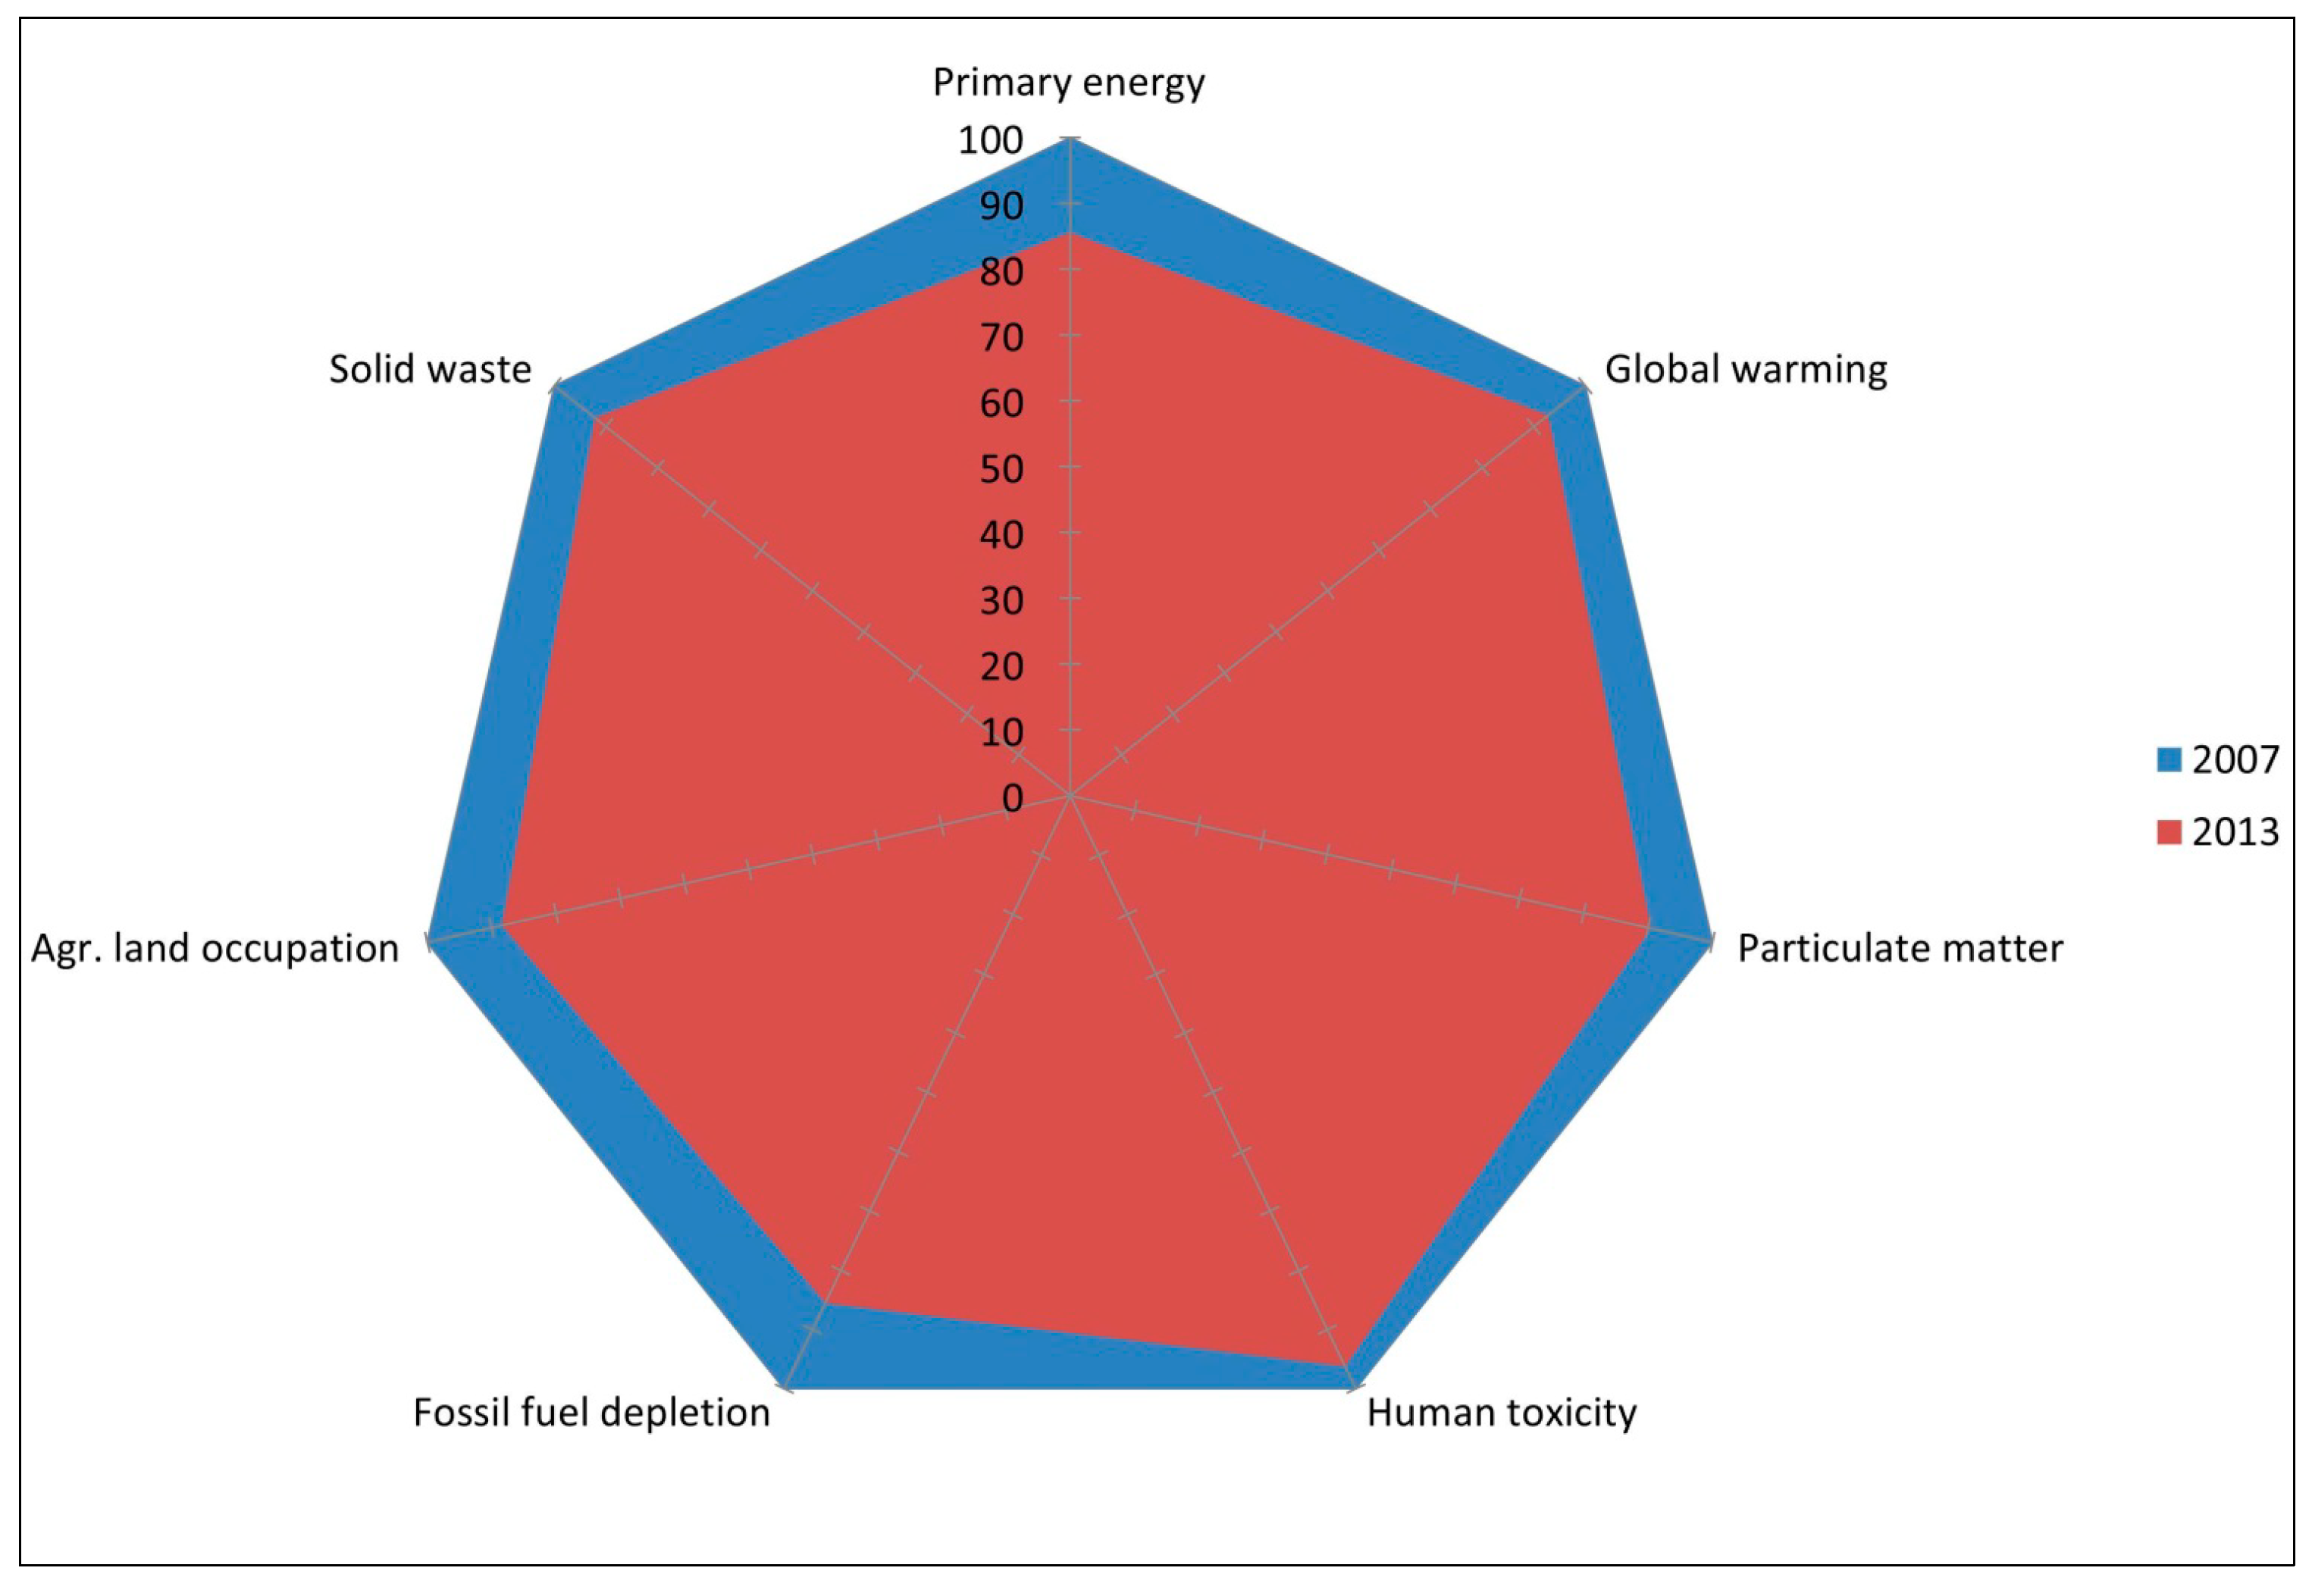
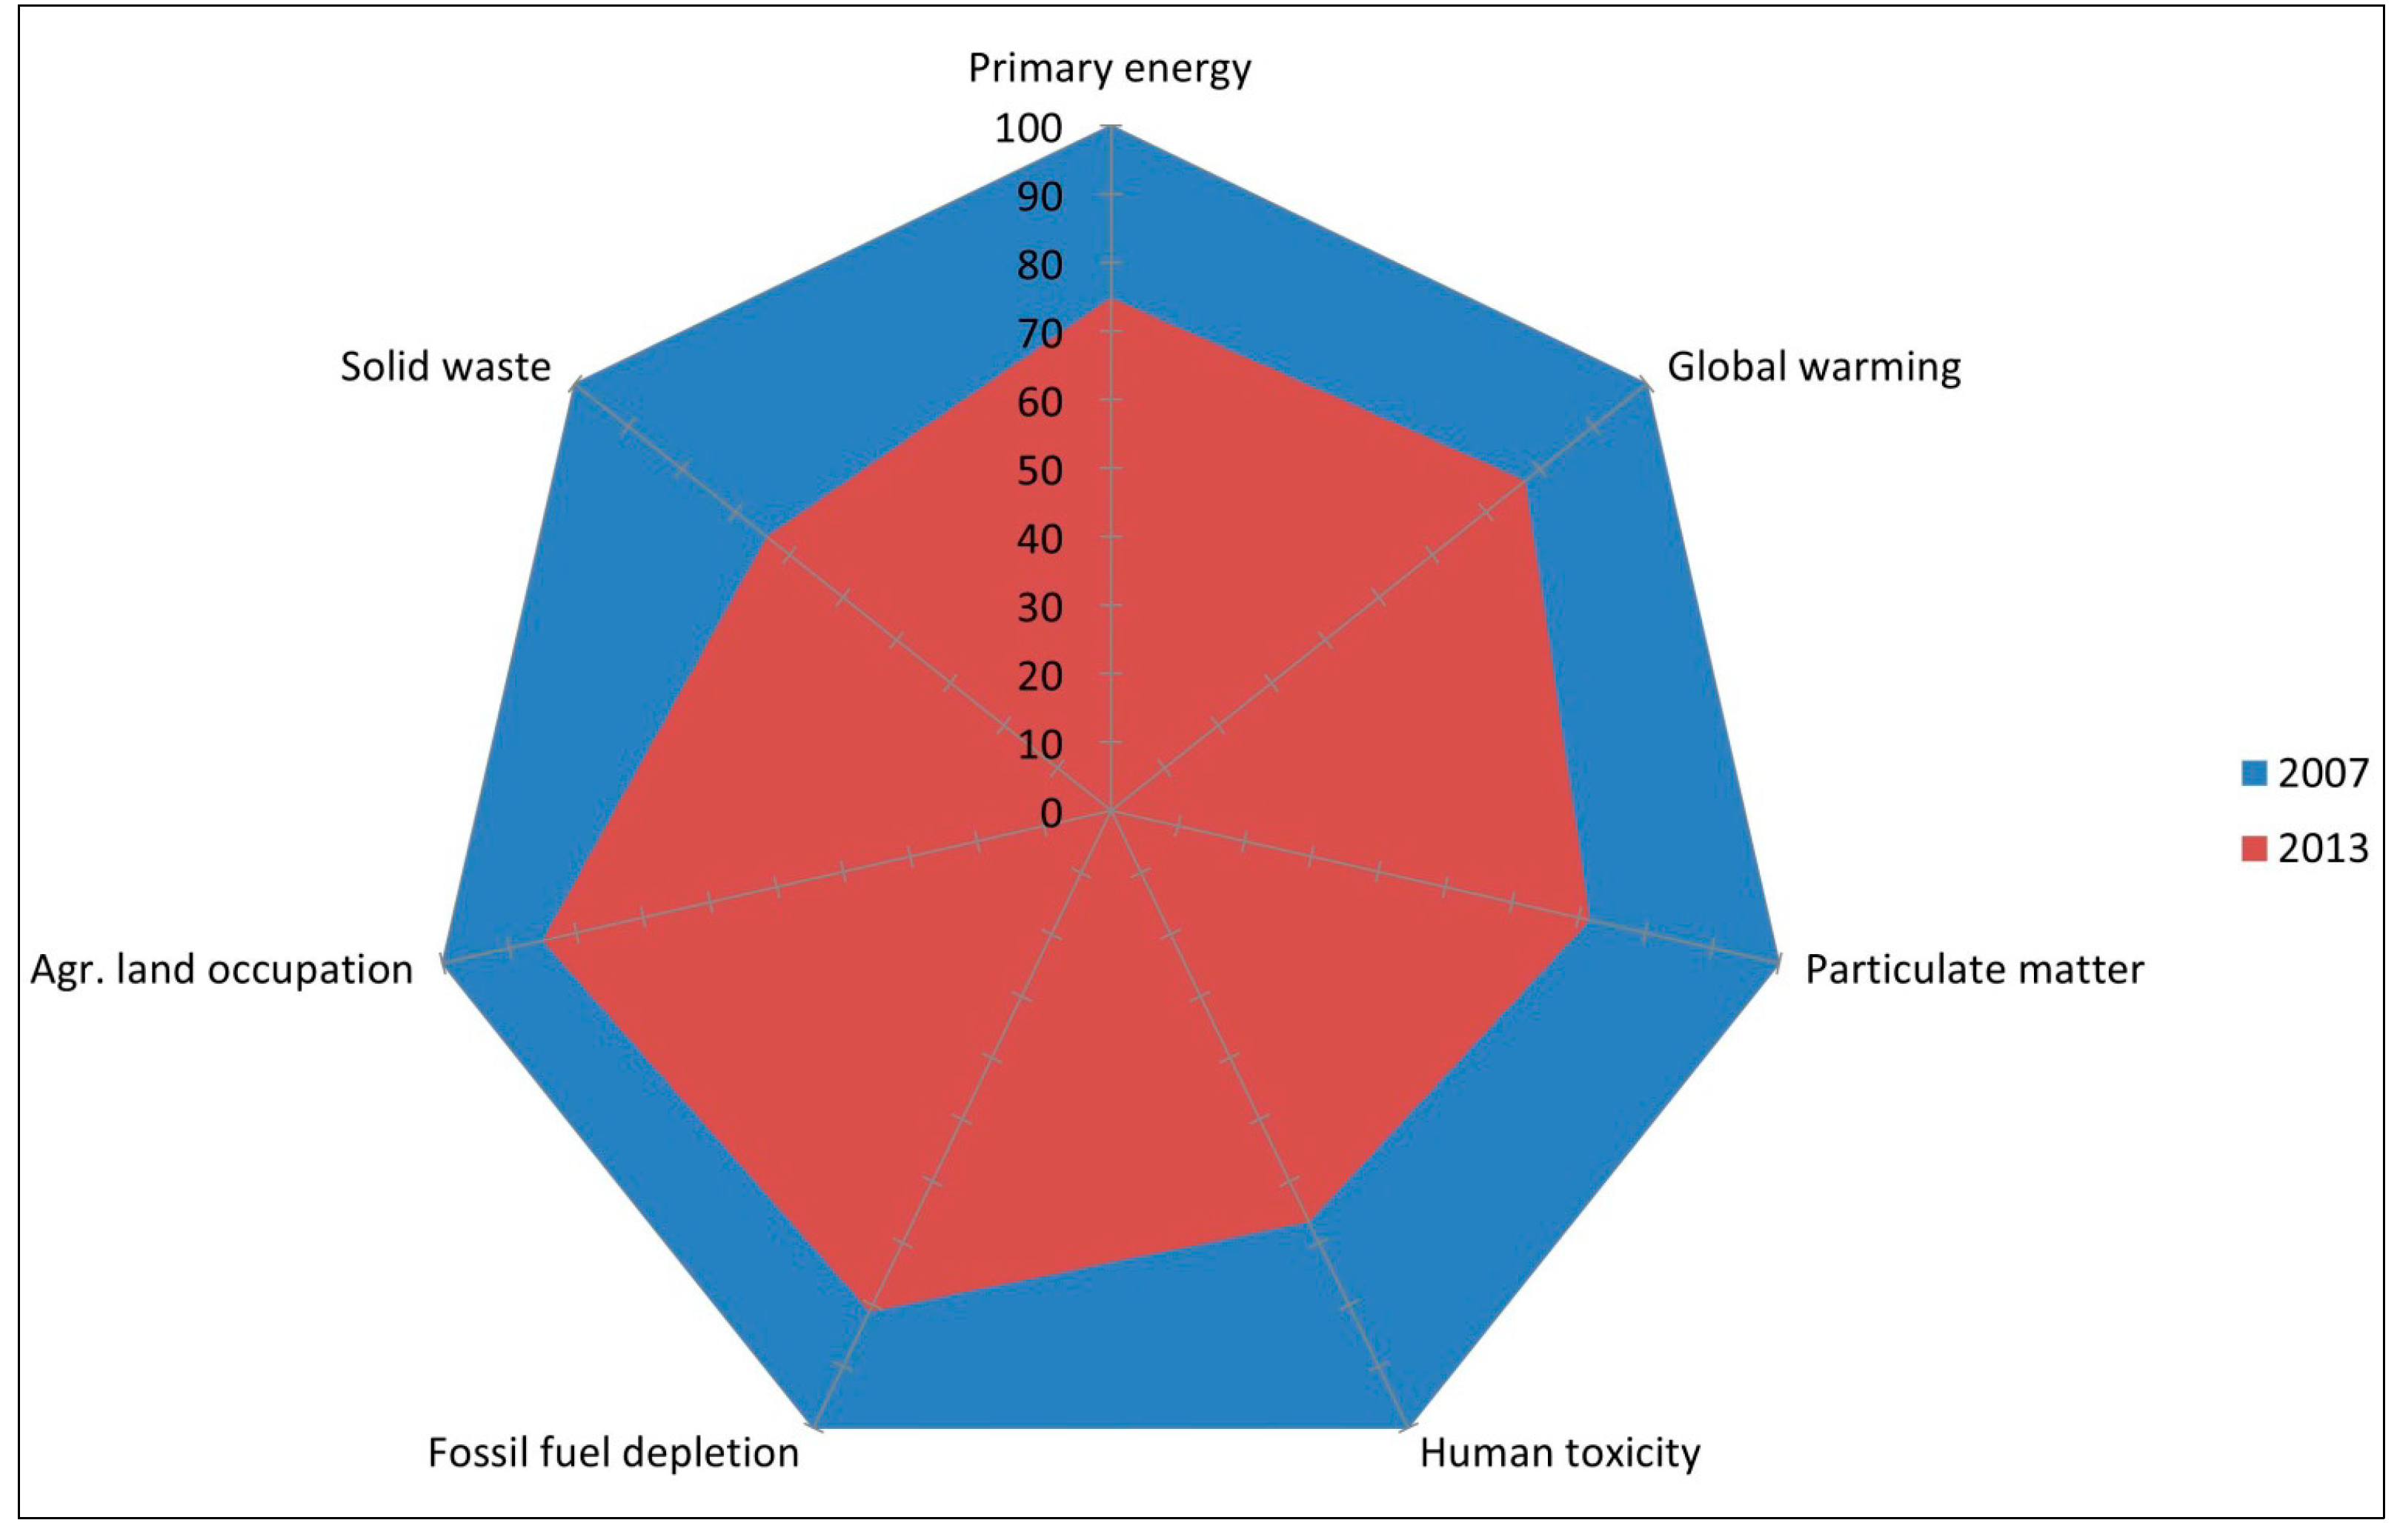
The standard methodology follows the ISO 14040/44 Guidelines for LCA, and incorporates commercially available inventory data from Ecoinvent as well as other data from P&G and its suppliers. Results are reported for the impact indicators with high relevance for the product category: dry weight, primary energy, global warming, particulates, agricultural land occupation (forestry), fossil fuel depletion, and solid waste generation. Generally, raw material supply chains for the product and packaging contribute most (up to 82%) to the calculated environmental impact indicators. The relevant environmental indicators of the 2013 baby wipe have 4%–14% and 15%–36% smaller values than the 2007 version for WE and the U.S. respectively. Overall, improvements are larger for the U.S., driven by higher dry wipe weight reduction and packaging weight reduction.
Three important driving forces enabled the environmental benefits behind the innovation assessed in this study. The organizational focus on sustainability, with specific environmental action areas and goals creates an environment in which R&D includes sustainability as a design parameter, in addition to other traditional design parameters such as cost and performance. The increased interest in sustainability from retailers and consumers stimulates the need to provide accurate and relevant environmental information on baby wipes, which the marketing organization sees as building or strengthening brand equity. Finally, suppliers make a significant contribution to a wipe’s overall environmental profile, which creates business opportunities to collaborate on new materials and processes.

Acknowledgments

The authors thank Klaus Geppert and Karin Moosbauer from Lenzing AG for their kind support in collecting LCI data information on their raw materials. We also thank the EDANA association for coordinating the collection of confidential data from several material suppliers. This study was funded by the Procter & Gamble Company.

Supplementary Materials

Supplementary materials can be accessed at: https://0-www-mdpi-com.brum.beds.ac.uk/2071-1050/6/8/5129/s1.

Author Contributions

Van Hoof ran the Life Cycle Assessment study and all authors contributed in the writing of the article.

Conflicts of Interest

The authors are employed by the manufacturer of the product used in the case study, allowing access to confidential industry data for use in the study, and presenting a possible conflict of interest. We follow ISO guidelines for this study, make every attempt to ensure scientific rigor and accurate interpretation of reported results, and publish non-confidential information in peer-reviewed journals.

References and Notes

  1. U.S. Dept of Commerce. The Consumer Goods Industry in the United States. Available online: http://selectusa.commerce.gov/industry-snapshots/consumer-goods-industry-united-states (accessed on 8 January 2014).
  2. Kharas, H. The Emerging Middle Class in Developing Countries. Available online: http://siteresources.worldbank.org/EXTABCDE/Resources/7455676-1292528456380/7626791-1303141641402/7878676-1306699356046/Parallel-Sesssion-6-Homi-Kharas.pdf (accessed on 19 February 2014).
  3. World Wildlife Fund; Zoological Society of London; Global Footprint Network; European Space Agency. The Living Planet Report 2012: Biodiversity, biocapacity, and better choices. ISBN 978-2-940443-37-6. Available online: http://wwf.panda.org/about_our_earth/all_publications/living_planet_report/2012_lpr/ (accessed on 19 February 2014).
  4. Catalog of companies using LCA in their decision making process. Available online: http://www.life-cycle.org/?page_id=11 (accessed on 19 February 2014).
  5. International Standards Organization (ISO). Environmental Management—life Cycle Assessment: Principles and Framework; ISO 14040:2006; ISO: Geneva, Switzerland, 2006. [Google Scholar]
  6. International Standards Organization (ISO). Environmental Management—Life Cycle Assessment: Requirements and Guidelines; ISO 14044:2006; ISO: Geneva, Switzerland, 2006. [Google Scholar]
  7. Fava, J.; Denison, R.; Jones, B.; Curran, M.; Vigon, B.; Selke, S.; Barnum, J. A Technical Framework for Life Cycle Assessment. In Proceedings of a workshop in Smuggles Notch, VT by the Society of Environmental Toxicology & Chemistry, Pensacola, FL, USA, 18–24 August 1990.
  8. De Smet, B.; White, P.R.; Owens, J.W. Integrating life-cycle assessment within an overall framework for environmental management. In Environmental Life-Cycle Assessment; Curran, M.A., Ed.; McGraw-Hill Companies: New York, NY, USA, 1996; pp. 1–15. [Google Scholar]
  9. Sabaliunas, D.; Pittinger, C.; Kessel, C.; Masscheleyn, P. Residential Energy Use and Potential Conservation Through Reduced Laundering Temperatures in the United States and Canada. Integr. Environ. Ass. Manag. 2006, 2, 142–153. [Google Scholar]
  10. McDougall, F.; White, P.; Franke, M.; Hindle, P. Integrated Solid Waste Management: A Life Cycle Inventory; Blackwell Science: Oxford, UK, 2001. [Google Scholar]
  11. Pampers sustainability. Available online: http://www.pg.com/en_US/sustainability/index.shtml (accessed on 19 February 2014).
  12. EDANA: LCA of baby wet wipes—Executive Summary. Available online: http://www.sustainability.edana.org/content/default.asp?PageID=540&DocID=4482 (accessed on 8 January 2014).
  13. Ecoinvent 2.2. Available online: http://www.ecoinvent.org/database (accessed on 8 January 2014).
  14. U.S. Life Cycle Inventory Database. Available online: http://www.lcacommons.gov/nrel/search (accessed on 8 January 2014).
  15. Weisbrod, A.V.; van Hoof, G. LCA-measured environmental improvements in Pampers® diapers. Int. J. Life Cycle Ass. 2012, 17, 145–153. [Google Scholar] [CrossRef]
  16. Eurostat database. Available online: http://epp.eurostat.ec.europa.eu/portal/page/portal/statistics/search_database (accessed on 8 January 2014).
  17. Municipal solid waste in the United States: 2007 facts and figures. Available online: http://www.epa.gov/osw/nonhaz/municipal/pubs/msw07-rpt.pdf (accessed on 8 January 2013).
  18. Municipal solid waste in the United States: 2011 facts and figures. Available online: http://www.epa.gov/osw/nonhaz/municipal/pubs/MSWcharacterization_fnl_060713_2_rpt.pdf (accessed on 8 January 2013).
  19. Frischknecht, R. LCI modeling approaches applied on recycling of materials in view of environmental sustainability, risk perception and eco-efficiency. Int. J. Life Cycle Ass. 2009, 15, 666–671. [Google Scholar] [CrossRef]
  20. Van Hoof, G.; Vieira, M.; Gausman, M.; Weisbrod, A. Indicator selection in life cycle assessment to enable decision making: issues and solutions. Int. J. Life Cycle Ass. 2013, 18, 1568–1580. [Google Scholar] [CrossRef]
  21. P&G Forestry Products policy. Available online: http://www.pg.com/en_US/sustainability/policies_practices/woodpulp.shtml (accessed on 19 February 2014).
  22. Horbach, J.; Rammer, C.; Rennings, K. Determinants of eco-innovations by type of environmental impact—The role of regulatory push/pull. Ecol. Econ. 2012, 78, 112–122. [Google Scholar] [CrossRef]
  23. Dooley, K.; Carlson, J.; Schöner, G.; Subramanian, V.; Childs, C. The Sustainability Consortium: A Stakeholder Approach to Improve Consumer Product Sustainability. Life Cycle Su. Manag. 2011. [Google Scholar] [CrossRef]
  24. Pelletier, N.; Allacker, K.; Pant, R.; Manfredi, S. The European Commission Organisation Environmental Footprint method: Comparison with other methods, and rationales for key requirements. Int. J. Life Cycle Ass. 2014, 19, 387–404. [Google Scholar] [CrossRef] [Green Version]

