1. Introduction
Since the 1987 report by the World Commission on Environment and Development, known as the Brundtland Commission Report, the term sustainable development has become a commonly used phrase. This definition envisages that the overall aim of our social life on Earth should be to promote “development that meets the needs of the present without compromising the ability of future generations to meet their own needs”. To operationalize this principle, each generation should bequeath to its successor at least as large a productive base as it inherited from its predecessor, interpreted as the social wealth necessary to maintain or increase intergenerational well-being. However, this definition does not take into account that what constitutes human well-being changes over time, and therefore, what is considered appropriate for the current generation may not be suitable for future generations. This problem is the root of the worldwide confrontation on climate change.
To simplify the issue, consider that the advanced economies’ current generations interpret the needs for the future well-being primarily in terms of CO2 emission reduction. On the contrary, however, the developing economies think primarily in terms of their economic development, a goal that may conflict with the objectives of worldwide emissions reduction.
In this respect, we propose worldwide agreement on a definition of sustainable development that takes into account how new technologies can relax the existing trade-offs between increasing economic activity and worsening the environment that we bequeath to the next generations.
In this context, we define sustainability as the increased investment in new resources aimed at developing the three main pillars of the energy and environmental policy: the development of renewable energy sources (RES) -CO2 sequestration (CCS) included-, an increase in energy efficiency and promotion of energy savings behaviors, the understanding that this may lead to a number of sustainable trajectories.
Obviously, the higher the level of investment in RES, energy efficiency and energy savings, the more sustainable the future is likely to be. These investments are crucial also because the climate change threat has increased the need to promote electricity generation from RES, and accordingly, it is possible to reduce fossil fuel consumption and nuclear dependence and to address the rapidly rising global demand for domestic electricity.
Given this definition, some aspects must be clarified, as our aim is more circumscribed than the definition implies. That said this paper focuses only on RES use in the production of green electricity (GE). Furthermore, we have not taken into account the negative externalities due to RES use. For example, we have not considered potential concerns regarding the main components of solar modules that are harmful and toxic. These negative externalities are both pollution and recycling problems. Simply stated, “What happens at the end of their lifecycle?” With respect to wind farms, we have not considered their land use, their noticeable impact on birds, or their impact on the local communities with respect to noise and landscape. Furthermore, with respect to hydropower and biomass, we have not taken into account water consumption, gas emissions produced by biomass, land use, impact on wildlife or lifecycle global warming emissions. Rather, we focus our attention on the relationship between RES and electricity production.
It is well-known that, to make investing in RES more attractive, the prices for RES must approach those of alternative fossil fuels to achieve the so-called price parity concept. To achieve price parity, there are two alternatives. The first is the wait-and-see approach, i.e., we wait until fossil fuel prices rise gradually due to growing scarcities. This option, however, entails significant environmental degradation while we wait. The second is a pro-active approach, which recognizes the need to internalize fully the cost of externalities, of which there are two types: negative externalities, which are associated with the use of finite fossil fuels, and positive externalities, which are spurred by the development of RES. Regardless, there is the need to fill the gap between private and social costs, a task that can be accomplished through taxes or through subsidies and/or mandatory standards.
However, this second alternative hides an unavoidable generational conflict. That is, who is going to bear the relevant part of the cost of a policy that yields intergenerational benefits? A theoretical plan to implement rising fossil fuel prices by including externalities is politically unpopular for the current generation. The current generation is reluctant to adopt rational and appropriate actions that would establish a global infrastructure investment program giving the appropriate market signals to the private sector and leveling the playing field for alternative energy technologies. In practice, free-riding against the future generation is a temptation for the average citizen who votes for such vast policy programs. Moreover, we know that there is the menace of distorting administrative procedures, opaque bureaucracies, and stranded costs that continue to plague the new sustainable development process.
In this paper, we focus on the financial viability and economic sustainability implications of the second alternative. More precisely, we study the impact of government programs for RES development, explicitly assuming that consumers consider environmental issues. Thus, we assess what is required in terms of investment, i.e., what is the sacrifice of the current generation, to achieve some overall strategy. We also take into account that, from our perspective, consumers are partially willing to bear the cost of such programs. Obviously, the more likely the consumers are to increase the premiums that they are willing to pay for RES development, the less the need for public financing of such programs over time. In other words, the degree of acceptability of such programs is a measure of the degree of potential internalization of the issue of sustainable growth. We propose a synthetic definition, which we label “World Sustainable Scenario” (WSS). In the WSS, we shall be able to measure empirically the concept of sustainability in terms of intergenerational equity, as there must be agreement among different generations regarding the amount of resources that must be devoted to sustainable growth. Accordingly, we will be able to attach an empirical measure to the concept of sustainability. We shift the attention from the pure notion of sustainability in physical terms (e.g., caring capacity, ecological footprints) to a broader concept that includes the value judgment of society as a whole. That is to say, it is the broader concept of sustainable growth for which the world population is willing to pay.
In a democratic society, this issue must be explicitly considered, even though this may not be the optimal solution in absolute terms if public opinion is biased, uncultured, or otherwise misinformed. It is precisely for this reason that we investigate, based on the available empirical evidence, the economic cost dimension of the decision-making process that would lead the world to continuous growth and prosperity.
The paper is organized as follows. In
Section 2, we briefly discuss the method used to define the WSS, which is the target identified by consensus at the international level and where consensus is reached by international organizations, governments and expert groups. In
Section 3, we discuss, in detail, the WSS, namely, the amount of resources requiring investment to achieve the target. In
Section 4, we discuss the extent to which households are willing to contribute to this new investment. In
Section 5, we draw conclusions about the likelihood and plausibility of realizing the new policy strategies. Finally, we identify a quantitative target for those policy measures that can be financed by democratic consensus.
2. A Brief Discussion of Institutional Context
The WSS must involve a comprehensive strategy that incorporates producers, markets and institutions to shift energy production toward RES and that convinces consumers to adopt lifestyles with low environmental impacts [
1] (These aspects are also analysed at municipal level for Italy [
2].). Though both aspects are crucial, they are also controversial. Herein, we focus mainly on electricity production, recognizing that the definition of a new and sustainable energy scenario poses some questions [
3].
What is the desirable mix of fuels, according to the WSS, and what is the proportion of RES? What is the energy saving envisaged for the WSS? Who will be responsible for making the WSS a reality? Who will be paying for it, including the investment costs for energy-saving efforts and the reduced profits of existing producers? What is the required increase in technical efficiency? What is the intensity of technological progress? What will it cost?
A discussion of these questions must focus on the needs and behaviors of several different parts of society. We simplify our analysis, however, by considering, from among the several types of customers in the electricity market who differ in terms of usage and types of consumption, only low-voltage use households.
There exists a lively debate about consumer habits and lifestyles that focuses on a universal definition of human energy needs necessary to sustain an adequate living standard. While economic theory considers basic human needs to be finite, reaching a satiation level beyond which diminishing marginal returns applies [
4], human needs appear to be elastic, expandable, and dependent on social and cultural factors. The question is, is it possible to reshape consumption in developed societies to reduce the environmental impact and maintain a high standard of living while simultaneously increasing the standards of living in developing countries? We believe that this tradeoff can be solved only in a world with economic growth because of the needed investments. In other words, to sustain economic growth without endangering the environment requires a strong effort toward new technologies and investments. This effort implies a search for what we label new resources, which is a mix of RES, energy efficiency, new technology and energy savings [
3].
However, today’s market price for RES is higher than that for fossil fuels because it does not include the full shadow benefit necessary to achieve better environmental impact and long-term sustainability. Therefore, to fill the gap between private (market) and social costs of RES, according to WSS, there is need for institutional instruments, such as taxes, subsidies and legal standards.
We propose to measure the cost of the WSS, with the help of a thought experiment, in real terms in today’s economic system, e.g., in terms of the hourly wage. Assume that a unitary quantity of energy from fossil fuel costs today one hour of work and the same quantity from new resources costs 1.2 h. There are two possibilities. First, in the absence of fossil fuels, all society would have to work 20% more to have the same energy content availability. This means more labor input to achieve a better fuel mix. Second, if there is some new technology capable of achieving 20% additional energy efficiency, or if there is a willingness to change our lifestyles to gain 20% more energy savings in consumption, then we will achieve the same better fuel mix with an exogenous shift in the production function. In either case, the overall macroeconomic equilibrium can be reached if there is a sufficient quantity of new resource available at that new relative price in terms of labor input.
This leads to the crucial question. Is there a sufficient amount of new resources available? Are there enough water dams, windy coastal ridges, sunny flatlands, new laboratories, new ways to work at home and thereby reduce energy required to drive to offices, etc.? In other words: “Are there enough resources to supply the energy requirements for 9 billion people or more on earth in 2050?”
The usual economic theory answer is, in general, yes, at the appropriate price. This, in turn, poses the issue of the equity of such a solution given the degree of flexibility and adaptation of the markets. Thus, this is a social issue because the market price may be practically unbearable. That is, the relative price may be near infinite or so high as to imply a comeback of the Dickensian-style exploitation of the work force of up to 18 h a day. In the worst case, a substantial change in the relative price of energy could set in motion a new Malthusian effect if only a part of the planet is granted the privilege to appropriate the scarce energy resources available while others are deprived and, therefore, forced into the declining Malthusian trap.
The previous reasoning encompasses a moral dimension as, indeed, no human being should be deprived of access to energy under decent conditions. However, the reality is that “some 1.6 billion people have no access to electricity today. Eighty percent of these people live in rural areas of the developing world, mainly in South Asia and sub-Saharan Africa where rapid urban migration and population growth will occur over the next several decades” [
5]. Therefore, in the future, we must calculate how to provide energy to the rest of the world and how much energy do we provide.
Since the Industrial Revolution, new technology has been the answer to famine and underdevelopment. In addition, it should continue to be the answer for the future of our world. Therefore, we must find a reasonable level of cost increase to develop new resources. In addition, we know that part of the cost is embedded in the administrative procedures. When these are opaque, market signals are distorted or unintelligible in the markets. In principle, it would be ideal to start from the beginning, as set forth in the following. “The most appropriate response would be to set up a global infrastructure investment program that gives the appropriate market signals to the private sector and levels the playing field for alternative energy technologies” [
6]. In practice, we know that all types of stranded costs and hidden costs will continue to plague the new sustainable development process.
3. The Investment Required to Support the WSS
To make our policy scenario operational, we recognize that there are different instruments to be employed that involve taxes and subsidies implemented by governments [
3]. The support mechanisms required to implement the use of new energy resources and make them competitive on the energy market can be price-oriented or quantity-oriented. Both demand side and supply-push policies are needed to stimulate the diffusion of RES, the development of the technology and the adoption of new lifestyles. In a perfect environment with full information and no constraints on the government tax policy, the strategy to switch to new energy resource use consists of setting a Pigouvian tax (“A Pigouvian fee is a fee paid by the polluter per unit of pollution exactly equal to the aggregate marginal damage caused by the pollution when evaluated at the efficient level of pollution. The fee is generally paid to the government” [
7].) levied on the use of fossil fuels. Tax revenue can be used to support investments in new resources. Notwithstanding the practical difficulties to implement an optimal tax [
8], such public intervention is a way to modify the relative price between fossil fuels and new resources and is thus a way to control and modify the long path of shifting from one to the other.
Among price-oriented strategies, there are financial supports given through investment subsidies, soft loans, tax credits and regulated feed-in tariffs or premiums. In particular, the feed-in tariff is a price-driven incentive in which the supplier or grid operators are obliged to buy electricity produced from RES at a higher price compared to the price they pay for energy from fossil fuels. This higher price is paid to compensate the higher costs of the green sector (The criticisms made to the feed-in tariff scheme underline that a system of fixed price level is not compatible with a free market [
9].).
Taking RES policies as an example, we observe that the majority of European countries have adopted feed-in tariffs and that Germany was the precursor in adopting this strategy (The German Renewable Energy Source Act of 2000 establishes that the feed-in tariffs are not dependent on the market price of energy but are defined in the law and that the feed-in tariff is different for wind, biomass, photovoltaic, etc. Moreover, the feed-in tariffs are decreased over the years to take into account the technological learning curves.). Given its success in Europe, by mid-2006, several US states had introduced feed-in tariff legislation that coexisted with other incentive mechanisms.
Among quantity-oriented strategies, there are target levels for RES defined by governments, such as the renewable portfolio standard (RPS) (The basic premise behind RPS is that electricity suppliers (or electricity generators) are required to produce a minimum amount of green energy in their portfolio of electricity resources. The European tradable certificate system is similar to the US renewable portfolio standard policies. In the tradable certificate system, firms that produce energy are obliged to supply or purchase a certain percentage of electricity from renewable resources. Then, at the date of settlement, they must submit the required number of certificates to demonstrate compliance. A benefit of the tradable certificate system is represented by its cost-saving advantage, which is the satisfaction of the “equimarginal” principle: when firms trade pollution permits, they are aware of the opportunity cost of emitting through the permit price [
7].), which is the main tool used for green energy in the US and in the tender system (Tender calls for defined amounts of capacity are made at regular intervals, and the contract is given to the provider that offers the lowest price at a fixed price per kWh for the period of the contract.). There also exist voluntary approaches, a strategy that is based on the consumers’ willingness to pay (WTP) premium rates for RES through donation projects and shareholder programs.
In the design of our WSS, we have proposed three main pillars to construct the policy mix necessary to develop the new resources:
- -
RES and CO2 sequestration;
- -
investments in new technology and energy efficiency;
- -
energy savings behaviors or new behaviors towards new lifestyles.
Broadly speaking, the first pillar of the mix of new resources in the WSS includes hydro, wind, biomass, tidal, geothermal and solar energies, among others. RES gain in importance in worldwide energy production even if the simultaneous growth in electricity consumption partially offsets the growth of the production of energy from the RES. The renewable share of the world electricity generation in 2012 is 20.8%, and it is expected to increase by 25% in 2040 (The projections are made taking into account both high and low economic growth cases compared to the reference case. World oil prices are assumed to rise in real terms through 2040. Approximately 80% of the RES increase is in hydroelectric and wind power. On the other hand, CO
2 sequestration is expected to contribute approximately 17% of the total CO
2 emission reductions required in 2050 [
10]). The implementation of RES that have fewer environmental impacts than fossil fuels can be a way to reduce the costs of environmental regulations and reduce dependency on fossil fuels. The drawback of RES is given by its production cost (
Table 1).
Table 1.
Estimates of cost of electricity generation (USD × MWh).
Table 1.
Estimates of cost of electricity generation (USD × MWh).
| | Wind | Solar Thermal | Solar PV | Biomass | Geothermal | Wave | Natural Gas | Coal | Coal with CCS | Nuclear |
|---|
| 2011 | 63 | 181 | 270 | 75 | 83 | 105 | 47 | 71 | 121 | 76 |
| 2013 | 56 | 139 | 211 | 70 | 78 | 103 | 39 | 85 | 96 | 74 |
There are at least two reasons to expect energy prices of RES to decline (The overall costs of electricity generated from the solar PV industry is expected to drop to 0.1–0.3 USD × kWh by around 2030. The global wind power average generation costs are predicted to range between 0.027 and 0.03 USD × kWh [
11]. The cost of energy from a modern coal-fired power station with cleaner fossil fuel combustion technologies will be 0.013 USD × kWh by 2030 [
11]. Nuclear power is a mature technology. The expected generating costs of nuclear power would be 0.02 USD × kWh by 2030, with a depreciation period of 20 years at a 10% discount rate [
12]. Projected costs of electricity generated by natural gas-fired plants are at around 0.045 by 2030 [
13].). It must be noted that the electricity production based on RES takes place in an energy market that is becoming increasingly more competitive. Moreover, there is the learning by doing effect. The estimated learning rate for a hydropower plant is 1.4%, for wind power electricity it is 18%, for wind turbines it is 8%, and for solar PV panels it is 22% [
14] (The authors summarize 26 data sets, and the measure of technological improvement is considered taking into account different countries. The estimated learning rates for hydropower plants, wind power electricity, wind turbines and solar PV panels are referred, respectively, to OECD countries, California, Denmark and US.). However, even according to the most recent projections [
15], energy from fossil fuels and nuclear power is still less expensive than energy from RES. This poses a problem of continuing competition between fossil fuels and RES with respect to consumer preference. Until there will be consumers who consider the opportunity cost of renewables too high, there will be a positive share of fossil fuels in the system. This is one of the reasons to study the WTP and the degree of acceptability of RES. The higher the share of ecological consumers and the lower the cost gap, the higher the acceptability of RES in the long term.
The second pillar in the mix of WSS typically includes investments in new technology, mainly on the supply side such, as hydrogen, carbon capture, nuclear power and new engines.
Finally, the third pillar in the mix of WSS includes changes in the demand side, which mainly concern household and individual consumption. These are, for instance, conscious behaviors such as switching off lights in empty rooms, thermostat controls, adoption of class A+ appliances, bicycling to work, home insulation,
i.e., the billions of elementary daily acts of individuals [
16]. In addition, especially in the OECD countries [
17], as households directly account for approximately one-third of the total national CO
2 emissions, it is important to make them aware of the potential of new technologies. “
… if adopted, existing efficiency measures (The role of new technology also arises if we compare the energy saved by curtailment versus the energy saved by increased efficiency; the latter reduces more carbon emission and saves more energy ([
17]
, pp. 4–5).) for households and motor vehicles can allow energy savings of almost 30% that is 11% of total U.S. consumption” [
16]. This monetary assessment is necessary to judge how realistic and plausible it is in modern society. We identify a benchmark scenario, which is the business as usual (BAU) scenario until 2035, using well-known sources. Precisely, we identify the BAU scenario with the current policies scenario of the IEA [
18]. This incorporates the current technologies implemented up to 2013, and we do not take into account the environmental policies announced for the coming years. Accordingly, this scenario can be considered a BAU scenario. Thus, the BAU scenario can represent the wait-and-see alternative, depicting a future in which energy markets evolve worldwide without government interventions.
On the contrary, the target scenario, the WSS, represents a program of new actions. We take as the target the recent [
18] program, which is the most recent version of the well-known 450 scenario,
i.e., a scenario that purports to stabilize the concentration of GHG in such a way as to achieve 450 particles per million. We compare the two scenarios (For a useful comparison among the 2010, 2011 and 2012 editions of the IEA’s World Energy Outlook reports see [
19].) to assess whether the investment requirement is sustainable and acceptable from the perspective of the household consumer.
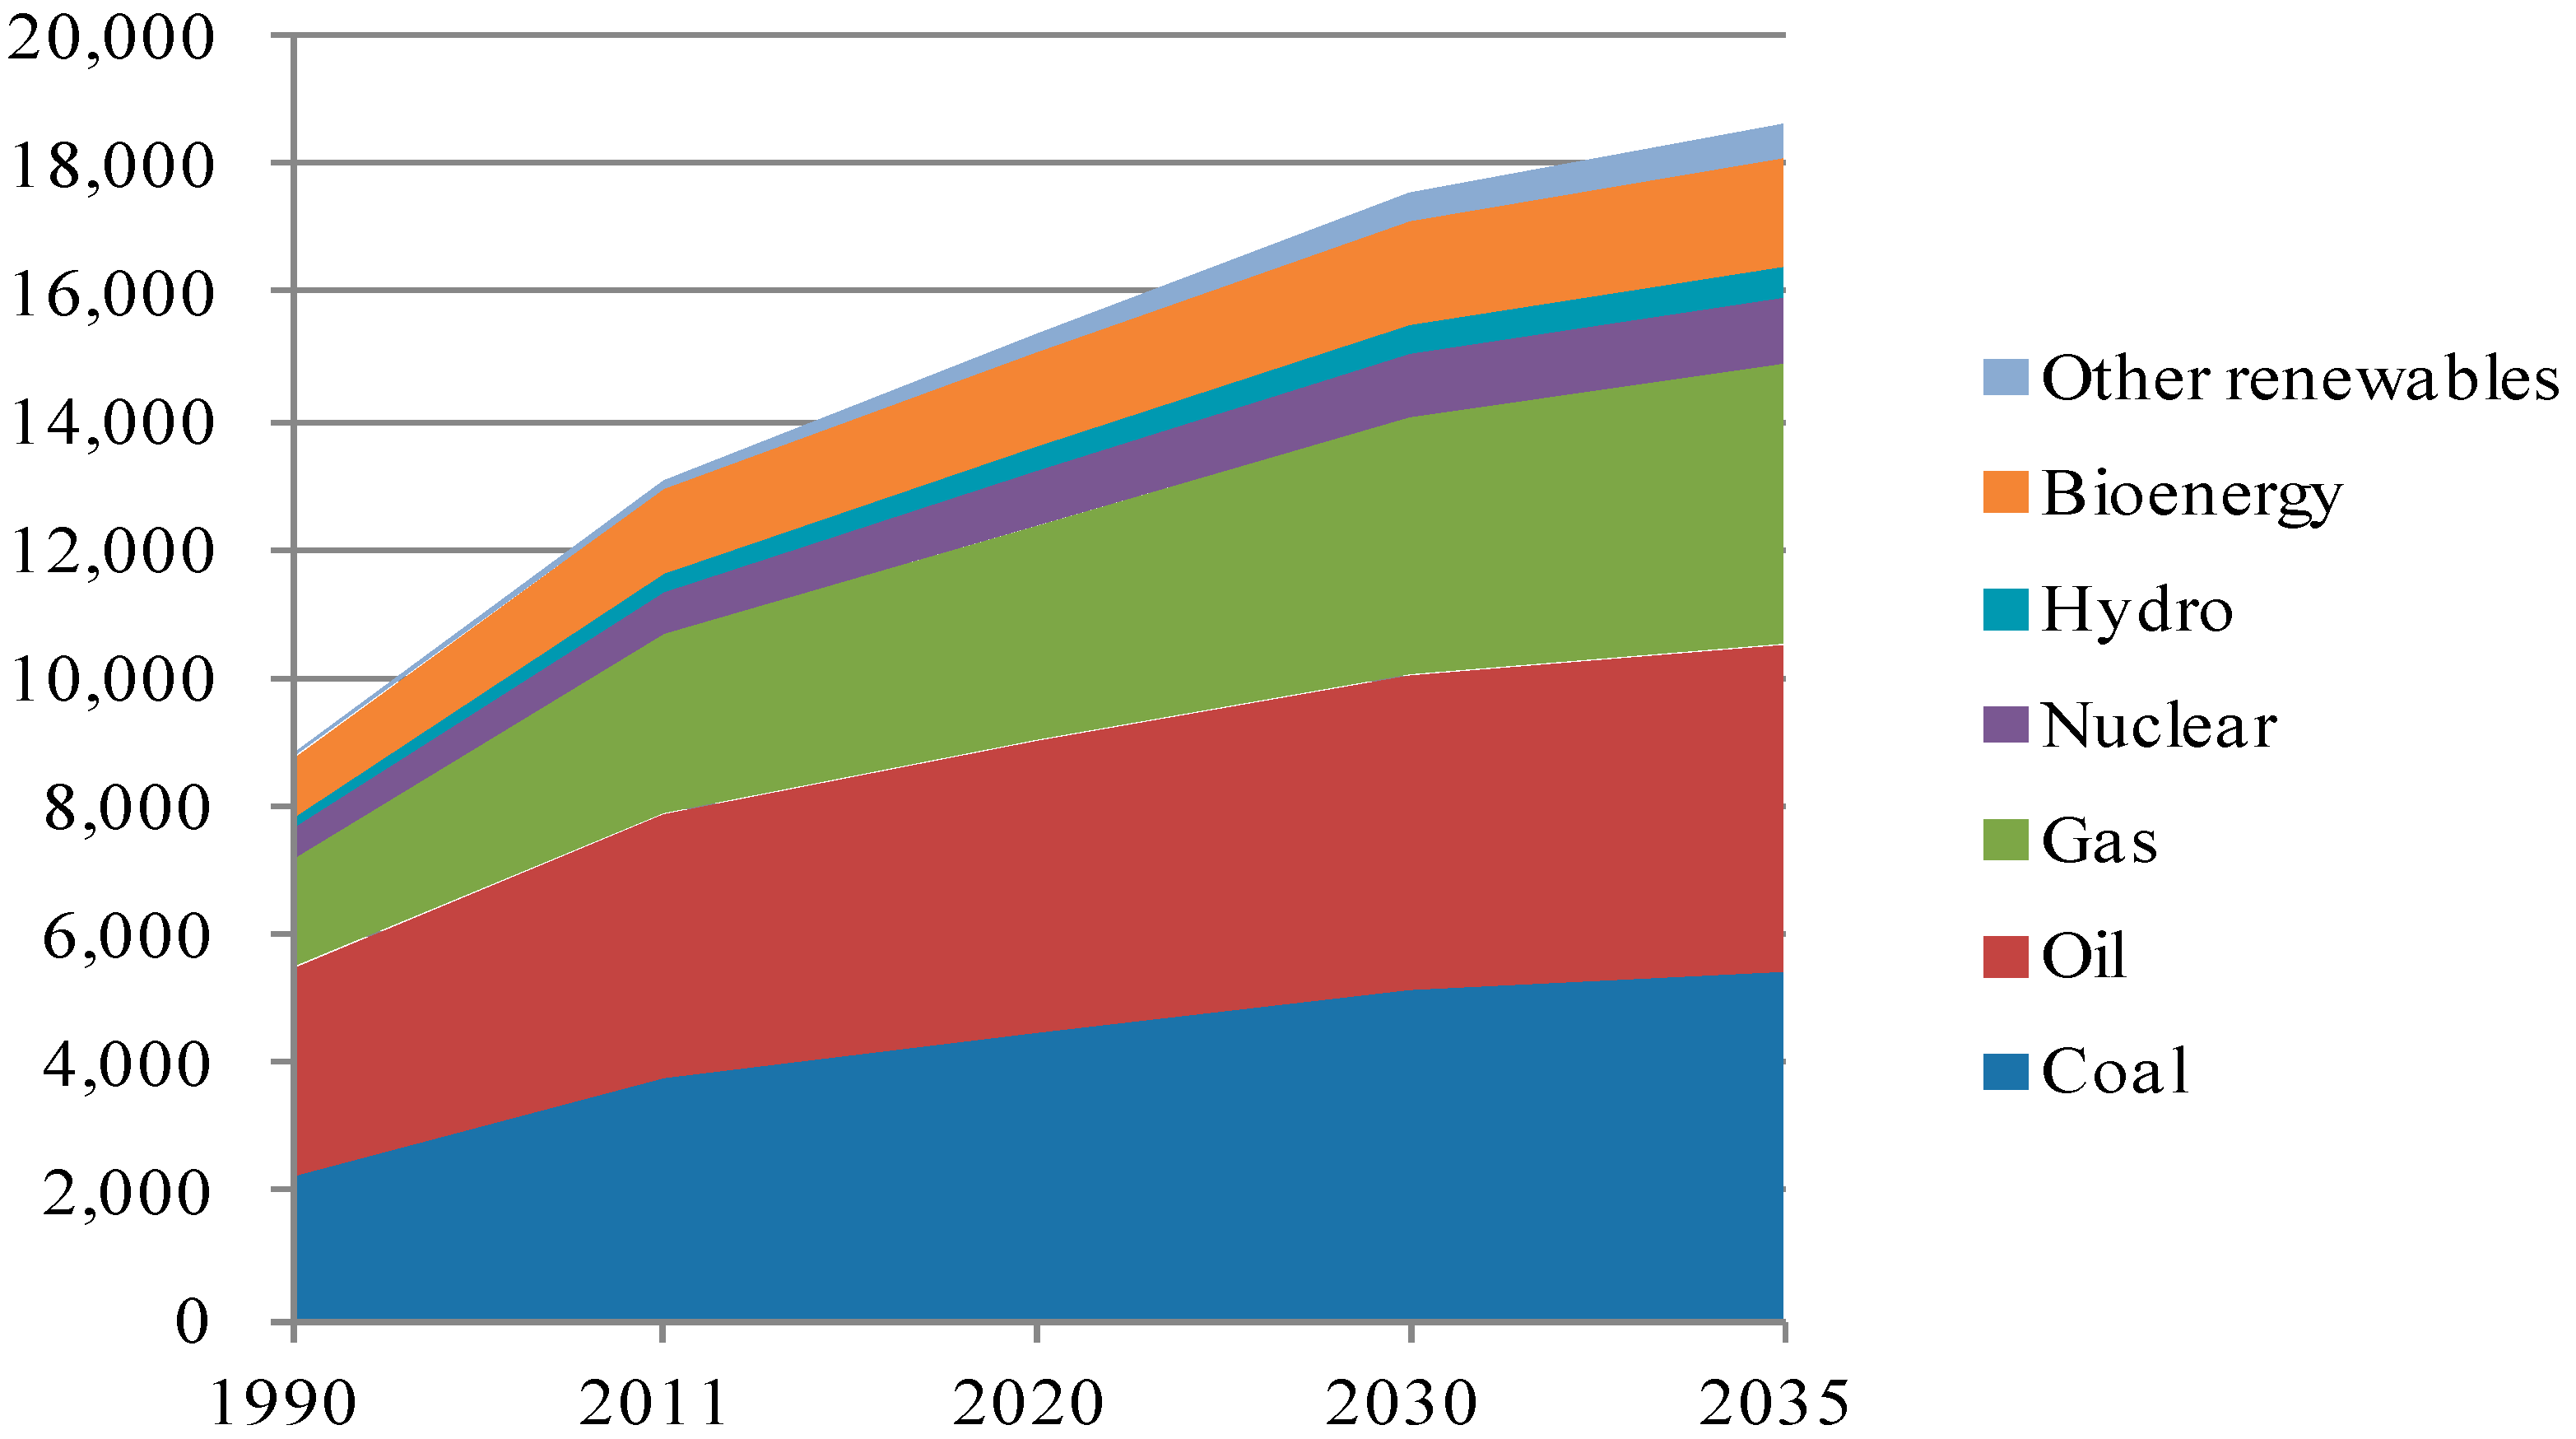
In the BAU scenario, global primary energy demand is assumed to increase by 1.5% per year over the projection period up to 2035, with fossil fuels remaining the main source of energy and thus driving up energy-related CO
2 emissions at a similar growth rate until 2035 [
18] and having serious consequences on global climate [
19]. The world composition of primary energy sources in the current policies scenario is reported in
Figure 1.
Figure 1.
World primary energy demand by fuel in the current policies scenario (Mtoe).
Figure 1.
World primary energy demand by fuel in the current policies scenario (Mtoe).
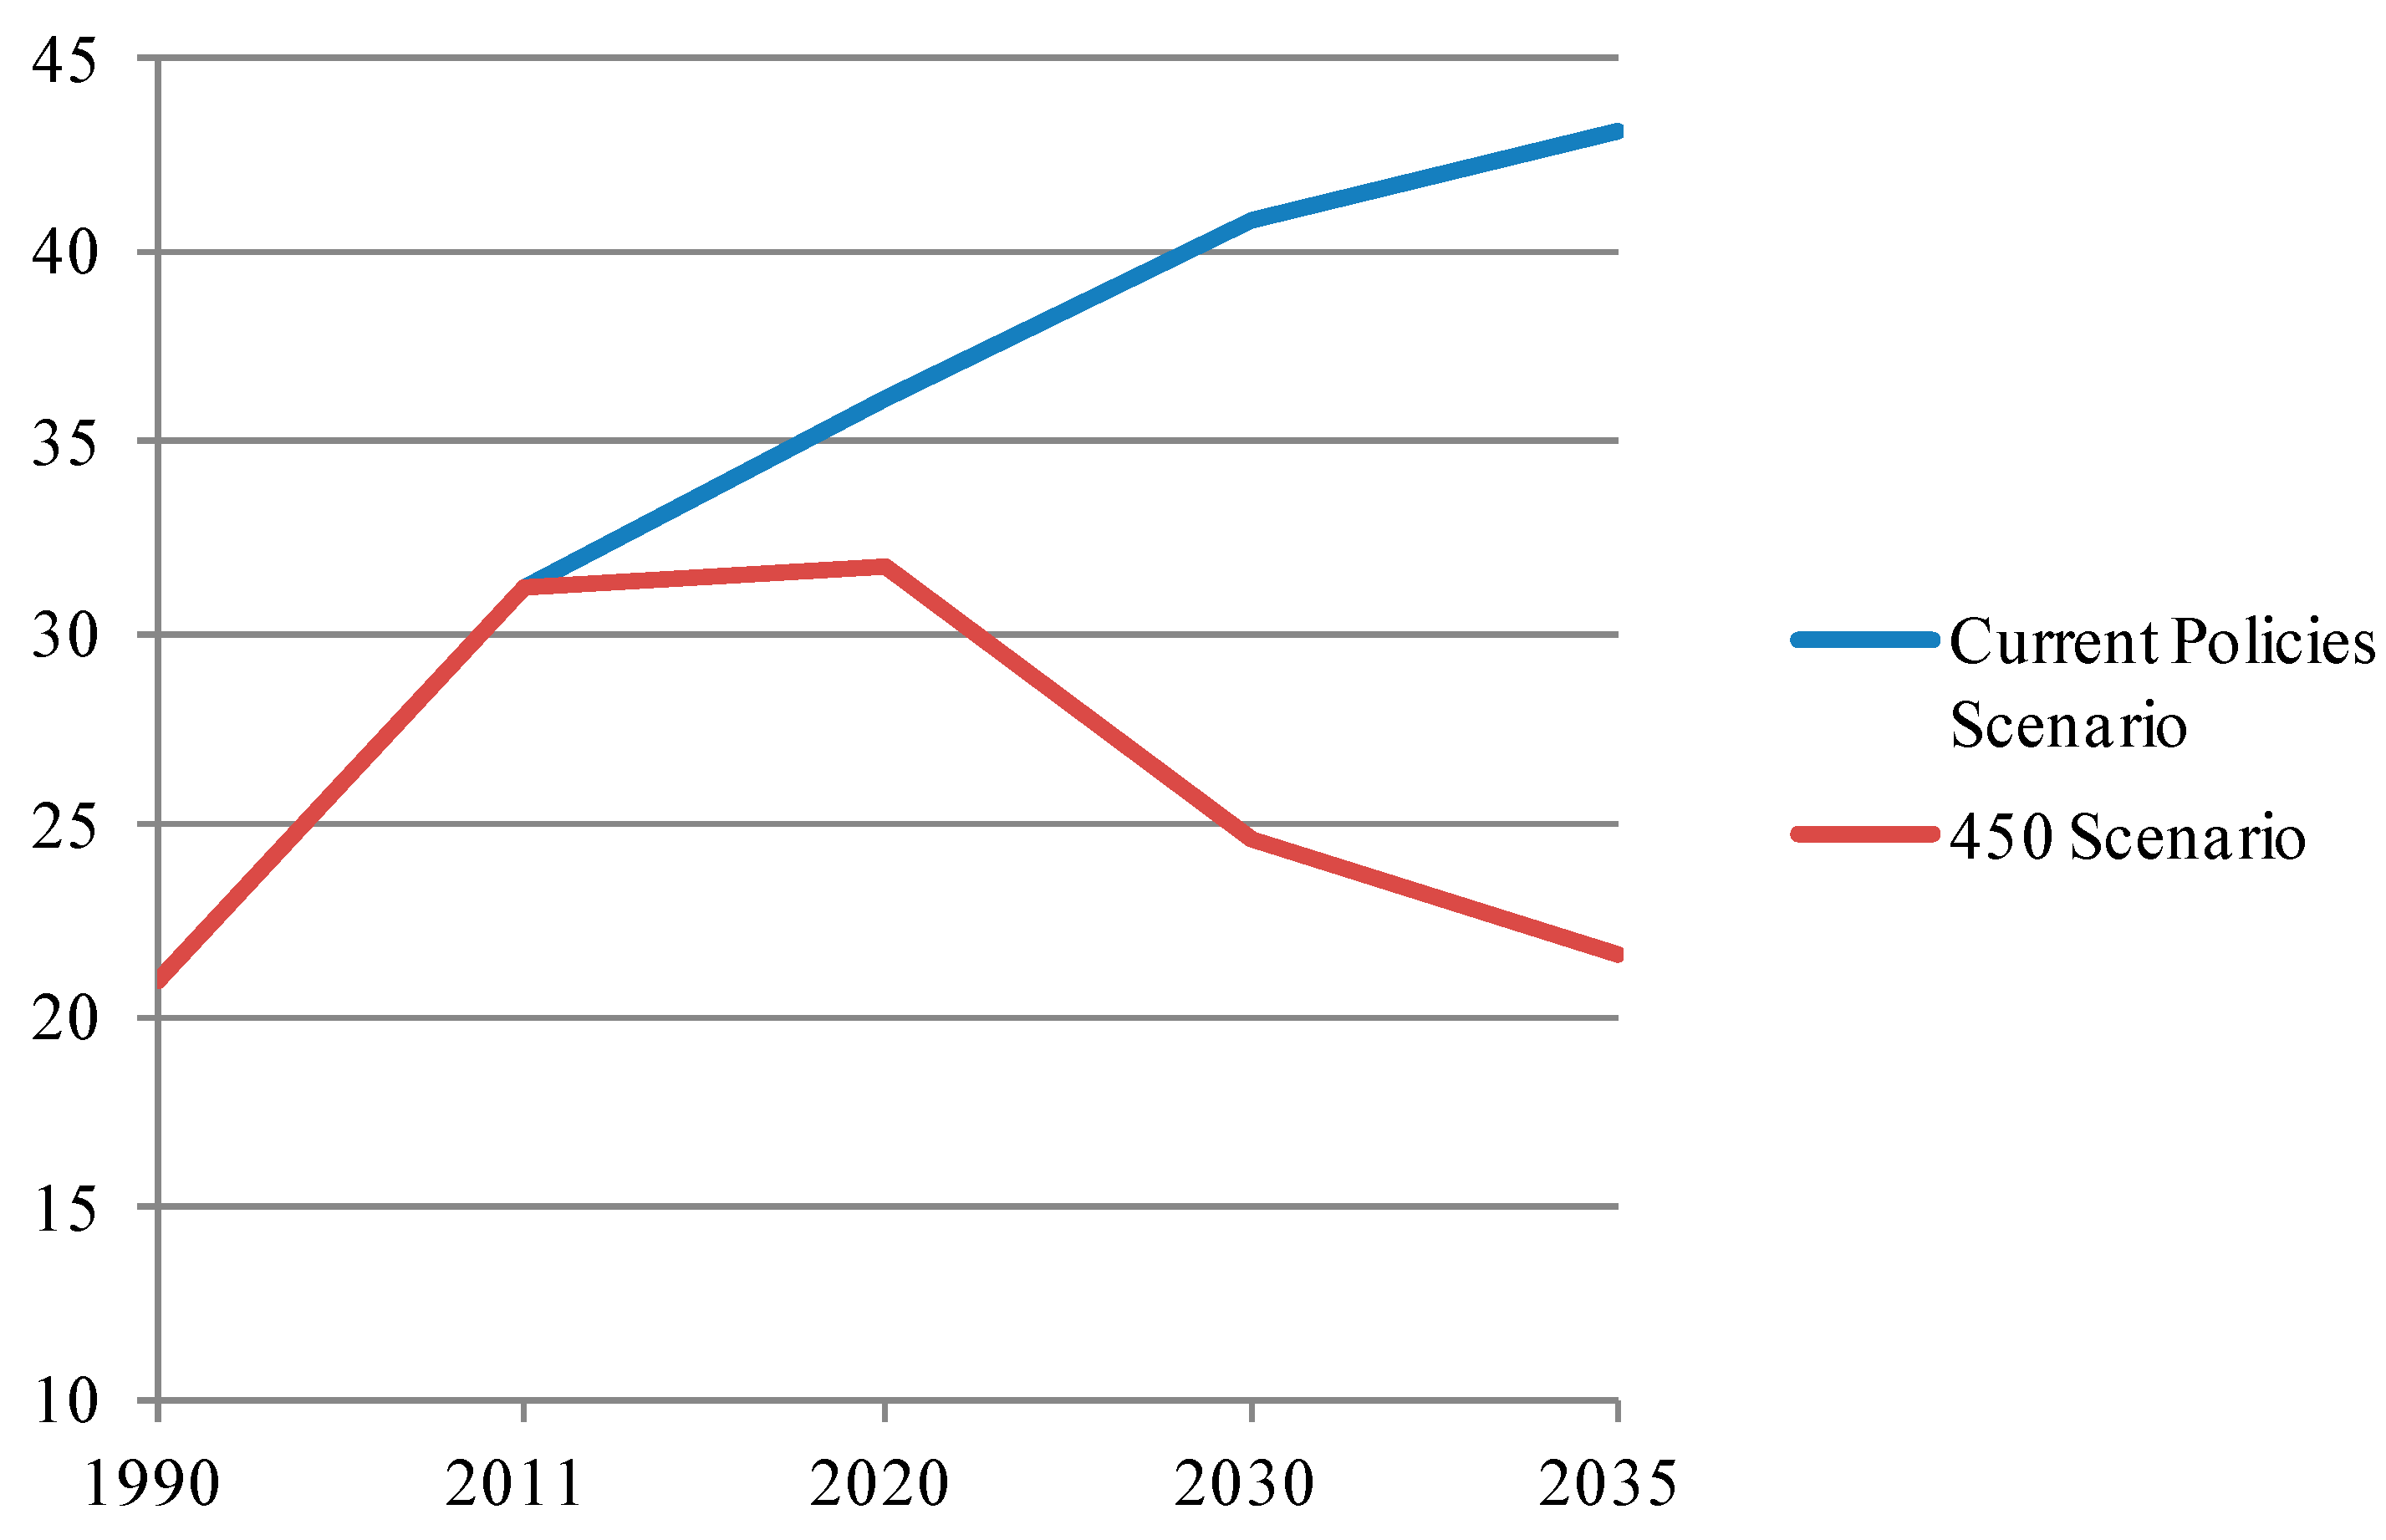
In the alternative scenario, the governments’ strong and coordinated actions to stabilize green house gas (GHG) concentrations in the atmosphere at 450 ppm CO
2-eq will require investments of 25.6 trillion USD until 2035 [
18] (Most studies on the reductions of CO
2 emissions agree that with the 450 scenario, world GHG emissions will peak in 2020 at 30.9 Gt and decrease to 15 Gt in 2050. This means, for the purpose of this chapter, that the investment amount is judged plausible by those who argue that climate change is an important goal to achieve [
10].) The trajectories of future global CO
2 emissions differ radically between the two scenarios and the differences are impressive (
Figure 2). In the 450 scenario, emissions are projected to decline substantially, approximately back to 1990 levels. The willingness of national and international institutions, as well as of citizens and businesses, is a crucial factor in achieving new ways to produce and consume energy. It will be necessary for governments to have the ability to implement taxes and subsidies to reach a critical mass of RES production and stimulate R&D activities. Businesses and citizens must work toward the possibility of closing the energy efficiency gap between actual and optimal energy use [
20].
Figure 2.
Energy related CO2 emissions by scenario (Gt).
Figure 2.
Energy related CO2 emissions by scenario (Gt).
Source: Our elaborations on IEA data [
5,
18].
The world energy-related CO
2 emissions savings, by undertaking the combined efforts of the energy mix strategies to reach 450 ppm CO
2-eq, are summarized in
Table 2.
Table 2.
World energy related CO2 emissions abatement in the 450 scenario (Gt).
Table 2.
World energy related CO2 emissions abatement in the 450 scenario (Gt).
| CO2 Abatement | 2020 | 2035 |
|---|
| Efficiency: | 2.49 | 12.28 |
| - end-use | 2.18 | 10.77 |
| - supply | 0.31 | 1.51 |
| Renewables | 1.31 | 6.46 |
| Biofuels | 0.17 | 0.86 |
| Nuclear | 0.01 | 0.04 |
| CCS | 0.13 | 0.65 |
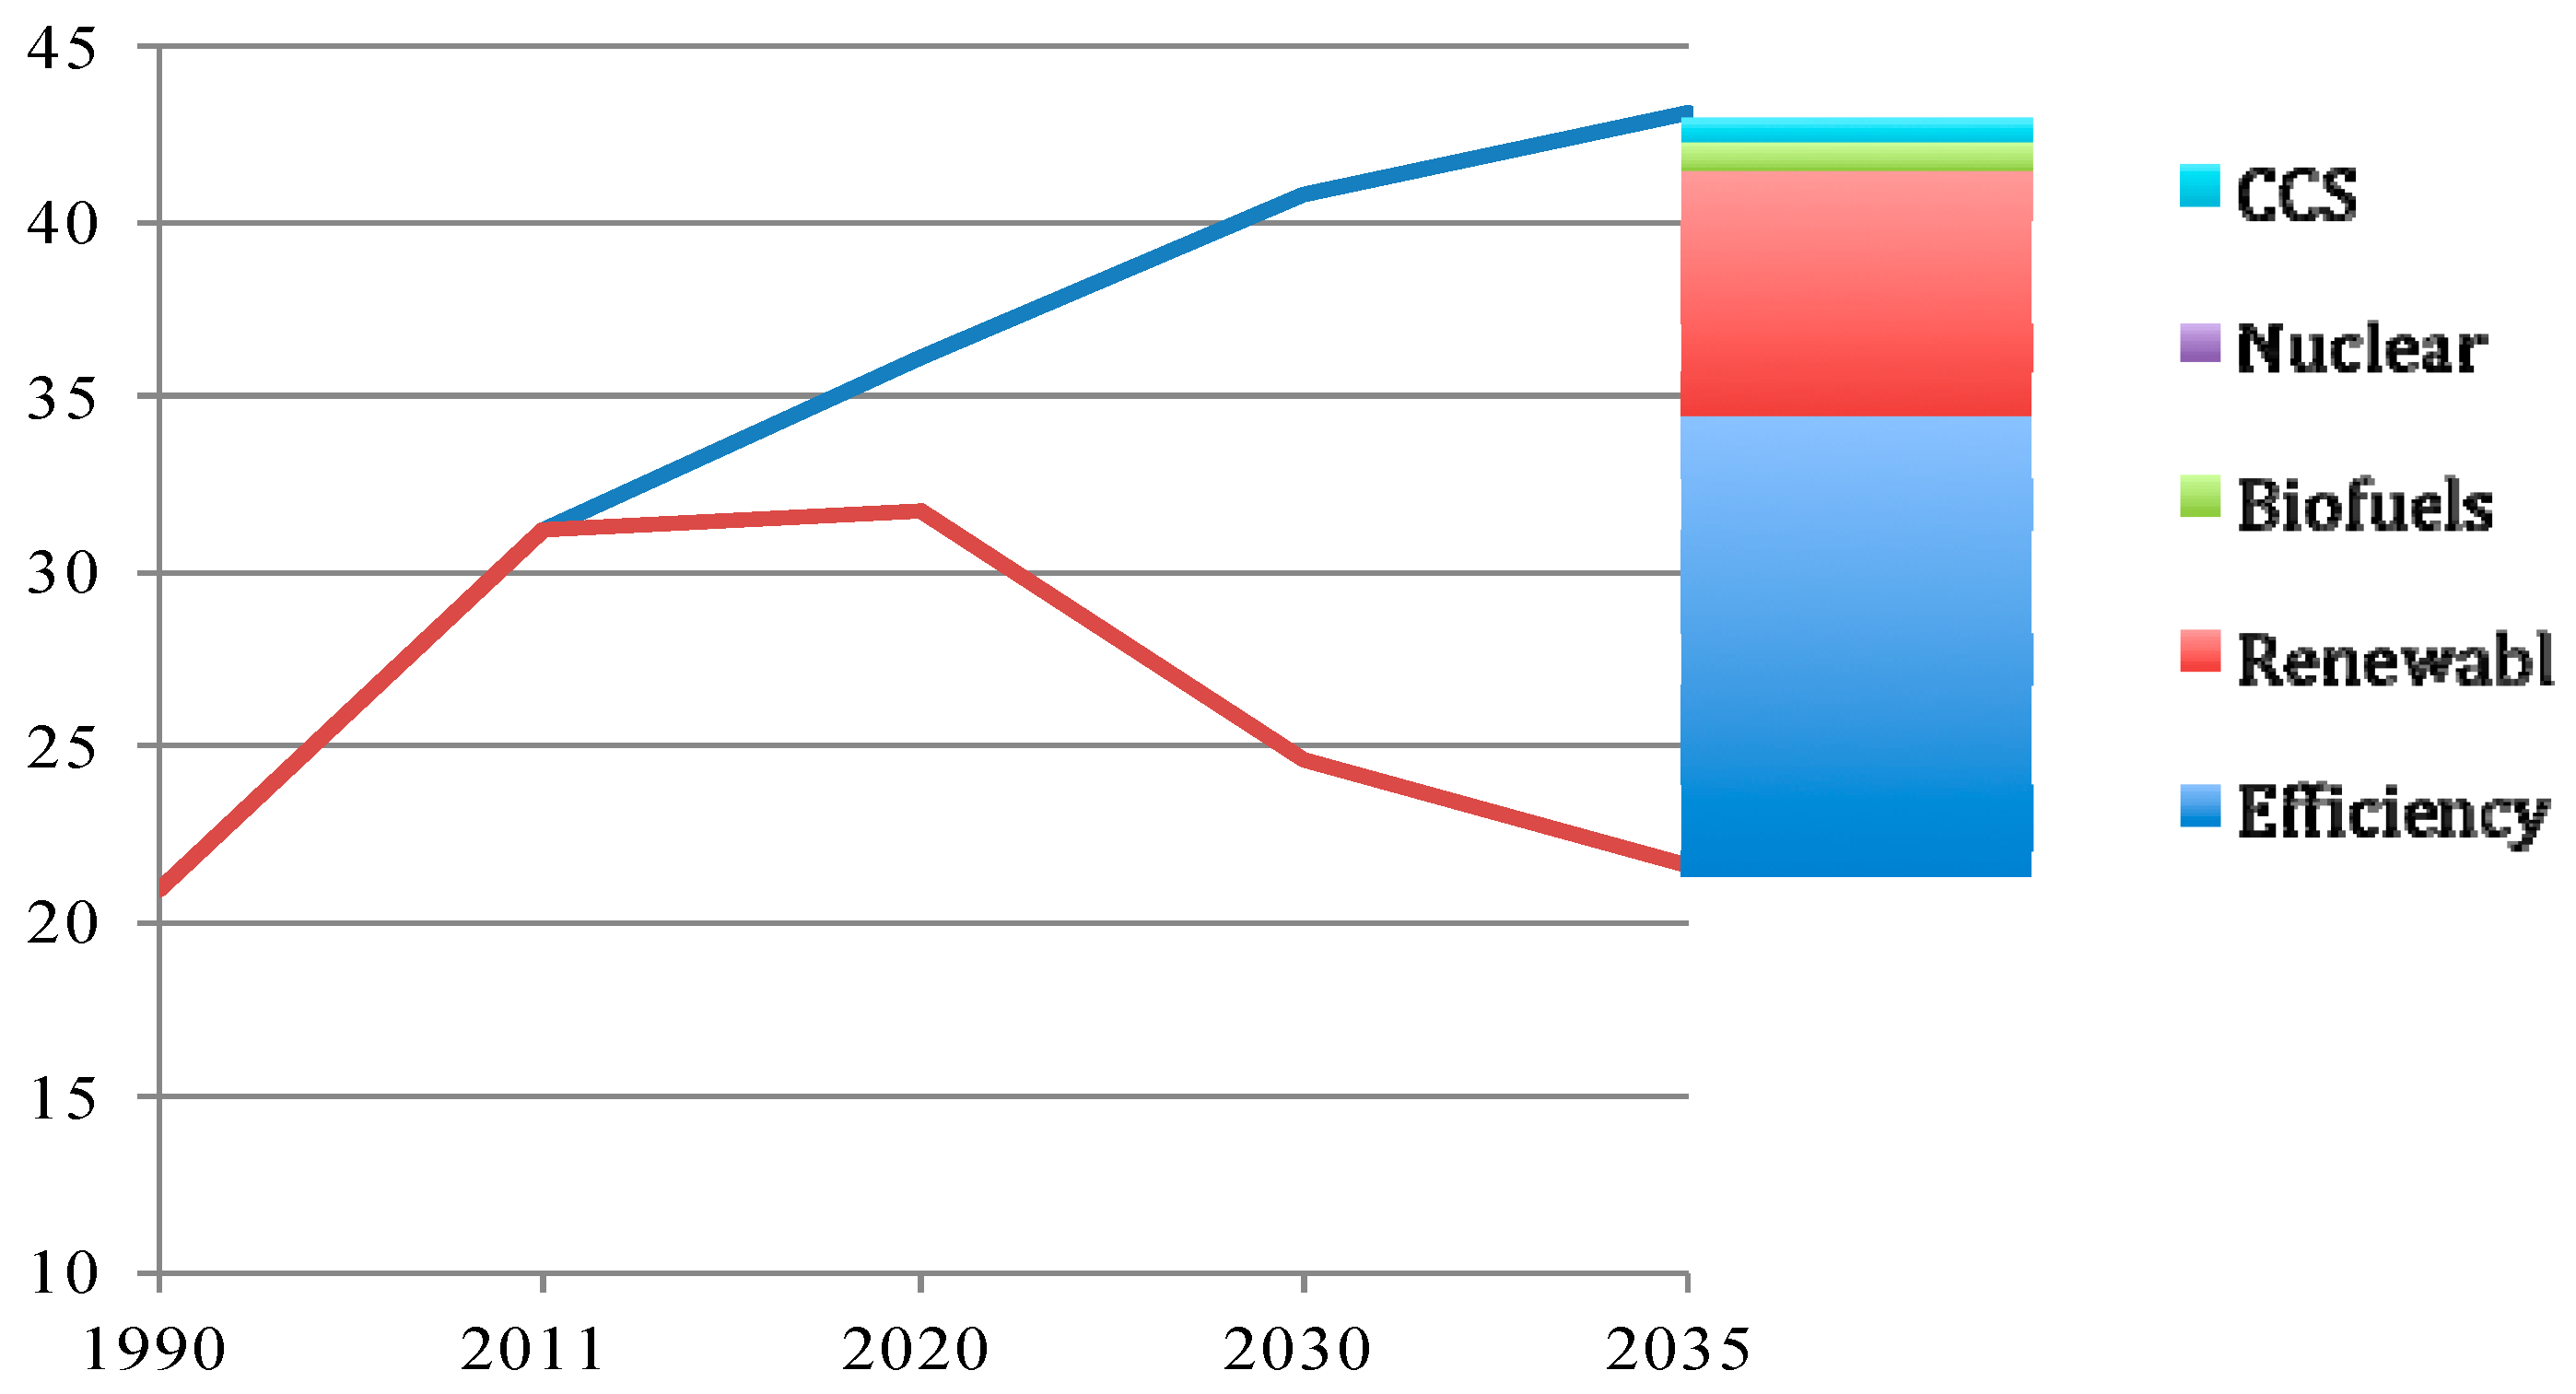
Considering the relative contribution of each component to achieve the CO
2 reduction target in 2035 (
Figure 3), we note that end-use energy is the main contributor to CO
2 emission savings, accounting for 61%.
The contribution of RES represents 32% of the savings, while nuclear power and CCS in the power industry contribute an additional 3%, while a higher consumption of biofuels in the transport sector leads to an emission reduction of 4%.
Figure 3.
Contributions of various abatement measures to the 450 scenario (Gt).
Figure 3.
Contributions of various abatement measures to the 450 scenario (Gt).
Source: Our elaborations on IEA data [
5,
18].
The IEA scenario does not take into account a critical issue. That is, how much are households willing to modify their lifestyles to achieved energy efficiency and energy savings? How much are they willing to pay for this? We recognize that these extra costs are not considered in the IEA’s analysis. However, they are crucial because consumers are also voters in a democratic system, and as such, the policy decisions must be coherent with the desires of the people. We assume that the opportunity cost of such lifestyle changes may be represented by the additional costs related to education, information, and communication.
We assume (as in [
3] that these costs are equivalent to approximately 5% of the education budget in developed countries, which, in turn, is approximately 6% of the GDP. Thus, we estimate this additional investment to be 0.30% of the GDP.
The required level of investment increases from 1.4% to approximately 1.70% of the global GDP, which is approximately 1.1 trillion USD on an annual basis through 2035. This scenario seems plausible in terms of the quantity of resources required and the allocation of investments among the three main actors: businesses, government organizations and households. We have updated previous work [
3] by constructing the average sector shares of total investments required by the year 2035 and showing that more than 80% must come from private sectors (businesses and households) and the remaining from public sectors (
Table 3).
Table 3.
World Sustainable Scenario (WSS) investment required—annual amount in trillions USD.
Table 3.
World Sustainable Scenario (WSS) investment required—annual amount in trillions USD.
| Year | Business | Government | Households | Total |
|---|
| 2020 | 41% | 19% | 40% | 100% |
| 2035 | 49% | 14% | 37% | 100% |
| 2035 | 0.539 trillion USD | 0.154 trillion USD | 0.407 trillion USD | 1.1 trillion USD |
Based on this assumption, businesses will bear 49% of the total investment required until year 2035, which amounts to approximately 0.539 trillion USD × year; households will bear 37%, which amounts to 0.407 trillion USD; and the remaining 14%, which is 0.154 trillion USD, will come from the governments. Considering the breakdown by specific environmental objectives, we have constructed the relative shares to be consistent with these assumptions (
Table 4). The last row of
Table 4 shows the same percentage figures as provided for 2035 in
Table 3, and its last column is consistent with the investment proportions of
Figure 3 [
3].
Table 4.
Sharing of WSS investment required.
Table 4.
Sharing of WSS investment required.
| Private Industrial Investment | Government Organizations | Households | Total |
|---|
| Energy efficiency | 47% | 2% | 4% | 53% |
| Renewable energy sources | 1% | 5% | 24% | 30% |
| Energy savings and lifestyle | 1% | 7% | 9% | 17% |
| Total | 49% | 14% | 37% | 100% |
In the WSS, businesses will concentrate most of their investments on energy efficiency, financed by private capital, foreign capital investments and government support. Government policies affect corporate investment decisions by means of subsidies favoring lower-emission technologies and penalties for emissions through a carbon tax or cap-and-trade system. Government intervention will be concentrated mostly on supporting schemes for RES, such as feed-in tariff schemes. Finally, households are assumed to focus their effort on two main targets: new investments in RES and in energy-using consumer goods, such as household appliances and vehicles. People’s motivation can be activated through incentives, through educational and informational campaigns, and through regulatory regimes implemented by governments.
We analyse the empirical evidence of the willingness to participate in such vast programs. In other words, we analyse whether empirical evidence supports the idea that households are prepared to finance this scenario bearing the 37% share of the total investment required, as depicted in
Table 4. In detail, we will assess the plausibility that households are ready to pay their share allocated as follows: 24% to the development of RES; 9% to change their habits and lifestyles; 4% to invest in energy efficiency.
4. The Empirical Analysis
In this paper, we use the meta-analysis to recover new information about the WTP for GE. In summary, the methodology of meta-analysis uses the results of other empirical studies to provide comparable encompassing estimations of a particular real life phenomenon. In this context, meta-analysis has been defined as “the study of studies” [
21,
22]. However, particular attention must be paid when applying meta-analysis to economic issues because, in social science, we cannot conduct controlled experiments, while typical in other fields, such as medicine and biology, such experiments are quite common.
Nonetheless, in economic empirical analysis, meta-analysis has become popular in some specific areas, such as transportation studies, which integrate and combine different research on transportation price elasticities [
23,
24]; stated preference studies, which require the robustness of elicitation procedures [
25,
26]; and gasoline demand elasticity studies [
27,
28]. In these lines of research, crucial economic variables, such as price elasticities or contingent valuation measures, that are estimated by various studies throughout the world are explained by meta-characteristics, such as the scope of the study (urban or national), the type of transportation (public or private), the elicitation procedures and the socio-economic characteristics of the population investigated. In this paper, we propose a new meta-analysis of WTP for GE by applying the best methodological practices. In particular, we reduce the selection bias including, as much as possible, work-in-progress literature, and we account for heterogeneity bias by correcting for heteroskedasticity to adjust for random effect size estimations. In this respect, we focus our attention on the impact of various empirical methodologies on the final study results rather than providing a simple summary of the main results of the extant literature [
21]. We have analysed several published and unpublished works as well as some electronic databases such as Google Scholar, EBSCOHost and JSTOR.
The WTP for a marginal incremental change of GE production is defined as the ratio of the marginal utilities GE production and purchase price attributes such that:
where we assume that
U is a linear stochastic utility function of the individual, with arguments: the GE production, purchase price
P, and a vector of other variables. We recover the WTP as the ratio of the coefficient of GE production,
βGE, to the coefficient of purchase price,
βP:
These coefficients are derived from the literature. It is well known that WTP estimates depend on the reference level at which WTP is calculated. In the literature, these reference levels are usually the mean level of the GE production or the purchase price attribute used in the survey. As both reference levels can vary substantially among primary studies [
29], the comparison of WTP values stemming from studies employing different utility specifications can be particularly problematic.
From a theoretical perspective, a measure that circumvents this problem is the compensating variation (CV) that reflects the change in the economic welfare of a household caused by a change in the level of a commodity attribute. In other words, the CV is the monetary compensation required after a change in the attribute level to restore the individual to the same utility level he had before the change occurred. That is,
where GE
0 is the reference level of the GE production attribute and GE
1 (GE
1 = GE
0 + ∆GE with ∆GE > 0) is the same attribute level after the change has occurred and Y is the income of the household. Nevertheless, if the utility function is assumed to be linear in the GE production, the CV simply equals the product of marginal WTP and the considered change in driving range. For each primary study, we, if possible, explicitly take in account GE
0 and the policy target ∆GE.
4.1. The Related Literature on WTP for GE
We provide an overview of the primary studies used in the meta-analysis in
Table 5. We also present the minimum, mean, and maximum estimates of WTP per month and per household derived from each study. WTP estimates are standardized into PPP-adjusted 2007 EUR to take into account the international and over- time differences of household purchasing power.
Table 5.
Summary of the primary studies included in the sample (EUR 2007 × month).
Table 5.
Summary of the primary studies included in the sample (EUR 2007 × month).
| Study | Country | Year of Survey | Observations | Mean Estimate | Lowest Estimate | Highest Estimate |
|---|
| Bigerna and Polinori [29] | Italy | November 2007 | 1600 | 2.782 | 0.501 | 4.752 |
| Bollino [30] | Italy | November 2006 | 1601 | 3.629 | 1.057 | 7.480 |
| Bigerna and Polinori [31] | Italy | March 2007 | 1600 | 5.87 | 2.055 | 8.235 |
| Kim et al. [32] | Korea | August 2010 | 720 | 1.265 | 1.010 | 1.375 |
| Grösche and Schröder [33] | Germany | 2008 | 2948 | 5.5353 | 2.90 | 6.738 |
| Yoo and Kwak [34] | Korea | 2006 | 800 | 1.969 | 1.478 | 2.726 |
| Ivanova [35] | Australia | August 2004 | 213 | 4.319 | 3.841 | 5.376 |
| Batley et al. [36,37] | UK | March 1997 April 1999 | 742 692 | 6.158 | 5.908 | 6.393 |
| Zhang and Wu [38] | China | May–June 2010 | 652; 536 | 2.515 | 0.900 | 4.090 |
| Hanemann et al. [39] | Spain | November–December 2009 | 233 | 25.850 | | |
| Hansla et al. [40] | Sweden | 2008 | 855 | 1.113 | 0.7420 | 1.483 |
| Borchers et al. [41] | US | May 2006 | 625 | 8.128 | −19.283 | 29.579 |
| Nomura and Akay [42] | Japan | October 2000 | 379 | 24.680 | 17.479 | 31.450 |
| Goett et al. [43] | US | 2000 | 1205 | 19.392 | 16.306 | 22.478 |
| Byrnes et al. [44] | US | September 1992 November 1994 | 600 500 | 1.545 | 1.470 | 1.620 |
In particular, our sample includes studies on the WTP for both GE in general (approximately 75% of the studies) and specific RES mix (the remaining 25%) that were conducted from 1992 to 2014 worldwide (more details are provided in [
29].). Approximately 40% of the studies were conducted after the Great Recession, and we have also evidence of WTP for GE when behavior toward environmental issues changed and became less enthusiastic.
We collected data on the average electricity consumption per household, the WTP expressed EUR per month, the type of survey and the econometric method used. The typical method used to reach respondents was by mail and or through field interviews, while email and the Internet were seldom used. The econometric method was equally split between single bounded (SB), double bounded (DB) and payment card (PC).
We find that the vast majority of the studies are derived from published sources (Journals), while few appeared in conference proceedings and working paper series. In only three cases did we find that the choice to adopt RES was voluntary, while in the remaining studies, the choice to adopt RES in electricity production was understood to be compulsorily financed through some government administered scheme. In half of the cases, an explicit policy program was part of the information submitted to the respondents. Accordingly, we have computed country mean and median WTP, and we have also averaged results by continent. With respect to the latter, it is interesting to note that the mean WTP is 6.7 EUR × month in Australia, 8.3 EUR × month in the US, 11.3 EUR × month in Europe and 12.5 EUR × month in Asia. This clearly indicates that the concern for GE is more highly valued in regions with more ancient tradition and history.
Finally, we have also considered those few studies that take into account explicit uncertainty when assessing the WTP for a different energy mix to be used in GE production [
29,
45]. The overall picture shows that in general, there is only partial support for public policies to develop GE, with a wide range of values in Europe, America, Asia and Oceania [
29,
31]. From a methodological perspective, several elicitation formats for contingent valuation are used. The main formats are SB, DB and PC (More details are provided in Bigerna and Polinori [
31].). In the DB format, respondents are asked two close-ended questions that include a binary response (yes, no) to an initial and follow-up question. While this format increases statistical efficiency, it is not bias free [
46]. Nomura and Akay [
42], using the DB format, investigate consumers’ WTP to increase GE by sending a postal questionnaire to residents in a sample of Japanese cities before introducing green energy funding. A WTP median estimate is approximately 2000 JPY × month, one of the highest for Japan. This is because RES has become more familiar and their efficiency is more widely known. The results highlight that climate change mitigation is firmly linked to increased RES [
39,
44,
47] when assessing the reliability of the contingent valuation method (CVM) by criterion validity. They employ two surveys that refer to two different programs, the Colorado and Wisconsin Renewable Energy Program, using phone and mail questionnaires. Although 73% of the respondents support RES investment, only 13% participate in the program. Finally, Yoo and Kwak [
34] apply the CVM to evaluate GE in Korea. Even if a considerable number of respondents refuse to pay for a GE policy, the authors find a monthly WTP of 1.8 USD. This figure denotes an increasing interest in renewable energy combined with an actual willingness to support GE.
Ivanova [
35] and Hanemann
et al. [
39] use the SB method. The main advantages of this elicitation format are that it is incentive compatible, cognitively manageable and free of psychological biases. However, it is not statistically efficient. Ivanova [
35] used a mail questionnaire to evaluate market sustainability of Australia’s federal government renewable program. The results showed that 65% of Queensland respondents are willing to pay 22 AUD × quarter to increase RES use from 10% to 12%, but these figures are way off target. Hanemann
et al. [
39] find that Spanish households support the implementation of a GE program to mitigate climate change. Using a phone survey, they estimate a monthly household median WTP of 29.9 EUR against an average monthly bill of 40 EUR. The promotion of the Copenhagen summit could explain this exceptionally high value. Finally, Wiser [
48] explores WTP under different payment methods (voluntary and mandatory) different way in which RES could be provided (private and government) in the US. The concept of free-riding is used to explain large differences between environmental attitudes reported by the general population and the weak actions of those groups engaged in voluntary environmental behavior. The results confirm that elicited WTP for RES is higher under a mandatory payment method then a volunteer one and that WTP under private supply is greater than WTP under government provision.
The PC method has been recommended by government guidelines [
49] and by prominent scholars [
50,
51]. It avoids the anchoring bias due to the CVM, and it maintains a direct question approach, thus increasing the response rate to WTP questions. The PC method assumes respondents have a valuation distribution in mind rather than a single point economic value estimation. While cons are value cues and they range bias [
51], Rowe
et al. [
52] suggest that when the range is sufficiently large it does not constrain respondents, and consequently, it is possible to avoid range and centering bias. According to these results, Zhang and Wu [
38] establish a starting point and intervals through a pilot survey. They also distinguish respondents who did not demonstrate a WTP, finding that the majority of respondents have a conservative WTP mean of approximately1.15–1.51 USD × month.
Using other methods, several studies focused on WTP for GE at the national and regional levels. Among these, Batley
et al. [
36,
37] find that approximately 35% of respondents declared that they are willing to pay an additional16.6% to 18.5% of their actual expenditures to support GE. This effort, however, is insufficient to achieve the national target. Bollino [
30] finds that Italian households support paying 30% of the annual cost of the national target annual cost. Bigerna and Polinori [
29,
31] find similar results as well, and in Germany, Grösche and Schröder [
33] also reflect similar findings. Finally, Kim
et al. [
32], using a non-parametric model (spike model) find that Koreans have an annual WTP of 277.4 million USD for GE, which is approximately 58% of the government’s budgetary allocation.
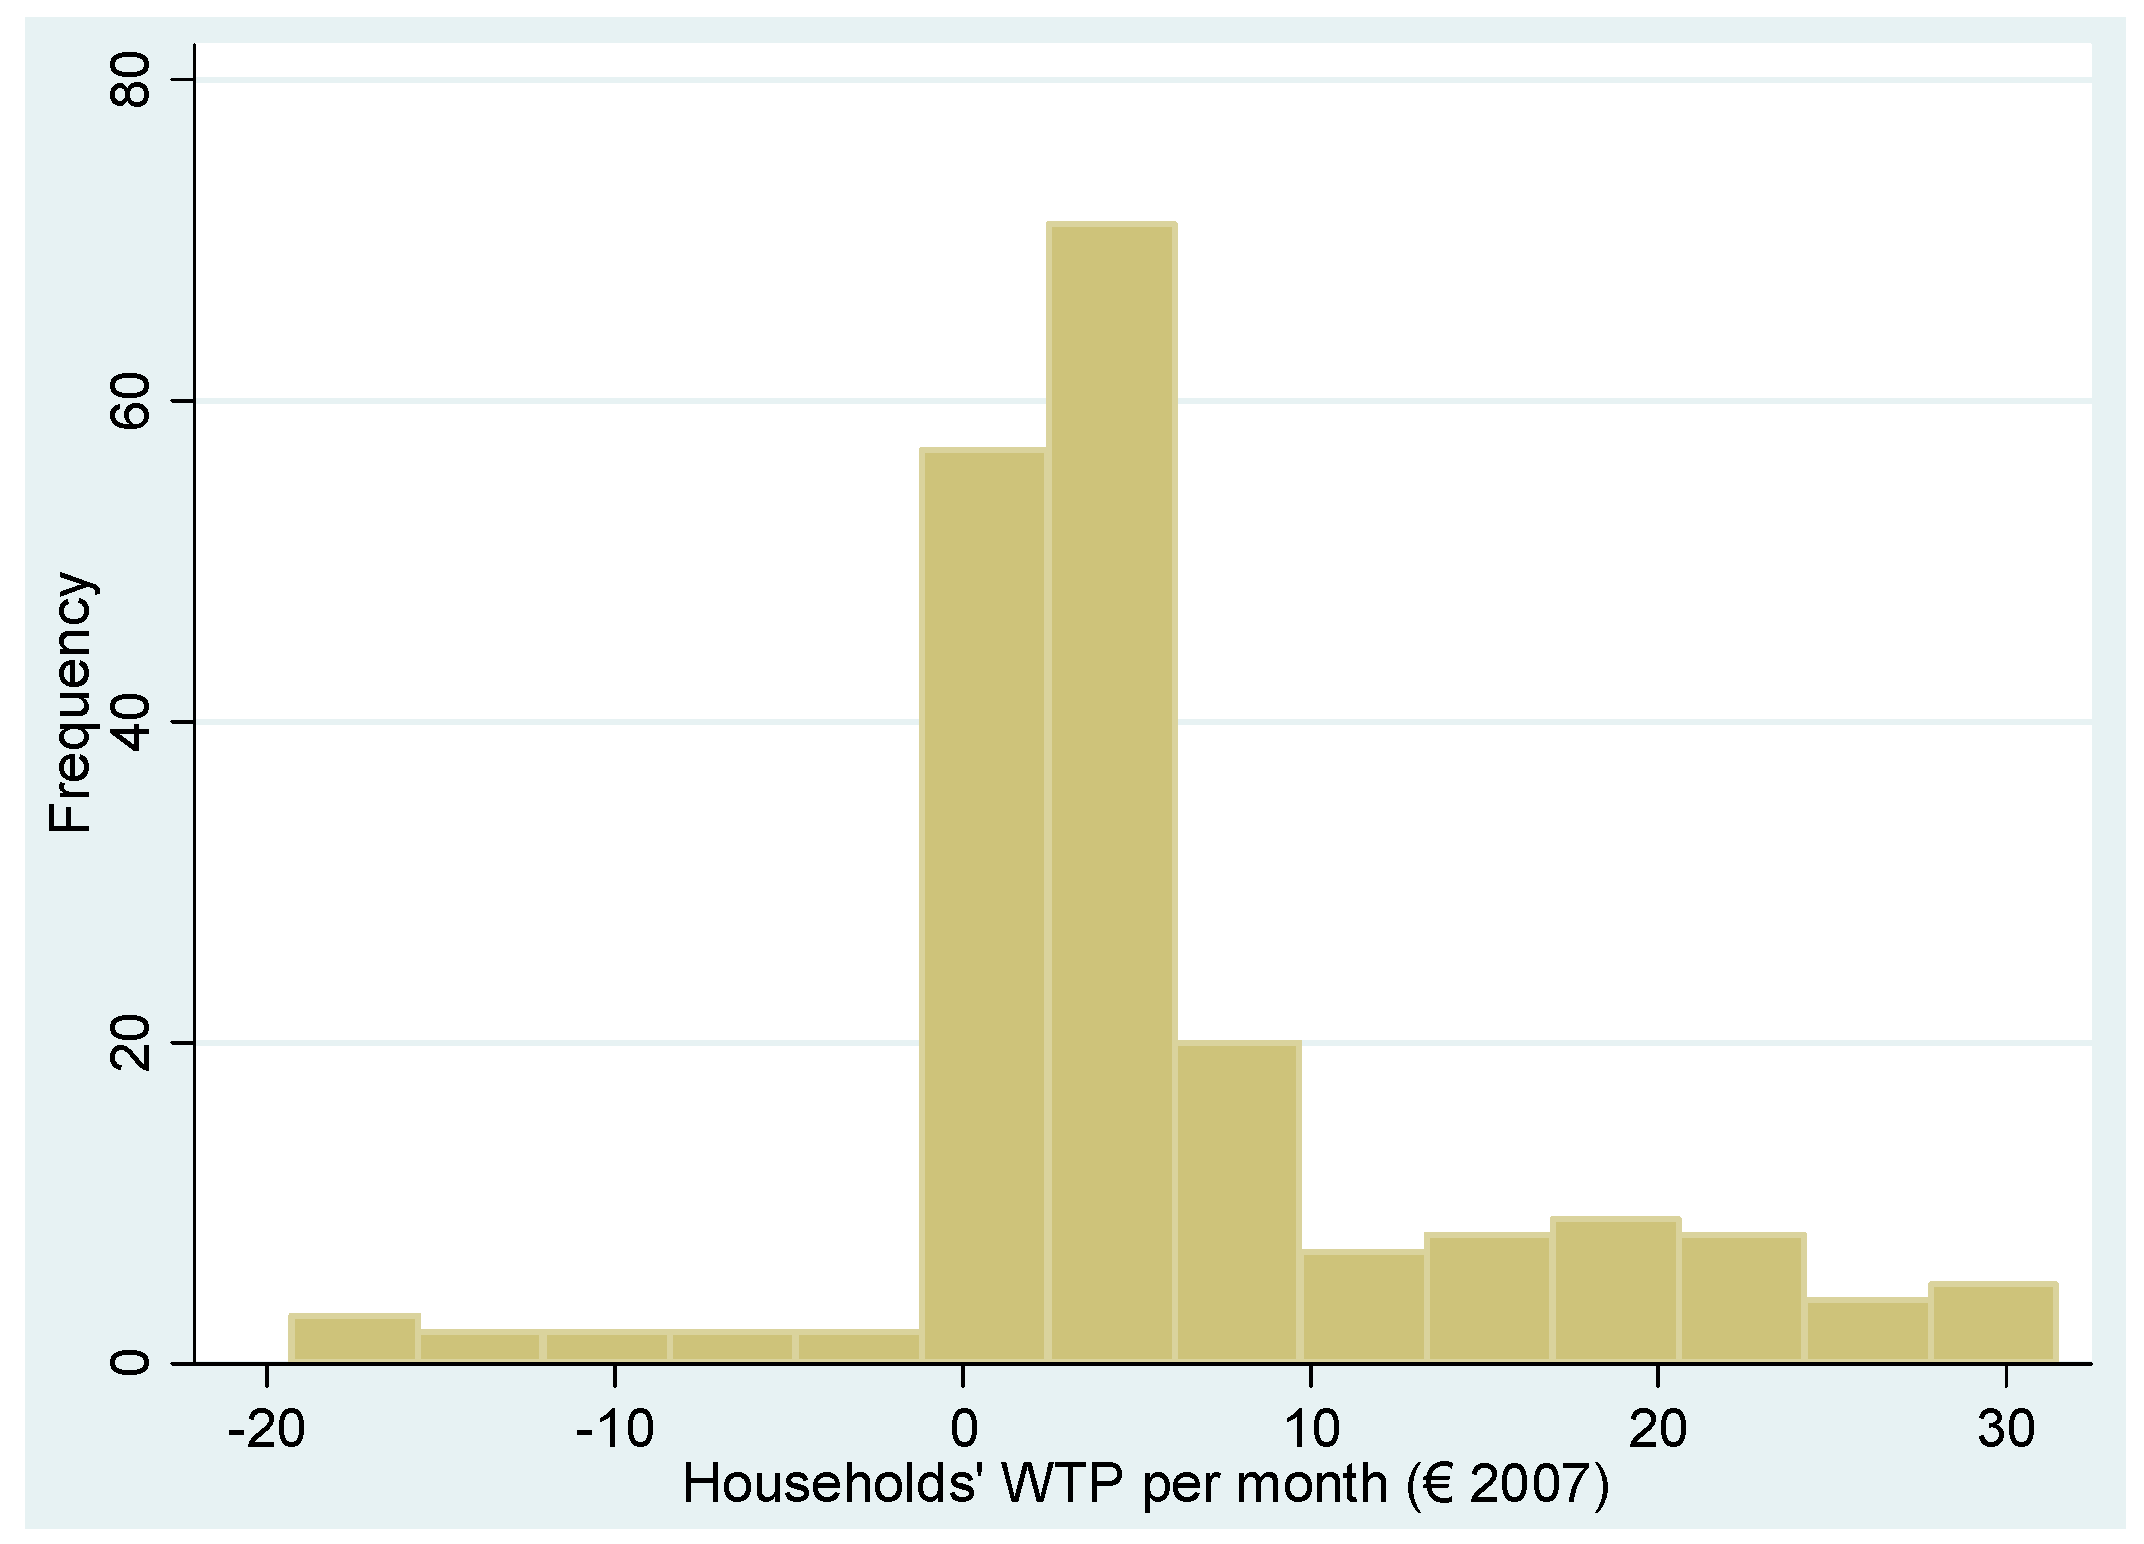
The distribution of the monthly WTP for GE according to various targets and consumption levels is illustrated in
Figure 4.
Figure 4.
Distribution of WTP for GE.
Figure 4.
Distribution of WTP for GE.
Note: WTP estimates are in PPP—adjusted 2007 EUR.
If we consider only positive WTP, we note that it is positively skewed. However, in the full sample, the mean value is equal to 6.05 EUR × month and the median is equal to 4.06 EUR × month. These value increases, respectively, to 4.22 and 7.03 EUR × month in the restricted sample are used in the meta-regression analysis.
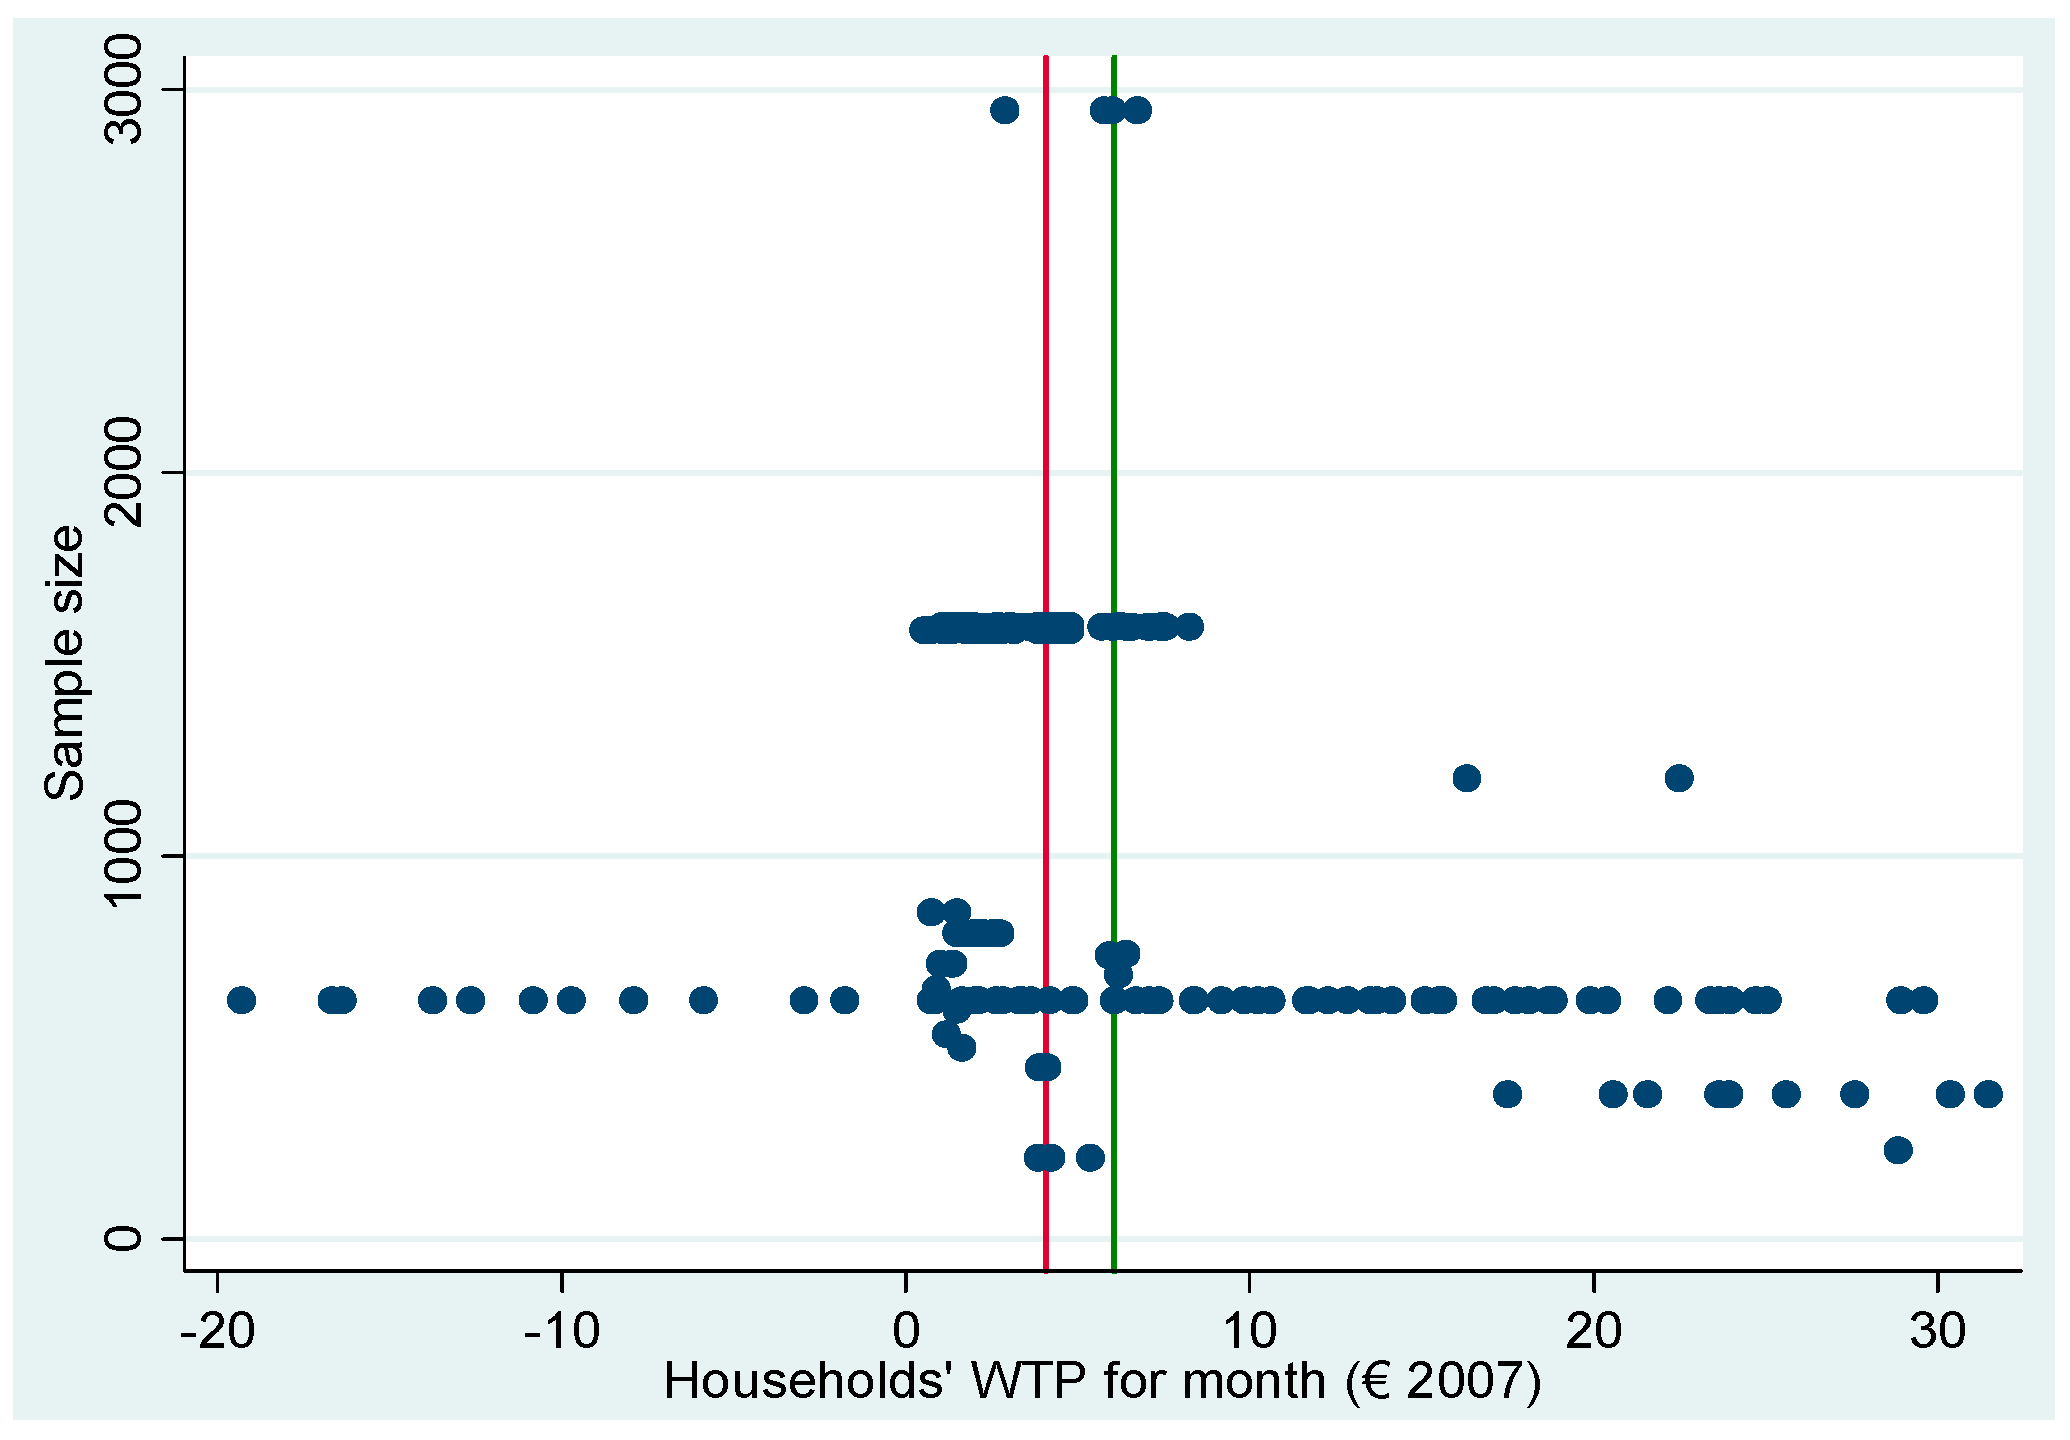
Figure 5 shows a funnel plot, which serves two purposes.
Figure 5.
Funnel plot for WTP for GE.
Figure 5.
Funnel plot for WTP for GE.
Note: WTP estimates are in PPP—adjusted 2007 EUR.
According to the literature, it is necessary to take into account whether a publication bias exists, and the first purpose is to provide insights into this occurrence in our study sample.
The second purpose refers to the problem of heterogeneity. The importance of considering possible differences among the results stemming from different sample sizes is illustrated in
Figure 5. The scatter-plot of the sample size used in the primary study of the WTP for GE reveals that studies using smaller sample sizes result in higher WTP estimates than studies using larger sample sizes. Furthermore, in small sample studies negative WTPs are obtained. These characteristics affect the mean WTP, and consequently, the authors prefer to use the median, as it is more robust.
The mean WTP of the top 25% of sample sizes is approximately 7.40 EUR × month, while the mean WTP for the top 5% is 23.95 EUR × month. The fact that the plot is skewed to the right is an indication of the possible existence of publication bias in our study, and consequently, it supports the adoption of a weighting approach.
The aim is to mitigate the effects of correlation, heterogeneity and possible publication bias in the sample used in the meta-regression analysis. The comparisons among unweighted and weighted statistics according to two different weighting procedures are presented in
Table 6. In the first, to address a multiple-sample problem, WTPs are weighted using the inverse of the number of estimates drawn per dataset. This scheme produces lower statistics and wider intervals. The wider intervals are the result of a study characterized by a lower number of estimations per WTP.
In the second, we use a weighting procedure in order to mitigate both correlation and heterogeneity present in our sample.
The weights applied to WTPs estimate (wpq) are equal to the ratio of the sample size employed in the primary study and the number of estimates drawn per dataset according to the following formula: wpq = np/dq, where np represents the size of the primary sample used for the estimation of p and dq is the number of WTP estimates drawn from dataset q.
The mean and median of the WTP estimates computed using the second weighting procedure is appreciably lower than others, thus confirming that the unweighted approach yields inflated parameter estimates.
Table 6.
Summary statistics of WTP estimates under different weighting schemes.
Table 6.
Summary statistics of WTP estimates under different weighting schemes.
| Sample | Mean | Media | LoB 95% | UpB 95% |
|---|
| Unweighted |
| Full | 6.053 | 4.063 | 4.884 | 7.222 |
| WTP > 0 | 7.029 | 4.216 | 5.962 | 8.096 |
| Weighted by the inverse of the No. of observations per study |
| Full | 5.730 | 3.438 | 4.072 | 7.312 |
| WTP > 0 | 6.653 | 3.567 | 4.971 | 8.196 |
| Weighted by the inverse of the No. of observations per study and sample size. |
| Full | 4.473 | 2.348 | 2.795 | 6.034 |
| WTP > 0 | 5.194 | 2.436 | 3.413 | 6.763 |
4.3. Empirical Evidence: Will Households Support WSS?
We use our results to assess the degree of household acceptance of policy targets, measured in terms of share of support of the WSS target. First, we compute the required investment to be borne per household to reach the target in terms of CO
2 abatement from
Table 3 and
Table 4. We estimate that the yearly investment in RES that must be supported by households is equal to 80.0% of the 0.33 trillion USD. Furthermore, according to the IEA data, we estimate that the CO
2 abatement target due to RES is equal to 65.7% of the total annual household commitment, which is 0.407 trillion USD. Consequently, the average annual required investment costs can be estimated as 61.84 EUR × t CO
2 × year, assuming that the investment lasts for 20 year. This figure is clearly within the range envisaged for the carbon tax. We present the distribution of our marginal WTP estimates in
Table 8 and show that, on average, households are willing to pay 15.67 EUR × MWh. We assume that one additional MWh from GE rather than dark electricity can be considered equivalent to an abatement of 2.27 t of CO
2. Accordingly, we are able to compute a sustainability ratio (last column of
Table 8) as the proportion of household WTP with respect to the total required cost.
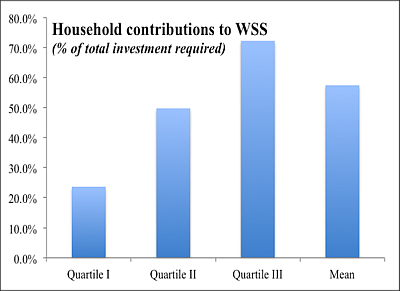
Table 8.
Household contributions to WSS.
Table 8.
Household contributions to WSS.
| Distribution | Marginal WTP * | Conv. Factor | Annual Cost ** | Sustainability |
|---|
| QI | 6.47 | 2.27 | 61.84 | 23.7% |
| QII | 13.57 | 49.8% |
| QIII | 19.69 | 72.3% |
| Mean | 15.67 | 57.5% |
On average, household support of the GE target represents approximately 57.5% of the total investment required. This percentage is 23.7% for the lower quartile of household distribution but 72.3% for the top quartile. In conclusion, our computations indicate that there is an appreciable consensus for the development of GE.
5. Conclusions
Promoting renewable energy in both developed and developing nations is an essential need at the global level. Nevertheless, a reduction in worldwide CO2 emissions implies a comprehensive legal framework, an international commission, an adequate incentive mechanism and considerable cost. Consequently, a complex framework of analysis is needed to globally appraise a more sustainable scenario that goes beyond the aim of this paper.
Our aim is tighter indeed. From the institutional perspective, we have analysed the relationship among the market and other institutions and emphasized the role of lifestyles, such as innovations required. Furthermore, the empirical aim of this paper was to appraise the financial sustainability of the WSS in which the CO2 atmosphere concentration is equal to 450 ppm.
Focusing on the institutional context, we have disentangled the target scenario by computing the efforts required of various institutions, such as households, businesses and governments. Consequently, the abatement costs were shared among institutions and energy aims in both relative and absolute terms. Previous literature has allowed us to estimate the marginal distribution of the WTP for GE, which has yielded two main results. The first result considers the robustness of the existing literature results, while the second addresses the estimation of the financial sustainability of the target scenario presented herein.
An econometric analysis highlights the impact of country specificity. While European citizens more strongly support the use of RES in electricity production, European countries are also global leaders in GE consumption. Thus, WTP is negatively affected by the current consumption of GE. This result may be further explained by the environmental attitude of European citizens, as repeatedly highlighted in the Eurobarometers’ surveys.
As expected, the deep and prolonged global economic downturns have significantly altered consumers’ long-run perceptions, and inevitably, they have changed citizens’ spending decisions. Indeed, pre-crisis preferences seem more supportive of a GE project. Information also seems to be a crucial factor in forming preferences given that citizens who are well informed about the uncertainties that characterize GE production are more supportive than those who are not well informed.
These results suggest that in the future, WTP for GE could positively change, and in fact, the end of the economic downturn combined with a carefully designed and detailed information campaign could facilitate target achievement.
With respect to policy implications, our findings support the view that, worldwide, the existing consensus regarding the development of RES use in electricity production is appreciable.
In monetary value, this consensus is estimated to range from 23% to 72% of investment required to achieve the global policy scenario labeled as WSS.
Given that average data hide existing differences among continents and countries with respect to income, GE consumption, lifestyle and resource endowments, unearthing these differences requires a deep analysis that focuses on regional differences.


