1. Introduction
The general issue of the sustainability of geothermal energy conversion systems (GECS, [
1]) deserves attention and careful investigation. Geothermal energy is commonly seen as a renewable resource; moreover, it is not hindered by common problems of renewables (such as solar, wind or wave energy systems). The resource is rather more concentrated (the unit size of the power plants typically ranges from 1 to 60 MWe) than distributed; it is not subject to randomness or to periodicity of availability. Consequently, GECSs achieve significant records in terms of operability (often in excess of 7000 h/year), and are appreciated as intensive and effective load stabilizers on the electric grid, which is often severely challenged by the increased relevance of renewables.
In reality, only a careful cultivation of the geothermal field can be able to guarantee a significant lifetime for the GECS; the issue of sustainability and classification as renewable is primarily linked to the reservoir water balance. This last has improved significantly over the years with the extensive practice of condensate reinjection. However, relevant sustainability issues are linked to side effects, such as the release of non-condensable gases (NCGs), with associated environmental and sanitary impact, subsidence and micro-seismicity. The effects on landscape and use of land should also be considered, as these systems are often located in valuable natural sites [
2]. These sustainability issues are typically classified at a local scale; it must be stressed that these issues have been largely mitigated by correct cultivation of the reservoir and by the introduction of emissions treatment [
3]. However, also from the global climate point of view, GECS provide a contribution which can be quantified at an average of about 122 g CO
2/kWh (with much larger values possible depending on the specific site and on the conversion technology [
4,
5]). The fact that the source of the emission is natural is undeniable; however, the release of CO
2 with the NCGs takes place at high concentrations (exceeding 90%) and inside industrial areas (typically at the cooling tower), which would render attractive the application of carbon sequestration and storage (CCS), or at least of “avoiding emissions”.
The general matter of the environmental sustainability of GECSs has been addressed using life cycle analysis as an evaluation tool [
4,
6,
7,
8]; specific studies have been applied to enhanced geothermal systems [
9] or small hybrid solar/geothermal energy conversion systems [
10]. Recent studies [
4,
6] confirm that only complete reinjection of NCGs would provide a positive answer in terms of definite improvement of the sustainability issue—bearing in mind that any human activity produces effects on the environment, and that the question is rather that of conjugating sustainable development with documented and transparent policies, rather than pursuing an unachievable objective of zero environmental balance.
2. Case Study (Mount Amiata, Italy)—Baseline
Even if the nature of contaminants is relatively similar with frequent presence of H
2S, NH
3, CH
4, and Hg in some cases [
6,
7,
8,
11], the properties of the reservoir and of the geothermal fluid are variable in terms of pressure, temperature, state of the fluid, and amount and composition of NCGs as well as of dissolved mineral salts. Each potential location thus deserves careful study, possibly leading to different issues in terms of best technology for utilization of the resource and profitability. A common guideline is that the rights of the local population should be considered, and that transparent and certified reporting schemes are adopted for social acceptance [
12].
In this specific case, the area of Mount Amiata, Italy was chosen as a significantly challenging application. The area has been recognized since a long time as having a considerable potential for the development of geothermal energy conversion systems; currently, about 120 MW of geothermal electricity are already in production, with the very recent addition of the 40 MWe Bagnore 4 power station. The Amiata reservoir is water-dominated [
13,
14]; the current technology applies single or double-flash direct utilization of the geo-fluid. The composition of this last includes relevant amounts of NCGs (CO
2, H
2S, CH
4), mercury sulfide HgS (Mt. Amiata was one of the most famous mining sites for Hg ore) and dissolved salts (mainly stibnite and silica salts). The deep reservoir is located at a depth of 3000–3500 m, providing supercritical pressure conditions (pressure higher than 250 bar); however, it should be pointed out that the fluid is not in critical condition, since the reservoir temperature is in the range of 300–350 °C. These conditions determine flashing in the well at a depth between 800 and 1500 m, with two-phase flow in the upper section; typically a throttling valve with separator is applied at the well head [
1,
15]. Even if the geothermal potential of Mt. Amiata appears very attractive, local opposition is present against further development of this type of plants, the main concerns of opponents being long-term sanitary effects (mainly traceable to Hg and H
2S emissions, even after the introduction of catalytic gas treatment), as well as the water balance and the greenhouse gas emissions. Within this context it makes sense to explore different options for utilization of the resource, which could mitigate these specific issues and foster an accurate discussion focused on technical matters, trying to develop a public-shared approach to sustainable development.
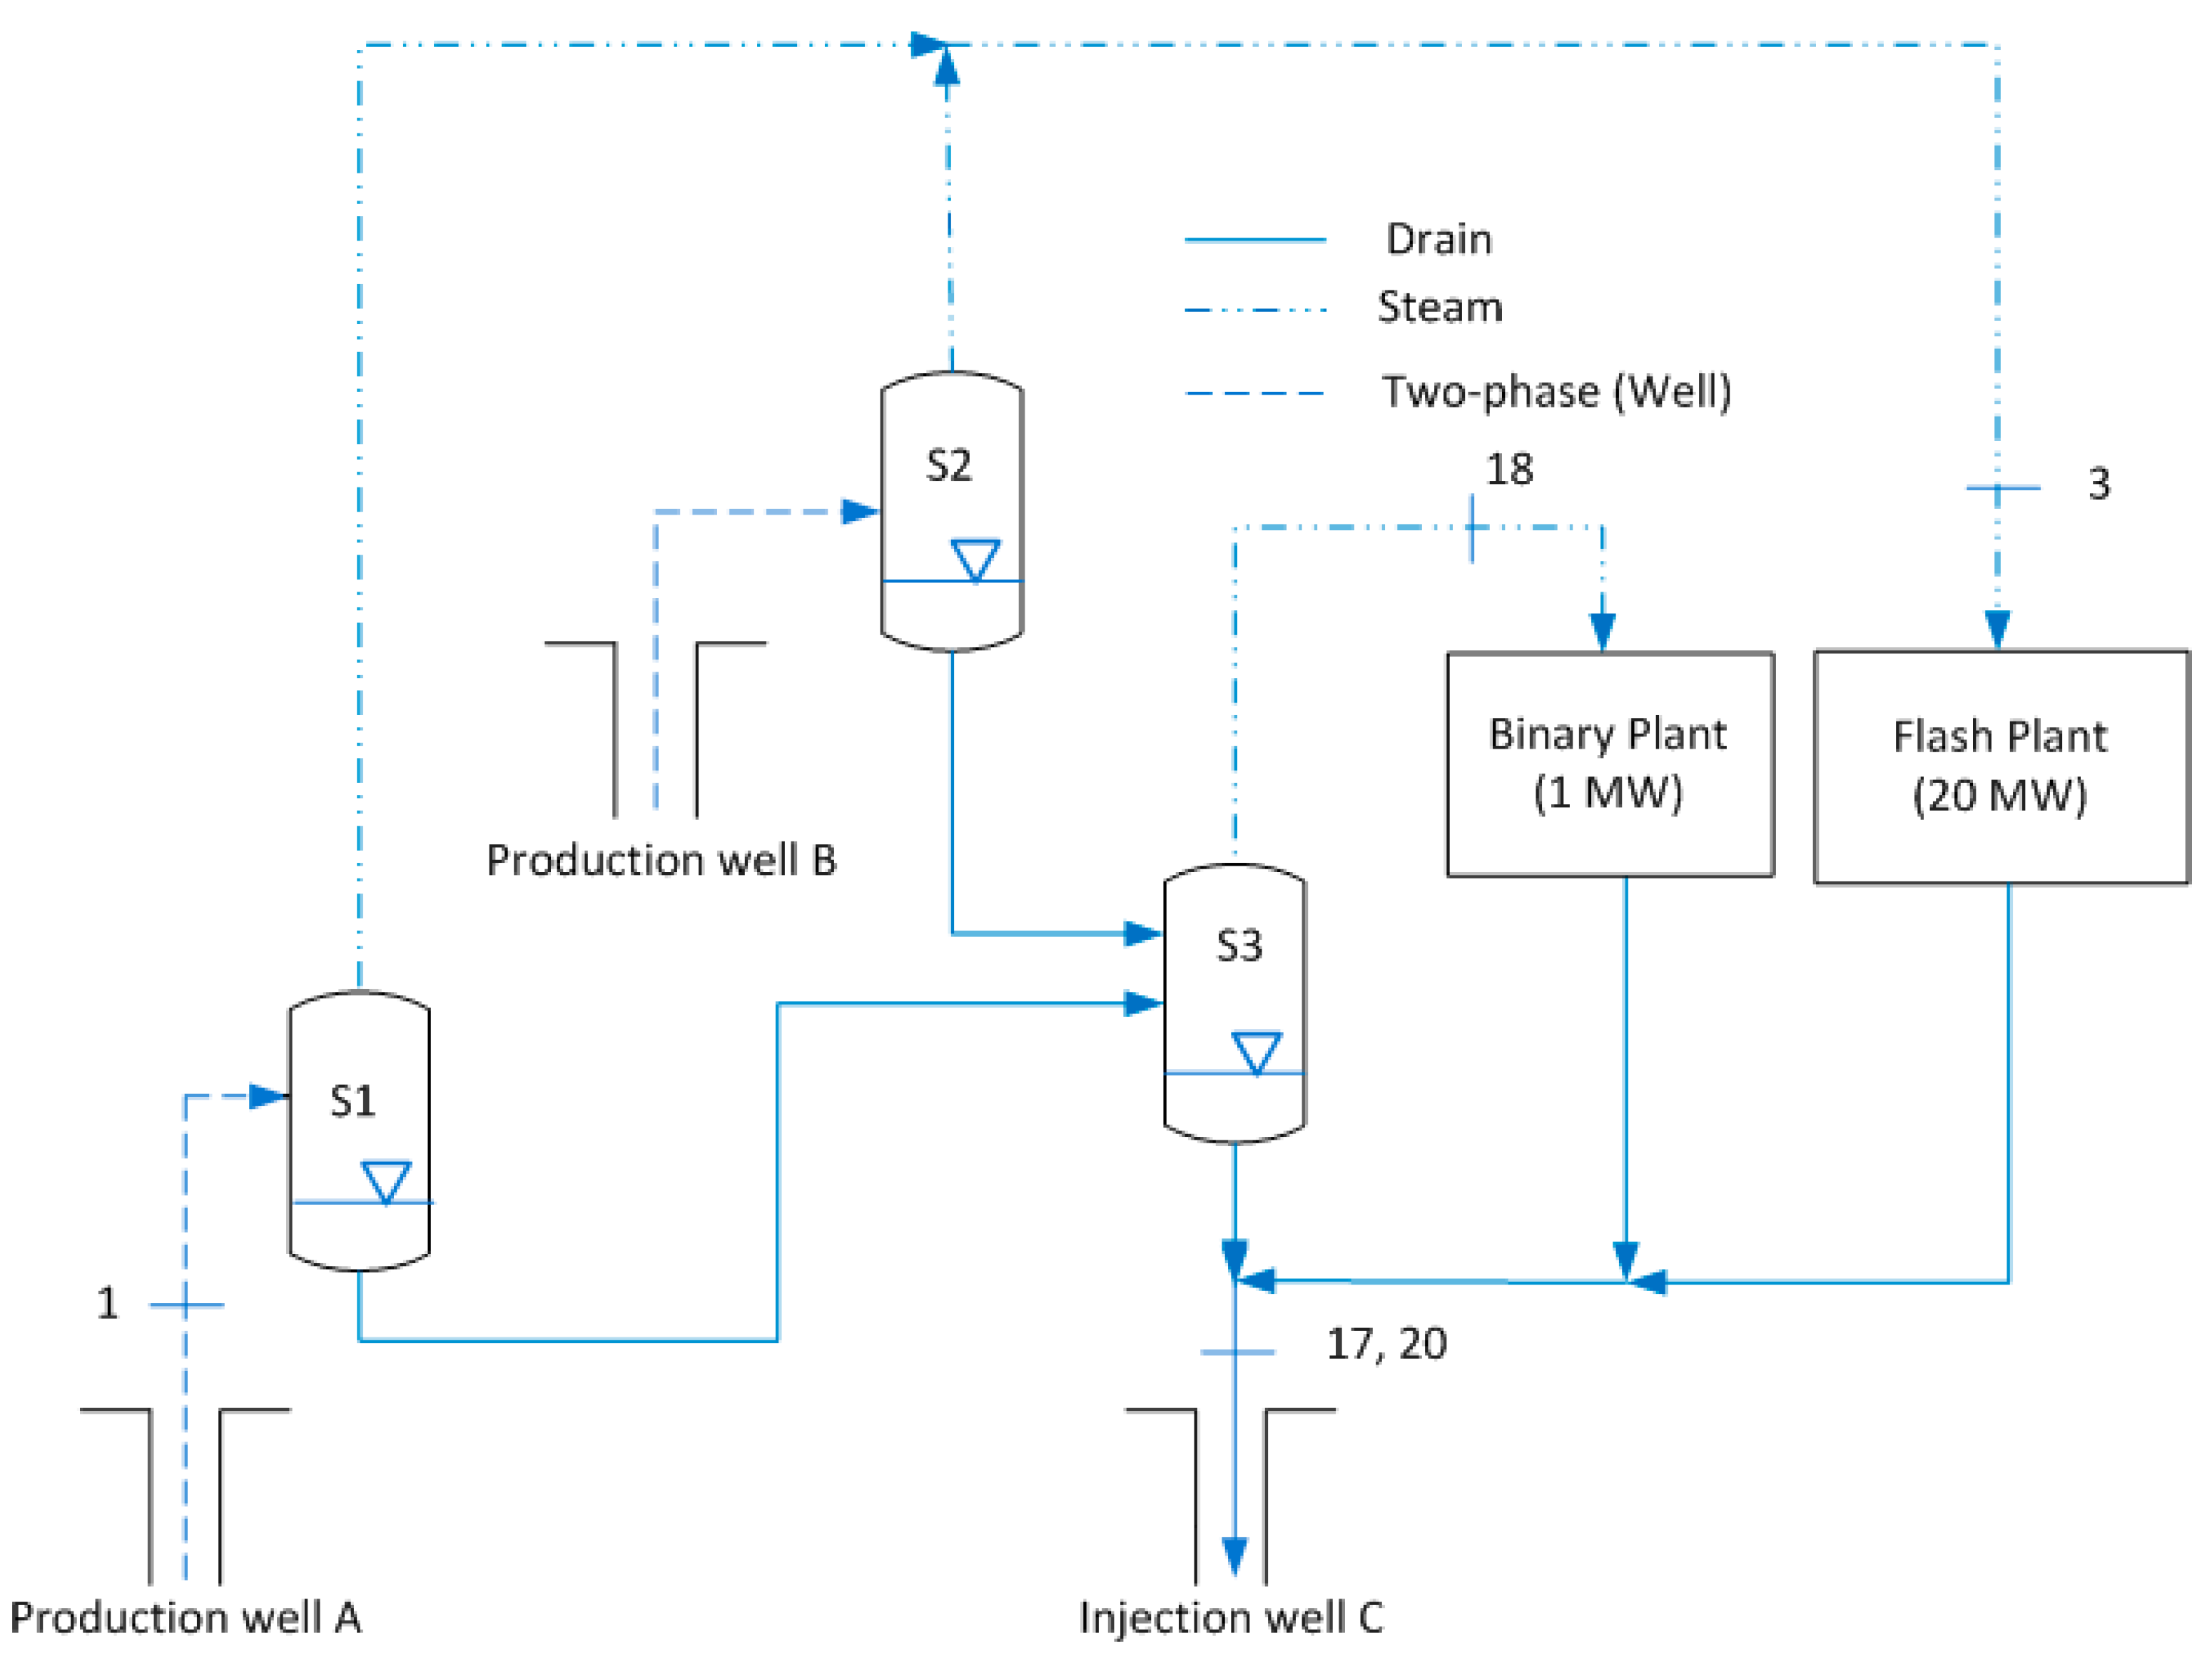
As a specific reference case, the Bagnore 3 power plant was considered. This is a medium-size power plant, designed as a single-flash unit; recently, it was refurbished adding a second flash feeding a bottoming ORC binary cycle, according to the simplified power plant layout shown in
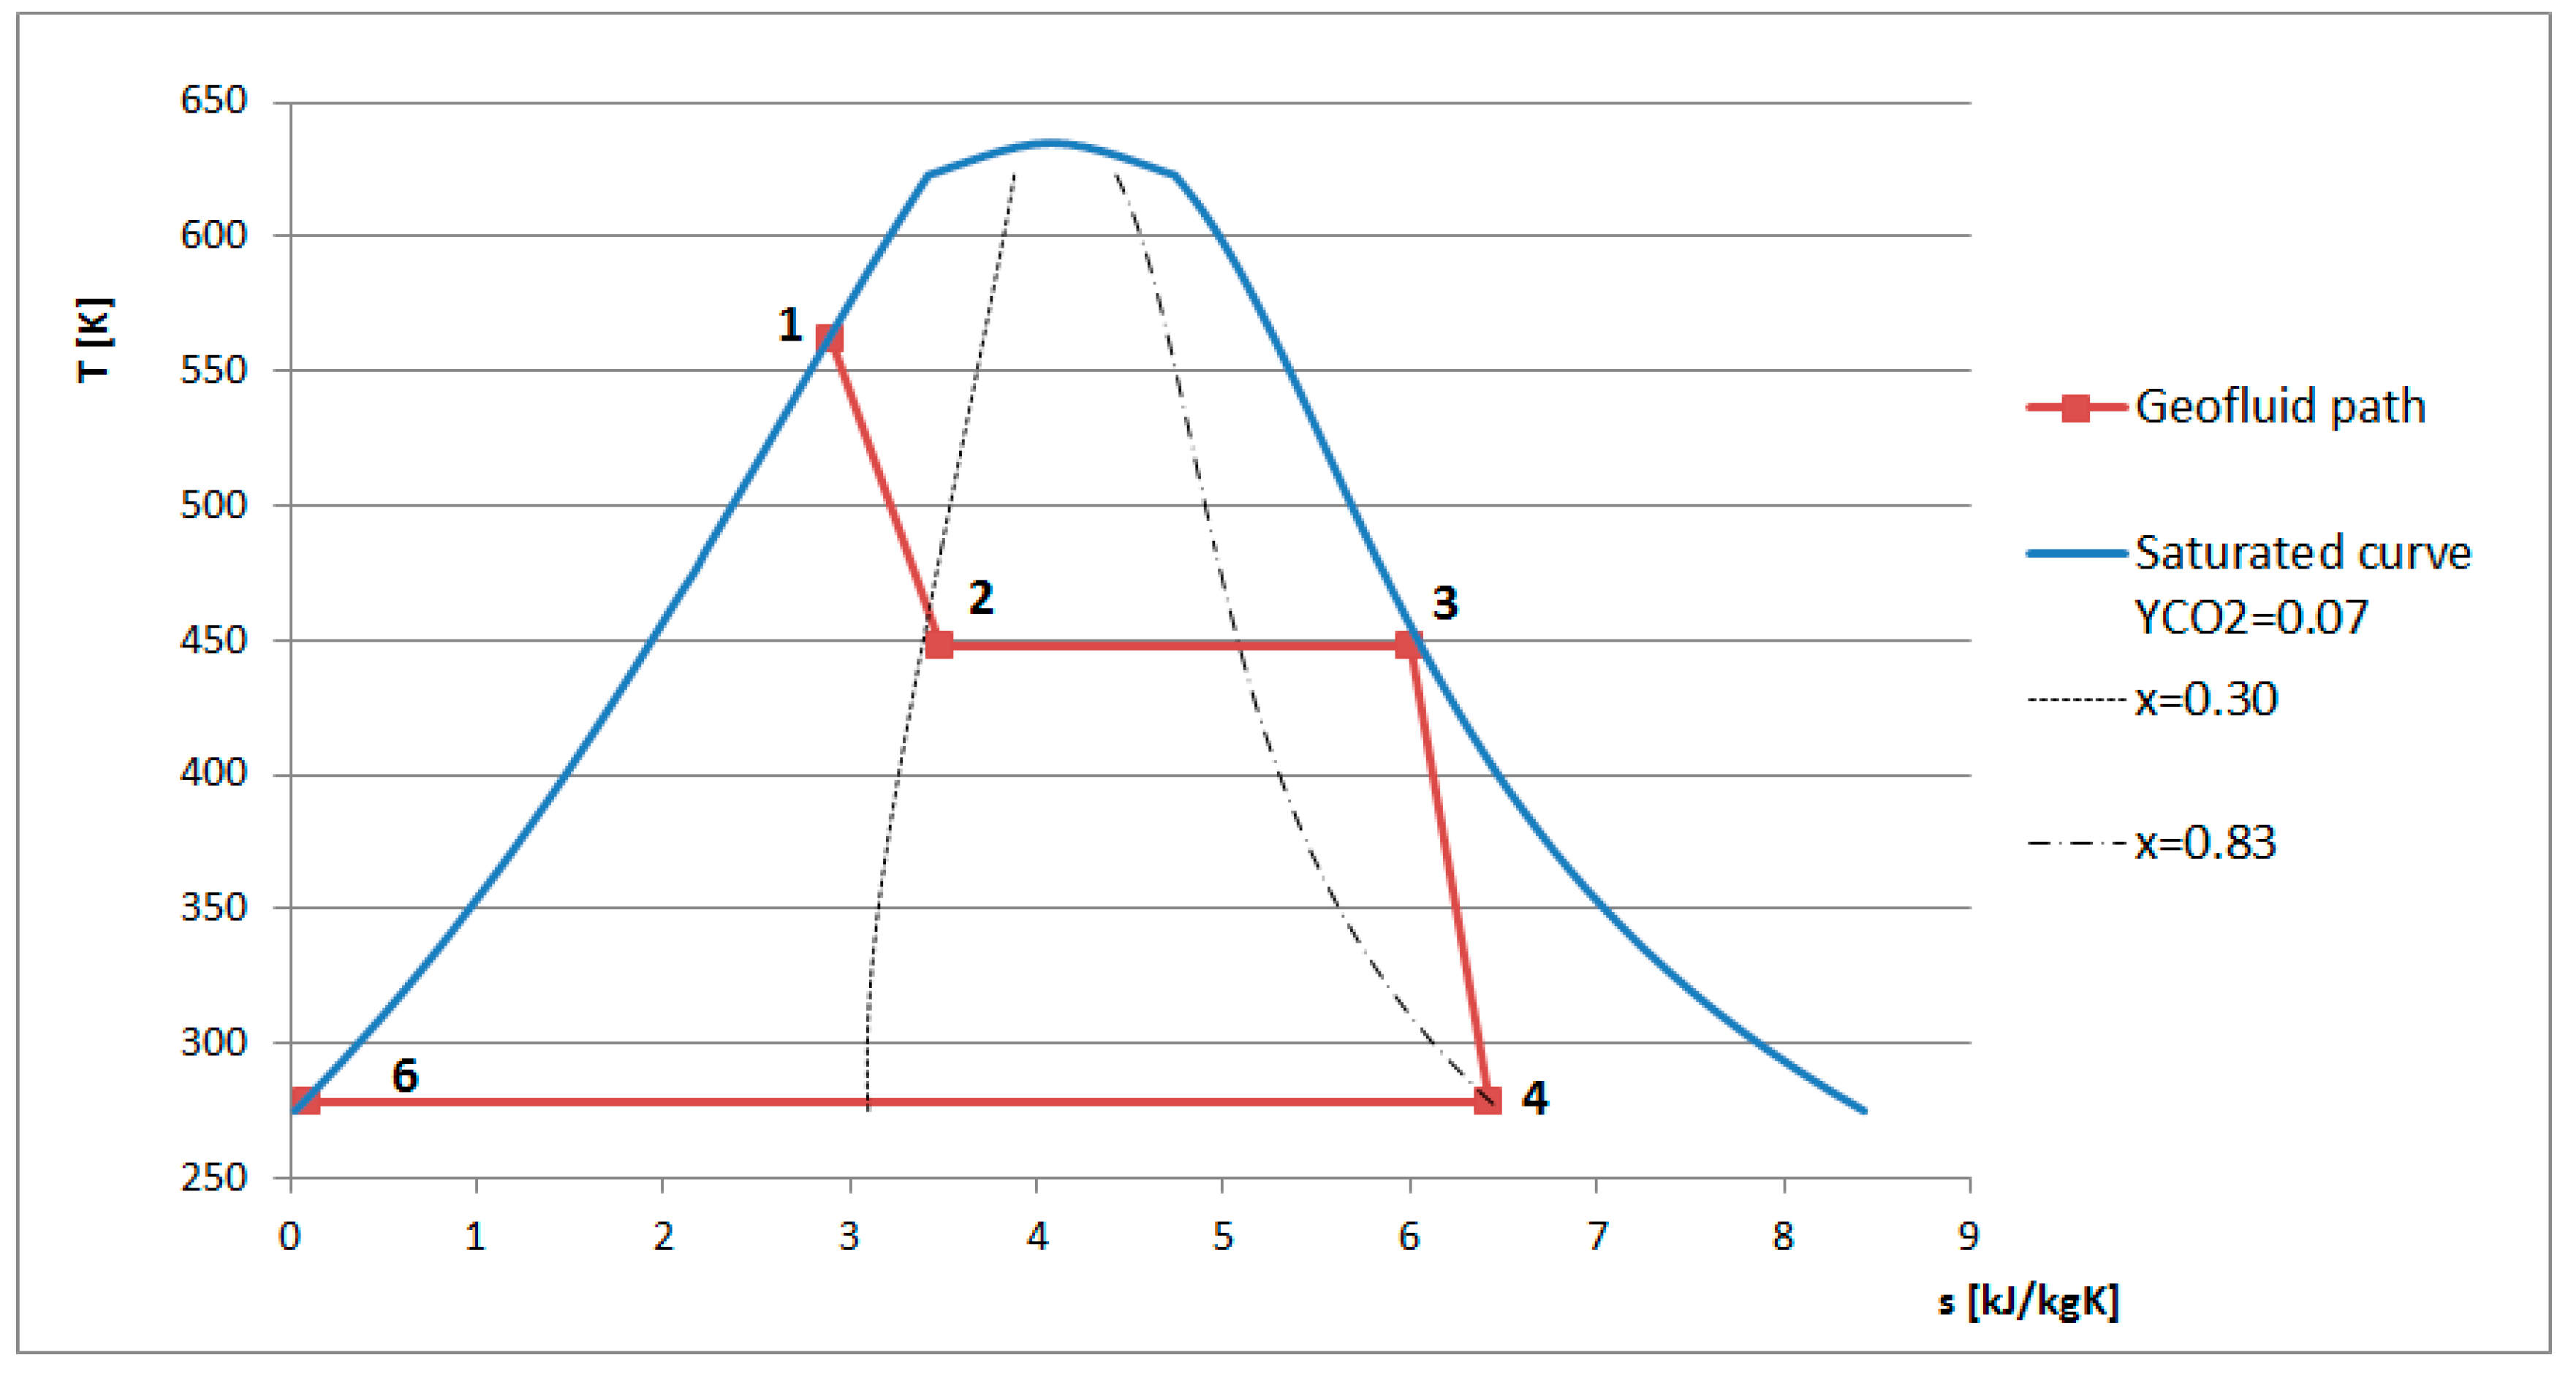
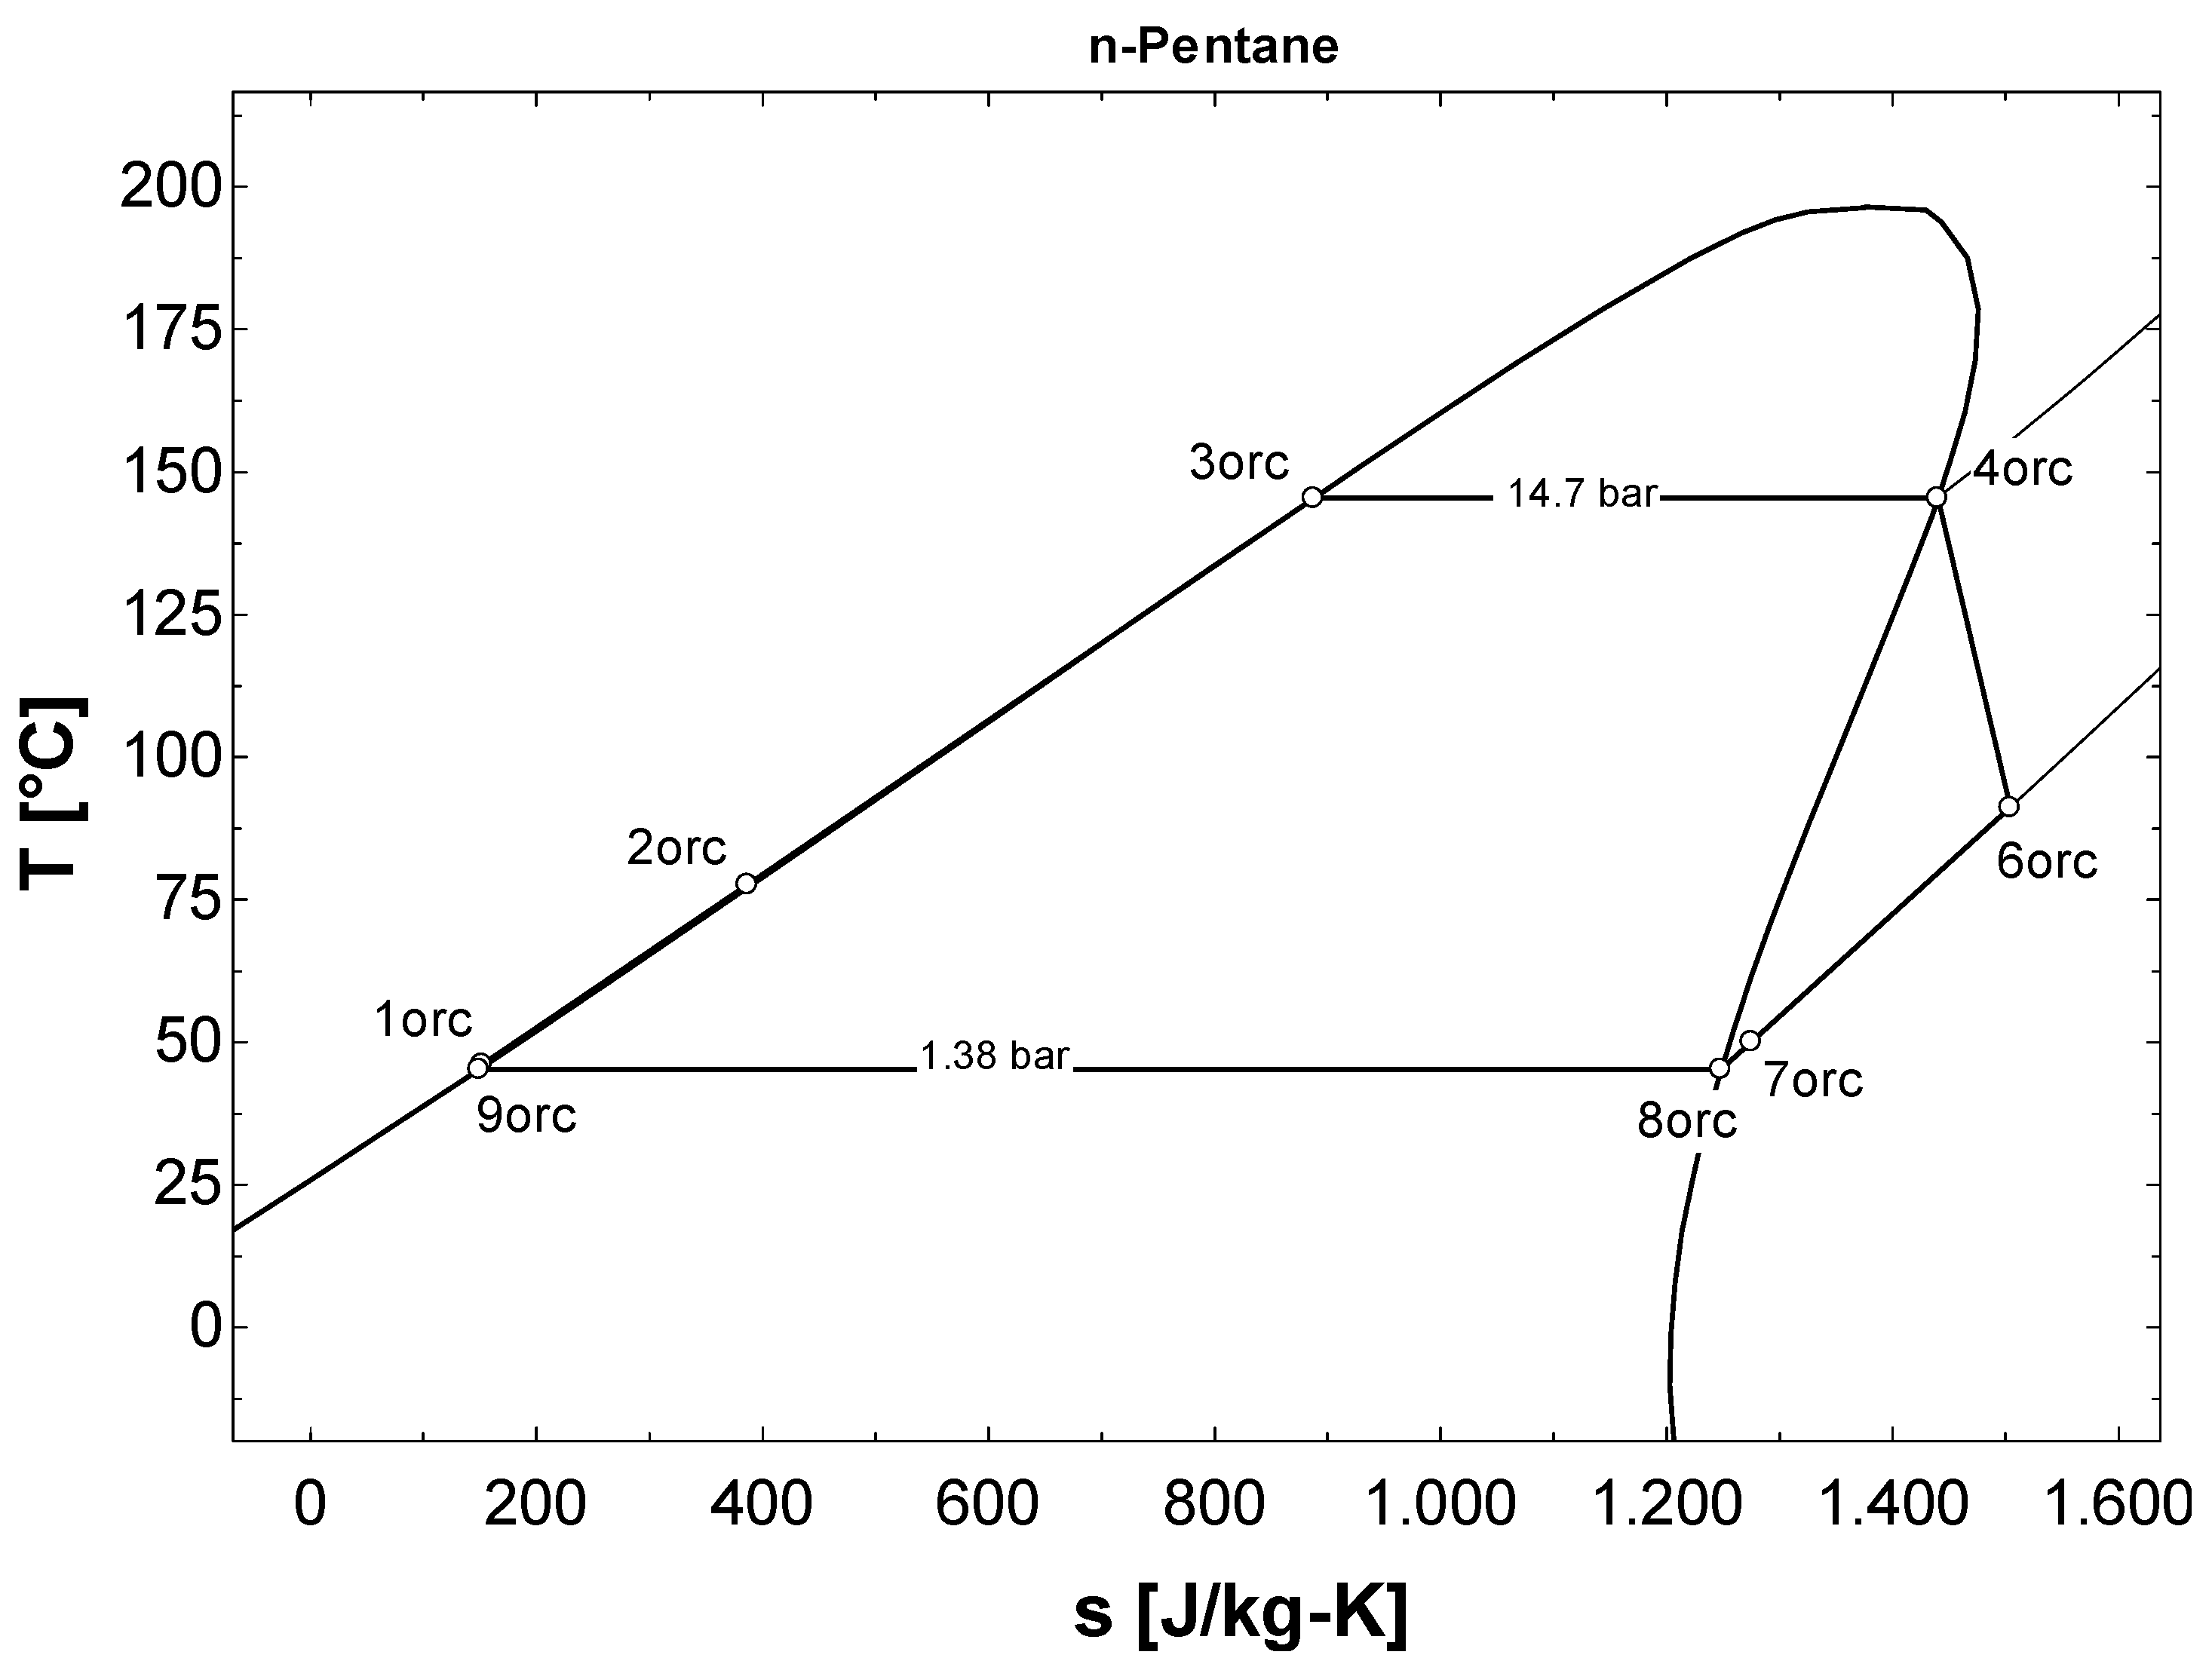
Figure 1. The second flash takes place at a pressure of 5.5 bar, thus ensuring that the liquid fraction has a temperature exceeding 150 °C, which is necessary to prevent stibnite and silica scaling in the reinjection well. For this application (dry steam at 5.5 bar, to be reinjected after condensation) the optimum fluid for the ORC resulted to be n-pentane, with dry conditions at ORC turbine inlet. The resulting T-s diagrams are shown in
Figure 2 and
Figure 3. At present, the power of the ORC section is limited to 1 MWe as only a part of the condensate brine is collected and directed at S3.
Figure 1.
Simplified BG3 plant schematic (present conditions).
Figure 1.
Simplified BG3 plant schematic (present conditions).
Figure 2.
BG3 simple flash steam cycle.
Figure 2.
BG3 simple flash steam cycle.
Figure 3.
BG3 ORC cycle (n-Pentane, saturated turbine inlet).
Figure 3.
BG3 ORC cycle (n-Pentane, saturated turbine inlet).
BG3 has thus evolved in time from a simple single-flash power plant to a hybrid flash/ORC unit (presently with limited power from the ORC), with a plant layout comparable to that developed by ORMAT in the Hawaii islands [
16].
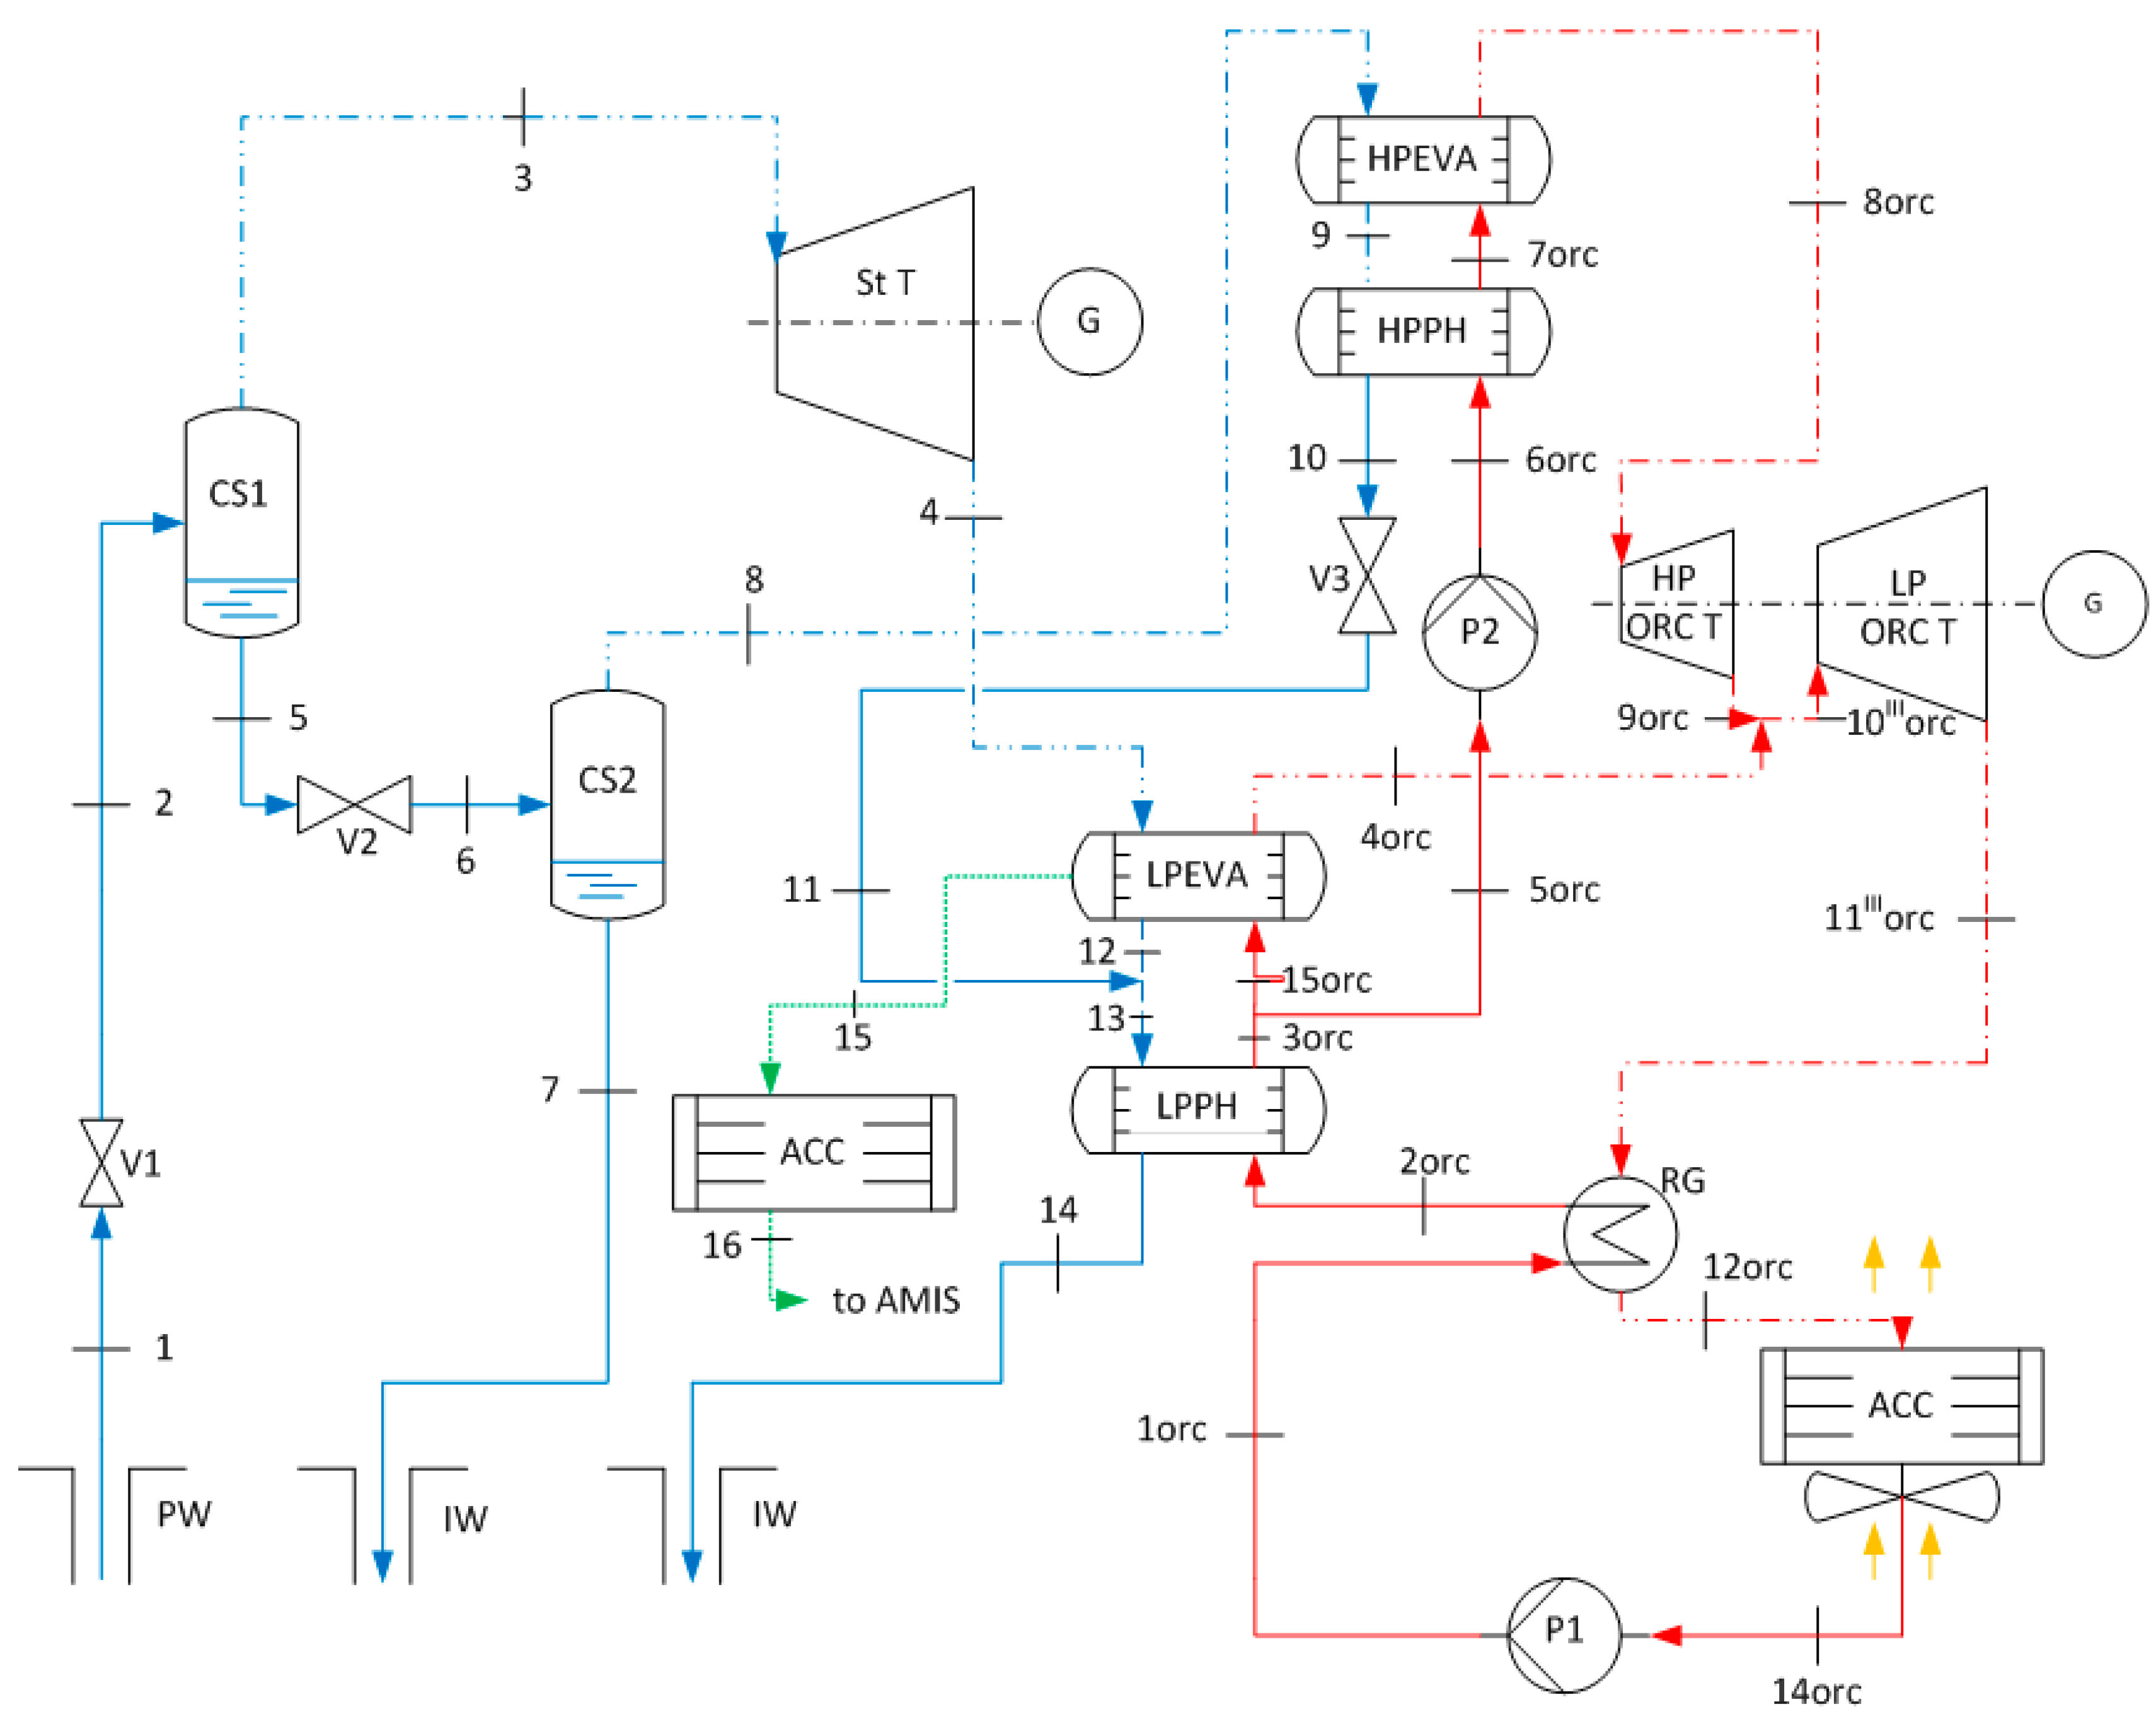
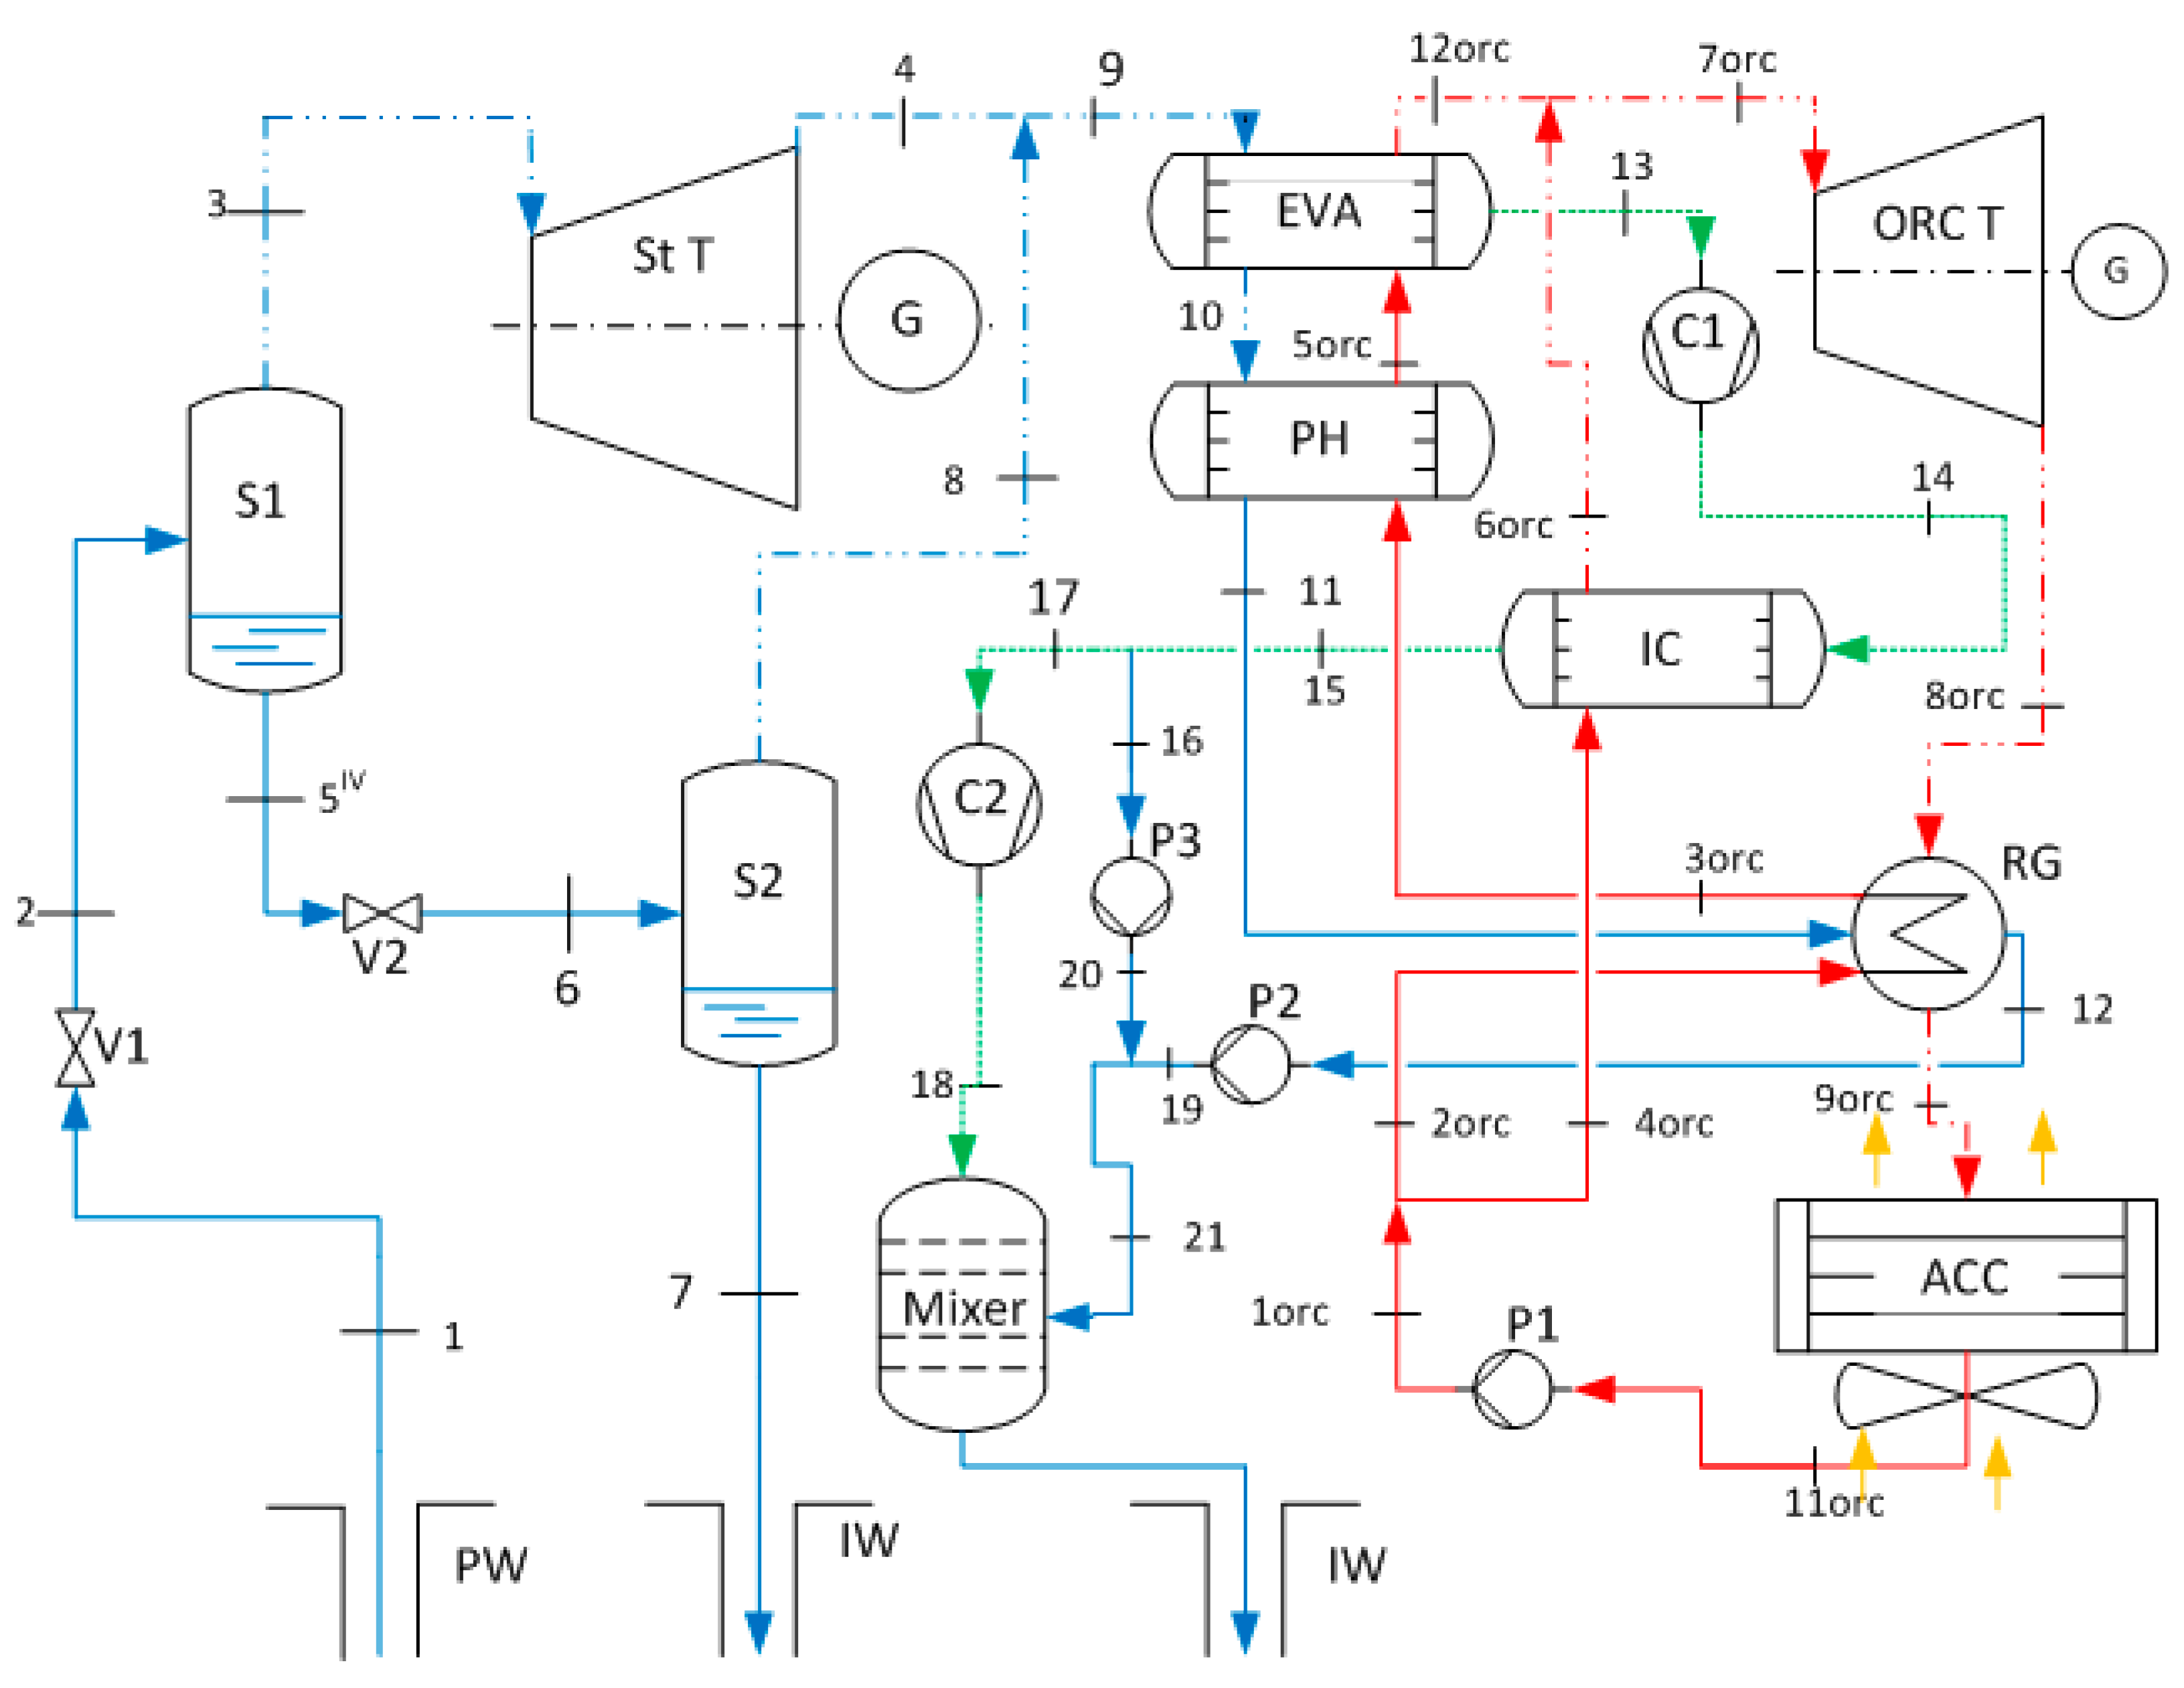
Figure 4 shows a detailed schematic of the flash and binary (ORC) section, which was used for thermodynamic calculations. Considering the possibility of directing to heat recovery in the ORC section all the liquid flow rate produced by S1 and S2, the ORC section is able to produce a larger power output (about 4 MWe as resulted from calculations). This represents the baseline case for considering different plant layouts.
Figure 4.
Plant layout (Baseline) showing components and calculation points.
Figure 4.
Plant layout (Baseline) showing components and calculation points.
3. Governing Equations (Baseline)
The governing equations are typical mass and energy balances that are used in the literature [
1]; the model includes the complete treatment of the thermodynamic properties of the geo-fluid (considered a real-fluid mixture of H
2O and CO
2, with pure substance properties provided by the EES software libraries [
17]), and the calculation of the flow of exergy for all the relevant streams. As in [
18], the single species were treated as real fluids; for the mixture, however, relations for ideal gas mixtures were applied, neglecting chemical interaction of different species and considering that the partial pressures are much lower than the critical pressures of the species involved.
Starting from the well head, the main throttling process is treated as isenthalpic:
The values of enthalpy are calculated referring to the mixture,
h = h (YCO2,
T,
p). Setting the separator pressure p
2 = 20 bar, with h
1 = 1443 kJ/kg, the values of x
2, m
3 and
YCO2, 1; YCO2, 3 can be determined using the mass balances:
It is assumed that the whole contents in CO
2 go to the gas phase, that is
. The set of Equations (1)–(5) is solved iteratively (starting from an initial guess assuming pure water in the geo-fluid), leading to the values shown in
Table 1 (
Appendix).
Table 1.
Component power for the hybrid flash/ORC cycle.
Table 1.
Component power for the hybrid flash/ORC cycle.
| Component | | Power (MW) |
|---|
| Steam turbine (gross) | Wst, g | 21.2 |
| Pump 1 | Wp1 | 0.47 |
| Compressor 1 | WC1 | 0.62 |
| Compressor 2 | WC2 | 0.47 |
| Fans | Wfans | 0.18 |
| Steam turbine (net) | Wst, n | 19.46 |
| ORC turbine (gross) | Worc,T,g | 4.04 |
| Pump 2 | Wp2 | 0.19 |
| Pump 3 | Wp3 | 0.15 |
| ORC turbine (net) | WORC, T, n | 3.7 |
| Total work output (net) | Wtot, n | 23.16 |
The conditions of stream 3 correspond to the turbine inlet. At the turbine outlet, the direct-contact condenser DCC maintains a design pressure of p
4 = 0
.08 bar. The expansion process is solved first assuming the isentropic process (
s4s = s3); calculating
h4s = h (YCO2, 4, p4, s4s); and then applying the formula for isentropic efficiency:
The DCC interacts with the cooling tower (CT) and with the intercooled compression, so that a set of mass, mixture composition and energy balances has to be solved (Equations (7) to (12)). Some stream conditions are known from design operation data: m
6 = 1697 kg
/s, T
6 = 35 °C; m
9 = 111 kg
/s, T
9 = T
8 = 25 °C (converged value); T
10 = T
8 + 5°C; p
12 = 0.23 bar. The composition of the gas stream at point 10 is calculated applying Dalton’s law relating molar flow rates to partial pressures:
It is thus possible to calculate:
The conditions at compressor inlet are assumed to be saturated vapor + CO
2; again, the compression process is modeled assuming first an isentropic transformation for the H
2O-CO
2 mixture at point 10: (
s12s = s10); calculating
h12s = h(YCO2, 10, p12, s12s); and then applying the formula for the compressor isentropic efficiency:
A similar procedure is applied for the second compression stage, passing from p13 = p12 to p14 = pa.
The IC mass and energy balances are respectively:
and for the condenser:
Equation (13) is applied to recalculate T8, and the whole set of Equations (7) to (13) is iterated until convergence on T8 is achieved. For the cooling tower CT, the baseline case uses a wet unit, for which saturated humid air conditions at tower discharge were assumed.
The ORC cycle works on a saturated n-Pentane cycle fed from the secondary flash CS2, which operates at 5.5 bar (thus ensuring a temperature of 150 °C for the high-salinity liquid stream 17, necessary to avoid stibnite and silicate scaling). The water vapor stream
= 10.3 kg/s provides heat for the ORC evaporator and preheater. The reinjection stream
=
can reach lower temperatures; in the present study, a value of
= 80 °C was assumed (a high value considering that regenerative preheating is also applied in the ORC, and that the thermal equilibrium of the reservoir should also be preserved as far as possible; stream
could also be made available for low-temperature cogeneration of heat and power). Assuming a value of the pinch temperature difference at evaporator outlet
= 10 °C, the energy balances of the EVA and PH2 can be written as:
Assuming
= 1, and
= 0, Equation (14) determines
, and Equation (15) determines the value of
. The ORC recuperator energy balance is:
Conditions at point 6 ORC are determined applying the already described procedure for the model of expansion, assuming
0. The ORC condenser is cooled by means of a flow rate of
= 521 kg/s provided by the cooling tower, with the following energy balance:
5. Power Plant Arrangements for Improved Sustainability
Among several possibilities for the improvement of the BG3 power plant performance, a preliminary study allowed the selection of those potentially producing the most appealing issues from the point of view of sustainability. Double- or multiple-flash arrangements, including attractive, complex regenerative heat recovery schemes [
20] are not here considered, because the BG3 architecture is already oriented toward the hybridization of a single-flash power plant through addition of an ORC cycle. Moreover, the well flow rate was maintained for all simulations at 121.9 kg/s, with a primary flash at 20 bar: this corresponds to optimal conditions for the present layout according to the well productivity curve, which should be marginally affected by the proposed layout improvements. These last are presented hereafter; the mass and energy balances are similar to those presented for the baseline case—with the necessary changes—and are not discussed in detail. The results are presented in the concluding section.
5.1. LB-ORC Option
As a first alternative, the possibility of avoiding the second flash was considered; instead, it is possible to feed the ORC section just by cooling the whole brine flow rate from S1/S2. This arrangement will be called LB-ORC (liquid-brine ORC). This leads to a more challenging heat recovery network for feeding the ORC section, which has to deal with a large flow rate of liquid, instead of the favorable conditions provided by the possibility of condensing a dry steam flow rate. Also in this case, the limit temperature for geo-fluid brine reinjection were maintained at 150 °C in order to avoid precipitation of salts in the reinjection well. The potential attractiveness of the LB-ORC option is in the simplification of the layout and in the potential larger power output (at the price of increased heat transfer surface). The modified part of the layout is shown in
Figure 5.
Figure 5.
LB-ORC modified layout.
Figure 5.
LB-ORC modified layout.
With the LB-ORC layout, it was necessary to reconsider the fluid selection, as the temperature profile is completely changed on the resource side. Considering the convenience of avoiding superheating of the ORC working fluid, and the lower power absorbed by the ORC pump, n-hexane turned out to be the best option for this temperature range. The resulting ORC cycle is shown in
Figure 6.
Figure 6.
LB-ORC: n-hexane T-s diagram.
Figure 6.
LB-ORC: n-hexane T-s diagram.
The results of the simulation are resumed in
Appendix (
Table A3 and
Table A4) for the detail of all cycle thermodynamic points.
5.2. 2P-ORC/BPS Option
The second alternative proposes a dual-pressure ORC cycle (
Figure 7), with the high-temperature section fed by the secondary flash CS2, and the low-temperature section recovering heat at the exhaust of a backpressure steam turbine (2P-ORC/BPS). This option presents several improvements with respect to the baseline case: the sub-atmospheric pressure DCC is avoided, and the backpressure at steam turbine outlet is kept to a suitable level so that it is not necessary to recompress the saturated steam/CO
2 stream in order to extract CO
2 + NCGs and send the stream to the atmospheric AMIS gas treatment; consequently, there is no need of compressors or other type of extraction devices such as ejectors or vacuum pumps. Moreover, having avoided the DCC, the eco-design was pushed to the suppression of the wet cooling tower, which is substituted by a set of air-cooled condensers (ACC), as is usual for binary-only (ORC) power plants. In order to achieve a good recovery of the exhaust heat from the backpressure steam turbine, a two-pressure-level ORC is proposed, with the high-pressure ORC turbine fed by the flash separator CS2, while the low-pressure ORC section recovers low-grade heat from the backpressure steam turbine. For the 2P-ORC/BPS option, the choice of the level of backpressure p
4 at the steam turbine outlet is fundamental.
Figure 7.
2P-ORC/BPS cycle layout.
Figure 7.
2P-ORC/BPS cycle layout.
Figure 8 shows the effect of variable p
4 on the overall plant power output. It is evident that the correct choice of the ORC working fluid plays an important role; n-hexane proved to be the best choice (
Figure 8). In order to avoid recompression of NCGs, it was decided to accept a low (but larger than atmospheric) value of p
4 = 1.5 bar. This means that the LPEVA is not just a shell-and-tube heat exchanger, but it also plays the role of the deaerator in a steam power plant, allowing natural discharge to the ambient (or to the gas treatment line) of the gas stream under simple throttle control. Consequently, sizing of this component should consider not only heat but also mass transfer criteria, allowing the steam/NCG stream a sufficient residence time to allow removal of the NCGs by throttling to the atmosphere.
Figure 8.
2P-ORC/BPS: effect of backpressure level p4.
Figure 8.
2P-ORC/BPS: effect of backpressure level p4.
The results of the simulation for the 2P-ORC/BPS cycle layout are resumed in
Appendix (
Table A5 and
Table A6) reporting the details of all cycle thermodynamic points.
5.3. ORC/BPS/TR Option
The last option here considered is an evolution of the 2P-ORC/BPS, including total reinjection of the geo-fluid (including NCGs). It was already stressed that 2P-ORC/BPS already made it possible to route the NCG stream directly to the atmospheric AMIS gas treatment; alternatively, it is possible to consider the option of compressing the NCGs and reinjecting them into the liquid stream with a suitable mixing device (surface or borehole mixing chamber at the injection well IW). Of course, in this case, the response of the reservoir should be accurately studied in order to avoid having a gas bubble form inside the field, or the NCG stream finding a direct way to the production well (PW). The modified schematic of the ORC/BPS/TR option is shown in
Figure 9.
A key issue for the ORC/BPS/TR solution is limiting the power of the compressor train (C1/C2), which is large; to obtain this, a substantial backpressure should be allowed at the discharge of the steam turbine. Under these conditions, the steam section produces less power; however, the better exhaust steam conditions led us to consider a single-pressure n-hexane ORC solution once again. Moreover, in order to limit the compressor work, an intercooler IC is proposed between the two compressors, with the IC heat completely recovered by regenerative pre-heating of a secondary stream diverted from the main ORC line (points 4 and 6 ORC). The mass flow rate of the diverted stream is determined by applying heat capacity matching principles (pinch analysis) of the IC on the two sides (NCGS and organic fluid). The regenerator (RG) becomes a six-stream heat exchanger, with three circuits: condensed geo-fluid, cold and hot ORC working fluid.
Figure 9.
ORC/BPS/TR cycle layout.
Figure 9.
ORC/BPS/TR cycle layout.
It is worth reporting some additional equations for energy balance:
A relevant issue that has a direct influence on the compressor work is the evaluation of the correct conditions for NCGs reinjection, that is, those allowing a safe and stable solution into the liquid condensate stream
. In the present case, an empirical rule was applied, stating that the volume flow rate of the NCGs which it is possible to dissolve in the condensate is about half that of the liquid stream:
This equation, together with the mass and energy balances, allows us to evaluate the mass flow rate of the compressor train, to determine the thermodynamic conditions in all points, and to calculate the power rating of all equipment. It is emphasized that Equation (22) would require a set of field tests for complete validation; here it is used only to provide a first idea of what the power operating cost of gas reinjection would be.
The results of the simulation for the ORC/BPS/TR cycle layout are summarized in
Appendix (
Table A7 and
Table A8) reporting the detail of all cycle thermodynamic points.
6. Comparison of Results for Different Power Plant Arrangements
Table 2 provides a comparison of the four power plant arrangements considered in terms of power and heat flows in the key components.
Table 2.
Comparison of power and heat rates in key power plant components.
Table 2.
Comparison of power and heat rates in key power plant components.
| Powers/Heat Rate (MW) | Baseline | LB-ORC | 2PORC/BPS | ORC/BPS/TR |
|---|
| 21.2 | 21.2 | 11.77 | 6.21 |
| - | - | 1.62 | - |
| - | - | 7.93 | - |
| 4.04 | 4.36 | 9.55 | 17.0 |
| 25.23 | 25.56 | 21.31 | 23.22 |
| 0.47 | 0.47 | 0.09 | 0.36 |
| 0.19 | 0.13 | 0.06 | 0.33 |
| 0.15 | 0.06 | - | 0.08 |
| 0.18 | 0.18 | 1.24 | 2.21 |
| 0.62 | 0.62 | - | 2.14 |
| 0.47 | 0.47 | - | 0.50 |
| 2.08 | 1.94 | 1.39 | 5.58 |
| 23.16 | 23.64 | 19.92 | 17.63 |
| 13.62 | 10.05 | - | 53.76 |
| 11.36 | 11.28 | - | 20.01 |
| - | - | 45.71 | - |
| - | - | 14.02 | - |
| - | - | 16.16 | - |
| - | - | 7.51 | - |
| 4.63 | 6.15 | 12.02 | 31.1 |
| - | - | - | 25.87 |
| 21.14 | 17.56 | - | - |
| - | - | 86.0 | 91.06 |
In order to evaluate the performance and detect the potential for improvement at system and component level, an exergy analysis was applied [
1,
21,
22]. For each i-th stream, the overall value of exergy was calculated as:
For the H2O-CO2 mixture, reduction to homogeneous reference conditions (pure water) was performed before applying Equation (24).
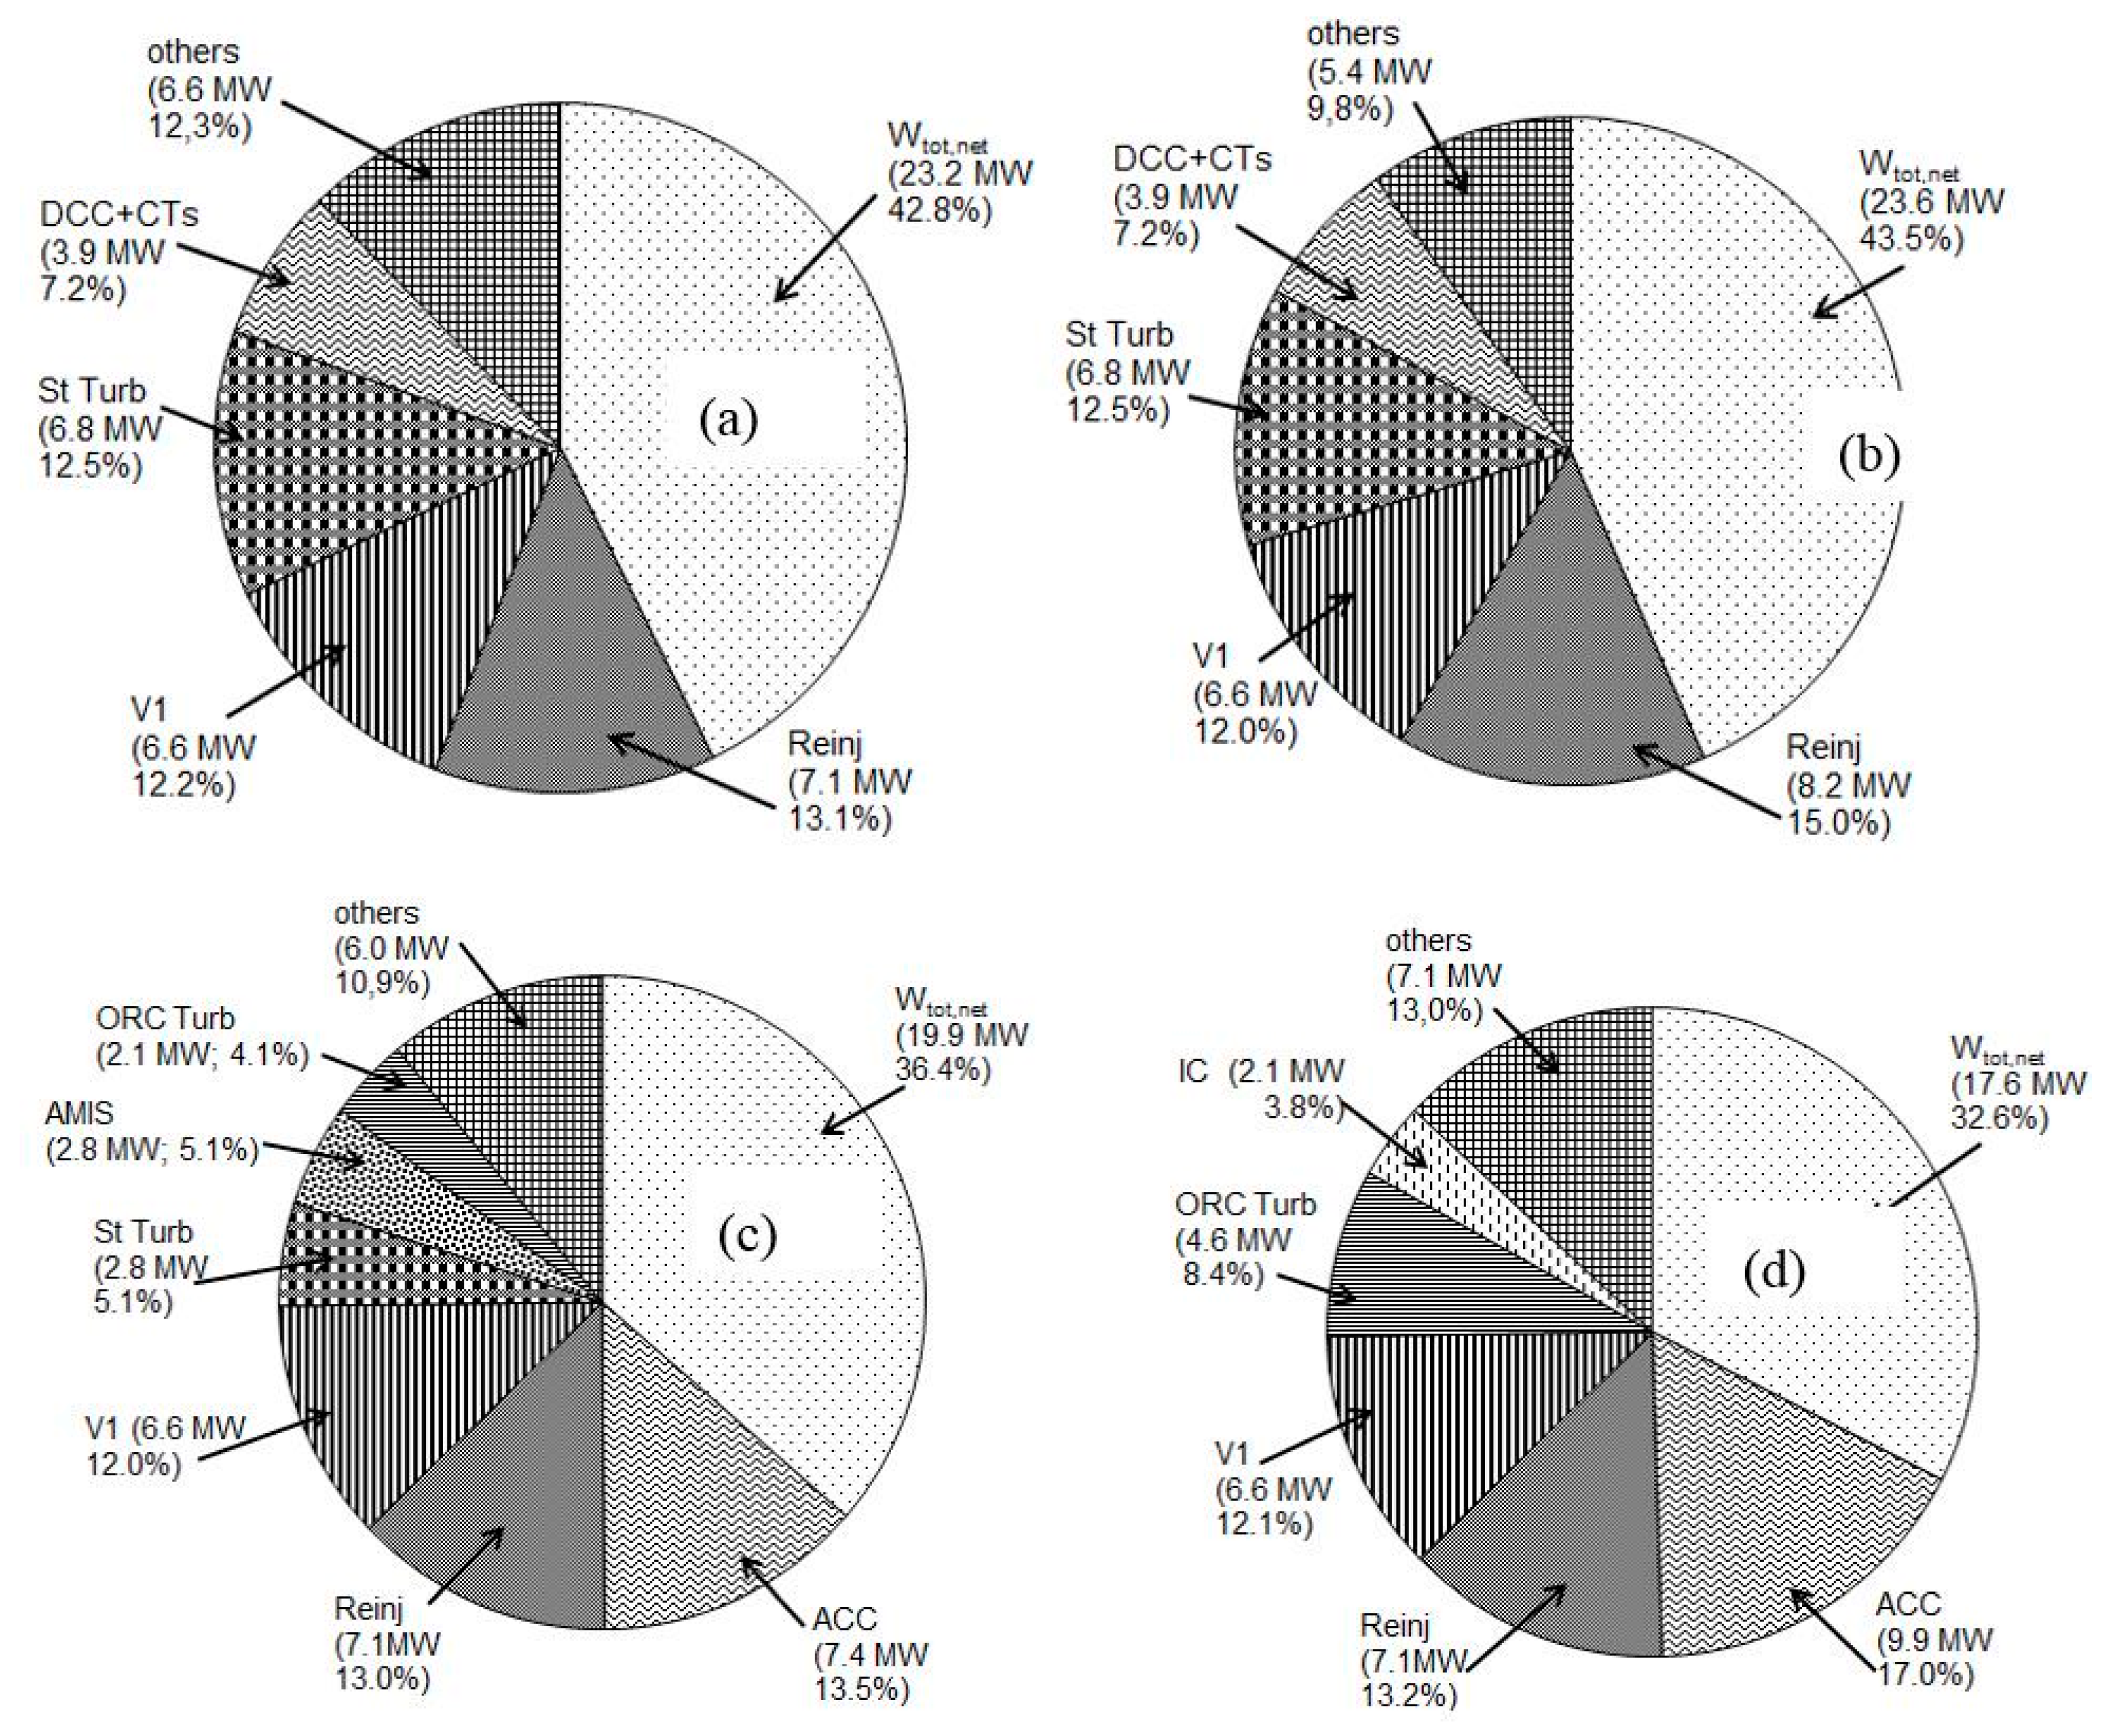
The exergy analysis allows us to compare the different sources of irreversibility; following [
22], exergy destructions were separated from exergy losses (connected to direct release of sensible heat or valuable streams to the environment). The results are summarized in
Figure 10a–d.
Figure 10.
Exergy balances: destructions, losses and power output. (a) = Baseline; (b) = 2P-ORC/BPS; (c) = ORC/BPS/TR; (d) = ORC/BPS/TR.
Figure 10.
Exergy balances: destructions, losses and power output. (a) = Baseline; (b) = 2P-ORC/BPS; (c) = ORC/BPS/TR; (d) = ORC/BPS/TR.
It is clear that the improvement of environmental performance is obtained at the expense of power output; the relevance of the steam turbine is progressively decreased, while that of the ORC section is increased. With respect to wet cooling towers with DCCs, air-cooled condensers (ACCs) allow cancellation of a relevant contact point with the atmospheric environment and reduction of the visual impact due to the elimination of the wet plume; however, the adoption of ACCs implies a considerable decrease in power output, and the use of land can be substantially increased, thereby requiring clever architectural solutions for correct landscape integration.
The overall performance of the different options here considered can be evaluated using a suitable set of quantitative indicators. The first-law efficiency is defined as:
The exergy efficiency (or utilization efficiency according to [
21]) can be calculated directly or indirectly as:
A relevant indicator for geothermal power plants is the unit steam flow rate USFR, expressing the flow rate of primary resource needed to produce 1 MJ of electricity. This can be easily obtained as:
Finally, the environmental performance is measured by the emissions (CO
2, H
2S, Hg) referred to the production of the unit of electricity (1 kWh). In all cases where gas treatment is present, the overall abatement efficiency was taken from published data of the local environmental authority, adapted from the single-flash power plant operational in 2008 ([
19]) considering the overall flow rate of NCGs.
A summary of the performance of the four options here considered is presented in
Table 3:
Table 3.
Overall performance of the four power plant options.
Table 3.
Overall performance of the four power plant options.
| Parameter | u.m. | Baseline | LB-ORC | 2PORC/BPS | ORC/BPS/TR |
|---|
| - | 13.2 | 13.5 | 11.32 | 10.02 |
| - | 42.8 | 43.5 | 36.38 | 32.55 |
| USFR | (kg/s)/kWh | 19.08 | 18.72 | 22.03 | 24.91 |
| EFCO2 | g/kWh | 396 | 388 | 454 | 0 |
| EFH2S | g/kWh | 1.21 | 1.18 | 0.28 | 0 |
| EFHg | mg/kWh | 1.3 | 1.27 | 0.42 | 0 |
7. Conclusions
The main purpose of the present work is evaluating options for the improvement of sustainability issues of geothermal energy conversion, with specific application to a reference case located in the Monte Amiata, Italy resource region.
The baseline case analyzed is a competitive and performing power plant, applying marginal heat recovery from a secondary flash to the original configuration that was designed as a single-flash unit. The power output is about 23 MWe and the first-law and exergy efficiency are respectively 13.2% and 42.8%; the power plant is equipped with a gas treatment (AMIS) section, which guarantees fairly low emissions of H2S and Hg (respectively 1.21 g/kWh and 1.3 mg/kWh). As the geo-fluid is originally rich in CO2, the carbon dioxide emissions amount to 396 g CO2/kWh.
Among the options for performance improvement, the first (LB-ORC) avoids the secondary flash and applies heat recovery to the ORC cycle to the complete brine stream from the first flash. This solution has the main advantage of a marginal improvement to the thermodynamic performance (; ηI = 13.6%). Both the baseline and the LB-ORC schemes are designed with wet cooling towers; this implies that complete reinjection of the geo-fluid cannot be obtained, as part of the condensate leaves the tower as a wet plume with droplet drift; this last is also responsible for marginal transfer of H2S and Hg, which escapes thus the gas treatment section (effective only on the gas phase).
In order to further improve the environmental performance, a hybrid steam/ORC plant designed around a backpressure steam turbine and a two-pressure-level ORC is proposed (2PORC/BPS). The idea is to avoid the compressor power needed for the extraction of CO2 from the vacuum condenser, and also to cancel the H2S and Hg transfer to the liquid condensate phase. In fact, air-cooled condensers are applied for the ORC section, thereby allowing complete recovery of the liquid condensate and eliminating the problem of droplet drift of H2S and Hg. Improved emission figures can be obtained with this plant layout (H2S = 0.28 g/kWh and Hg = 0.42 mg/kWh); however, the performance level is decreased (; ηI = 11.3%;), and the CO2 emissions increase (454 g CO2/kWh).
As a further improvement, the backpressure steam scheme was coupled to a different bottoming ORC layout (ORC/BPS/TR), including recompression of NCGs and their complete reinjection into the liquid condensate stream (in thermodynamic conditions where complete gas dissolution in the liquid can be achieved with suitable equipment). With this last power plant scheme, emissions to the atmosphere (CO2, H2S and Hg) are completely avoided; as could be expected, this is obtained at the price of a considerable reduction in the thermodynamic performance (; ηI = 10%).
The four options analyzed represent conditions optimized with respect to the fundamental design parameters; they were also compared from the point of view of irreversibility, calculating the detailed exergy balance. The results demonstrate that substantial benefits from the point of view of sustainability of geothermal energy systems can be obtained applying different technological solutions; however, this is inevitably obtained at the price of the thermodynamic performance (that is, a power reduction in the range of 10% to 20% should be accepted). In the authors’ opinion, these conditions should be agreed on with the local administration so that a truly sustainable utilization of this important natural resource is guaranteed with wide social acceptance.


