
Eco-Efficiency Trends and Decoupling Analysis of Environmental Pressures in Tianjin, China

Abstract
:1. Introduction
2. Methodology and Data Sources
2.1. Eco-Efficiency Analysis
2.2. Decoupling Indices and Methods

| Categorization | ε | ΔE | ΔGDP | |
|---|---|---|---|---|
| Coupling | Expansive coupling | 0.8 ≤ ε ≤ 1.2 | >0 | >0 |
| Recessive coupling | 0.8 ≤ ε ≤ 1.2 | <0 | <0 | |
| Negative decoupling | Expansive negative decoupling | ε > 1.2 | >0 | >0 |
| Weak negative decoupling | 0 ≤ ε < 0.8 | <0 | <0 | |
| Strong negative decoupling | ε < 0 | >0 | <0 | |
| Decoupling | Recessive decoupling | ε > 1.2 | <0 | <0 |
| Weak decoupling | 0 ≤ ε < 0.8 | >0 | >0 | |
| Strong decoupling | ε < 0 | <0 | >0 | |
2.3. Data Sources
3. Results and Discussion

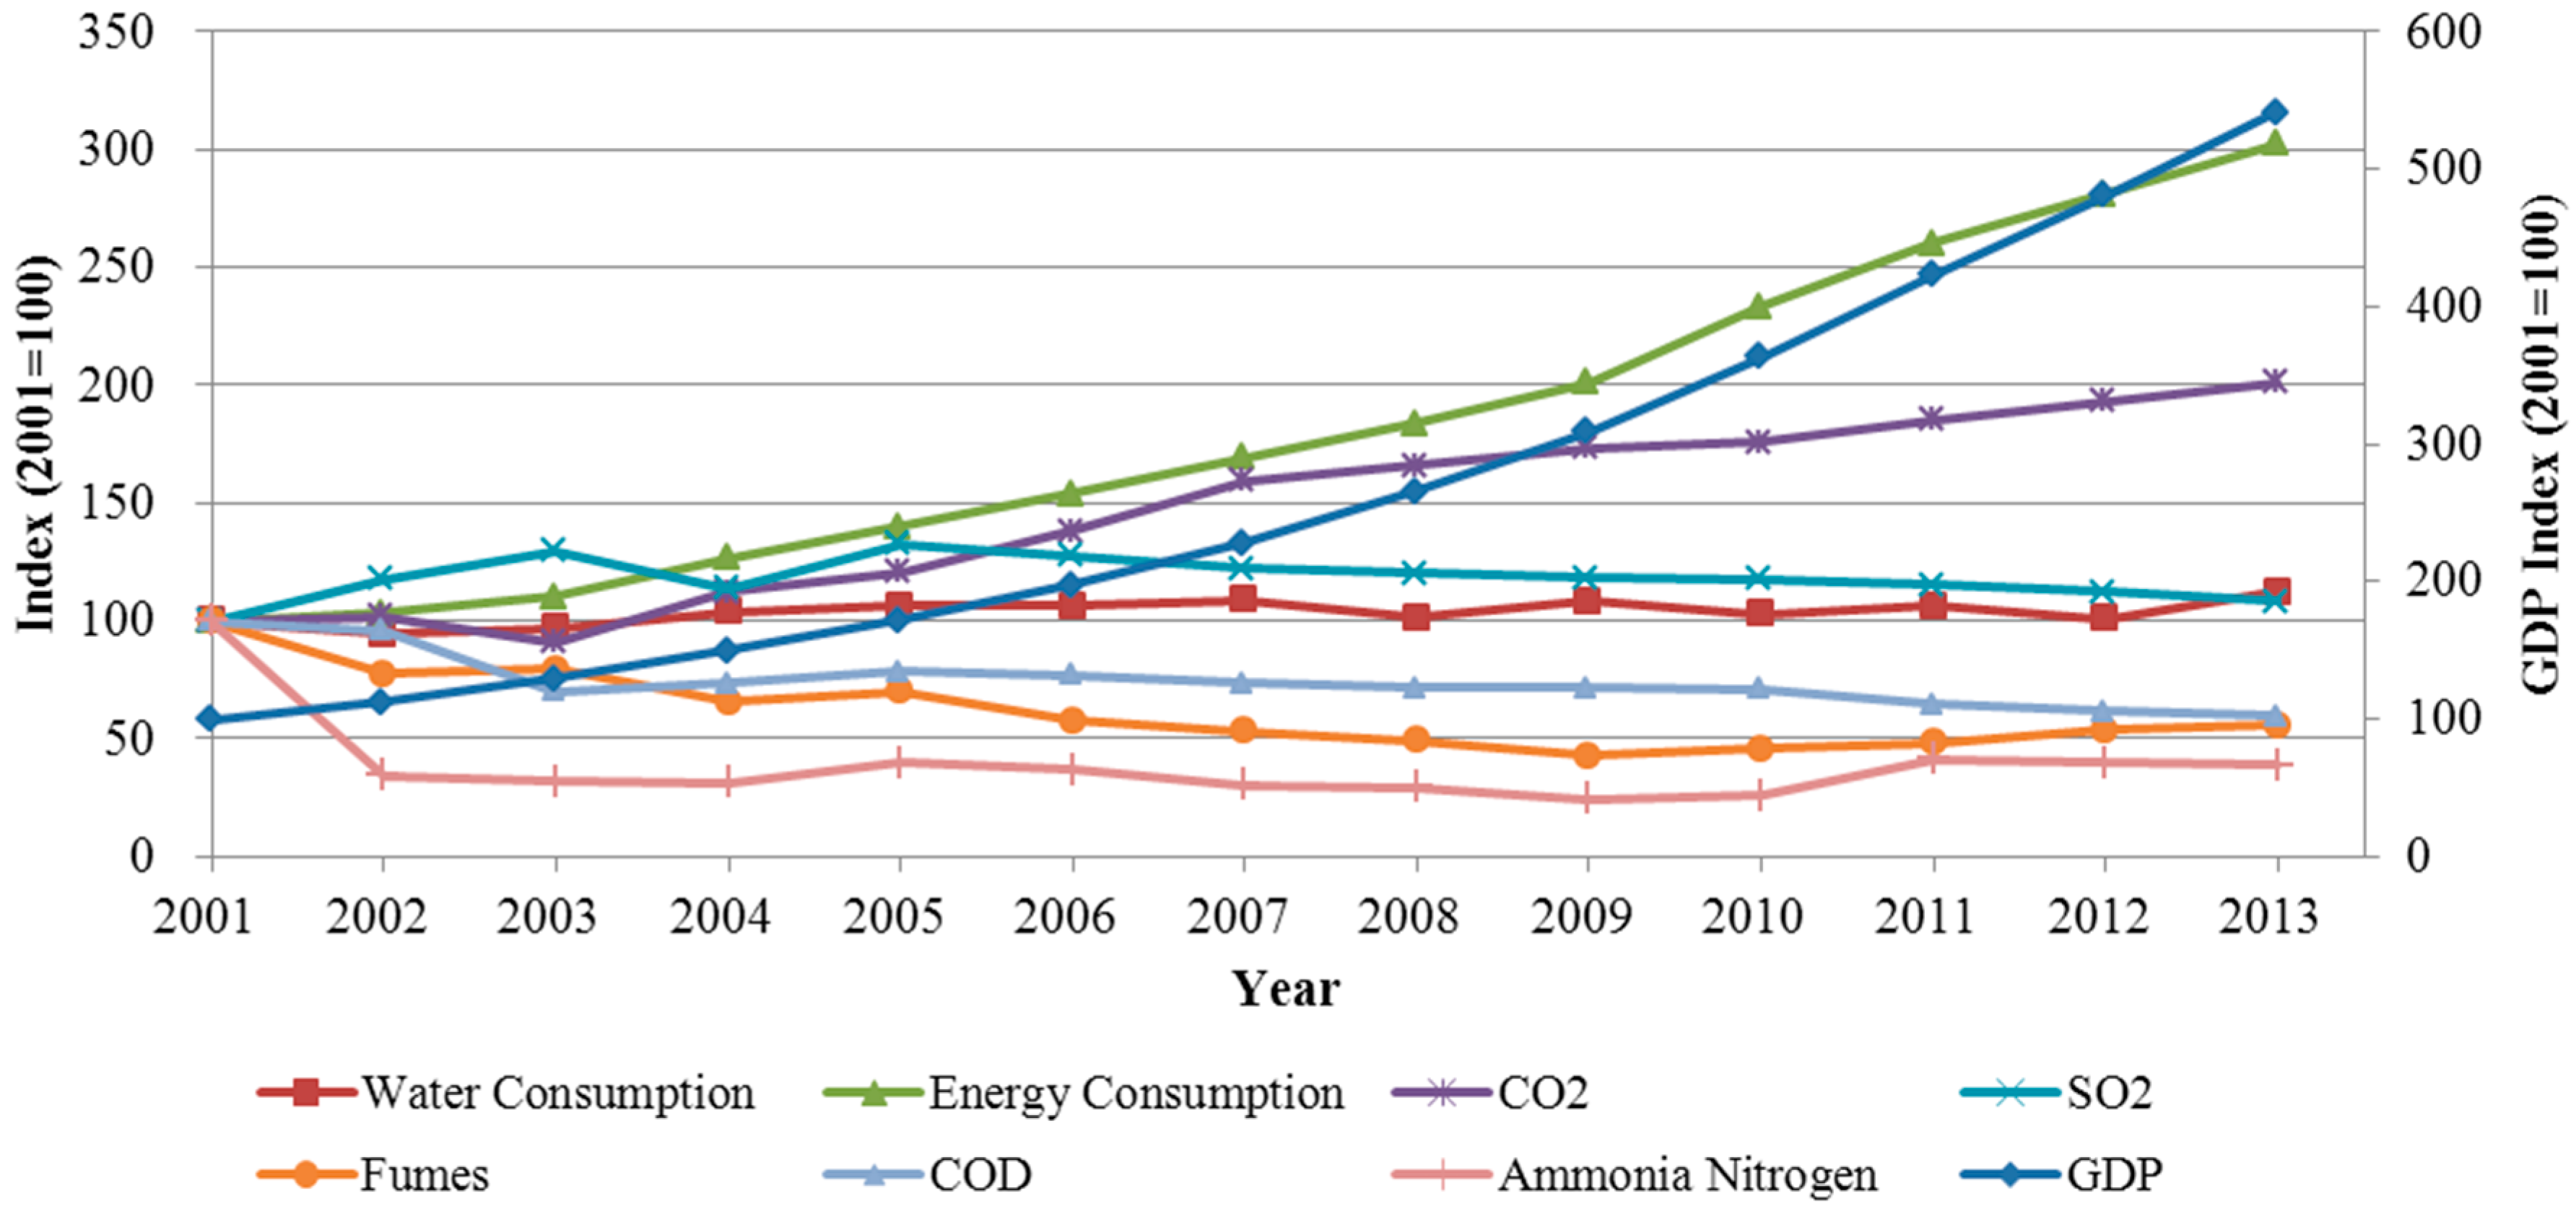
3.1. Eco-Efficiency Trends Analysis
| WC a | EC b | CO2 c | SO2 d | Fumes d | COD d | AN d | |
|---|---|---|---|---|---|---|---|
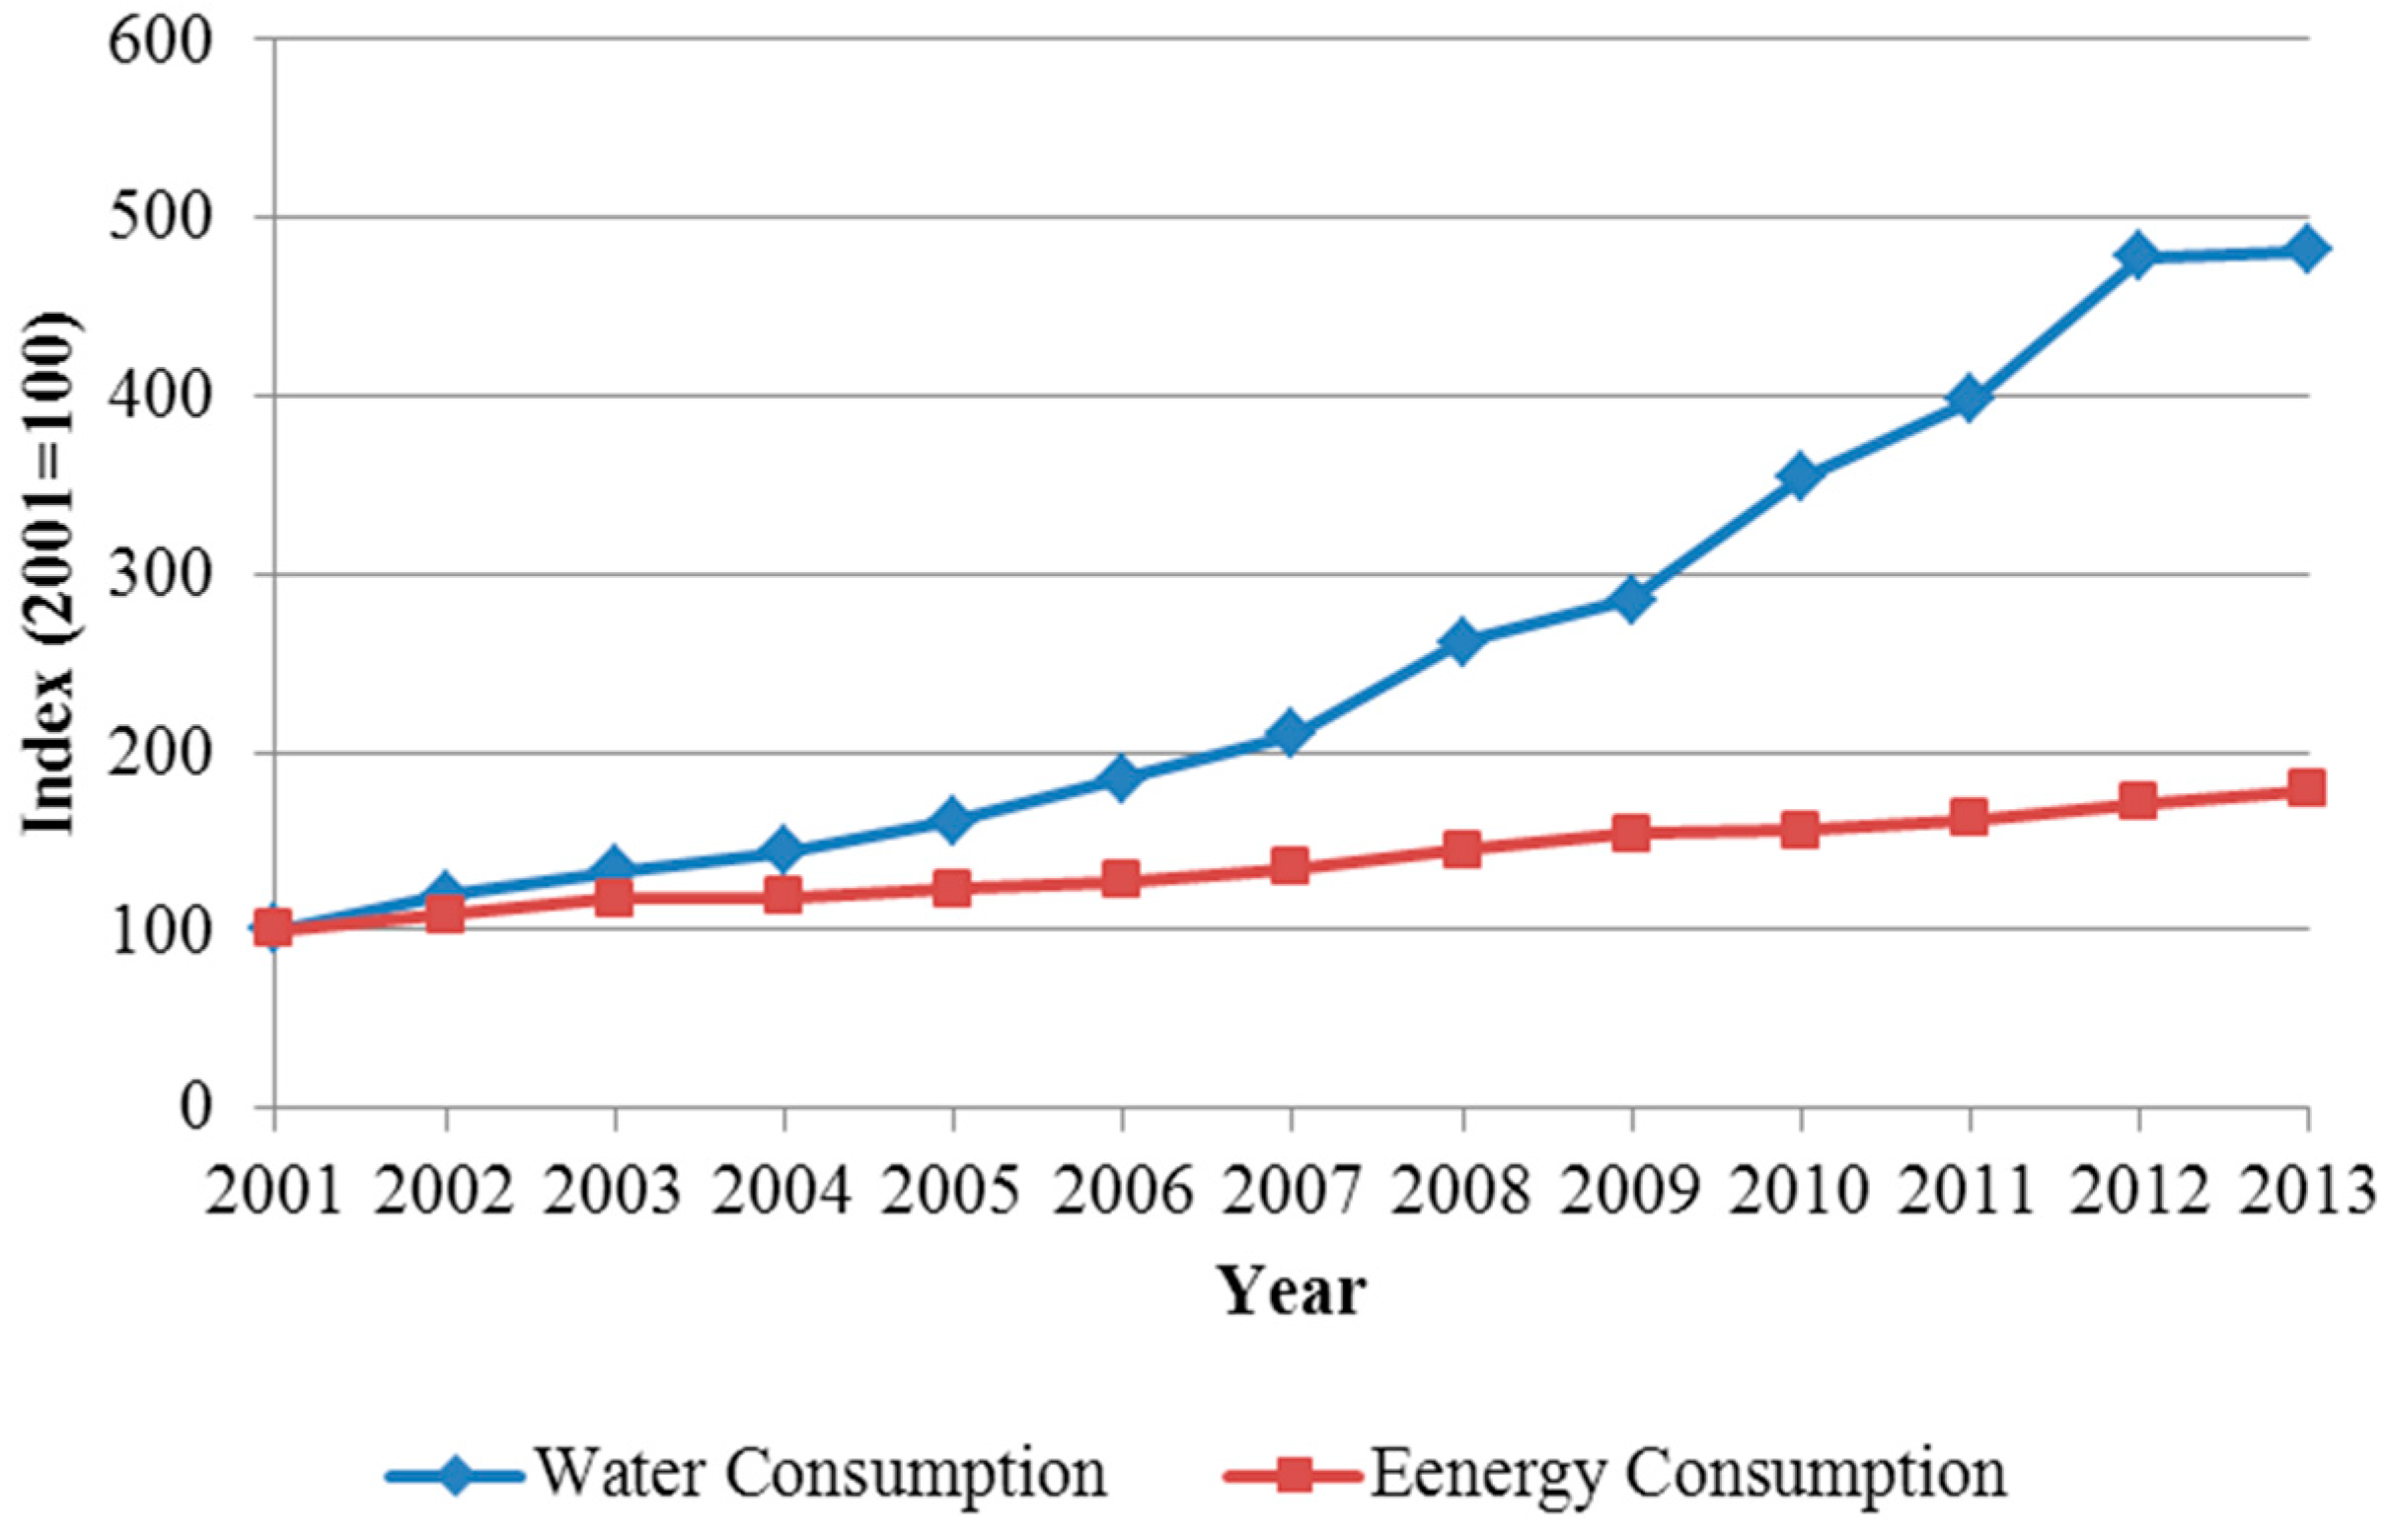
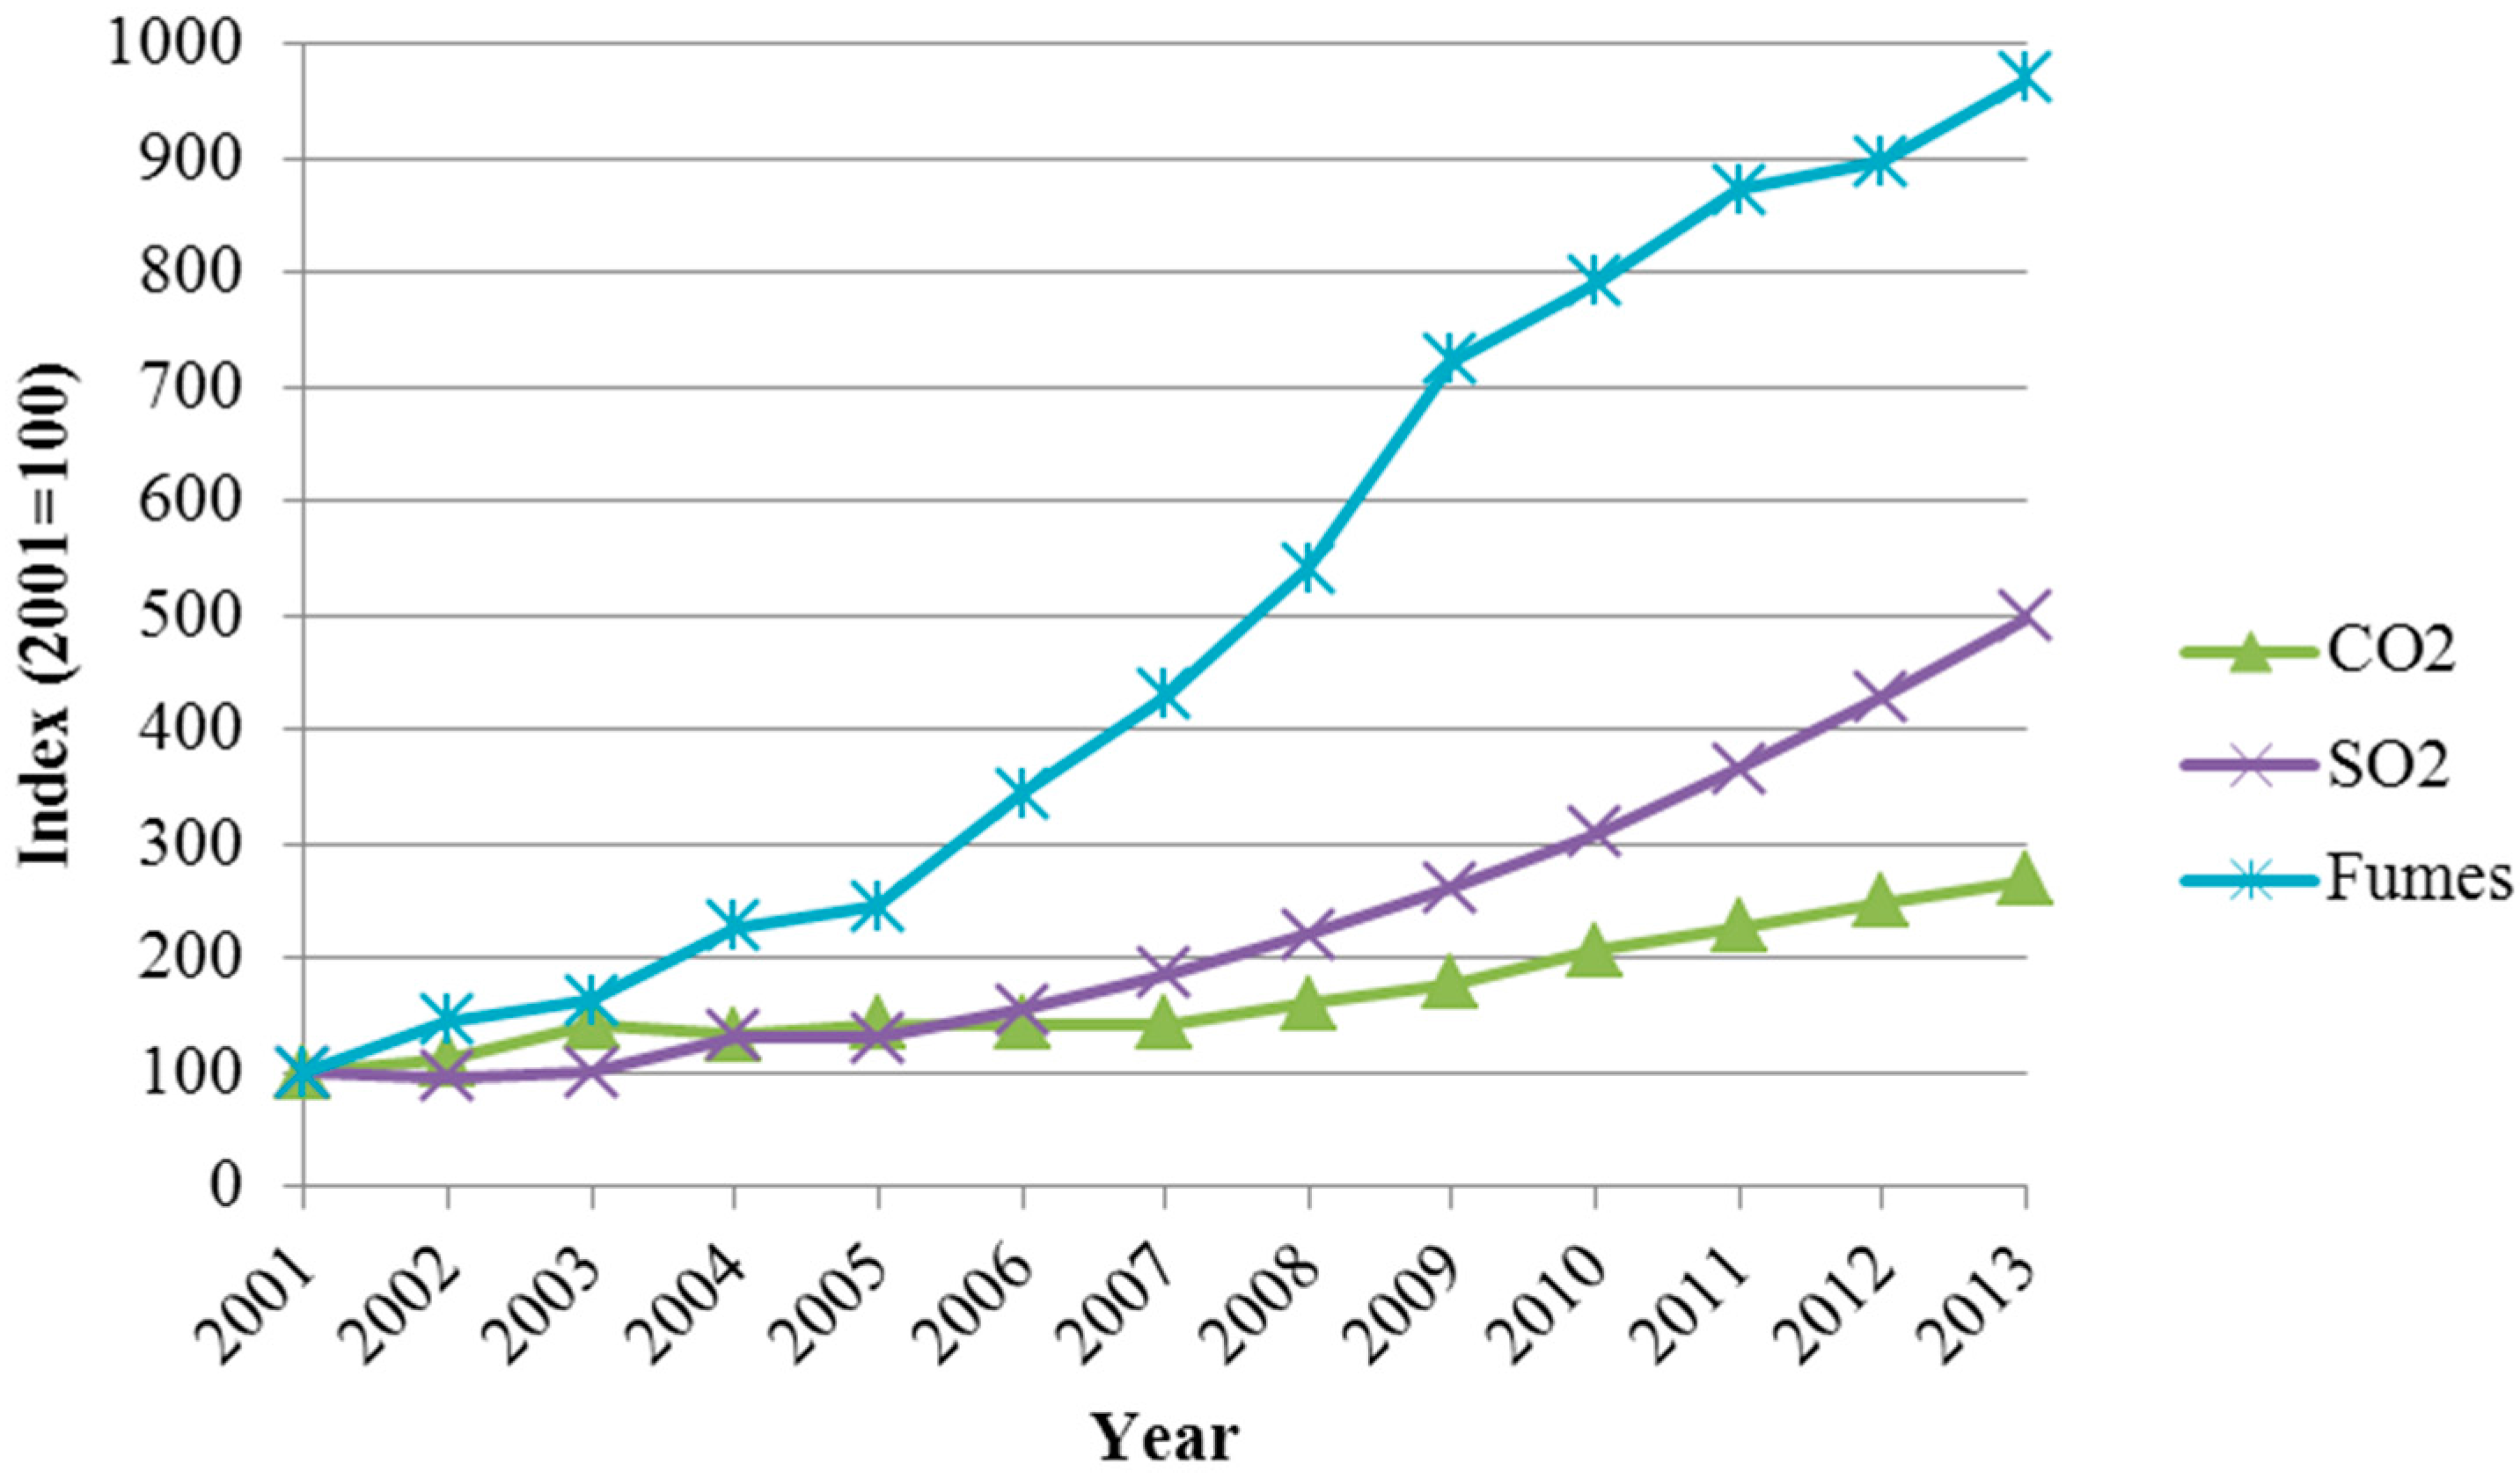
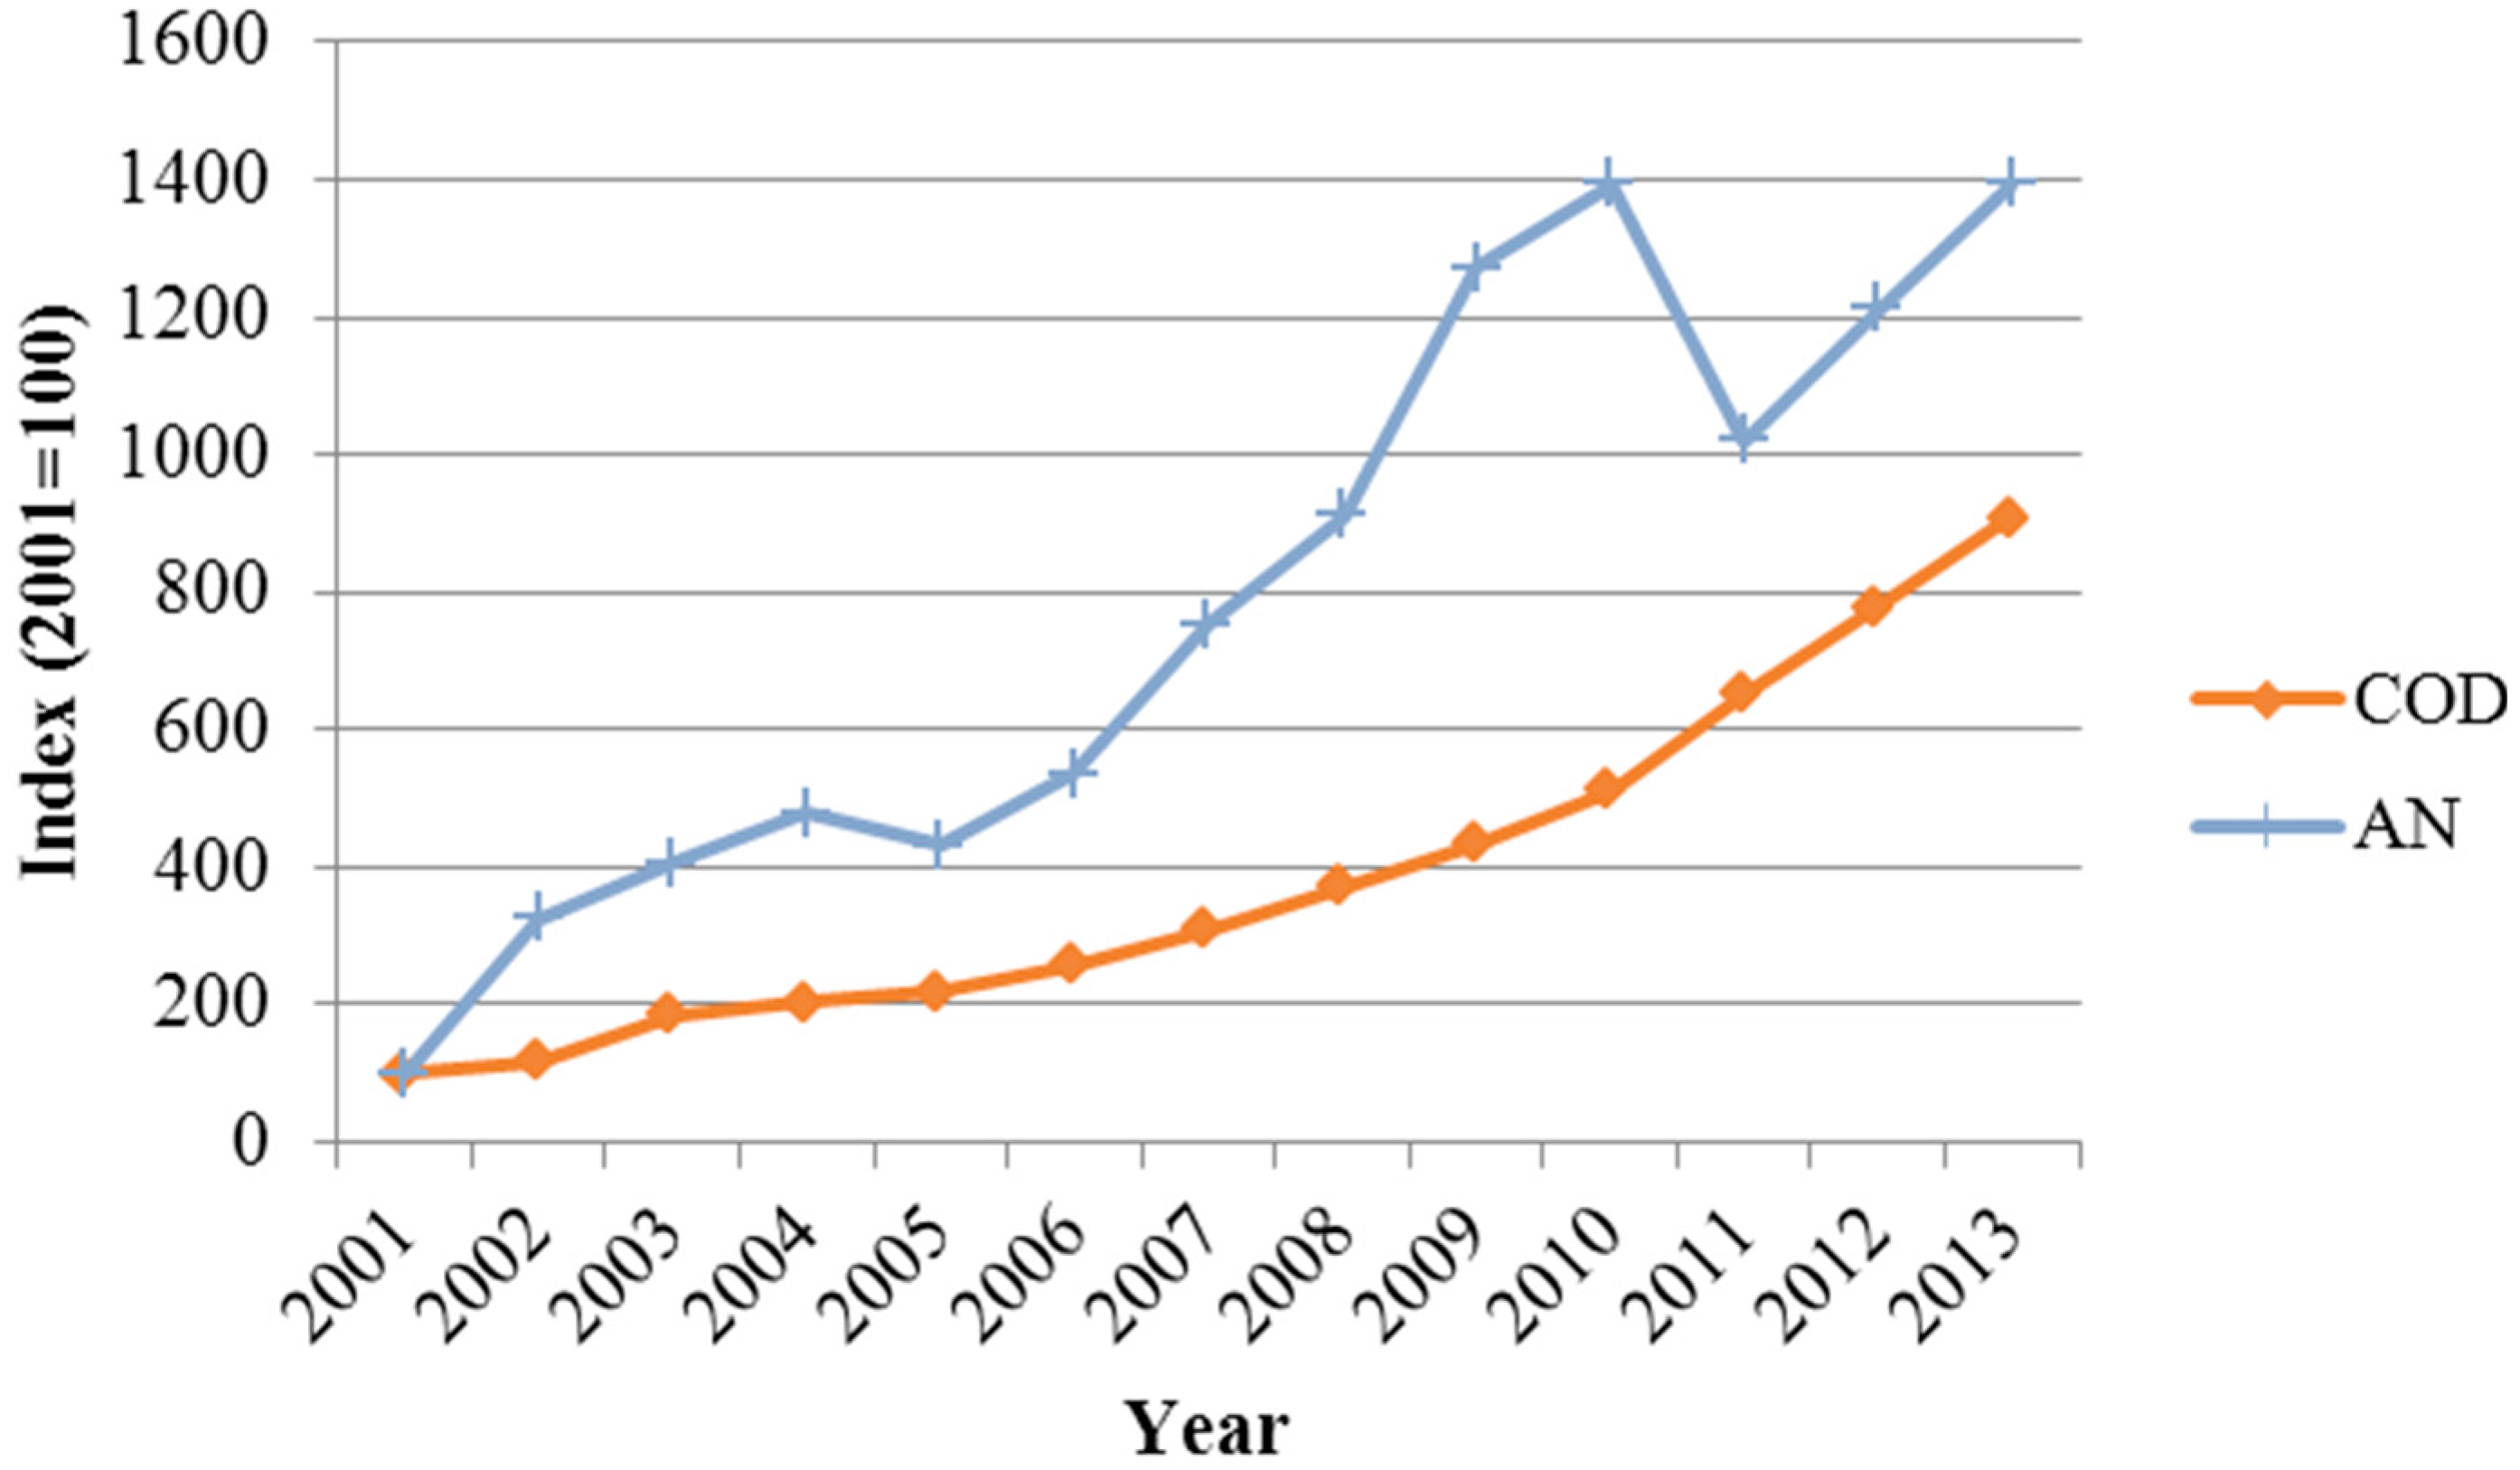
| 2001 | 90.2 | 6532.1 | 5061.2 | 95.3 | 121.6 | 102.4 | 387.4 |
| 2002 | 107.6 | 7108.1 | 5613.3 | 91.4 | 176.5 | 120.0 | 1263.8 |
| 2003 | 120.2 | 7670.7 | 7216.3 | 95.1 | 197.9 | 189.1 | 1567.6 |
| 2004 | 130.0 | 7725.2 | 6742.6 | 125.3 | 277.3 | 208.4 | 1851.1 |
| 2005 | 145.7 | 8033.3 | 7210.6 | 123.8 | 298.3 | 224.6 | 1674.3 |
| 2006 | 167.3 | 8363.3 | 7239.1 | 147.6 | 418.2 | 263.2 | 2070.2 |
| 2007 | 188.9 | 8794.5 | 7235.3 | 177.6 | 523.7 | 316.6 | 2914.3 |
| 2008 | 236.3 | 9441.9 | 8104.4 | 210.9 | 657.7 | 380.5 | 3531.5 |
| 2009 | 257.4 | 10,043.8 | 9035.4 | 249.3 | 880.6 | 443.6 | 4924.7 |
| 2010 | 318.8 | 10,158.9 | 10,444.3 | 294.6 | 963.1 | 524.7 | 5401.1 |
| 2011 | 359.0 | 10,610.5 | 11,540.0 | 349.2 | 1061.9 | 667.9 | 3955.8 |
| 2012 | 430.9 | 11,178.0 | 12,606.5 | 408.6 | 1091.5 | 796.8 | 4698.1 |
| 2013 | 434.5 | 11,698.5 | 13,616.6 | 476.0 | 1180.2 | 929.0 | 5397.9 |
3.1.1. An Analysis of the Eco-Efficiency of Resource

3.1.2. An Eco-Efficiency Analysis of the Environment


3.2. Decoupling Analysis
| Water | Energy | CO2 | SO2 | Fumes | COD | AN | |
|---|---|---|---|---|---|---|---|
| 2001 | WD | WD | SD | SD | SD | WD | EN |
| 2002 | SD | WD | WD | EN | SD | SD | SD |
| 2003 | WD | WD | SD | WD | WD | SD | SD |
| 2004 | WD | EC | EN | SD | SD | WD | SD |
| 2005 | WD | WD | WD | EC | WD | WD | EN |
| 2006 | SD | WD | EC | SD | SD | SD | SD |
| 2007 | WD | WD | EC | SD | SD | SD | SD |
| 2008 | SD | WD | WD | SD | SD | SD | SD |
| 2009 | WD | WD | WD | SD | SD | SD | SD |
| 2010 | SD | EC | WD | SD | WD | SD | WD |
| 2011 | WD | WD | WD | SD | WD | SD | EN |
| 2012 | SD | WD | WD | SD | WD | SD | SD |
| 2013 | EC | WD | WD | SD | WD | SD | SD |
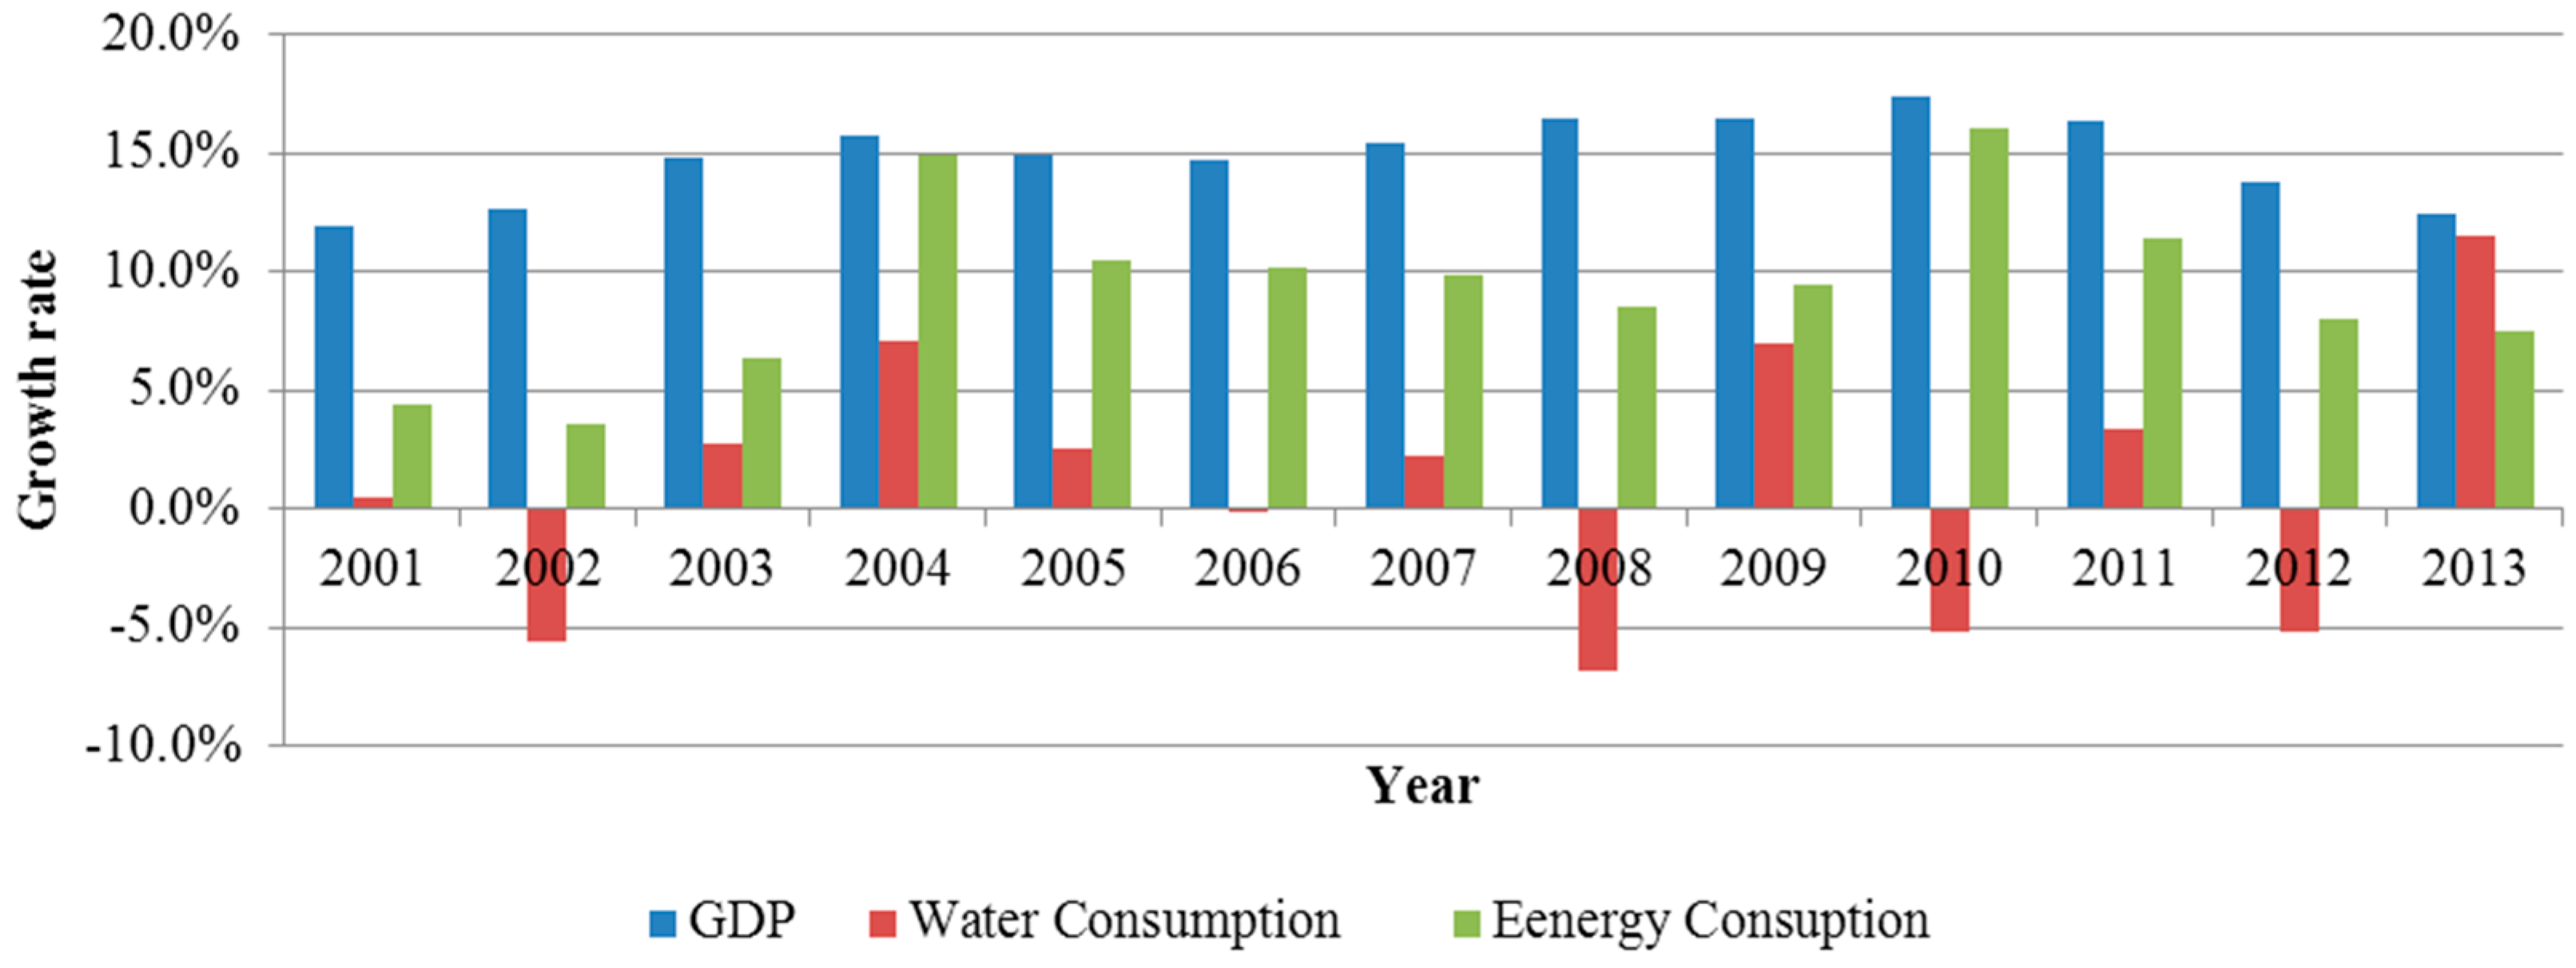
3.2.1. Water and Energy Consumption

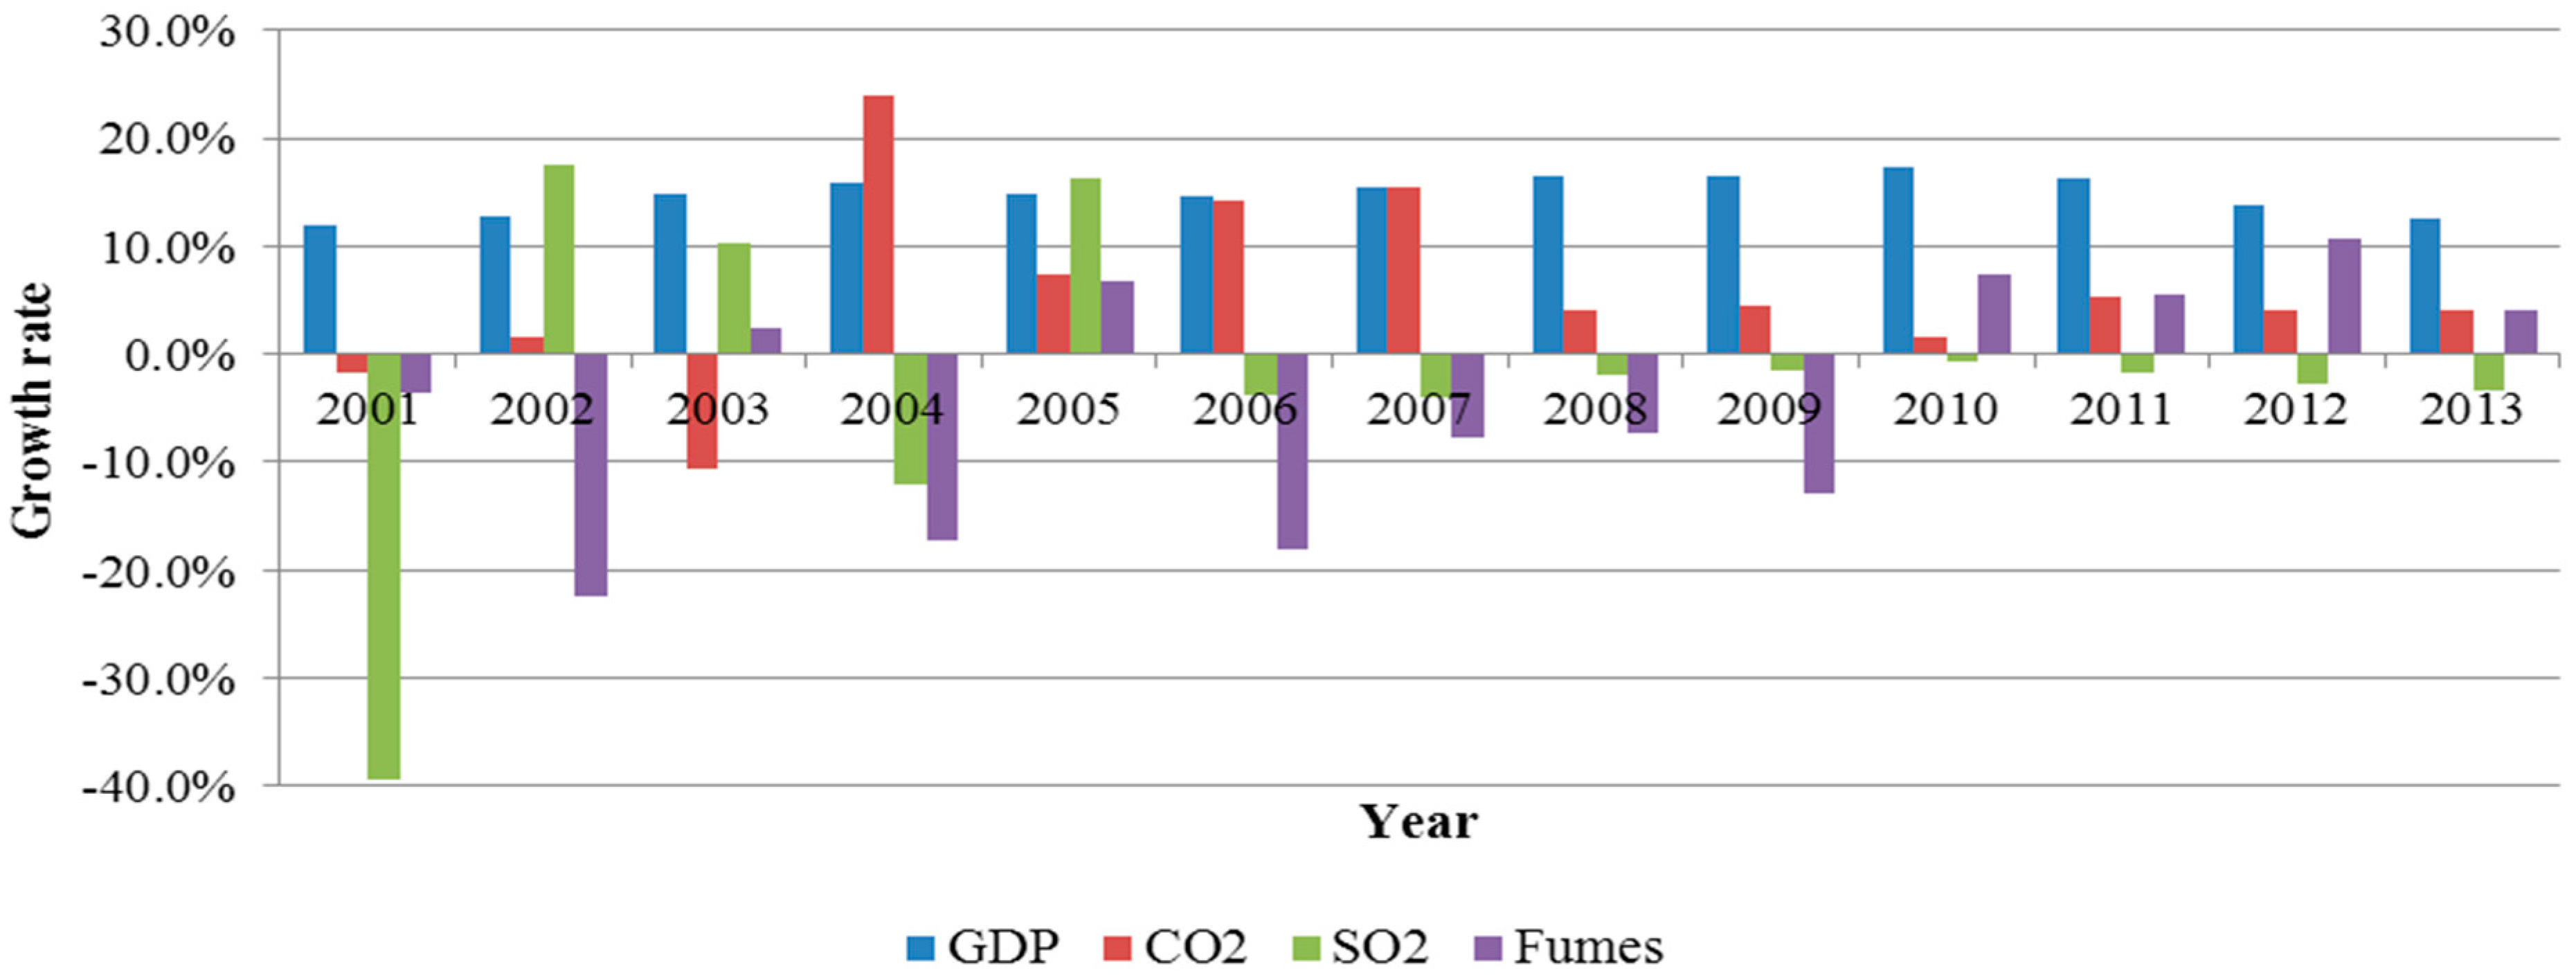
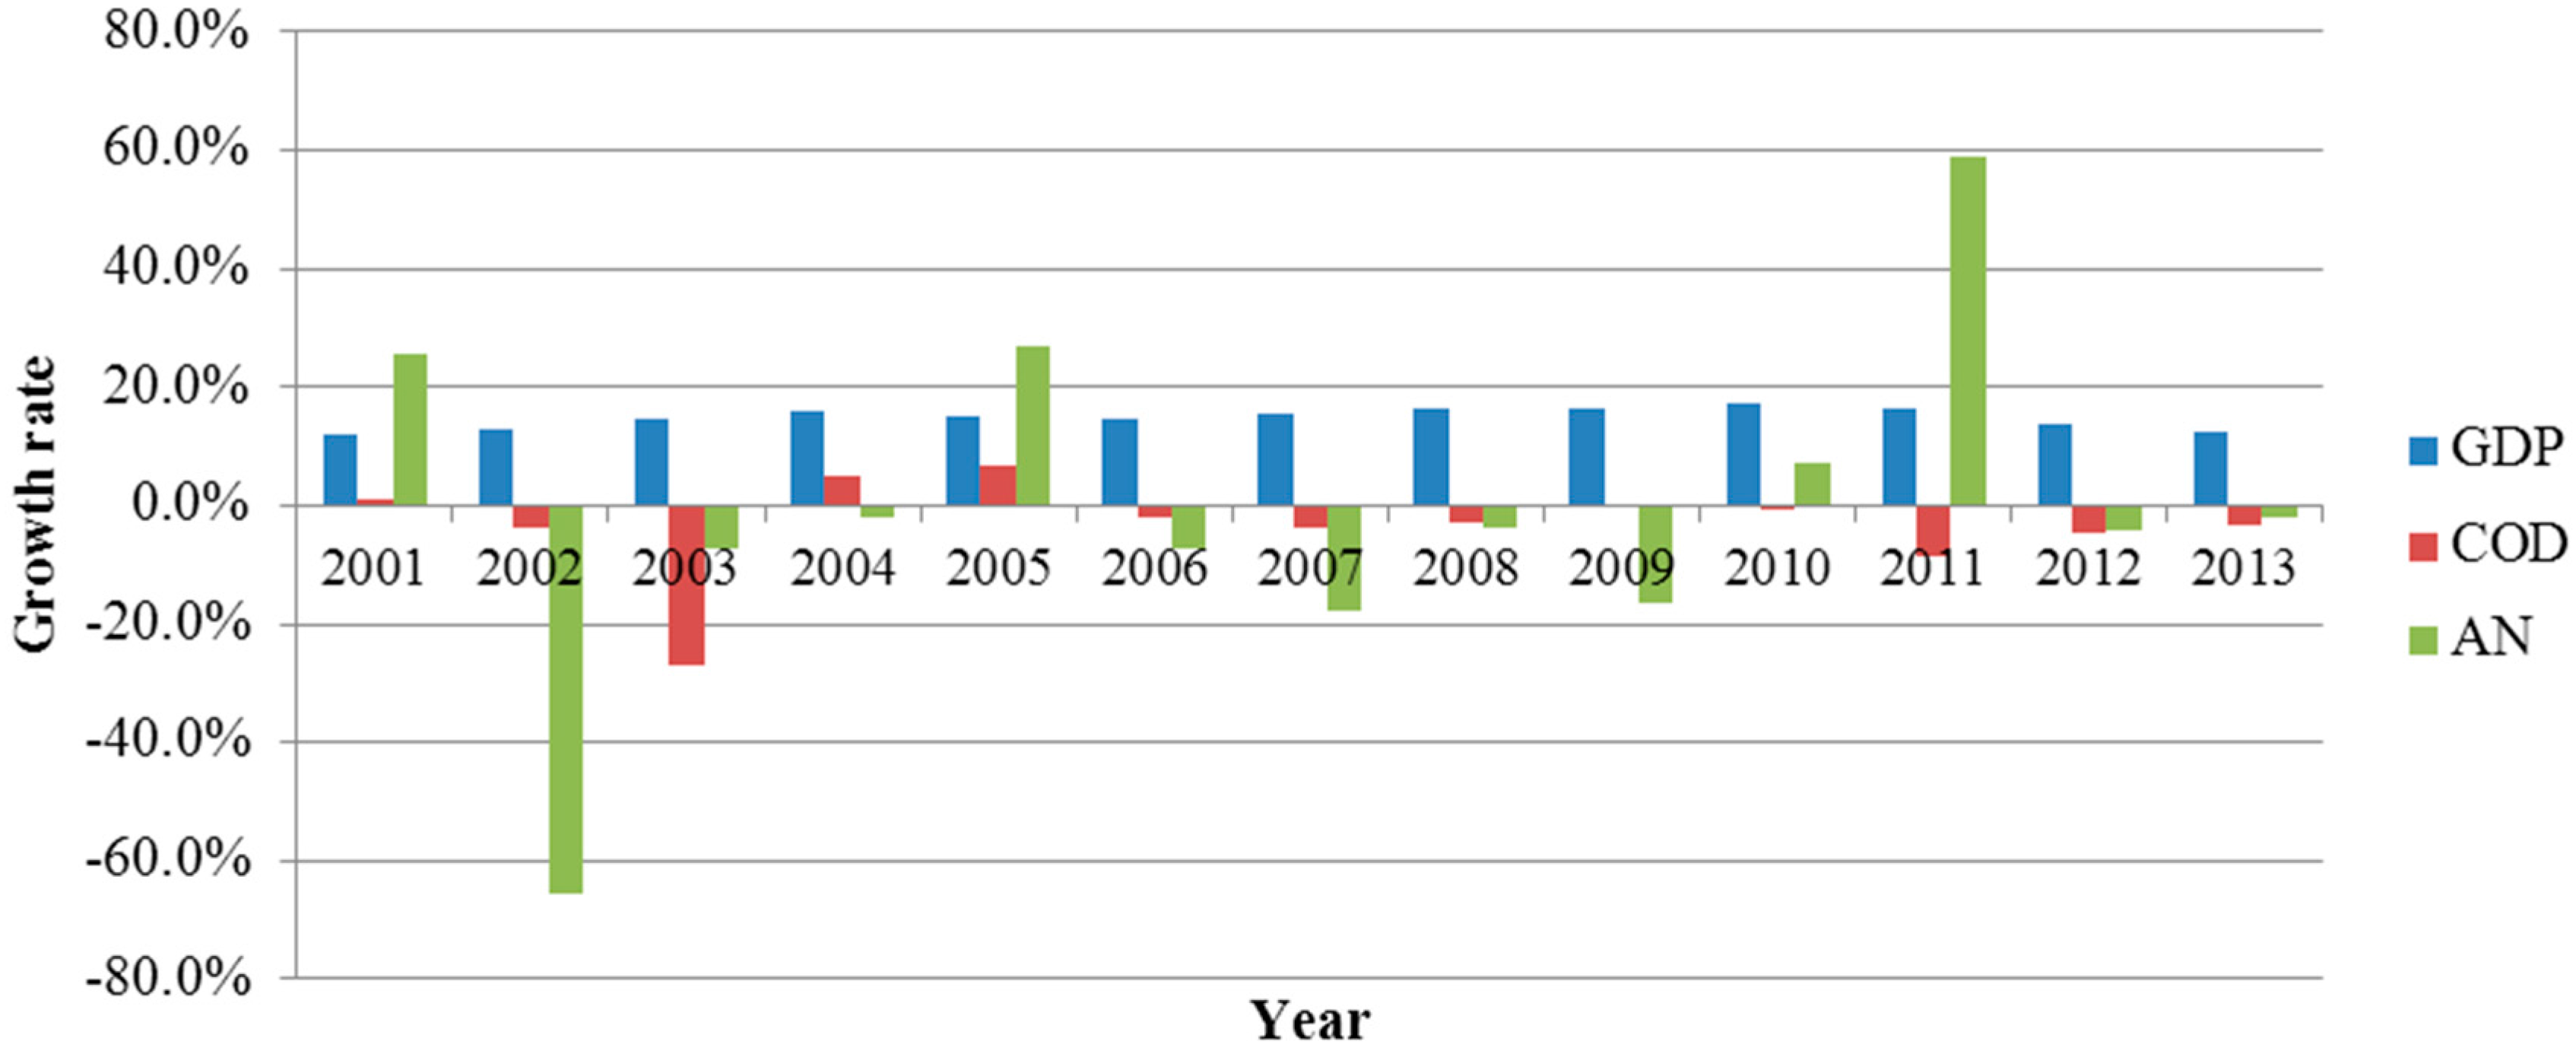
3.2.2. Emissions of Air and Water Pollutants


4. Conclusions and Policy Recommendations
Author Contributions
Conflicts of Interest
References
- Ehrenfeld, J.R. Eco-efficiency—Philosophy, theory, and tools. J. Ind. Ecol. 2005, 9, 6–8. [Google Scholar] [CrossRef]
- Seppala, J.; Melanen, M.; Maenpaa, I.; Koskela, S.; Tenhunen, J.; Hiltunen, M.R. How can the eco-efficiency of a region be measured and monitored? J. Ind. Ecol. 2005, 9, 117–130. [Google Scholar] [CrossRef]
- Dagiliute, R.; Juknys, R. Eco-efficiency: Trends, goals and their implementation in Lithuania. J. Environ. Eng. Landsc. Manag. 2012, 20, 265–272. [Google Scholar] [CrossRef]
- Camarero, M.; Castillo, J.; Picazo-Tadeo, A.J.; Tamarit, C. Eco-efficiency and convergence in OECD countries. Environ. Resour. Econ. 2013, 55, 87–106. [Google Scholar] [CrossRef]
- Yu, Y.D.; Chen, D.J.; Zhu, B.; Hu, S.Y. Eco-efficiency trends in china, 1978–2010: Decoupling environmental pressure from economic growth. Ecol. Indic. 2013, 24, 177–184. [Google Scholar] [CrossRef]
- Burritt, R.L.; Saka, C. Environmental management accounting applications. And eco-efficiency: Case studies from Japan. J. Clean. Prod. 2006, 14, 1262–1275. [Google Scholar] [CrossRef]
- Wang, Y.; Liu, J.; Hansson, L.; Zhang, K.; Wang, R. Implementing stricter environmental regulation to enhance eco-efficiency and sustainability: A case study of Shandong Province’s pulp and paper industry, China. J. Clean. Prod. 2011, 19, 303–310. [Google Scholar] [CrossRef]
- Jevons, W.S. The Coal Question: An Inquiry Concerning the Progress of the Nation, and the Probable Exhaustion of Our Coal-Mines; Macmillan: London, UK, 1906. [Google Scholar]
- Alcott, B. Jevons’ paradox. Ecol. Econ. 2005, 54, 9–21. [Google Scholar] [CrossRef]
- Frye-Levine, L.A. Sustainability through design science: Re-imagining option spaces beyond eco-efficiency. Sustain. Dev. 2012, 20, 166–179. [Google Scholar] [CrossRef]
- Yin, K.; Wang, R.S.; An, Q.X.; Yao, L.; Liang, J. Using eco-efficiency as an indicator for sustainable urban development: A case study of Chinese provincial capital cities. Ecol. Indic. 2014, 36, 665–671. [Google Scholar] [CrossRef]
- Wang, Z.H.; Yang, L. Delinking indicators on regional industry development and carbon emissions: Beijing-Tianjin-Hebei economic band case. Ecol. Indic. 2015, 48, 41–48. [Google Scholar] [CrossRef]
- Zhang, Z.; Chen, X.; Heck, P.; Xue, B.; Liu, Y. Empirical study on the environmental pressure versus economic growth in China during 1991–2012. Resour. Conserv. Recycl. 2015, 101, 182–193. [Google Scholar] [CrossRef]
- OECD. Indicators to Measure Decoupling of Environmental Pressures from Economic Growth; OECD: Paris, France, 2002. [Google Scholar]
- Lu, I.J.; Lin, S.J.; Lewis, C. Decomposition and decoupling effects of carbon dioxide emission from highway transportation in Taiwan, Germany, Japan and South Korea. Energy Policy 2007, 35, 3226–3235. [Google Scholar] [CrossRef]
- De Freitas, L.C.; Kaneko, S. Decomposing the decoupling of CO2 emissions and economic growth in Brazil. Ecol. Econ. 2011, 70, 1459–1469. [Google Scholar] [CrossRef]
- Conrad, E.; Cassar, L. Decoupling economic growth and environmental degradation: Reviewing progress to date in the small island state of Malta. Sustainability 2014, 6, 6729–6750. [Google Scholar] [CrossRef]
- Tapio, P. Towards a theory of decoupling: Degrees of decoupling in the EU and the case of road traffic in Finland between 1970 and 2001. Transp. Policy 2005, 12, 137–151. [Google Scholar] [CrossRef]
- Wang, H.M.; Hashimoto, S.; Yue, Q.; Moriguchi, Y.; Lu, Z.W. Decoupling analysis of four selected countries: China, Russia, Japan, and the United States during 2000–2007. J. Ind. Ecol. 2013, 17, 618–629. [Google Scholar] [CrossRef]
- Nicholas, G.-R. The Entropy Law and Economic Process; Harvard University Press: Cambridge, MA, USA, 2014. [Google Scholar]
- Jackson, T. Prosperity without Growth?: The Transition to a Sustainable Economy: [Summary]. Available online: https://research-repository.st-andrews.ac.uk/handle/10023/2165 (accessed on 17 November 2015).
- Kallis, G. In defence of degrowth. Ecol. Econ. 2011, 70, 873–880. [Google Scholar] [CrossRef]
- Coelho, P.; Mascarenhas, A.; Vaz, P.; Dores, A.; Ramos, T.B. A framework for regional sustainability assessment: Developing indicators for a Portuguese region. Sustain. Dev. 2010, 18, 211–219. [Google Scholar] [CrossRef]
- Figge, F.; Young, W.; Barkemeyer, R. Sufficiency or efficiency to achieve lower resource consumption and emissions ? The role of the rebound effect. J. Clean. Prod. 2014, 69, 216–224. [Google Scholar] [CrossRef]
- Schmidheiny, S. Changing Course: A Global Business Perspective on Development and the Environment; MIT Press: Cambridge, MA, USA, 1992; Volume 1. [Google Scholar]
- Carrillo-Hermosilla, J.; Río González, P.D.; Könnölä, T. Eco-Innovation: When Sustainability and Competitiveness Shake Hands; Palgrave: London, UK, 2009. [Google Scholar]
- Wang, Y.; Sun, M.; Wang, R.; Lou, F. Promoting regional sustainability by eco-province construction in China: A critical assessment. Ecol. Indic. 2015, 51, 127–138. [Google Scholar] [CrossRef]
- Zhang, Y.J.; Da, Y.B. The decomposition of energy-related carbon emission and its decoupling with economic growth in China. Renew. Sustain. Energy Rev. 2015, 41, 1255–1266. [Google Scholar] [CrossRef]
- Song, Y.; Zhang, M.; Dai, S. Study on China’s energy-related CO2 emission at provincial level. Nat. Hazards 2015, 77, 89–100. [Google Scholar] [CrossRef]
- Tianjin Municipal Bureau of Statistics. Tianjin Statistical Yearbook 2014; China Statistics Press: Beijing, China, 2014.
- National Bureau of Statistics of China. China Energy Statistical Yearbook; China Statistics Press: Beijing, China, 2001–2014.
- IPCC. 2006 IPCC Guidelines for National Greenhouse Gas Inventories[db/ol]. Available online: http://www.ipcc-nggip.iges.or.jp/public/2006gl/index.html (accessed on 18 September 2015).
- National Bureau of Statistics of China. China Statistical Yearbook 2014; China Statistics Press: Beijng, China, 2014.
- Fernandez Gonzalez, P.; Landajo, M.; Presno, M.J. Multilevel lmdi decomposition of changes in aggregate energy consumption. A cross country analysis in the EU-27. Energy Policy 2014, 68, 576–584. [Google Scholar] [CrossRef]
- Xue, B.; Mitchell, B.; Geng, Y.; Ren, W.X.; Muller, K.; Ma, Z.X.; de Oliveira, J.A.P.; Fujita, T.; Tobias, M. A review on China’s pollutant emissions reduction assessment. Ecol. Indic. 2014, 38, 272–278. [Google Scholar] [CrossRef]
- Price, L.; Levine, M.D.; Zhou, N.; Fridley, D.; Aden, N.; Lu, H.Y.; McNeil, M.; Zheng, N.N.; Qin, Y.N.; Yowargana, P. Assessment of China’s energy-saving and emission-reduction accomplishments and opportunities during the 11th five year plan. Energy Policy 2011, 39, 2165–2178. [Google Scholar] [CrossRef]
- Yu, S.; Zhang, J.; Zheng, S.; Sun, H. Provincial carbon intensity abatement potential estimation in China: A pso-ga-optimized multi-factor environmental learning curve method. Energy Policy 2015, 77, 46–55. [Google Scholar] [CrossRef]
- The State Council. Work Plan for Controlling Greenhouse Gas Emissions for the Twelfth Five-Year Plan; The State Council: Beijng, China, 2011.
- Wang, Z.; Zhao, L.; Mao, G.; Wu, B. Factor decomposition analysis of energy-related CO2 emissions in Tianjin, China. Sustainability 2015, 7, 9973–9988. [Google Scholar] [CrossRef]
© 2015 by the authors; licensee MDPI, Basel, Switzerland. This article is an open access article distributed under the terms and conditions of the Creative Commons Attribution license (http://creativecommons.org/licenses/by/4.0/).
Share and Cite
Wang, Z.; Zhao, L.; Mao, G.; Wu, B. Eco-Efficiency Trends and Decoupling Analysis of Environmental Pressures in Tianjin, China. Sustainability 2015, 7, 15407-15422. https://0-doi-org.brum.beds.ac.uk/10.3390/su71115407
Wang Z, Zhao L, Mao G, Wu B. Eco-Efficiency Trends and Decoupling Analysis of Environmental Pressures in Tianjin, China. Sustainability. 2015; 7(11):15407-15422. https://0-doi-org.brum.beds.ac.uk/10.3390/su71115407
Chicago/Turabian StyleWang, Zhe, Lin Zhao, Guozhu Mao, and Ben Wu. 2015. "Eco-Efficiency Trends and Decoupling Analysis of Environmental Pressures in Tianjin, China" Sustainability 7, no. 11: 15407-15422. https://0-doi-org.brum.beds.ac.uk/10.3390/su71115407