Article

Land Use Allocation Based on a Multi-Objective Artificial Immune Optimization Model: An Application in Anlu County, China

School of Resource and Environmental Science, Wuhan University, Wuhan 430079, China
*
Author to whom correspondence should be addressed.
These authors contributed equally to this work.
Sustainability 2015, 7(11), 15632-15651; https://0-doi-org.brum.beds.ac.uk/10.3390/su71115632
Submission received: 15 October 2015 / Revised: 16 November 2015 / Accepted: 17 November 2015 / Published: 23 November 2015
(This article belongs to the Section Environmental Sustainability and Applications)

Abstract

:
As the main feature of land use planning, land use allocation (LUA) optimization is an important means of creating a balance between the land-use supply and demand in a region and promoting the sustainable utilization of land resources. In essence, LUA optimization is a multi-objective optimization problem under the land use supply and demand constraints in a region. In order to obtain a better sustainable multi-objective LUA optimization solution, the present study proposes a LUA model based on the multi-objective artificial immune optimization algorithm (MOAIM-LUA model). The main achievements of the present study are as follows: (a) the land-use supply and demand factors are analyzed and the constraint conditions of LUA optimization problems are constructed based on the analysis framework of the balance between the land use supply and demand; (b) the optimization objectives of LUA optimization problems are defined and modeled using ecosystem service value theory and land rent and price theory; and (c) a multi-objective optimization algorithm is designed for solving multi-objective LUA optimization problems based on the novel immune clonal algorithm (NICA). On the basis of the aforementioned achievements, MOAIM-LUA was applied to a real case study of land-use planning in Anlu County, China. Compared to the current land use situation in Anlu County, optimized LUA solutions offer improvements in the social and ecological objective areas. Compared to the existing models, such as the non-dominated sorting genetic algorithm-II, experimental results demonstrate that the model designed in the present study can obtain better non-dominated solution sets and is superior in terms of algorithm stability.

1. Introduction

Due to an immense population, rapid urbanization and industrialization, land resources in China have been facing unprecedented pressure in the past 20 years, highlighted by the rapid loss of quality agricultural land and excessive sprawl of urban boundaries [1]. Under these circumstances, the “resource conservation and environmentally friendly” development concept, whose core aim is to “reasonably use land resources, improve land resource use efficiency, and realize the harmonious development of humans and nature,” has become the consensus in land management in China. In China’s land use and land management system, not only is land use planning a technical means to promote sustainable land use, but it is also a management means with binding legal impact. As the core of land use planning, land use allocation (LUA) optimization is considered one of the most effective means for realizing sustainable land use. LUA optimization aims to balance the land use supply and demand based on the future dynamic demands from different land use stakeholders in the region and optimize the allocated quantity of limited land resources for different uses [2].
LUA problems are often defined as multi-objective optimization problems with constraint conditions. In order to solve LUA problems, researchers have successively designed a number of LUA models from different perspectives. Based on their optimization methods, these models can be classified into the following types: mathematical programming (MP)-based models, system dynamics (SD)-based models, and heuristic algorithm (HA)-based models.
MP-based models were the earliest models used for solving LUA problems [3]. So far, a number of MP methods have been used for solving LUA problems, including linear programing [2,4,5,6,7], goal programing [8,9,10], integer programming [11], and interval programming [12,13,14,15], among others [16]. Compared to other types of models, MP-based models can be relatively conveniently obtained from the optimization toolbox in software such as MATLAB, LINDO/LINGO, and SPSS. Therefore, MP methods are still the most popular type of method in the LUA model research field. However, it is difficult for the MP algorithms to cope with complicated and non-linear multi-objective optimization problems. Therefore, most of the MP-based models mentioned above were designed based on a single objective or converted the original problem with multiple objectives into a single-objective optimization problem.
SD-based models view the regional LUA problem as a complex system. On this basis, SD-based models analyze the components of the land-use system as well as the relationship among the components in order to obtain a future LUA scheme for this region [17]. SD-based models can explain the driving factors for and the trend of the land use change in a region fairly well. Additionally, SD-based models can also dynamically allocate future land use in a region. However, SD-based models mainly focus on the dynamic simulation of the components of the system as well as the relationship among the components. Therefore, SD-based models are usually used to simulate land use demands influenced by economy, technology, population, policy, and their interactions at macro-scales [18]. Therefore, theoretically, SD-based LUA models are simulation models more than optimization models.
In the past 20 years, the HA method has been considered an effective means to obtain tradeoff solutions for multi-objective optimization problems. So far, a series of heuristic or meta-heuristic algorithms have been used for solving resource allocation optimization or spatial optimization problems [19] including Genetic Algorithms [20,21,22,23], Tabu Search [24], Evolutionary Algorithm [25,26,27], Self-Organizing Algorithms [28,29], and Simulated Annealing [30].
The above LUA optimization models can effectively handle the LUA problems. However, there are still certain limitations in the previous studies: (a) many of the LUA optimization models just consider one objective or convert the original problem with multiple objectives into a single-objective optimization problem by using the weighted method. However, in many application scenarios, it is difficult to reasonably determine the weights of the LUA optimization objectives; (b) Most of the multi-objective optimization models for LUA or land use spatial allocation are based on genetic algorithms or improved genetic algorithms, mainly because of their ability to find a wide spread of Pareto-optimal solutions. However, in some cases, previous studies have demonstrated some shortcomings of these algorithms, such as the ability to converge to Pareto front, diversity of obtained non-dominated solutions, and the running time [31,32]. Therefore, it is necessary to design a multi-objective optimization model for LUA based on some other more effective multi-objective optimization algorithms.
Artificial Immune Systems (AIS) can be defined as intelligent and adaptive computational systems inspired by theoretical immunology principles and mechanisms and used to solve real-world problems [33,34]. While the main classical models of AIS were not proposed until the early 21st century [35,36,37,38,39], AIS models have been widely used in a number of fields in the past 10 years, including pattern recognition [40,41], data mining [42], land use dynamics [43,44], and multi-objective decision making [45]. AIS models have shown their advantages in the multi-objective optimization field. The results of the existing studies demonstrate that the AIS models perform exceptionally well in solving high-dimensional, non-linear, and complex problems, and they have become the focus of the intelligent optimization field [32].
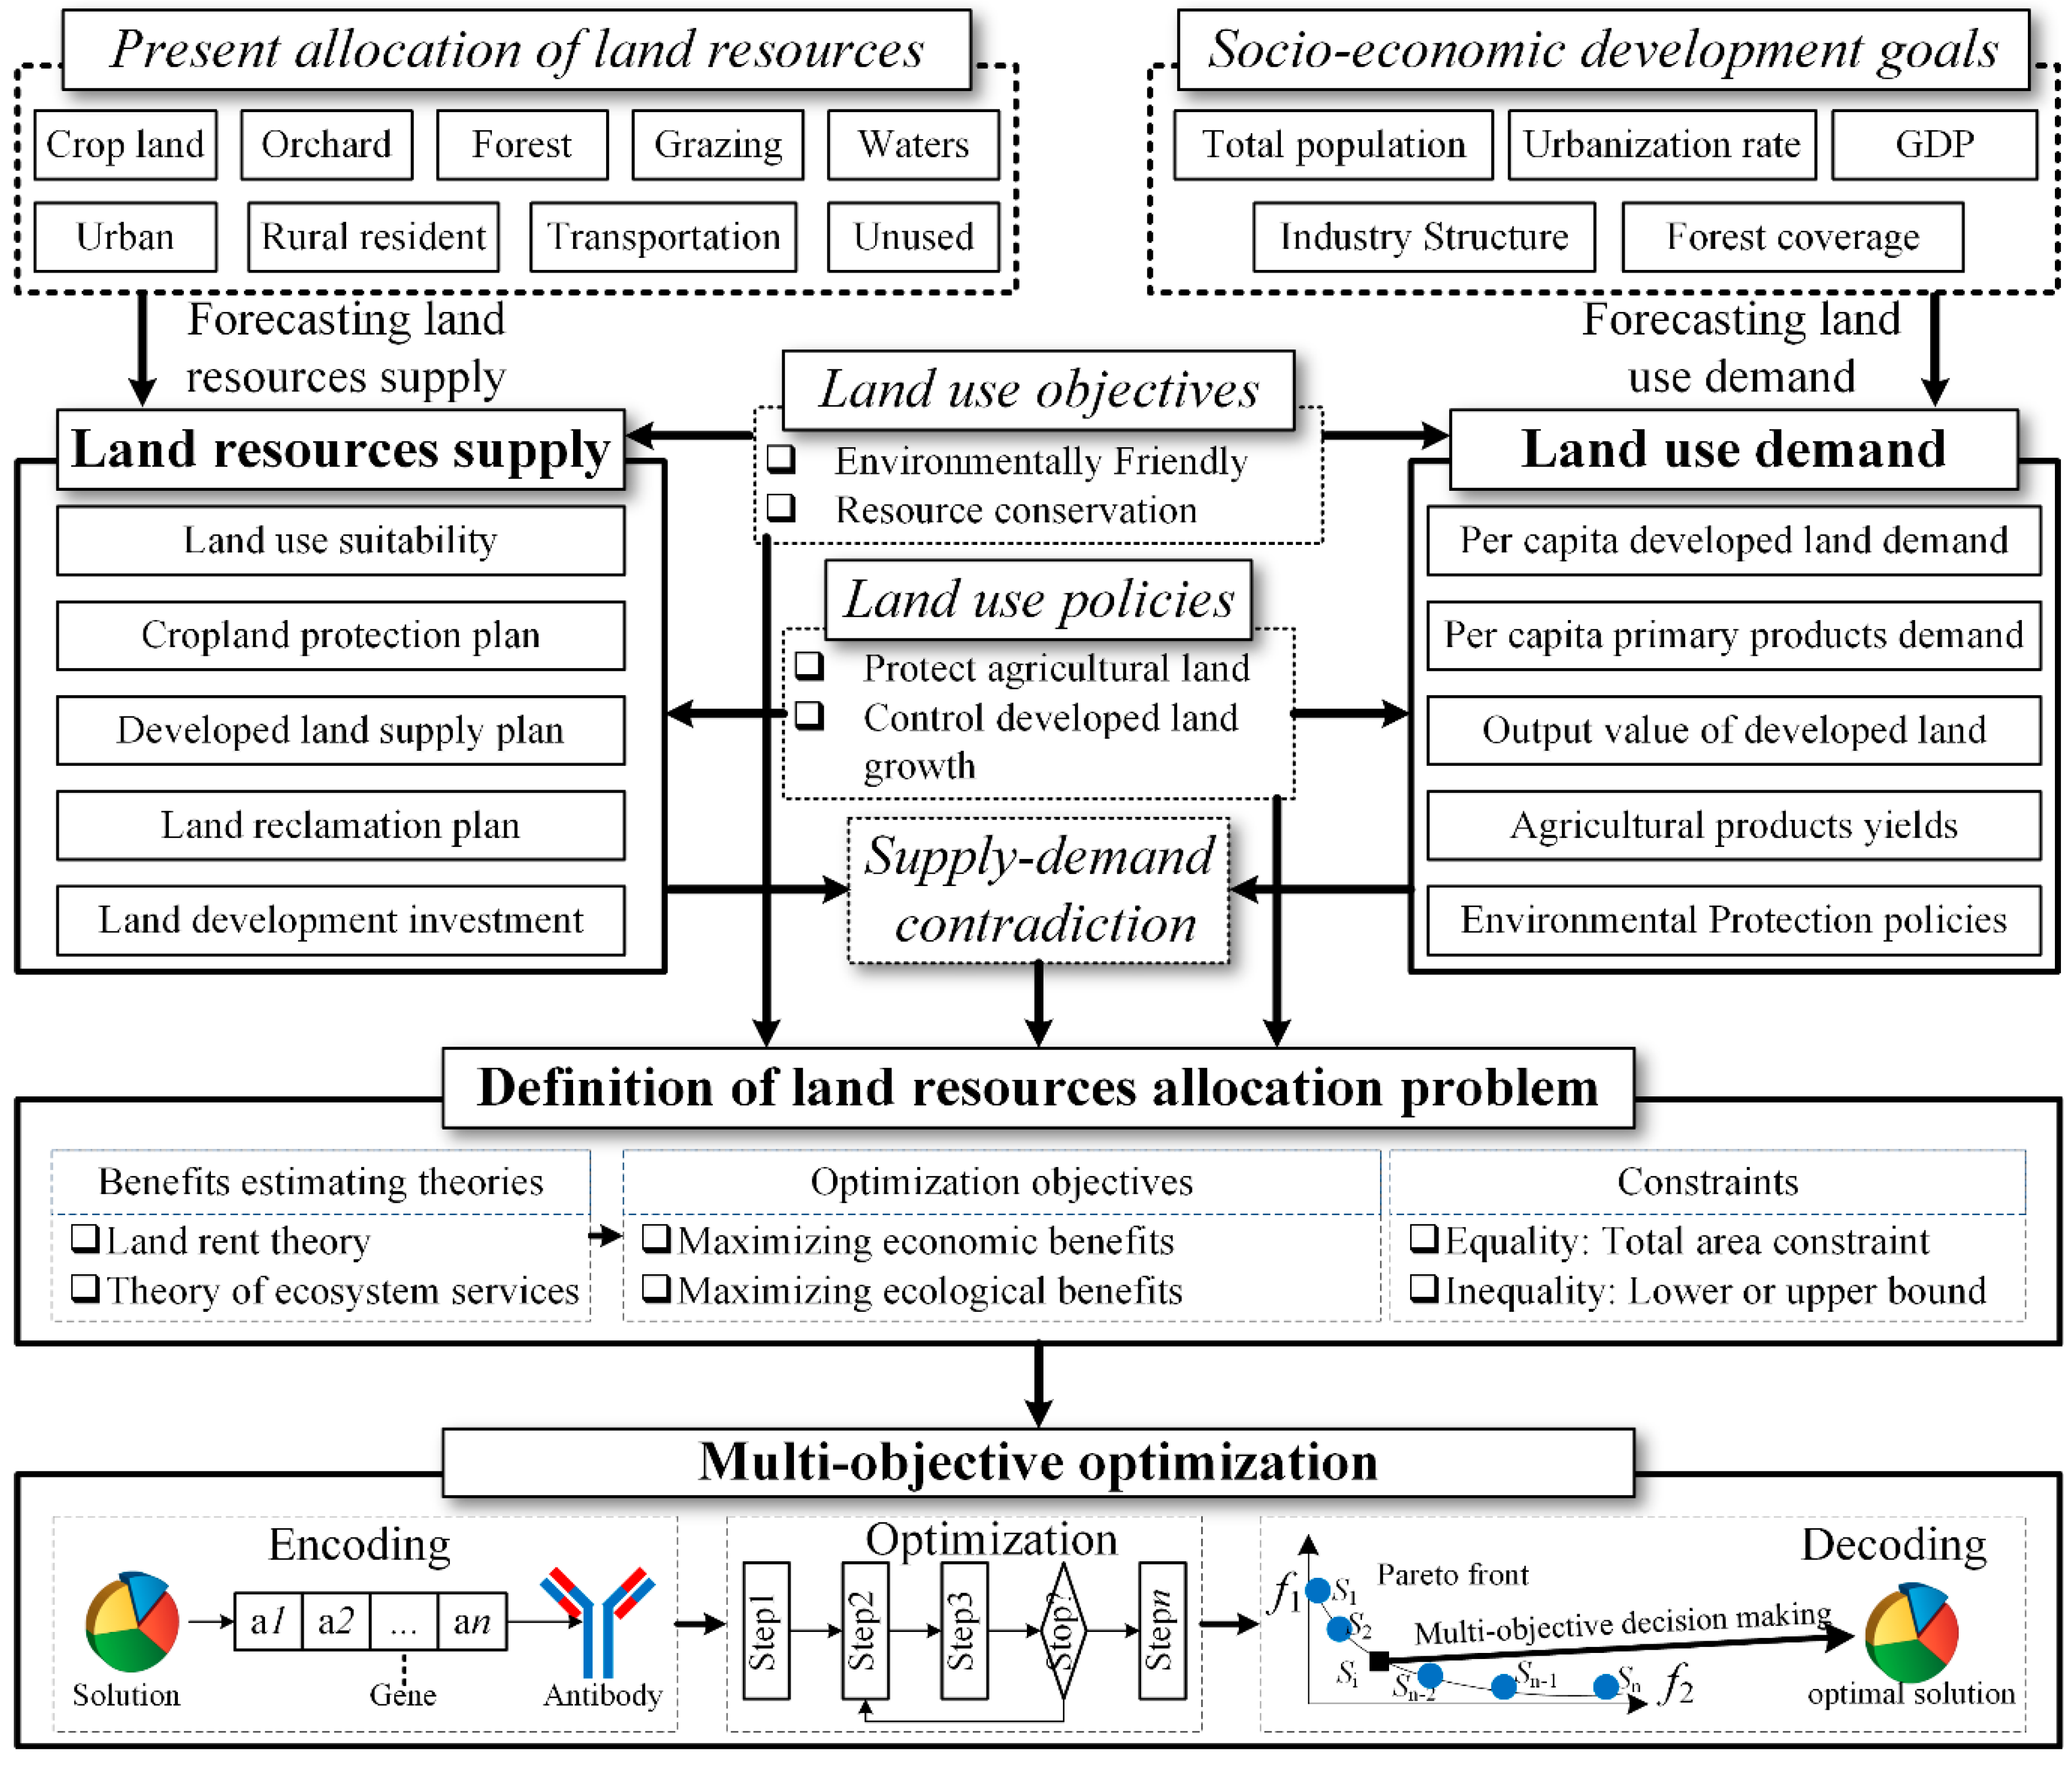
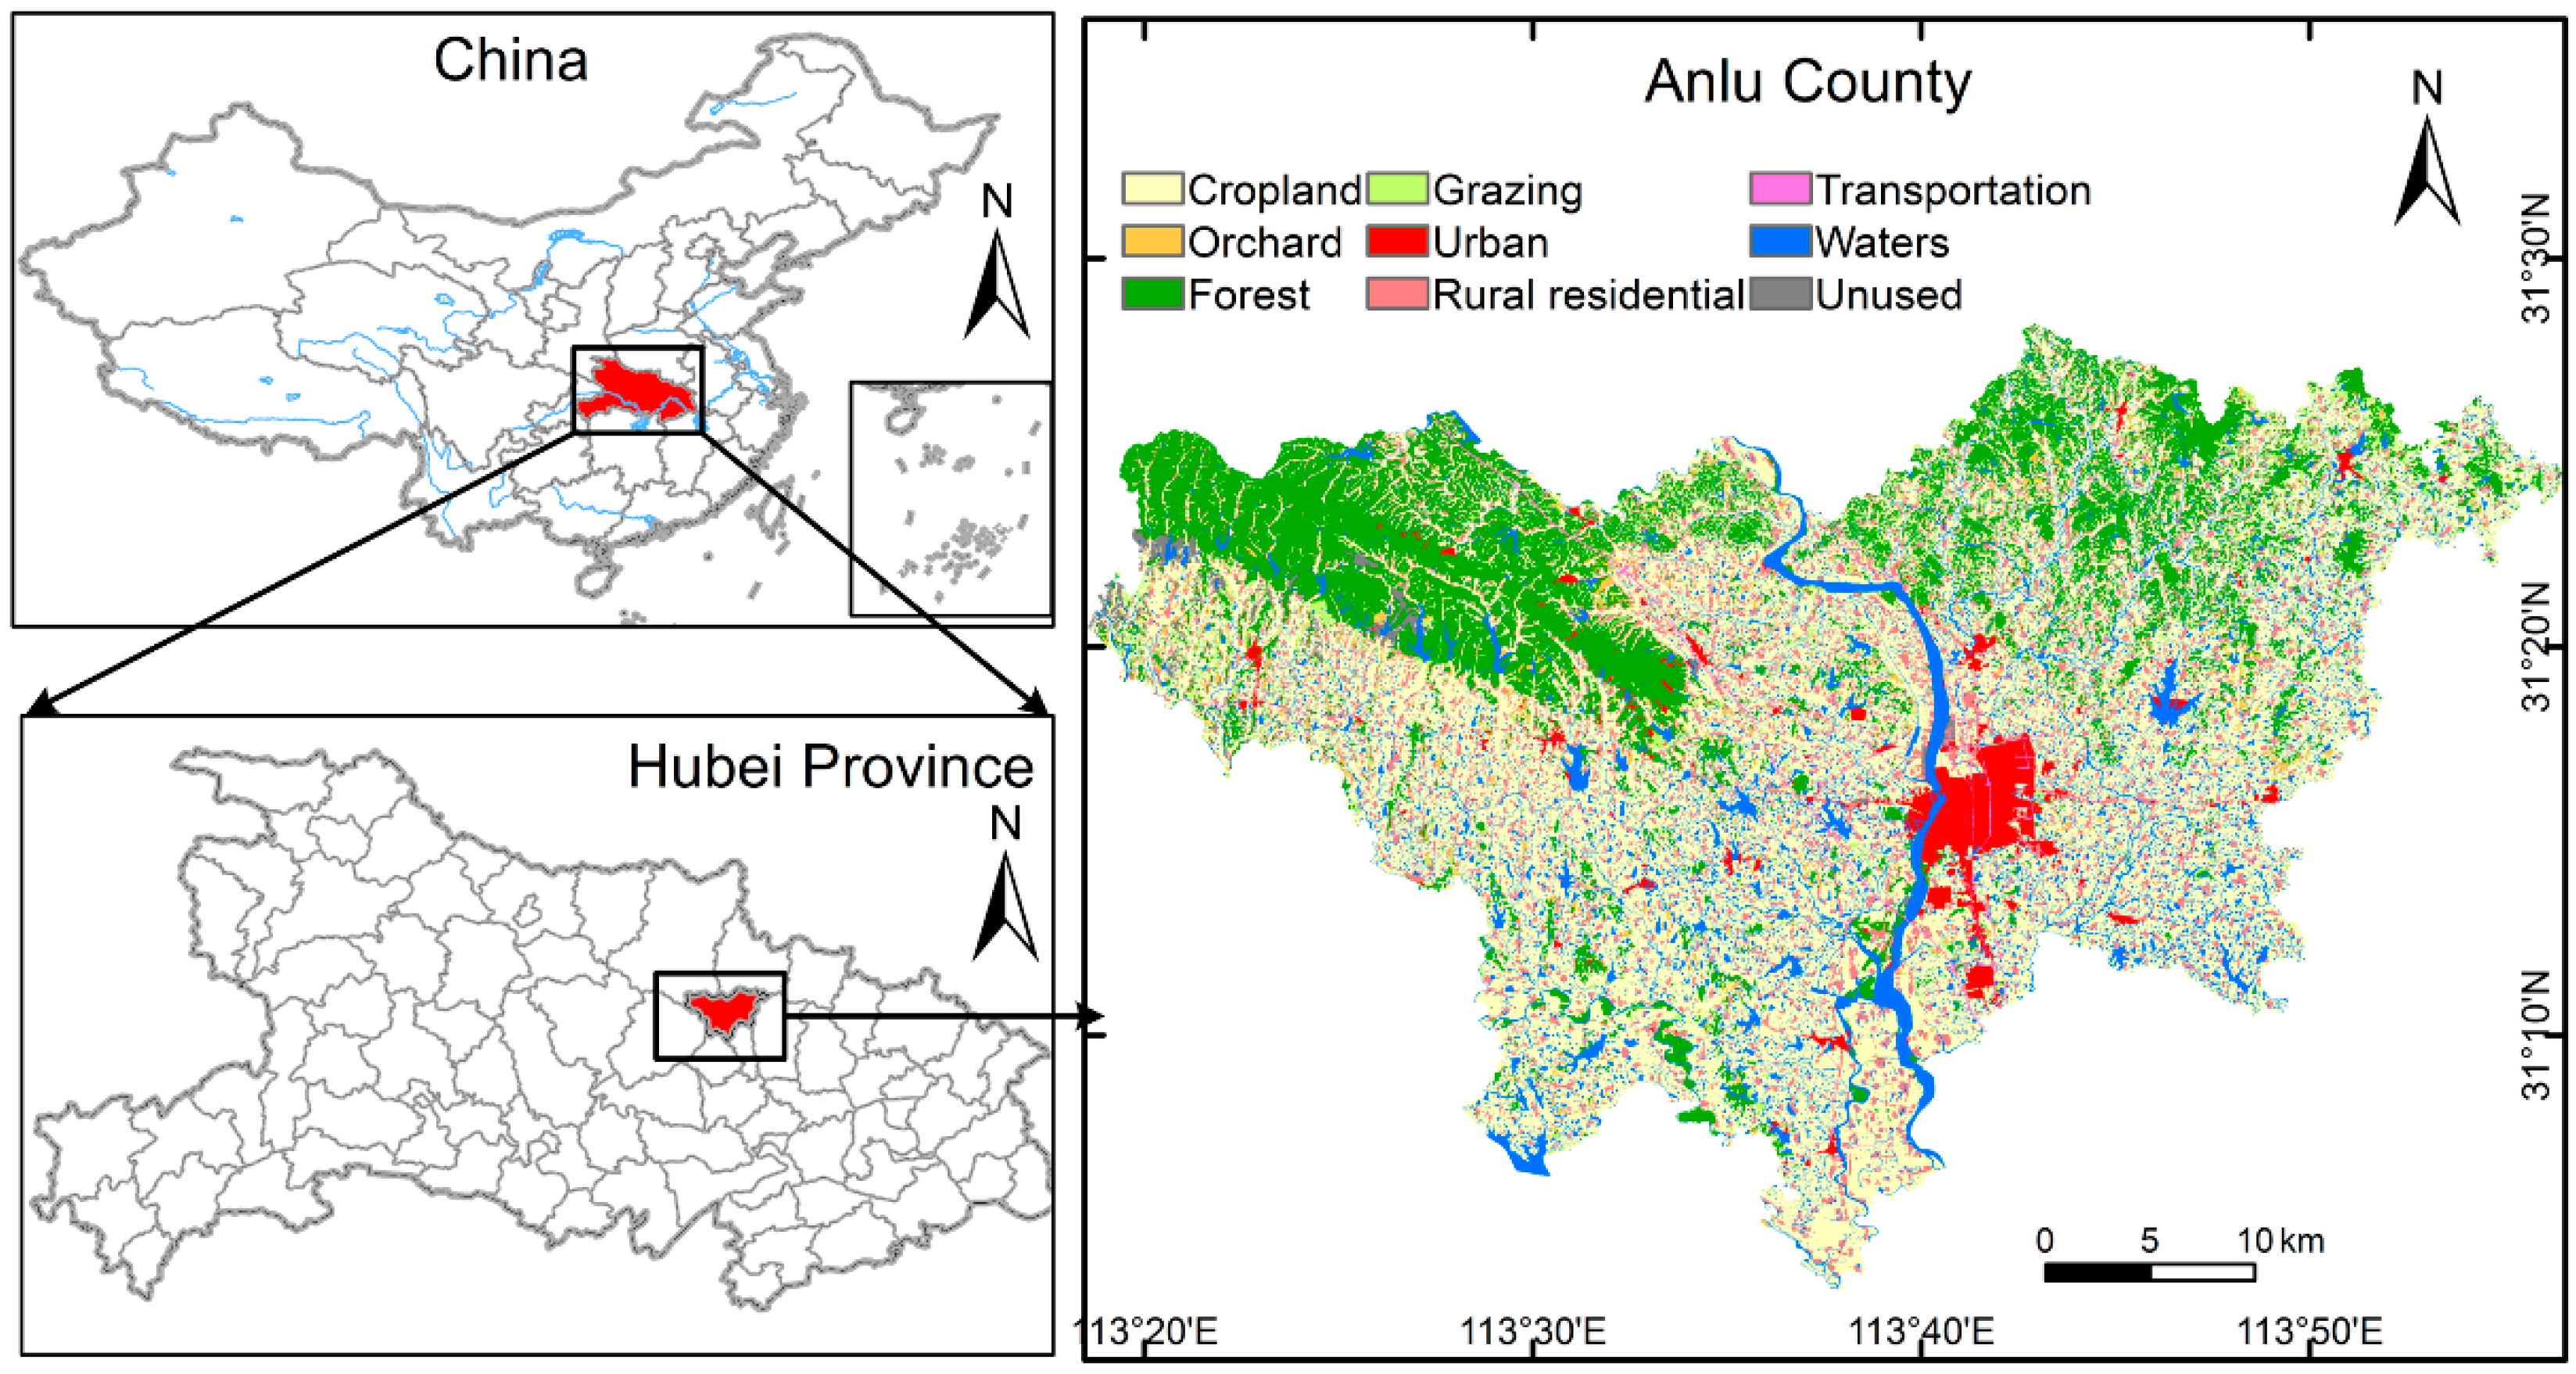
Consequently, the purpose of this study is to develop a multi-objective optimization LUA model based on AIS to further improve the precision and performance of the LUA optimization. Furthermore, in order to obtain more sustainable optimal LUA schemes, the model is designed under the guidance of “resource conservation and environmentally friendly” philosophy. Theories and approaches in different disciplines are applied to design the LUA optimization model: (a) Land economics theories are adopt to build the framework for analyzing the dynamic balance between the land use supply and demand under the social and economic development situations in the region; (b) The ecosystem service value theory and land rent theory are introduced to estimating the ecological and economic benefits of land use. MOAIM-LUA is currently applied to optimizing and adjusting the LUA scheme in Anlu County, Hebei province, China, but it is easily adaptable to other geographic areas.
The structure of this paper is as follows: Section 2 describes the MOAIS framework for LUA; Section 3 uses the optimization model proposed in the present study to solve the LUA problem for Anlu County, Hebei province, China; Section 4 discusses the experimental results and the optimization performance of the model; Section 5 provides the conclusions of the present study.

2. Modeling Framework and Methodology

The core task of LUA is to solve the conflicts between the land use supply and demand in a region and maximize the land use benefits based on the current land use situation in the region and the land use requirements of the future population, economic and social development, and eco-environmental protection. Based on this viewpoint, the MOAIM-LUA model includes three important components-analysis of the land use supply and demand, modeling of the LUA problem and a search for the multi-objective solutions to the LUA problem. Figure 1 shows the framework of the model.
Figure 1. The framework of MOAIS-LUA model.
Sustainability 07 15632 g001

2.1. Analysis of the Land Use Supply and Demand

Analysis of land use supply and demand refers to the analysis of the future supply of and demand for different land use types based on the social and economic development situations in the region. Analysis of the land use supply and demand is the fundamental task of LUA, which includes the following features:
(1) Analysis of the factors that affect land use supply and demand
Current land use situation: the quantitative allocation of different land use types in a region is defined as the land use structure. The current land use structure of a region reflects the land use situation in the region resulting from the current population, social, and economic development conditions, is the basis of LUA, and has an important impact on the future land use supply in the region.
Social and economic development objectives: an LUA optimization scheme for a region is always formulated based on the specific regional population, social, economic, and eco-environmental development conditions. The regional population, social, economic, and eco-environmental development objectives determine the future demand for different land use types in the region, which is also a fundamental basis of LUA. Therefore, before deciding on the LUA scheme, it is necessary to predict the key indexes that directly affect land use demand in the region at the time of planning, such as the total population, urbanization rate, gross domestic product (GDP), industrial structure, and forest coverage, based on the social and economic development objectives of the region, using prediction models such as the logistic and Markov prediction models.
Land use objectives and land management policy guidance: LUA is an important means to realize the land use objectives and is also a reflection of the land management philosophy. “Resource conservation and environmentally friendliness” is the basic objective of current land use management in China. “Protecting cropland” and “controlling the increase in developed land” are the core problems to be solved in current land use management in China. Developed land includes all land other than agricultural land and unused land, such as urban land, rural residential land, and transportation land. The land use objectives and land management policy guidance will guide the design of the objective function and constraint conditions for land use optimization.
(2) Prediction of the supply of land resources refers to the prediction of the areas of different land use types that can be supplied at the time of planning. The supply of land resources includes natural supply and economic supply. The natural supply of land resources is determined by the suitability of land resources for different land use types and is expressed using the following equation:
x i N S i
where x i represents the amount of land resources allocated for the ith land use type and NSi represents the natural supply of land resources for the ith land use type. The natural supply of land resources is inelastic and generally does not change due to human factors or social and economic factors.
The economic supply of land resources is mainly determined by land use objectives and regional land management policy. The main factors that affect the economic supply of land resources include the following: (i) the cropland protection policy determines the minimum area of cropland retained in the region; (ii) the developed land supply plan affects the maximum area of land used for cities, rural residential areas, and transportation; and (iii) the development and reclamation plans for different types of land and land use investments affect the economic supply of the corresponding land use types. Similarly to the natural supply of land resources, the economic supply of land resources can be defined as:
x i E S i
E S i = min 1 j s E S i j
where E S i represents the economic supply of the ith land use type, which is affected by a number of factors; E S i j represents the economic supply of the ith land use type, determined by factor j, which affects the land supply; and s represents the number of factors that affect the supply. The economic supply is dynamic and elastic and is affected by such factors as land development and reclamation and land management policy.
Based on the comprehensive consideration of the natural supply and economic supply of land use, for any arbitrary land use type i, its supply, S i , can be defined as:
S i = min { N S i , E S i }
(3) Prediction of land use demand refers to the prediction of the minimum demands for different land use types at the time of planning and includes several areas, including: (i) Prediction of the demand for developed land is mainly based on such indexes as the population, urbanization rate, average living space per person in cities, average residential area per person in rural areas, and average transportation area per person in the region, and is approached from the perspective of ensuring human settlements and development to estimate the minimum demands of the future regional social and economic development for different types of developed land; (ii) Prediction of the demand for cropland is approached from the perspective of meeting the agricultural product requirements for human survival, to estimate the future demand from the regional population for different types of agricultural land. Prediction of the demand for agricultural land is mainly based on such indexes as the per-person demand for agricultural products (grains, fruits, woods, etc.), yield levels of the main crops in the region (rice, wheat, rapeseed, peanut, cotton, etc.) and regional population to estimate the future minimum demands for various types of agricultural land in the region, including cropland, orchards, forest land, and grazing land; (iii) Analysis of the eco-environmental protection policies is conducted to predict the minimum area of eco-environmental protection land, such as forest land, required by the regional eco-environmental protection policy and plan. The prediction of land use demand is defined as follows:
x i D i
D i = max 1 j d D i j
where D i represents the demand for the ith land use type, which is affected by a number of factors; D i j represents the minimum demand for the ith type of land determined by factor j, which affects the land demand; and d represents the number of factors that affect the demand.

2.2. Definition and Description of LUA Problems

LUA maximizes land use benefits to solve the conflict between the future land use supply and demand in the region. Like general multi-objective optimization problems, LUA problems can be defined by two aspects – the objective functions of optimization and constraint conditions.

2.2.1. Optimization Objectives

The objective of LUA is generally to maximize the social, economic, and ecological benefits of land use. The social benefits of land use stress the level to which land use satisfies the social demand and the corresponding political and social impacts. Prediction of the land use supply and demand and the balance between the supply and demand already imply the consideration for the social benefits of land use. Therefore, the quantitative modeling of the economic and ecological benefits of land use is primarily considered when designing the objective functions.
(1) Objective of economic benefits: The objective of the economic benefits of land use is to maximize the economic benefits of land use in the region, which are defined as follows:
f 1 ( x ) = max ( i = 1 N E c o i × x i )
where f 1 ( x ) represents the total economic benefits obtained from land use, N is the number of land use types in the area, x i is the area of the i-th land use type, and E c o i represents the economic benefits per unit area of the i-th land use type.
When evaluating the economic benefits of land use, the land rent and price theory is generally used to analyze the input and output of land use in order to determine the average per-unit area outputs of different land use types in the region. In the present study, the land use types, which are related to urban and transportation land and used for secondary and tertiary industries, are estimated using such economic indexes as the output values of the secondary and tertiary industries based on the method designed in reference [20]. For the land-use types related to cropland, orchards, forest land, grazing land, and waters, the annual per-unit area economic outputs of different types of agricultural land are estimated using the income capitalization approach based on the inputs and outputs of different types of agricultural land.
(2) Objective of ecological benefits: The ecological benefits of land use are evaluated based on the “Ecosystem Service valuation (ESV)” theory. The ESV theory defines ecosystem services as the benefits humans derive from ecosystem functions [46]. The ESV process refers to the process of quantitatively evaluating ecosystem services by integrating ecology and economics, so as to explain the effects of human activities on ecosystem functions [47]. Therefore, in the past decade, the ESV approach has been widely applied to the analysis of the effects of land use or land cover change on ecosystems and environments [48,49,50]. Therefore, in this study, the ESV approach will be used to estimate the ecological benefits of land use. The ecological objective of the model can be defined as follows:
f 2 ( x ) = max ( i = 1 N E s v i × x i )
where f 2 ( x ) represents the total ecological benefits obtained from land use, N is the number of land use types in the area, x i is the area of the i-th land use type, and E s v i is the value of ecosystem services per unit area of the i-th land use type.

2.2.2. Constraint Conditions

As Land is a limited natural resource, LUA is constrained by the land use supply and demand in the region. LUA includes the following two types of constraint conditions:
(1) Equality constraints: the total amount of land resources that can be allocated to different land use types must be equal to the total land use area that can be allocated in the region. The equation is as follows:
T A = i = 1 N x i
where TA is the total study area and N is the number of land use types in the study area.
(2) Inequality constraints: the areas that can be allocated to different land use types are constrained by the supply of and demand for land resources, which are defined as follows:
D i x i S i
where D i represents the demand for the ith land use type, which determines the lower limit of the area allocated to the ith land use type, and S i represents the supply of the ith land use type, which determines the upper limit of the area allocated to the ith land use type.

2.3. Design of the Multi-Objective Optimization Algorithm

In the past 10 years, a number of artificial immune model-based multi-objective optimization algorithms have been proposed, including the evolutionary multi-objective immune algorithm [45], the non-dominated neighbor immune algorithm [51], the weight-based multi-objective artificial immune system [52], and the novel immune clonal algorithm (NICA). Experiments have demonstrated that among the existing algorithms, the quality of non-dominated solution sets obtained using the NICA is, in most cases, far superior to that obtained using other algorithms [32].Therefore, the present study uses the NICA as an essential method for solving the multi-objective LUA optimization problems. Figure 2 shows the flow chart of the NICA algorithm.
Figure 2. Flow of the NICA.
Sustainability 07 15632 g002
As shown in Figure 2, the basic flow of the NICA includes the following several steps. (1) Population initialization. In this step, the initial population is generated based on the given population scale, N. (2) Immune clone. In this step, the Pareto-optimal set is selected from the parent population. Additionally, based on the given cloning coefficient, c, all the solutions in the Pareto-optimal set are replicated c times. (3) Immune mutation. In this step, based on the given mutation probability, m, the values of certain genes of the antibodies are randomly altered to obtain new antibodies. (4) Antibody evaluation. In this step, the objective functions are used to calculate the objective values vector corresponding to each antibody. (5) In this step, based on the objective values vector of each antibody in the population, the population is divided into a non-dominated solution set and Pareto-optimal set using the Pareto dominance principle. (6) Crowding distance sorting. In this step, based on the idea of the NSGAII, crowding distance sorting is performed on the antibody population and the distribution density of the antibody population at the Pareto-optimal front is estimated. (7) Population update. In order to improve the algorithm efficiency, if the number of the obtained Pareto-optimal sets, P c , is greater than the pre-set number, P m a x , then one solution with the smallest crowding distance is eliminated based on the crowding distance sorting results; the crowding distances of the antibody population are then recalculated. This process is repeatedly carried out until P c = P m a x . (8) In this step, if the current iteration number of the algorithm, I t , is determined to be equal to the pre-set maximum iteration number, I t m a x , then the algorithm stops and the final optimization results are output. Otherwise, return to Step (2) until I t = I t m a x . The technical details of the NICA and crowding distance sorting can be found in references [39] and [53] and are thus not elaborated in the present study.
In the present study, the NICA is used as the method for solving multi-objective land resource allocation optimization problems. In the NICA, some calculation processes, such as cloning, non-dominated sorting, and crowding distance calculation, are unrelated to the antibody data structure and are conducted by directly applying the classical model [32]. Due to the fact that antibody mutation is closely related to the antibody data structure and also to avoid the generation of solutions that violate the constraint conditions during the random mutation process, it is necessary to redesign the initialization and mutation algorithms in the NICA.

2.3.1. Antibody Initialization Algorithm

(1) Based on the constraint intervals between the upper and lower limits of the decision variables, the initial value of each gene is generated using the random method, which is defined as follows:
x i = r a n d ( L i , U i )
where x i represents the value of the ith gene; r a n d represents the function for generating random numbers; L i represents the lower bound value of the ith gene; and U i represents the upper bound value of the ith gene.
(2) The values of variables, u i ,   l i , T A , Δ A , U ,  L , R U i and R L i are calculated using the following equations:
u i = a b s ( U i x i )
l i = a b s ( L i X i )
T A = i = 1 N x i
U = i = 1 N u i
L = i = 1 N l i
Δ A = T A T A '
R U i = u i U
R L i = l i L
where U i represents the upper limit of the value of x i ; L i represents the lower limit of the value of x i ; T A represents the total regional land use area that can be allocated; N represents the number of decision variables in the region; abs means to take the absolute value function; T A represents the sum of the values of the current antibody genes; U represents the sum of all the u i values; L represents the sum of all the l i values; R U i represents the proportion of the value of u i corresponding to gene i to U ; R L i represents the proportion of the value of l i corresponding to gene i to L .
(3) Antibodies are repaired to allow the sum of genes to be equal to the total regional land use area:
If Δ A > 0 , then the following operation is performed on all the antibody genes:
x i = x i + Δ A × RU i
If Δ A < 0 , then the following operation is performed on all the antibody genes:
x i = x i Δ A × LU i
If Δ A = 0 , then no operation is necessary.

2.3.2. Antibody Mutation Algorithm

Figure 3 shows the design concept for the antibody mutation algorithm. The flow of the algorithm is described as follows:
(1)
Two mutation points are randomly generated on an antibody.
(2)
The upper and lower bound values of the decision variable corresponding to the gene at each mutation point are obtained. Additionally, the differences between the gene value at mutation point 1 and the upper and lower bound values, λ 11 and λ 12 , are calculated, as are the differences between the gene value at mutation point 2 and the upper and lower limit values, λ 21 and λ 22 .
(3)
Through comparison, the minimum value between λ 11 and λ 12 is obtained and denoted as λ 1 . Similarly, the minimum value between λ 21 and λ 22 is obtained and denoted as λ 2 .
(4)
Through comparison, the maximum value between λ 1 and λ 2 is obtained and denoted as λ.
(5)
A random number in the range of (0-λ) is generated and denoted as Δ.
(6)
The magnitudes of λ 1 , λ 2 and Δ are compared. Based on the principle shown in Figure 3, the values of the two mutation points are altered to obtain the mutated antibody.
Figure 3. Design of the Antibody mutation algorithm.
Sustainability 07 15632 g003

3. Case Study

3.1. Description of the Study Area

Anlu County is located in the northeastern region of Hubei Province, China, between 113.31° E and 113.95° E and between 31.06° N and 31.41° N (Figure 4). Anlu County is approximately 80 km away from Wuhan, the capital city of Hubei Province, and is an important component of the Wuhan metropolitan area, which is a “resource conservation, environmentally friendly, social construction and comprehensive coordinated reform pilot area.”
Figure 4. Location map of Anlu County, Hubei Province, China.
Sustainability 07 15632 g004
At the end of 2014, the 15 towns and villages and one economic development area in the District of Anlu County had a total population of 623,200 and a GDP of 15.946 billion yuan. The output values of the primary, secondary, and tertiary industries were 3.403 billion yuan, 6.457 billion yuan, and 6.086 billion yuan, respectively. The total land use area in Anlu County was 1350 km2. Cropland had an area of 65,306 ha, accounting for 48.36% of the total land use area. Forest land had an area of 26,257 ha, accounting for 19.44% of the total land use area. Cities and towns had an area of 12,238 ha, accounting for 9.06% of the total land use area. Table 1 lists the land area used for various purposes in Anlu County at the end of 2014. Figure 4 shows the corresponding spatial distribution of land use. In Table 1, the land use types that participate in allocation optimization are defined as decision variables and are also numbered (x1–x8). For wetland protection purposes, it is assumed that the surface area of the waters will not change in the future years. Therefore, the total amount of land resources that are to be allocated in Anlu County is 1178km2.
Table 1. Land use structure of Anlu County in 2014.
Land use typeCurrent Area(ha)Percentage (%)
Cropland (x1)65,30648.36
Orchard (x2)15211.13
Forest (x3)26,25719.44
Grazing (x4)25591.90
Urban (x5)36032.67
Rural residential (x6)12,2389.06
Transportation (x7)24741.83
Water17,27012.79
Unused(x8)38062.82
Σ135,034100.00
Benefiting from good climate conditions, abundant natural resources, and an advantageous transportation location, Anlu County has not only become an important commodity grain production base in China, but is also an important agricultural machinery production and food processing industry base. In the past 10 years, the GDP of Anlu County increased at an average annual rate of approximately 14%. Additionally, Anlu County underwent rapid industrialization and urbanization processes. The proportion of the output value of the non-agricultural industry to the GDP of Anlu County increased by approximately 1% every year and reached 79% in 2014. The urbanization rate increased by approximately 2% every year and reached 43% in 2014. In order to meet the requirements of the regional social and economic development for land use and reduce the negative impact of rapid urbanization and industrialization on the sustainable use of land, it is necessary to optimize the allocation of the limited land resources in the region based on the “resource conservation and environmentally friendly” development concept. Therefore, the present study optimizes the allocation of the land resources in Anlu County for 2030 based on the social and economic development objectives of Anlu County for 2030 using the proposed MOAIM-LUA.

3.2. Data Acquisition and Pre-Processing

Based on the data requirements of the MOAIM-LUA operation, the current land use situation in Anlu County, the results of the land suitability evaluation and the data for the standard land prices are obtained from the Land Resources Bureau of Anlu County. The statistical yearbooks for 2010–2014 are obtained from the Bureau of Statistics of Anlu County. Additionally, in order to more accurately predict the land use demand, the Planning Outline of Economic and Social Development of Anlu County and the Overall Urban Planning of Anlu County (2013–2030) are also collected. Based on the aforementioned data, the basic data needed for the operation of the MOAIM-LUA are pre-processed, including the following actions:
(1) Prediction of the social and economic development situation in the target year (i.e., 2030). Based on the data in the statistical yearbooks of 2010–2014 and the Planning Outline of Economic and Social Development of Anlu County, the social and economic development situation of Anlu County is predicted. Based on the prediction results, Anlu County will have a total population of approximately 731,200, a GDP of approximately 6.66 billion yuan and an urbanization rate of 70% in 2030.
(2) Prediction of the land use supply and demand in the target year (i.e., 2030). Based on the results of the social and economic development prediction, the current land use situation, the results of the land suitability evaluation in Anlu County and the Overall Urban Planning of Anlu County (2013–2030), the natural supply of land use, the economic supply of land use, and the demand for land use in Anlu County in 2030 are estimated using the MOAIM-LUA land use supply and demand prediction principle. On this basis, the upper and lower bound constraint values for various LUA types are obtained (see Table 2).
Table 2. Upper and lower bound values of the optimization decision variables (ha).
Land Use Typex1x2x3x4x5x6x7x 8
lower3949213012625723034862981826343050
upper69813167337926281554271223828993806
(3) Estimation of the land use economic and ecological benefit coefficients. The land use economic benefit coefficient is estimated mainly based on the results of the standard land price evaluations in cities and towns and the input and output data for agricultural land in the statistical yearbooks. The land use ecological benefit coefficient is estimated using Costanza’s ecosystem service value evaluation method [46] based on the results of the study conducted by Xie et al. [54]. Table 3 lists the results of the estimation of the economic and ecological benefit coefficients for land use in Anlu County in 2030.
Table 3. Economic benefit and ecological benefit coefficients for each land use type (yuan ha−1·year−1).
Land Use Typex1x2x3x4x5x6x7x 8
economic benefit coefficients5250578323332041298,14289,60021,0000
ecological benefit coefficients21,55246,47368,15022,5820001310

4. Results and Discussions

4.1. Optimal Solutions

The MOAIM-LUA proposed in the present study is developed using the C# language in Aitso [55]. Additionally, the basic data needed for the operation of the MOAIM-LUA for Anlu County are inputted into the model. The parameters of the model were set based on the experiences from previous studies and several testing experiments. Therefore, The MOAIM-LUA is run using the parameter configuration listed in Table 4 and a Pareto front is obtained (see Figure 5).
Table 4. The parameter values of the Model.
ParameterNcmPmaxItmax
Parameter value20040.1500100
Figure 5. The Pareto front generated by MOAIM-LUA.
Sustainability 07 15632 g005
As shown in Figure 5, non-dominated solutions at the inflection points A, B, C, and D on the Pareto front are selected as the alternative planning solutions under different decision preferences. Solutions A and B stress the ecological benefits of land use and have relatively poor economic benefits. Solutions C and D stress the economic benefits of land use but have relatively poor ecological benefits. Table 5 lists the LUA schemes corresponding to solutions A, B, C, and D and their optimized objective values.
Table 5. Land resource allocation and its effectiveness in 2014 and 2030 (ha, billion yuan).
Solutionf1f2x1x2x3x4x5x6x7x8
20142.6413.33065,306152126,2572559360312,23824743806
A2.7963.63361,700130632,09023044862981826343050
B2.9613.59561,703130531,52923035421981826343050
C3.1753.42761,701133229,0422306542712,23726693050
D3.1873.30163,901167126,2732307542712,23828973050
In Table 5, the ecological and economic benefits of solutions A, B and C are all superior to those of the current situation, whereas the ecological benefits of scheme D are slightly inferior to those of the current situation. When compared to the current situation, the unused land is used as much as possible in all the optimization solutions and the urban area increases relatively significantly. In solutions A and B, which stress the ecological benefits, the cropland area decreases to the lower bound value allowed by the land management policy, the rural residential areas decrease by approximately 20.5%, and the forest land area increases by more than 20.0%. In solution D, which stresses the economic benefits, the forest land and rural residential areas remain the same as those in the current situation, the orchard area increases to a certain extent, the area of cities and towns increases by approximately 50.6%, and the land area used for transportation increases by 17.1%. In the aforementioned solutions, if “the ecological benefits have priority” is used as the leading philosophy of land use planning, then it is necessary, in future land management, to increase the development of and investment in the land in non-urban areas, return cropland with relatively poor tillage conditions to forest land, manage and intensively use rural residential areas and “hollow villages,” moderately control the scale of urban land, and increase the forest coverage as much as possible. If the “economic benefits have priority,” then it is necessary to increase the investment in urban development and transportation facilities and increase the scale of land for cities and transportation. Additionally, for agricultural land use, it is necessary to properly increase the orchard area and increase the income level of farmers. Overall, in view of the rapid urbanization background and “eco-environmental protection” objective of Anlu County, solution B is clearly more in accordance with the land use philosophy of “resource conservation and environmentally friendly”.

4.2. Performance Evaluation of the Model

In order to quantitatively evaluate the performance of the MOAIM-LUA, three indexes – generational distance (GD), spacing (S), and maximum spread (MS)—are selected as the performance measures for the model [32]. The smaller the GD, the closer the non-dominated solution set obtained using the current algorithm is to the real Pareto solution set. The smaller the S, the more even the distribution of the solutions in the non-dominated solution set obtained using the algorithm. The greater the MS, the wider the distribution of the non-dominated solution set obtained using the algorithm on the Pareto front. For the expressions of GD, S, and MS, please see reference [56] for details.
The Non-dominated Sorting Genetic Algorithm-II (NSGAII) [53] is considered a multi-objective optimization algorithm with exceptional performance and has been widely used in the construction of multi-objective LUA optimization models [20]. Therefore, the present study uses the NSGAII for comparison. To accurately and objectively evaluate the difference in performance between algorithms, the NSGAII and NICA are independently executed 30 times and 100 iterations are executed each time. A total of 60 non-dominated solution sets are obtained. It is impossible to accurately obtain the real Pareto front of the LUA problem for Anlu County. Therefore, for the necessary evaluation of algorithm performance, the 60 non-dominated solution sets obtained by independently running the two models 30 times are merged together. On this basis, a new Pareto solution set is obtained based on the Pareto dominance principle, which is viewed as the real Pareto solution set. The values of the GD, S, and MS are calculated for each solution set obtained by running the NSGAII and each solution set obtained by running the NICA. Additionally, the mean values and coefficients of variation (COVs) of the GD, S, and MS in the 30 independent tests are also calculated (see Table 6).
Table 6. Mean and COV of GD, S, and MS for the test problem.
StatisticGDNICAGDNSGAIISNICASNSGAIIMSNICAMSNSGAII
Mean value13.25931.0500.6211.5250.9990.991
COV0.1580.2370.0830.5460.0000.005
As shown in Table 6, in terms of the mean values, the mean values of the GD, S, and MS obtained from the results of the tests of the NICA are, overall, superior to those of the NSGAII, indicating that the NICA has a superior multi-objective optimization capacity. In terms of the COVs of the GD, S, and MS, the COVs of the NICA are all smaller than those of the NSGAII, indicating that the NICA is also superior to the NSGAII in terms of algorithm stability. The box plots of the three indexes (GD, S, and MS) are then produced (see Figure 6).
Figure 6. Box plots of GD (a); S (b); and MS (c) on the test problem.
Sustainability 07 15632 g006
As shown in Figure 6, based on the locations of the medians, quartiles, and maximum and minimum values, it can be concluded that the non-dominated solution set obtained using the optimization model designed in the present study is quite exceptional in terms of approximation to the real Pareto solution set, the level of evenness of the distribution of solution sets, the width of the distribution of solution sets, and the algorithm stability.

5. Conclusions

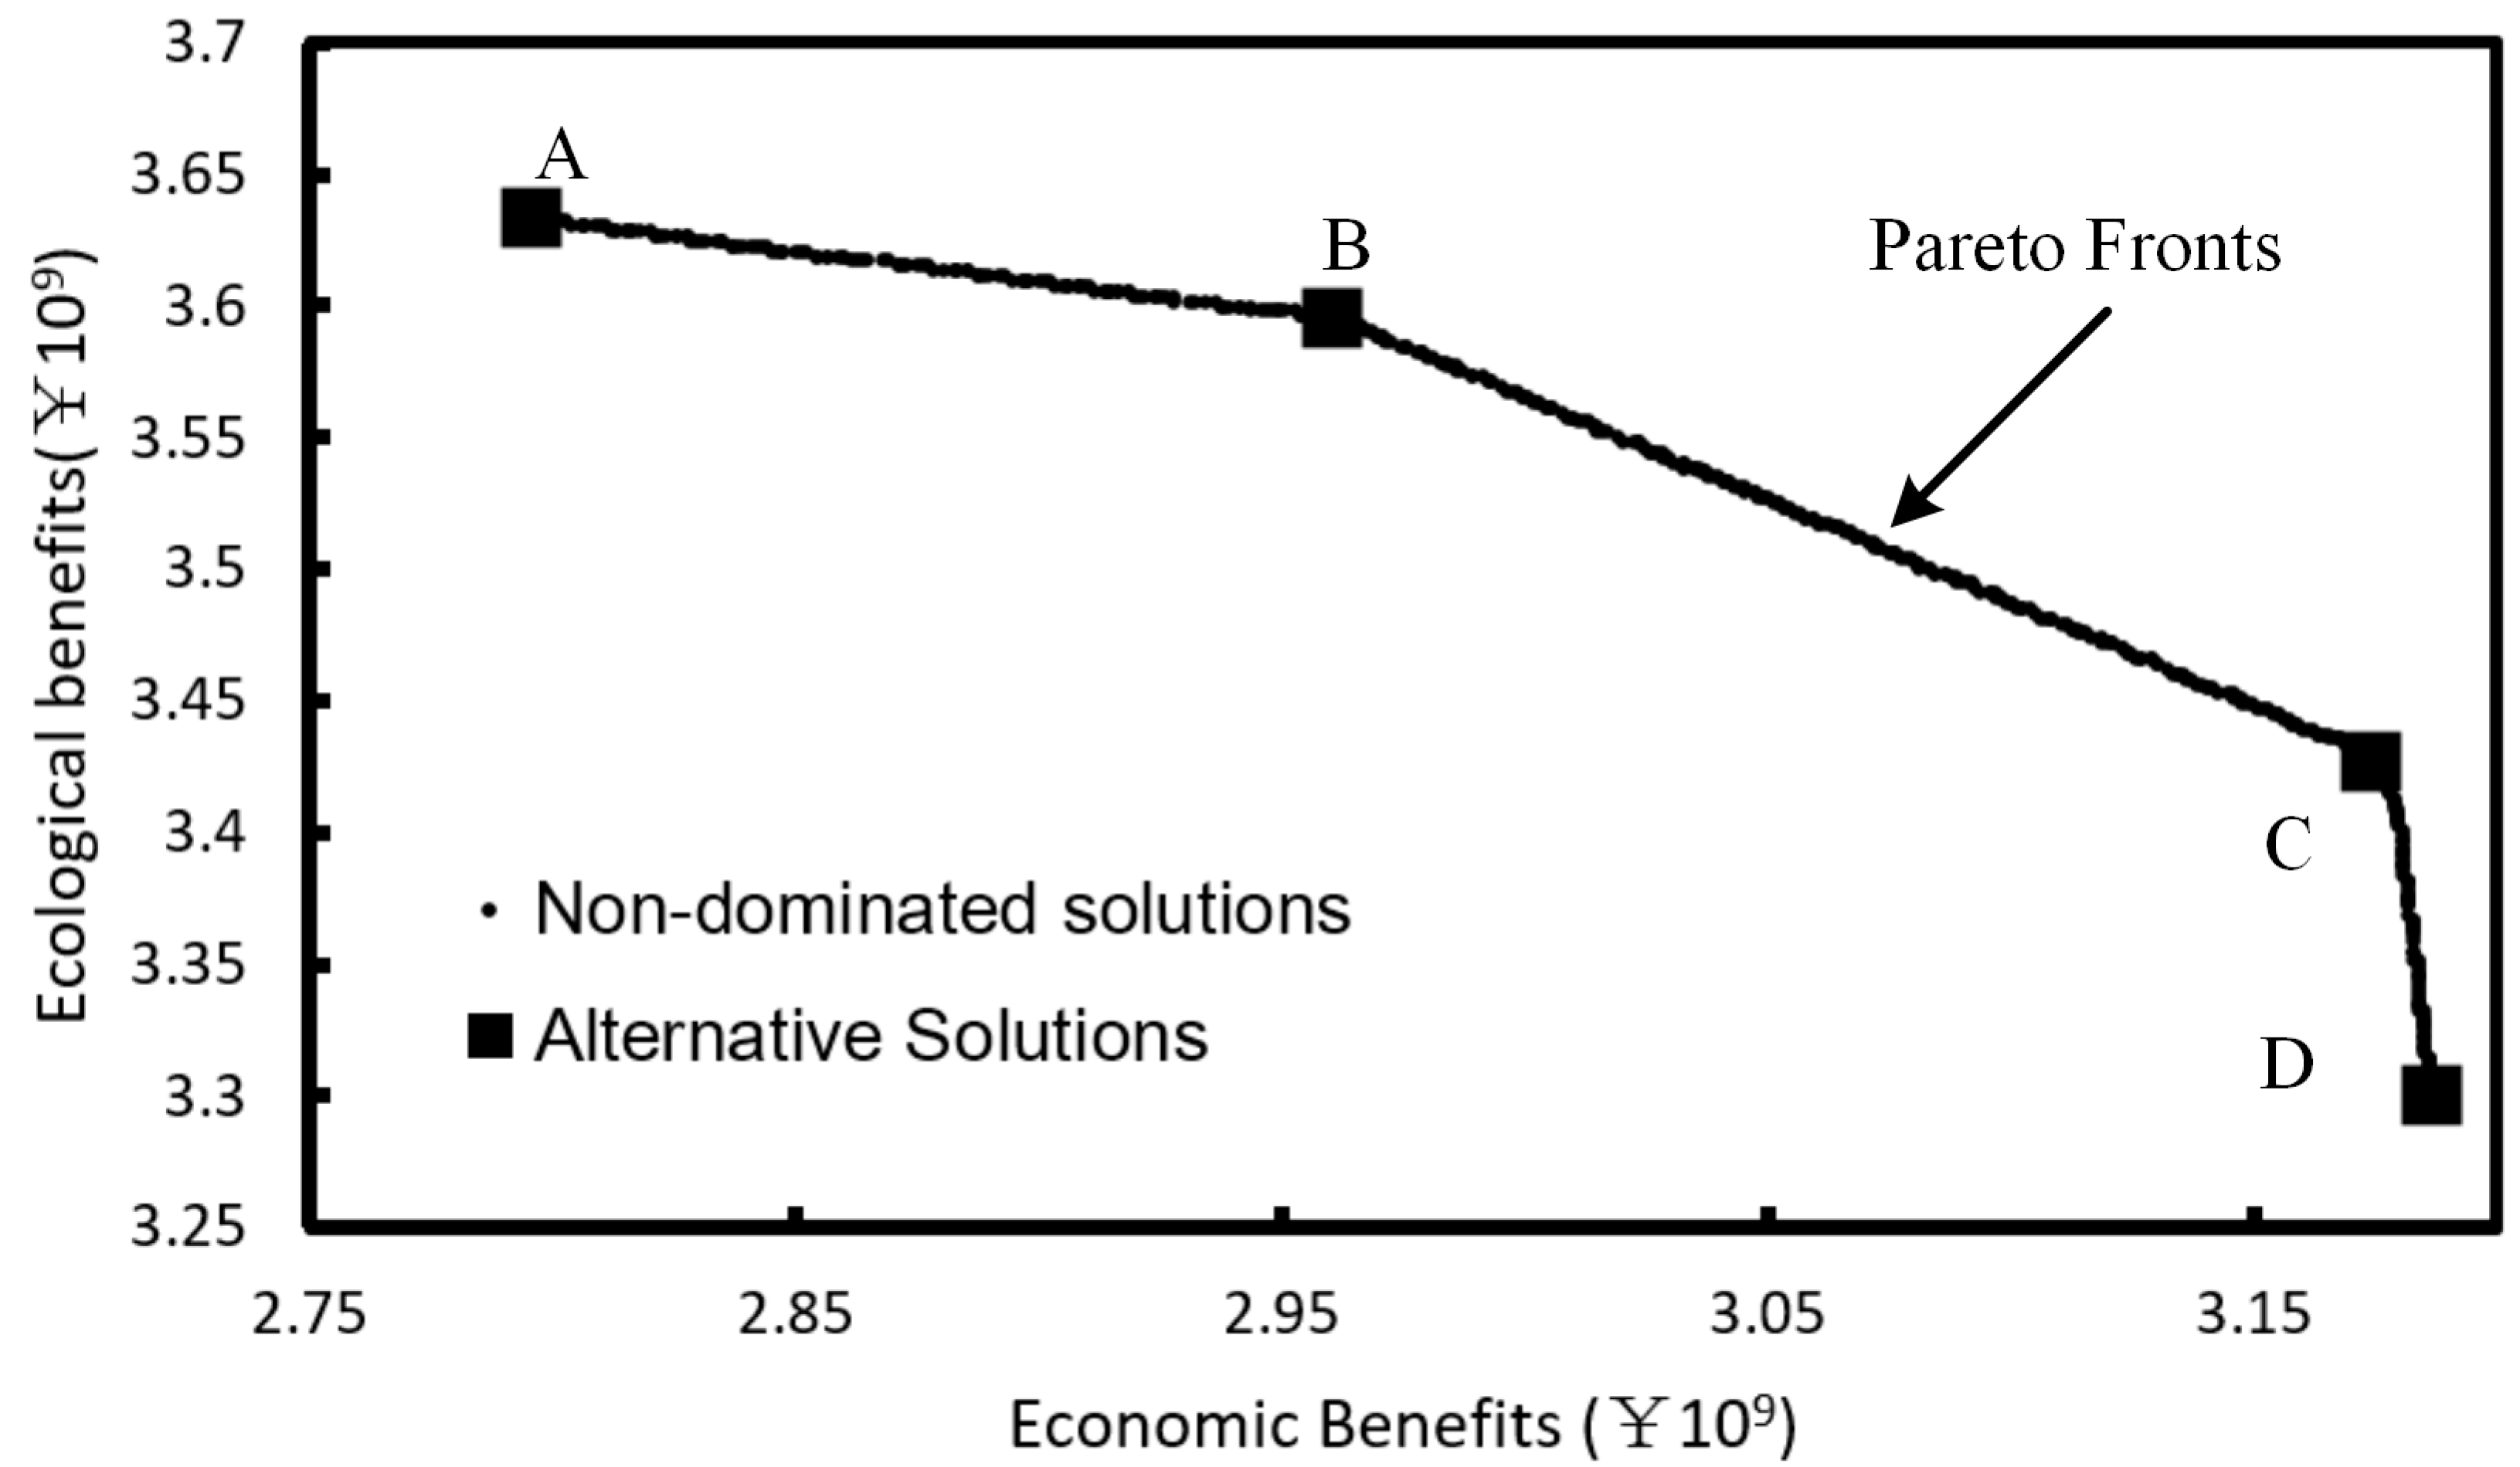
This research proposes a novel LUA optimization model for solving land use allocation optimization problems by comprehensively using the analysis method for the balance between land supply and demand, the ecosystem service value theory, the land rent and price theory, and the multi-objective artificial immune optimization algorithm. On this basis, the present study selects Anlu County, in Hubei Province, China, as the experimental area and solves the LUA optimization problem for Anlu County using the population and social and economic development objectives of Anlu County for 2030 as the case study. Compared to the current LUA situation in Anlu County, the optimized LUA schemes offer significant improvements in the economic and ecological objectives. The experimental results demonstrate that the model designed in the present study can obtain better LUA optimization schemes than the Genetic Algorithms-based models.
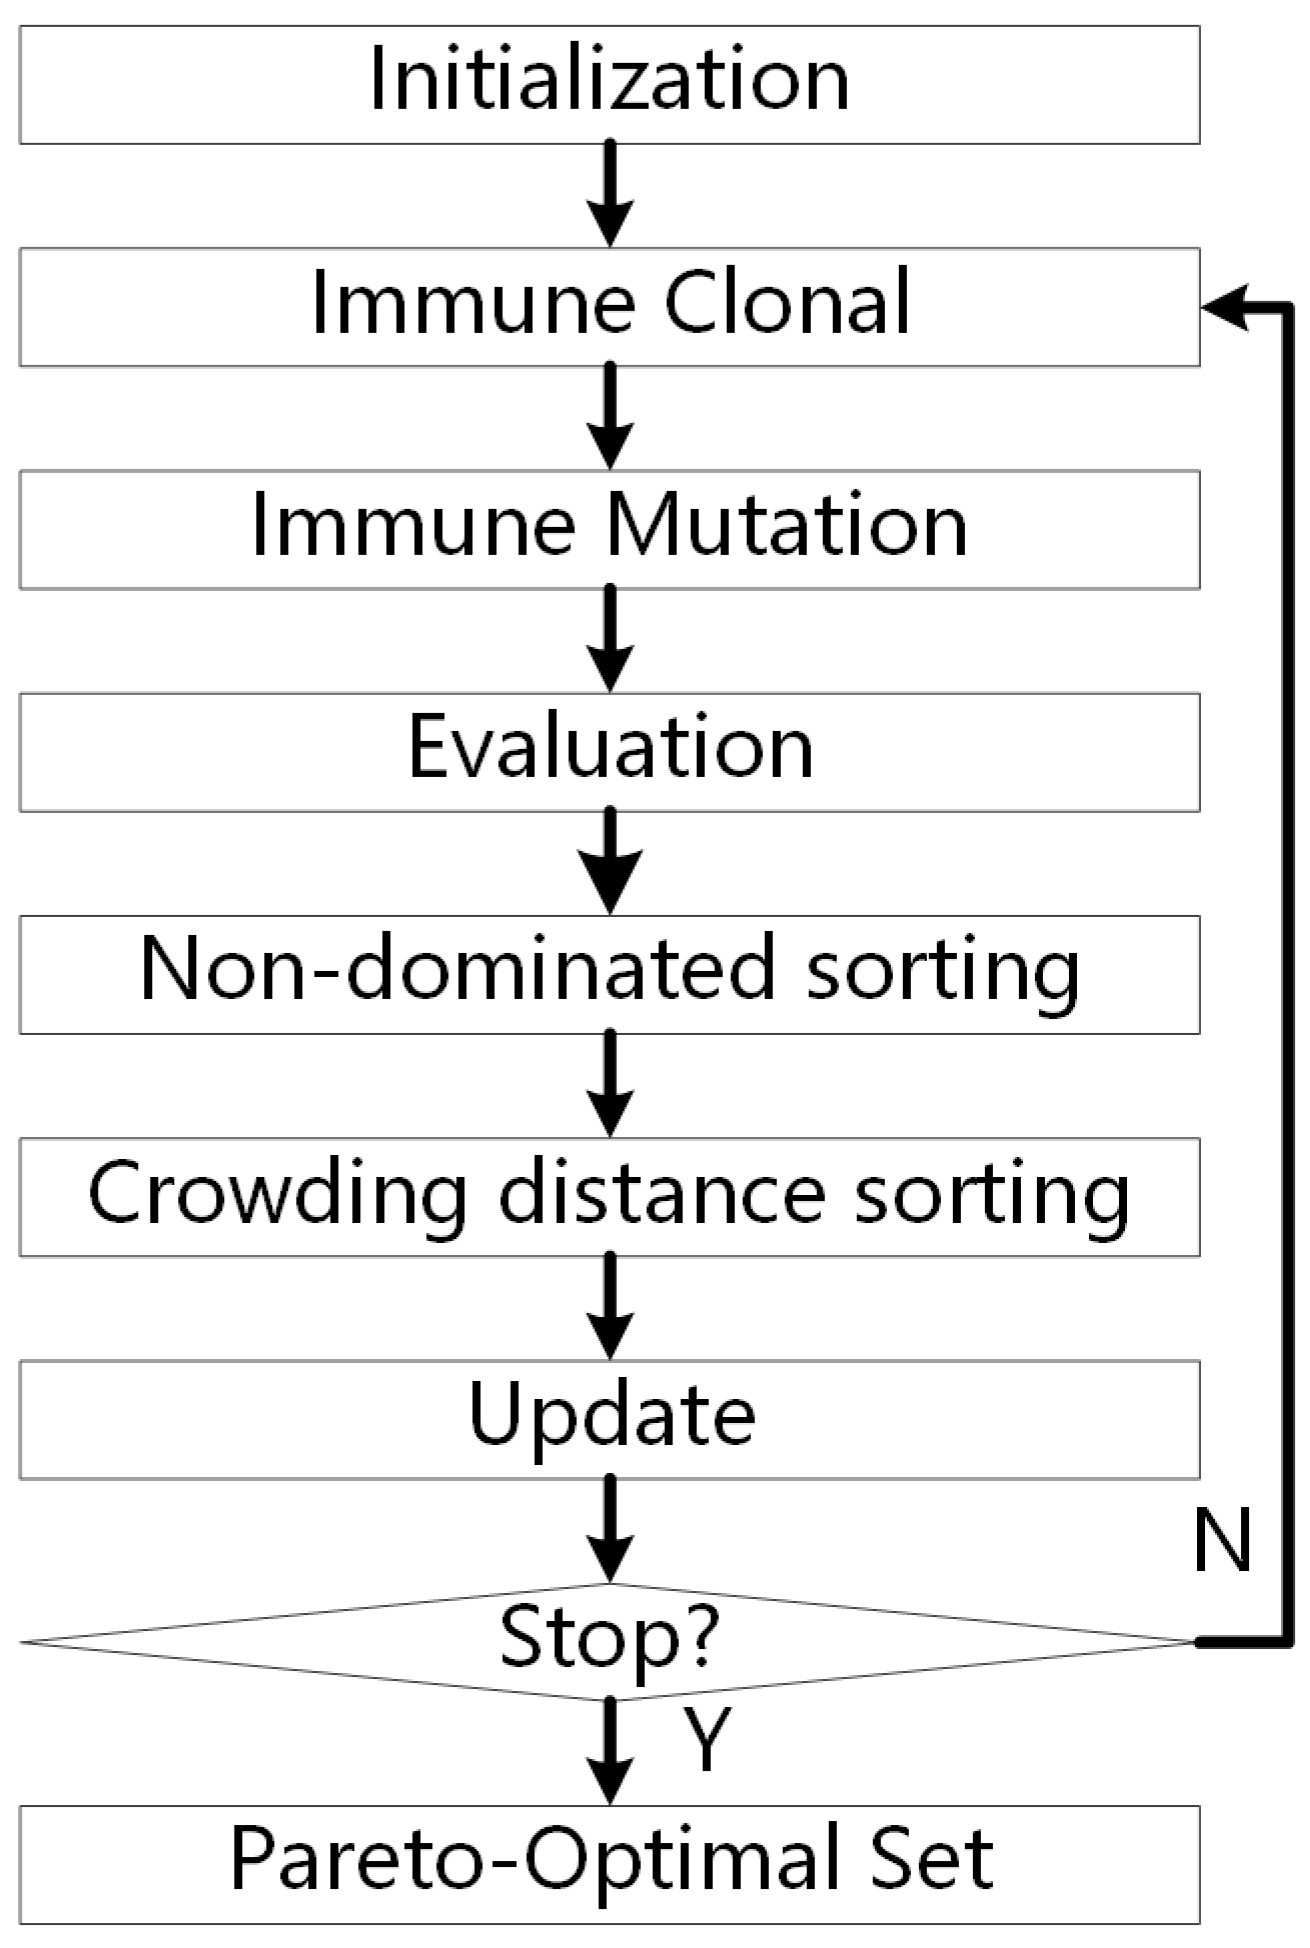
The contribution of this article is threefold. Firstly, we present an analysis framework of the dynamic balance between the land use supply and demand for LUA optimization problems. Secondly, the ecosystem service value theory and land rent and price theory are introduced to the definition and modeling of LUA optimization problems. Finally, the original artificial immune algorithm is customized by redefining the initialization and mutation operators to be suitable for solving LUA optimization problems.
The functionality of LUA optimization is to balance the land use supply and demand based on the future dynamic demands from different land use stakeholders in the region at the macro-level. However, the quantity allocation schemes for land resources do not have the information necessary for land managers to know how to adjust the use of each parcel to realize the expected quantity allocation scheme for land resources in future land use based on the current regional land use situation at the micro-level. Therefore, in future studies, we will comprehensively use multi-agent systems and multi-objective optimization algorithms to investigate spatial LUA models under the constraints of quantity allocation optimization schemes for land use to formulate spatial land planning schemes that can guide land management and improve the sustainability and feasibility of optimization schemes.

Acknowledgments

This research was supported by the National Nature Science Foundation of China (Grant No. 41401446), Open Research Fund Program of Key Laboratory of Digital Mapping and Land Information Application Engineering, National Administration of Surveying, Mapping and Geo-Information (Grant No. GCWD201405), and Fundamental Research Funds for the Central Universities (Grant No. 2042014kf0078).

Author Contributions

This paper has been the result of collaborative efforts from both authors. Each of them has participated equally in designing the paper, performing the research, and writing the paper. Both authors have read and approved the final manuscript.

Conflicts of Interest

The authors declare no conflict of interest.

References

  1. Liu, J.Y.; Liu, M.L.; Zhuang, D.F.; Zhang, Z.X.; Deng, X.Z. Study on spatial pattern of land-use change in China during 1995–2000. Sci. China Ser. D 2003, 46, 373–384. [Google Scholar] [CrossRef]
  2. Wang, H.R.; Gao, Y.Y.; Liu, Q.; Song, J.X. Land use allocation based on interval multi-objective linear programming model: A case study of Pi county in Sichuan province. Chin. Geogr. Sci. 2010, 20, 176–183. [Google Scholar] [CrossRef]
  3. Cheung, H.K.; Auger, J.A. Linear-programming and land-use allocation—Suboptimal solutions and policy. Socio-Econ. Plan. Sci. 1976, 10, 43–45. [Google Scholar] [CrossRef]
  4. Campbell, J.C.; Radke, J.; Gless, J.T.; Wirtshafter, R.M. An application of linear-programming and geographic information-systems—Cropland allocation in Antigua. Environ. Plan. A 1992, 24, 535–549. [Google Scholar] [CrossRef]
  5. Arthur, J.L.; Nalle, D.J. Clarification on the use of linear programming and GIS for land-use modelling. Int. J. Geogr. Inf. Sci. 1997, 11, 397–402. [Google Scholar] [CrossRef]
  6. Sahoo, B.; Lohani, A.K.; Sahu, R.K. Fuzzy multiobjective and linear programming based management models for optimal land-water-crop system planning. Water Resour. Manag. 2006, 20, 931–948. [Google Scholar] [CrossRef]
  7. Sadeghi, S.H.R.; Jalili, K.; Nikkami, D. Land use optimization in watershed scale. Land Use Policy 2009, 26, 186–193. [Google Scholar] [CrossRef]
  8. De Oliveira, F.; Volpi, N.M.P.; Sanquetta, C.R. Goal programming in a planning problem. Appl. Math. Comput. 2003, 140, 165–178. [Google Scholar] [CrossRef]
  9. Vivekanandan, N.; Viswanathan, K. Optimization of multi-objective cropping pattern using linear and goal programming approaches. Mausam 2007, 58, 323–334. [Google Scholar]
  10. Latinopoulos, D.; Mylopoulos, Y. Optimal allocation of land and water resources in irrigated agriculture by means of goal programming: Application in Loudias river basin. In Proceedings of the 9th International Conference on Environmental Science and Technology, Rhodes, Greece, 1–3 September 2005.
  11. Gilbert, K.C.; Holmes, D.D.; Rosenthal, R.E. A multiobjective discrete optimization model for land allocation. Manage. Sci. 1985, 31, 1509–1522. [Google Scholar] [CrossRef]
  12. Zhou, M.; Cai, Y.L.; Guan, X.L.; Tan, S.K.; Lu, S.S. A hybrid inexact optimization model for land-use allocation of China. Chin. Geogr. Sci. 2015, 25, 62–73. [Google Scholar] [CrossRef]
  13. Zhou, M. An interval fuzzy chance-constrained programming model for sustainable urban land-use planning and land use policy analysis. Land Use Policy 2015, 42, 479–491. [Google Scholar] [CrossRef]
  14. Qiu, B.K.; Lu, S.S.; Zhou, M.; Zhang, L.; Deng, Y.; Song, C.; Zhang, Z. A hybrid inexact optimization method for land-use allocation in association with environmental/ecological requirements at a watershed level. Sustainability 2015, 7, 4643–4667. [Google Scholar] [CrossRef]
  15. Han, J.C.; Huang, G.H.; Zhang, H.; Li, Z. Optimal land use management for soil erosion control by using an interval-parameter fuzzy two-stage stochastic programming approach. Environ. Manag. 2013, 52, 621–638. [Google Scholar] [CrossRef] [PubMed]
  16. Riveira, I.; Maseda, R.C. A review of rural land-use planning models. Environ. Plan. B 2006, 33, 165–183. [Google Scholar] [CrossRef]
  17. Gong, J.; Liu, Y.L.; Zhang, Z.; Liu, Y.F.; Chen, N.S. Research of general land use planning based on sd-mop integrated model in Huangpi district of Wuhan city—Art. No. 63661c. In Remote Sensing for Environmental Monitoring, GIS Applications and Geology VI; Ehlers, M., Michel, U., Eds.; Spie-Int Soc Optical Engineering: Bellingham, WA, USA, 2006; Volume 6366, p. C3661. [Google Scholar]
  18. Liu, X.P.; Ou, J.P.; Li, X.; Ai, B. Combining system dynamics and hybrid particle swarm optimization for land use allocation. Ecol. Model. 2013, 257, 11–24. [Google Scholar] [CrossRef]
  19. Memmah, M.M.; Lescourret, F.; Yao, X.; Lavigne, C. Metaheuristics for agricultural land use optimization. A review. Agron. Sustain. Dev. 2015, 35, 975–998. [Google Scholar] [CrossRef]
  20. Gong, J.Z.; Liu, Y.S.; Chen, W.L. Optimal land use allocation of urban fringe in Guangzhou. J. Geogr. Sci. 2012, 22, 179–191. [Google Scholar] [CrossRef]
  21. Matthews, K.B.; Buchan, K.; Sibbald, A.R.; Craw, S. Combining deliberative and computer-based methods for multi-objective land-use planning. Agric. Syst. 2006, 87, 18–37. [Google Scholar] [CrossRef]
  22. Jin, N.; Termansen, M.; Hubacek, K. Genetic Algorithms for Dynamic Land-Use Optimization; IEEE: New York, NY, USA, 2008; pp. 3816–3821. [Google Scholar]
  23. Fotakis, D.G.; Sidiropoulos, E.; Myronidis, D.; Ioannou, K. Spatial genetic algorithm for multi-objective forest planning. Forest Policy Econ. 2012, 21, 12–19. [Google Scholar] [CrossRef]
  24. Qi, H.H.; Altinakar, M.S.; Vieira, D.A.N.; Alidaee, B. Application of tabu search algorithm with a coupled annagnps-cche1d model to optimize agricultural land use. J. Am. Water Resour. Assoc. 2008, 44, 866–878. [Google Scholar] [CrossRef]
  25. Adeyemo, J.; Otieno, F. Optimizing planting areas using differential evolution (DE) and linear programming (LP). Int. J. Phys. Sci. 2009, 4, 212–220. [Google Scholar]
  26. Zhu, Y.J.; Feng, Z.H. Differential evolution for optimization of land use. In Advances in Swarm Intelligence; Tan, Y., Shi, Y.H., Tan, K.C., Eds.; Springer-Verlag Berlin: Berlin, Germany, 2010; Volume 6145, pp. 499–504. [Google Scholar]
  27. Datta, D.; Deb, K.; Fonseca, C.M.; Lobo, F.; Condado, P. Multi-objective evolutionary algorithm for land-use management problem. Int. J. Comput. Intell. Res. 2007, 3, 1–24. [Google Scholar]
  28. Strange, N.; Meilby, H.; Bogetoft, P. Land use optimization using self-organizing algorithms. Nat. Resour. Model. 2001, 14, 541–574. [Google Scholar] [CrossRef]
  29. Fotakis, D.; Sidiropoulos, E. A new multi-objective self-organizing optimization algorithm (MOSOA) for spatial optimization problems. Appl. Math. Comput. 2012, 218, 5168–5180. [Google Scholar] [CrossRef]
  30. Jones, D.F.; Mirrazavi, S.K.; Tamiz, M. Multi-objective meta-heuristics: An overview of the current state-of-the-art. Eur. J. Oper. Res. 2002, 137, 1–9. [Google Scholar] [CrossRef]
  31. Khare, V.; Yao, X.; Deb, K. Performance scaling of multi-objective evolutionary algorithms. 2003. Available online: http://0-link-springer-com.brum.beds.ac.uk/chapter/10.1007/3-540-36970-8_27 (accessed on 18 November 2015).
  32. Shang, R.; Jiao, L.; Liu, F.; Ma, W. A novel immune clonal algorithm for mo problems. IEEE Trans. Evolut. Comput. 2012, 16, 35–50. [Google Scholar] [CrossRef]
  33. Dasgupta, D. Artificial immune system as a multi-agent decision support system. In Proceedings of the 1998 IEEE International Conference on Systems, Man, and Cybernetics, San Diego, CA, USA, 11–14 October 1998.
  34. De Castro, L.N.; Timmis, J.I. Artificial immune systems as a novel soft computing paradigm. Soft Comput. 2003, 7, 526–544. [Google Scholar] [CrossRef]
  35. Jon, T.; Thomas, K. Artificial immune systems: Using the immune system as inspiration for data mining. In Data Mining: A Heuristic Approach; Abbass, H.A., Aarker, R.A., Newton, C.S., Eds.; Group Idea Publishing: Harrisburg, PA, USA, 2001; pp. 209–230. [Google Scholar]
  36. Hunt, J.E.; Cooke, D.E. Learning using an artificial immune system. J. Netw. Comput. Appl. 1996, 19, 189–212. [Google Scholar] [CrossRef]
  37. De Castro, L.N.; Timmis, J. An artificial immune network for multimodal function optimization. In Proceedings of the 2002 Congress on Evolutionary Computation, 2002, CEC’02, Honolulu, HI, USA, 12–17 May 2002.
  38. Timmis, J.; Edmonds, C. A comment on opt-ainet: An immune network algorithm for optimisation. In Proceedings of the Genetic and Evolutionary Computation Conference, Seattle, WA, USA, 26–30 June 2004; Deb, K., Poli, R., Banzhaf, W., Beyer, H.G., Burke, E., Darwen, P., Dasgupta, D., Floreano, D., Foster, O., Harman, M., et al., Eds.; Volume 3102, pp. 308–317.
  39. De Castro, L.N.; Von Zuben, F.J. Learning and optimization using the clonal selection principle. IEEE Trans. Evolut. Comput. 2002, 6, 239–251. [Google Scholar] [CrossRef]
  40. Carter, J.H. The immune system as a model for pattern recognition and classification. J. Am. Med. Inf. Assoc. 2000, 7, 28–41. [Google Scholar] [CrossRef]
  41. Gong, B.; Im, J.; Mountrakis, G. An artificial immune network approach to multi-sensor land use/land cover classification. Remote Sens. Environ. 2011, 115, 600–614. [Google Scholar] [CrossRef]
  42. Wu, N.N.; Yan, X.P.; Huang, G.H.; Wu, C.Z.; Gong, J. Urban environment-oriented traffic zoning based on spatial cluster analysis. J. Environ. Inf. 2010, 15, 111–119. [Google Scholar] [CrossRef]
  43. Liu, X.; Li, X.; Tan, Z.; Chen, Y. Zoning farmland protection under spatial constraints by integrating remote sensing, GIS and artificial immune systems. Int. J. Geogr. Inf. Sci. 2011, 25, 1829–1848. [Google Scholar] [CrossRef]
  44. Liu, X.; Li, X.; Shi, X.; Zhang, X.; Chen, Y. Simulating land-use dynamics under planning policies by integrating artificial immune systems with cellular automata. Int. J. Geogr. Inf. Sci. 2010, 24, 783–802. [Google Scholar] [CrossRef]
  45. Tan, K.C.; Goh, C.K.; Mamun, A.A.; Ei, E.Z. An evolutionary artificial immune system for multi-objective optimization. Eur. J. Oper. Res. 2008, 187, 371–392. [Google Scholar] [CrossRef]
  46. Costanza, R.; d’Arge, R.; de Groot, R.; Farber, S.; Grasso, M.; Hannon, B.; Limburg, K.; Naeem, S.; Oneill, R.V.; Paruelo, J.; et al. The value of the world’s ecosystem services and natural capital. Nature 1997, 387, 253–260. [Google Scholar] [CrossRef]
  47. Zang, S.Y.; Wu, C.S.; Liu, H.; Na, X.D. Impact of urbanization on natural ecosystem service values: A comparative study. Environ. Monit. Assess. 2011, 179, 575–588. [Google Scholar] [CrossRef] [PubMed]
  48. Gomez-Baggethun, E.; Barton, D.N. Classifying and valuing ecosystem services for urban planning. Ecol. Econ. 2013, 86, 235–245. [Google Scholar] [CrossRef]
  49. Feng, X.Y.; Luo, G.P.; Li, C.F.; Dai, L.; Lu, L. Dynamics of ecosystem service value caused by land use changes in manas river of Xinjiang, China. Int. J. Environ. Res. 2012, 6, 499–508. [Google Scholar]
  50. Gascoigne, W.R.; Hoag, D.; Koontz, L.; Tangen, B.A.; Shaffer, T.L.; Gleason, R.A. Valuing ecosystem and economic services across land-use scenarios in the Prairie Pothole region of the Dakotas, USA. Ecol. Econ. 2011, 70, 1715–1725. [Google Scholar] [CrossRef]
  51. Gong, M.; Jiao, L.; Du, H.; Bo, L. Multiobjective immune algorithm with nondominated neighbor-based selection. Evolut. Comput. 2008, 16, 225–255. [Google Scholar] [CrossRef] [PubMed]
  52. Gao, J.; Wang, J. Wbmoais: A novel artificial immune system for multiobjective optimization. Comput. Oper. Res. 2010, 37, 50–61. [Google Scholar] [CrossRef]
  53. Deb, K.; Pratap, A.; Agarwal, S.; Meyarivan, T. A fast and elitist multiobjective genetic algorithm: Nsga-ii. IEEE Trans. Evolut. Comput. 2002, 6, 182–197. [Google Scholar] [CrossRef]
  54. Xie, G.; Lu, C.; Leng, Y.; Zheng, D.; Li, S. Ecological assets valuation of the Tibetan plateau. J. Nat. Resour. 2003, 18, 189–196. [Google Scholar]
  55. Zhao, X.; Liu, Y.L.; Liu, D.F.; Ma, X.Y. Aitso: A Tool for Spatial Optimization Based on Artificial Immune Systems. Available online: http://www.hindawi.com/journals/cin/2015/549832/ (accessed on 20 November 2015).
  56. Tan, K.C.; Yang, Y.J.; Goh, C.K. A distributed cooperative coevolutionary algorithm for multiobjective optimization. IEEE Trans. Evolut. Comput. 2006, 10, 527–549. [Google Scholar] [CrossRef]

