Article

Risky Business: Sustainability and Industrial Land Use across Seattle’s Gentrifying Riskscape

1
Huxley College of the Environment on the Peninsulas, Western Washington University, P.O. Box 1699, Poulsbo, WA 98370, USA
2
Department of Geography, Michigan State University, Geography Building, 673 Auditorium Rd., Room 116, East Lansing, MI 48824, USA
3
Department of Environmental Studies, Western Washington University, MS 9085, Bellingham, WA 98225, USA
*
Author to whom correspondence should be addressed.
Sustainability 2015, 7(11), 15718-15753; https://0-doi-org.brum.beds.ac.uk/10.3390/su71115718
Submission received: 21 July 2015 / Revised: 7 November 2015 / Accepted: 16 November 2015 / Published: 24 November 2015
(This article belongs to the Special Issue Urban Land and Sustainable Development)

Abstract

:
This paper examines the spatial and temporal trajectories of Seattle’s industrial land use restructuring and the shifting riskscape in Seattle, WA, a commonly recognized urban model of sustainability. Drawing on the perspective of sustainability as a conflicted process, this research explored the intersections of urban industrial and nonindustrial land use planning, gentrification, and environmental injustice. In the first part of our research, we combine geographic cluster analysis and longitudinal air toxic emission comparisons to quantitatively investigate socioeconomic changes in Seattle Census block-groups between 1990, 2000, and 2009 coupled with measures of pollution volume and its relative potential risk. Second, we qualitatively examine Seattle’s historical land use policies and planning and the growing tension between industrial and nonindustrial land use. The gentrification, green cities, and growth management conflicts embedded within sustainability/livability lead to pollution exposure risk and socioeconomic vulnerability converging in the same areas and reveal one of Seattle’s significant environmental challenges. Our mixed-method approach can guide future urban sustainability studies to more effectively examine the connections between land use planning, industrial displacement, and environmental injustice. Our results also help sustainable development practitioners recognize that a more just sustainability in Seattle and beyond will require more planning and policy attention to mitigate obscured industrial land use conflicts.

1. Seattle’s Contradictory Geographies

Two decades ago, Seattle Washington developed a comprehensive plan with the ambitious title “Toward A Sustainable Seattle: A Plan for Managing Growth 1994–2014” [1]. It was the first comprehensive plan in the US that expressly aimed for sustainability [2]. In its most recognized depiction, sustainable development involves the simultaneous achievement of economic growth, environmental protection, and equitable development. First popularized in 1987 at the international level, sustainability was defined as: “development that meets the needs of the present without compromising the ability of future generations to meet their own needs” [3]. Inspired by this special issue’s tenet that sustainable economic development and smart growth involves equitable urban land development and the effective mitigation of its conflicts, we use a sociohistorical analysis of Seattle, WA to examine the restructuring of urban land use patterns, gentrification trends, and the city’s shifting environmental riskscape. Recognized as one of the world’s leaders in planning for urban sustainability with an “Emerald City” nickname, Seattle provides an excellent case study to examine the dilemmas of planning for and mitigating sustainability’s land use conflicts in urban industrial geographies.
We draw on a growing literature that focuses on the limitations of sustainability’s popular conceptions. Dobson [4,5] argued that social justice and environmental sustainability were irreconcilable. Likewise, Agyeman [6] described the dissonance between the discourses of “Just Sustainability” and an “Environmentalist-Stewardship Sustainability”. Others focus on the contradictions embedded within the sustainability concept itself [7,8,9]. For instance, Campbell [10] portrayed sustainability as a “planner’s triangle” where economic growth, environmental protection, and social equity are corner points divide by three dynamic conflicts. A resource conflict pits economic growth and efficiency against environmental protection on one side. On the second side, a development conflict separates social justice and environmental protection. Third, a property conflict divides economic growth and social justice. Godschalk [11] would extend the planner’s triangle with a fourth point to form what he called the Sustainability/Livability Prism that illuminates three additional land use planning challenges: (1) a growth management conflict; (2) a green cities conflict; and (3) a gentrification conflict.
First, a growth management conflict involves the tension between livability and economic growth and those pushing for managing development versus those committed to unfettered market processes. The green cities conflict is a second tension between the development of natural and built environments. The stewardship of natural resources like water quality can overshadow the quality of the built environment and its influence on public health for example. Third, a gentrification conflict entails the dissonance between those committed to urban revitalization against advocates of protecting poorer neighbourhoods from displacement. By many accounts, Seattle seems to have avoided all of these conflicts and this Emerald City has been touted for its sustainability planning and outcomes because it launched the first indicators program [12,13], ranked first in a national index [14] of sustainable policy development, earned third place in another ranking of cities [15], and was described by Krueger and Ageyman [16] as a model of “actually existing” sustainability. However, a growing number of studies question Seattle’s environmental reputation. After examining comprehensive plans from 30 cities, Berke and Conroy [17] ranked Seattle in the middle of the pack. Sanders [18] observed “The downside of (Seattle’s) greener urbanism may have been its tendency to reinforce a trend toward a more fractured landscape in a city that would become increasingly out of reach to working and middle-class families”. More recent studies found that the city’s “...pollution riskscape and urban development burdens were skewed toward the city’s most socially vulnerable residents” [19] and Seattle was producing a “gentrified sustainability” [20].
Likewise, Dierwechter [21] observed that the city’s planning should be called “smart segregation” instead of smart growth while Dooling [22] used Seattle’s history of public green space development to introduce a research agenda on ecological gentrification that illuminates losers in the green cities conflict. In fact, uneven ecological degradation and urban inequity have always been a centerpiece of Seattle’s environmental history according to Klingle [23]. He described how the city’s ecologically motivated cleanup of Lake Washington lead to more pollution for Seattle’s other major watershed, the Duwamish River. Klingle’s account of this South Seattle tributary and its nearby communities illuminated how the city has been unable to avoid a major feature of American urban geography—environmental injustice. Such contradictory accounts led us to examine the evolving structures of Seattle’s land use, development, and the city’s environmental riskscape and address some of the questions posed in this special issue. What are the underlying processes driving Seattle’s industrial land use restructuring? How can both quantitative GIS and qualitative methods be combined in a case study design to study the interactions of land use planning and sustainability? How can mixed-methods be combined to better inform urban sustainability policies that are more equitable?

Environmental Inequities and Gentrification

Environmental inequities for racial and economic groups has been the focus of four decades of environmental justice scholarship. In this field’s watershed study, sociologist Robert Bullard [24] introduced the distributional scrutiny of race and pollution to social science in a case study of Houston, TX. He described how the city’s landfills were located in predominately African-American neighbourhoods and concluded that institutionalized housing market discrimination, a lack of zoning, and government permitting decisions led to the city’s “...black neighbourhoods becoming the ‘dumping ground’ for the area’s solid waste”. Bullard’s analysis quickly received attention by national politicians and policy practitioners leading to a study [25] of landfill siting in eight Southern states by the US General Accounting Office (GAO, now the Government Accountability Office). The results indicated that on average, three out of four landfills were located in majority-minority communities. In 1987, a study [26] of landfill sites across the US would find that zip codes with these hazardous sites had, on average, double the percent minority of zip codes without landfills. In a seminal meta-analysis of 49 environmental justice studies between 1995 and 2005, Ringquist [27] concluded that race-based environmental inequality was ubiquitous. Numerous subsequent case studies of urban environmental injustices have found that spatial distribution of pollution hazards and socially vulnerable populations (minority and low income) cluster together in Detroit [28], Los Angeles [29,30,31], New York City [32], Portland [33], St. Louis [34], and Tampa Bay [35].
However, few of these studies examined how these inequalities developed over time. In 2000, Pellow [36] introduced a theory of Environmental Inequality Formation which “occurs when different stakeholders struggle for access to scarce resources within the political economy, and the benefits and costs of those resources become distributed unevenly”. A series of seminal environmental justice studies in the nineties found that the siting of industrial hazards in neighbourhoods did not target minority and poor communities, but nonminority and more affluent residents moved away from environmental pollution while minorities stayed or moved in [37,38,39,40]. In a recent national study combining individual-level mobility data with neighborhood-level industrial hazard risks, Crowder and Downey [41] found that “black and Latino householders move into neighbourhoods with significantly higher hazard levels than do comparable whites”. Conversely, in another national study [42] of residential mobility between 1991 and 2007, the odds of starting with low pollution exposure but ending with high levels of exposure was 38 percent higher for immobile black households than for immobile whites. Likewise, a longitudinal analysis of Los Angeles’ riskscape of hazardous waste Transport, Storage, and Disposal Facilities (TSDFs) found that when “controlling for other factors, minorities attract TSDFs but TSDFs do not generally attract minorities” [43]. Reversing the causal path, Hamilton [44] found that between 1987 and 1992, zip code neighbourhoods where commercial hazardous waste facilities expanded operations had an average nonwhite population of 25 percent versus 18 percent in zip codes hosting facilities with no expansion. In sum, this literature established that both residential and industrial mobility can contribute to environmental inequality formation. Thus we expect both to be factors in Seattle’s land use restructuring, its inequitable stratification of socioeconomic development, and uneven distribution of environmental burdens. However, we go further in this case study and consider how local planning policy may contribute to environmental injustice [45,46].
Our Seattle case study contributes to the more recent scholarly attention to environmental gentrification [47,48,49,50,51,52,53,54,55]. Banzhaf and Walsh were some of the first that pondered how “in a world where households sort in response to changes in environmental quality, the bulk of the benefits of a policy that successfully cleans up dirtier neighbourhoods where the poor live may actually be captured by rich households... This ‘environmental gentrification’ may actually more than offset the direct gain of the environmental improvement, so that the original residents are actually worse off” [56]. In short, environmental cleanups attract gentrification while it’s repelled by industrial activity and pollution. Ley and Dobson [57] observed three decades of redevelopment in Vancouver British Columbia and found “that inner-city districts distant from environmental amenities and proximate to industrial land use will be much less attractive to the incursions of gentrification”. Conversely, deindustrializing neighbourhoods and their cleaner environments were more attractive for gentrification. While it has many definitions [58,59,60,61,62], gentrification generally refers to the upward socioeconomic transformation of urban neighbourhoods by income, house values, education, and occupational levels.
Since Bell’s 1973 book on the postindustrial society [63], many urban geographers have examined the land use conflict between industrial and non-industrial uses through a lens of gentrification beginning with Ley [64,65]. More recently, Curran [66,67,68,69] has published a series of qualitative studies on the displacement of small manufacturers via gentrification in the New York neighbourhoods of Greenpoint and Williamsburg. Other qualitative case studies on gentrification have covered the major Northwest cities of Portland [55], Vancouver, BC [48], and Victoria, BC [49]. However, few have utilized multivariate quantitative methods [70,71] and, according to Lees, Slater, and Wyly [72], gentrification researchers rarely integrate quantitative and qualitative methods. We join these collection of studies [73,74,75] with a mixed-methods case study of Seattle Washington.
Gentrification is a growing challenge for Seattle. The city’s rising housing costs and the equity and social impacts of explosive land use growth are an increasing concern for many Seattleites. In 2006, the median home value in Seattle was 7.7 times more than the median household income [76]. According to one observer, “the ever-increasing concentration of wealth could mean Seattle will become more and more the gilded city of the upper-middle and upper classes” [77]. Journalists in the Seattle Times also reported in 2006 that “the only area in Seattle where median-income folks could afford the median-priced house was the residential/industrial/commercial swath south of downtown that includes Georgetown and South Park” [78]. More recently, news headlines question “Growth Gone Wild?” [79], “Priced Out? Growing numbers appear to be fleeing King County” [80] and explore how “In Georgetown, the Housing Is Affordable and the Air Unbreathable” [81]. Similar patterns are being identified in dozens of US cities by one research group where the “creative class” [82] divides urban geographies by outcompeting service and working class residents for proximity to urban amenities like transit lines, universities, and natural areas [83].

2. Case Study Methods

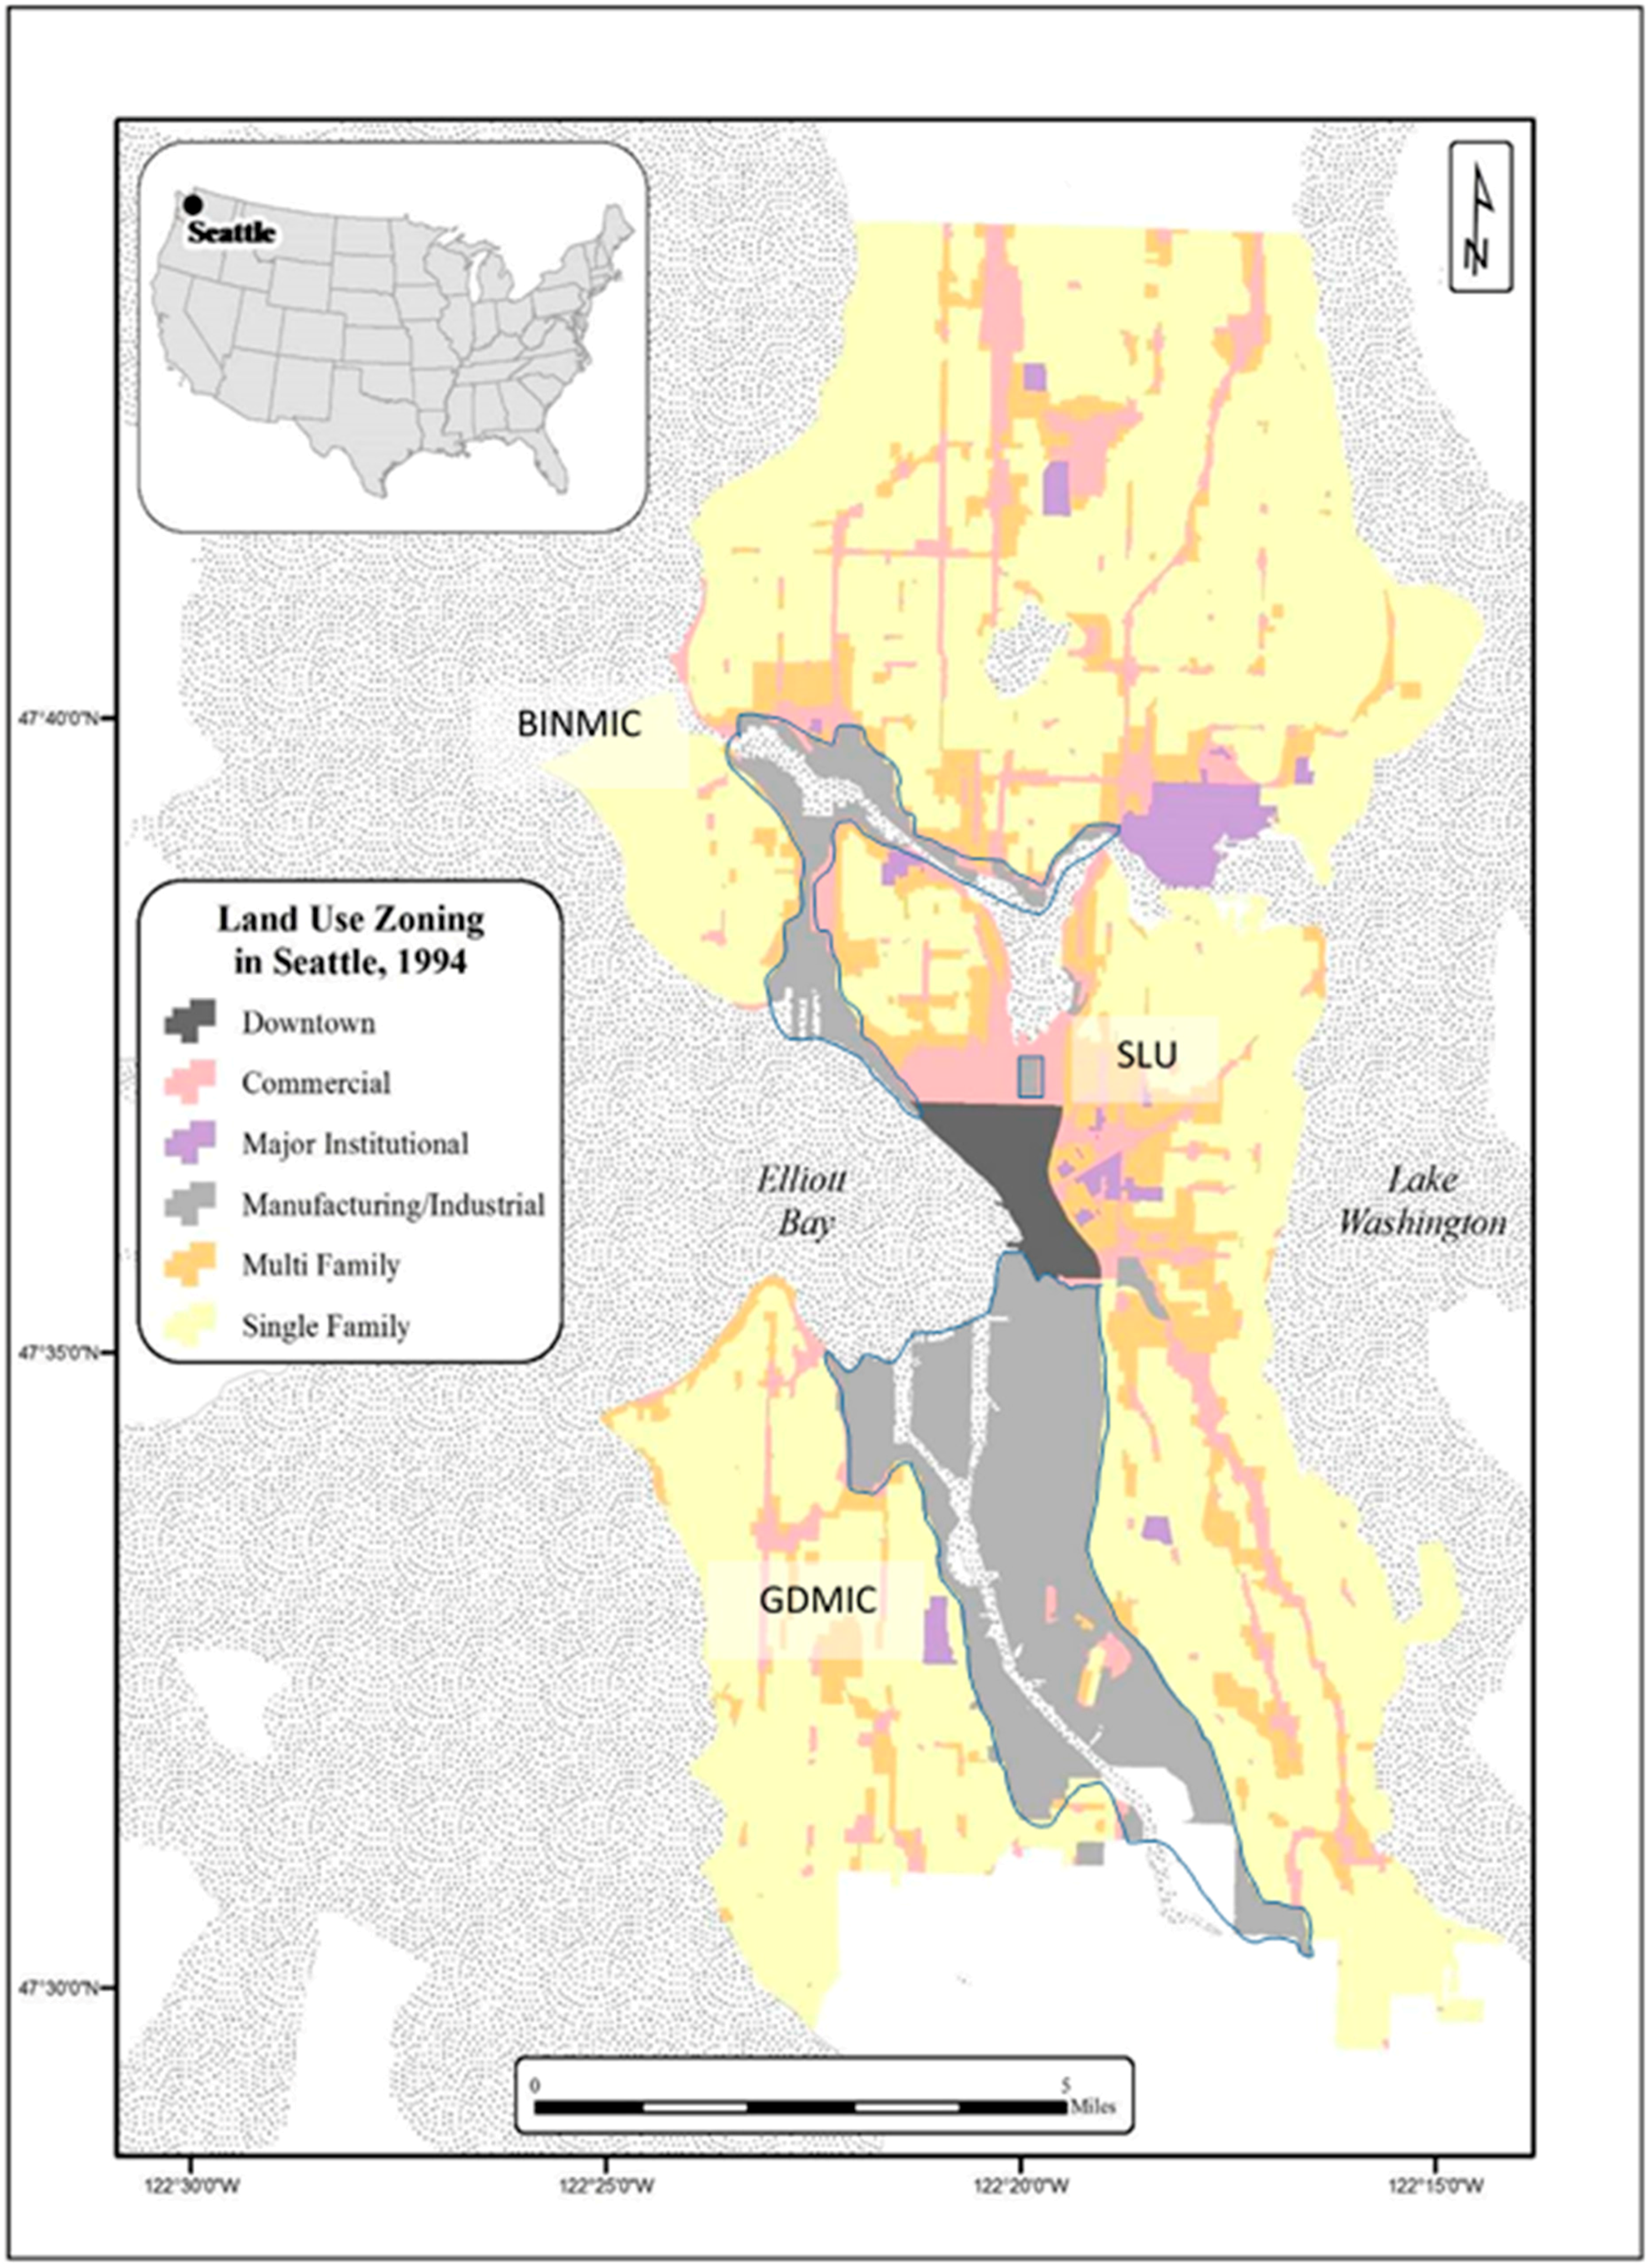
2.1. Study Area and Data Sources

Sometimes called the Emerald City, this study uses Seattle as a single case approach [84] to examine the competing hypotheses of environmental gentrification (cleanup and deindustrialization attracts gentrification while industrial areas repel gentrification) and industrial gentrification (gentrification displaces industrial activity). This Emerald City provides an intriguing opportunity to examine the industrial transformation of a major West Coast city, which has over the last 30 years reinvented itself as a major hub for the United State’s “tech” sector [85]. Seattle now follows San Jose in terms of the percentage of its workforce engaged in advanced industries.
The 1990s were a key time period in this transition as Microsoft became the center of an information technology cluster, followed by Amazon and startups Expedia and RealNetworks [86]. Between 1990 and 2009, of the 95,992 additional jobs created in Seattle, 28,614 new jobs (30 percent of the job growth) were in the professional, scientific and technical services sector. The job growth in this sector was second only to Arts, entertainment, recreation, accommodation and food service, which comprised 33 percent of the job growth. Consistent with the overall trend in the United States of manufacturing job loss, manufacturing employment as a percentage of total employment in Seattle between 1990 and 2009 has fallen from 15 to 8 percent (over a 50 percent decline). Seattle’s manufacturing sector share of employment is now less than the national average [87].
The demand for knowledge workers by the region’s tech firms has stimulated population growth. Like many other cities, Seattle has experienced rapid urban growth over the last 20 years, with the population growing by 15 percent between 1990 and 2010. In 2012, Seattle had the fastest rate of growth of the 50 most populous major cities [88]. Much of this population growth is the result of in-migration, both from domestic and foreign populations, which is consistent with Seattle’s role as a regional employment and growth center.
Such growth pressures led Washington State to adopt growth management policies, a method of comprehensive land use planning significantly impacting Seattle’s land use development. The city’s comprehensive plan aimed to direct growth into four zones: (1) urban centers; (2) urban villages; (3) residential urban villages; and (4) manufacturing industrial centers [89]. A recent review of Seattle's planning strategy found that between 1994 and 2014, 75 percent of Seattle’s total population growth (residential and employment) had been directed into these designated urban villages [90]. Notably, the area targeted for the largest employment gains (19 percent of the City’s employment growth and 8 percent of its residential growth) was the South Lake Union (SLU) neighborhood [91], our first area of focus in this case study of Seattle’s industrial land use planning.
Targeted for redevelopment from an industrial area to a hub urban village in the 1994 comprehensive plan (see Figure 1 below), change in SLU has occurred at a rapid pace, with over 90 percent of the City’s projected employment gains between 2004 and 2024 having already been met by 2013 [92]. The redevelopment predominately consists of commercial office and residential towers, with supporting retail development. Major new tenants in the area are representative of Seattle's economic transition and include Amazon, the Gates Foundation, a number of medical research facilities, and somewhat ironically, the city’s Museum of History and Industry.
After the transformation of the South Lake Union area, manufacturing in the City is being consolidated into the other two areas in our case study: the Ballard and Interbay Manufacturing/Industrial Center (BINMIC) and the Greater Duwamish Manufacturing/Industrial Center (GDMIC). While celebrated elsewhere, this conversion of Seattle’s urban industrial zones to non-industrial development has generated local concerns. The city’s planning department projected that “As non-industrial projects proliferate in industrial zones, it increases speculation that zoning may be changed to accommodate even larger non-industrial projects or even allow residential uses” [93]. In fact, city policy statements in 2005 aimed to “limit in manufacturing/industrial areas those commercial or residential uses that are unrelated to the industrial function, that occur at intensities posing short- and long-term conflicts for industrial uses, or that threaten to convert significant amounts of land to non-industrial uses” [94]. These concerns are now the focus of redevelopment pressures emerging in the BINMIC area.
Local news outlets reported the plans of online travel agency Expedia’s impending move to the Interbay waterfront. One local TV website announced “Expedia’s move likely to prompt changes to Seattle Interbay” [95] while an online blog noted that “the Interbay neighborhood has piqued the interest of developers and investors alike” [96]. City documents also noted that in BINMIC, “recent retail, residential, and office developments are pushing up property values, which could potentially squeeze out industrial uses and jobs. Some property owners would like more flexibility to develop their property. Enhanced transit service is yet another reason to rethink the future of this area” [97]. The restructuring of industrial land use patterns and their conflicts in SLU, BINMIC and GDMIC are therefore the focus of our case study (see Figure 1 below).
Figure 1. Seattle’s zoning in 1994 and our industrial study areas outlined in red: (1) Ballard and Interbay Manufacturing/Industrial Center (BINMIC); (2) South Lake Union (SLU); and (3) the Greater Duwamish Manufacturing/Industrial Center (GDMIC).
Sustainability 07 15718 g001
BINMIC is located in the northwest part of the City of Seattle in Figure 1 and hosts wharfs, shipyards, and rail yards. The northern portion of BINMIC is home to Fisherman’s Terminal, one of the largest commercial fishing terminals in the Northwest and one of Seattle’s major railroad yards. At Interbay’s south end are Terminal 91 (a large general cargo terminal complex) and Pier 86 (a Port of Seattle export grain terminal). This portion of BINMIC contains approximately 3 percent of the City’s employment and the major industry sectors are Services (43%), Manufacturing (22%), and Wholesale, Transportation and Utilities (14%) [98].
GDMIC is located south of downtown Seattle in the Duwamish Valley and is one of the Pacific Northwest’s largest and most intensely developed manufacturing/industrial areas. It is a major intermodal transportation hub, receiving and distributing goods via roadway, water, rail and air. GDMIC is home to Port of Seattle’s primary marine shipping area, distribution and warehouse facilities, oil and petroleum storage facilities, major rail yards, and approximately 13 percent of the City's employment. The major industry sectors are Services (26%), Manufacturing (23%), and Wholesale, Transportation and Utilities (23%) [99], reflective of its base as a transportation, warehouse, distribution and manufacturing hub for the City and region. Consistent with citywide manufacturing job losses and the broader post-industrial trends of the US economy, both areas have experienced declining industrial employment over the last 20 years.

2.2. Data and Mixed-Methods

In the first part of our analysis, we analyze the stratification of Seattle’s socioeconomic groups across the city with census data in 1990, 2000, and 2009 with measures and methods commonly used by urban geographers to characterize gentrification. We compared demographic information on Seattle’s 568 Census Block Groups (CBGs) from the 1990 and 2000 censuses normalized by 2000 geographic boundaries [100] plus data from the 2009 American Community Survey (ACS) with a combination of Principal Components Analysis (PCA) and cluster analyses. PCA is designed to systematically reduce a large number of variables into a smaller, more conceptually coherent set of factors, dimensions, or components [101]. Component scores from the three PCAs are then used as independent variables in a cluster analysis of similar CBGs. While factor analysis results in groupings of variables, cluster analysis groups objects based on characteristics of interest to an analyst [102]. We used Ward’s method of cluster analysis and its minimum distance hierarchical technique to differentiate relatively homogenous CBGs. This was the most appropriate technique for this research because of its maximization of between-group differences and minimization of within-group differences [103].
We then describe the spatial distribution of industrial environmental hazards and their shifting spatial locations in the second part of our analysis with two datasets from the US Environmental Protection Agency (EPA) over four time periods: (1) 1995 to 2000; (2) 2001 to 2005; (3) 2006 to 2010; and (4) 2011–2015. First, Seattle’s largest industrial air polluters are compiled from the EPA’s Toxics Release Inventory (TRI) along with their relative inhalation exposure risks derived from the Risk-Screening Environmental Indicators (RSEI) modeling program [104]. Second, we also plot the locations of facilities reporting to the EPA’s Biennial Reporting System (BRS) to widen the characterization of Seattle’s riskscape [105]. According to Atlas [106], no published study until his 2002 paper had examined the distribution of hazardous waste generators reporting to the BRS database and these kinds of facilities accounted for 90 percent of all industrial hazardous waste.
Finally, we complement the quantitative socioeconomic and environmental hazard assessment methods with a case study of Seattle’s industrial area land use dynamics. Using policy documents and permit data on land use changes and building construction, we compare the trajectories of industrial land conversions in Seattle’s remaining industrial areas. The key planning and policy documents included: (1) Seattle’s Comprehensive Planning documents published in 1994 and 2005 [1,94]; (2) Industrial land studies released in 2007 and 2013 [93,107]; and (3) equity analyses from 1993 and 2015 [108,109]. We obtained the land use [110] and building construction permits [111] from SDPD’s online permitting database.
These seemingly disparate methods are integrated through the perspective of sustainability as a conflicted process where affluent residents out-compete less affluent ones for neighbourhoods with fewer environmental hazards on the one hand. On the other hand, our methods offer an empirical application of the varied theoretical developments around environmental gentrification as a sociohistorical process and addressed several critical gaps in sustainability research including its inattention to the performance of cities on equitable development. It’s the “creation and maintenance of economically and socially diverse communities that are stable over the long term, through means that generate a minimum of transition costs that fall unfairly on lower income residents” [112]. Equitable development requires, according to one urban practitioner, “...the promotion and management of economic growth that maximizes benefits for residents of low-income communities throughout metropolitan regions and assures their voice in the development process” [113]. Conversely, gentrification often involves inequitable development.

3. Results and Discussion

Since gentrification is considered to encompass change in any number of combinations of indicators, we first compiled and factor analyzed 12 variables from the broad categories of population, socioeconomic and housing measures to better understand the change in socioecological structure in each of the 568 CBGs in Seattle for the 1990, 2000, and 2009 time periods (see Table 1). In the first dataset, a three factor solution which explained about 73% of the variance in Seattle CBGs was obtained representing socioeconomic status, race/ethnicity, and household structure. The socioeconomic factor produced high loadings on percentage college graduates, percentage of professional occupations, median household income, median contract rent, and median house value. In the second factor, racial divides are manifest with the percentage of White alone inversely related to Black or Asian alone and the percentage at or below the poverty level. A third factor highlights a divide between traditional home-owning families and younger, unrelated residents who value urban living and amenities. The percentage of population age 25–34 loads together with non-family households while both are inversely correlated to median household income and homeownership rates.
The 2000 PCA results produced just two factors reflecting an urban structure shaped mostly by socio-racial status and household structure. Accounting for 65% of the variance in the arrangement of Seattle’s urban landscape, the first factor represents a convergence of socioeconomic status and ethnicity.
Factor one produced positive loadings for the percentage of college graduates, percentage of professional employment, median household income, median contract rent, median house value, and percentage White. Variables with negative loadings on factor one included percentage Black alone, Asian alone, and residents at or below the poverty line. This structure reflected an emerging divide between the labor forces, yet the individual importance of median household income, median contract rent, and median house value was superseded by college graduates and professional occupation. Factor two is identical to factor three from 1990 and indicated that urban amenities as viewed by different types of households continue to be significant in the city’s structural form.
The third PCA of 2009 ACS data accounted for 59% of the variance among the selected variables across two components reflecting socio-racial status and household structure. The first factor produced positive loadings for the percentage of college graduates, percentage of professional employment, median household income, median house value, and percentage White. Variables with negative loadings on factor one included percentage Black alone, Asian alone, and residents at or below the poverty line. This structure reflected a deepening divide between White and non-White populations in terms of professional status and affluence. The second factor again is nearly identical to factor three in 1990, and factor two in 2000 indicating that urban amenities for varying households continue to be significant in the city’s structural form. The percentage of population age 25–34 loads negatively with non-family households and both are inversely correlated with median household income and rates of homeownership. In fact, the relative importance of the proportion of population age 25–34, median household income, and homeownership rates increased since 1990 indicating a significant disparity between traditional home-owning families and younger residents. These multi-year PCA results of seven factors were then utilized in a hierarchical cluster analysis to identify similar groups of CBGs.

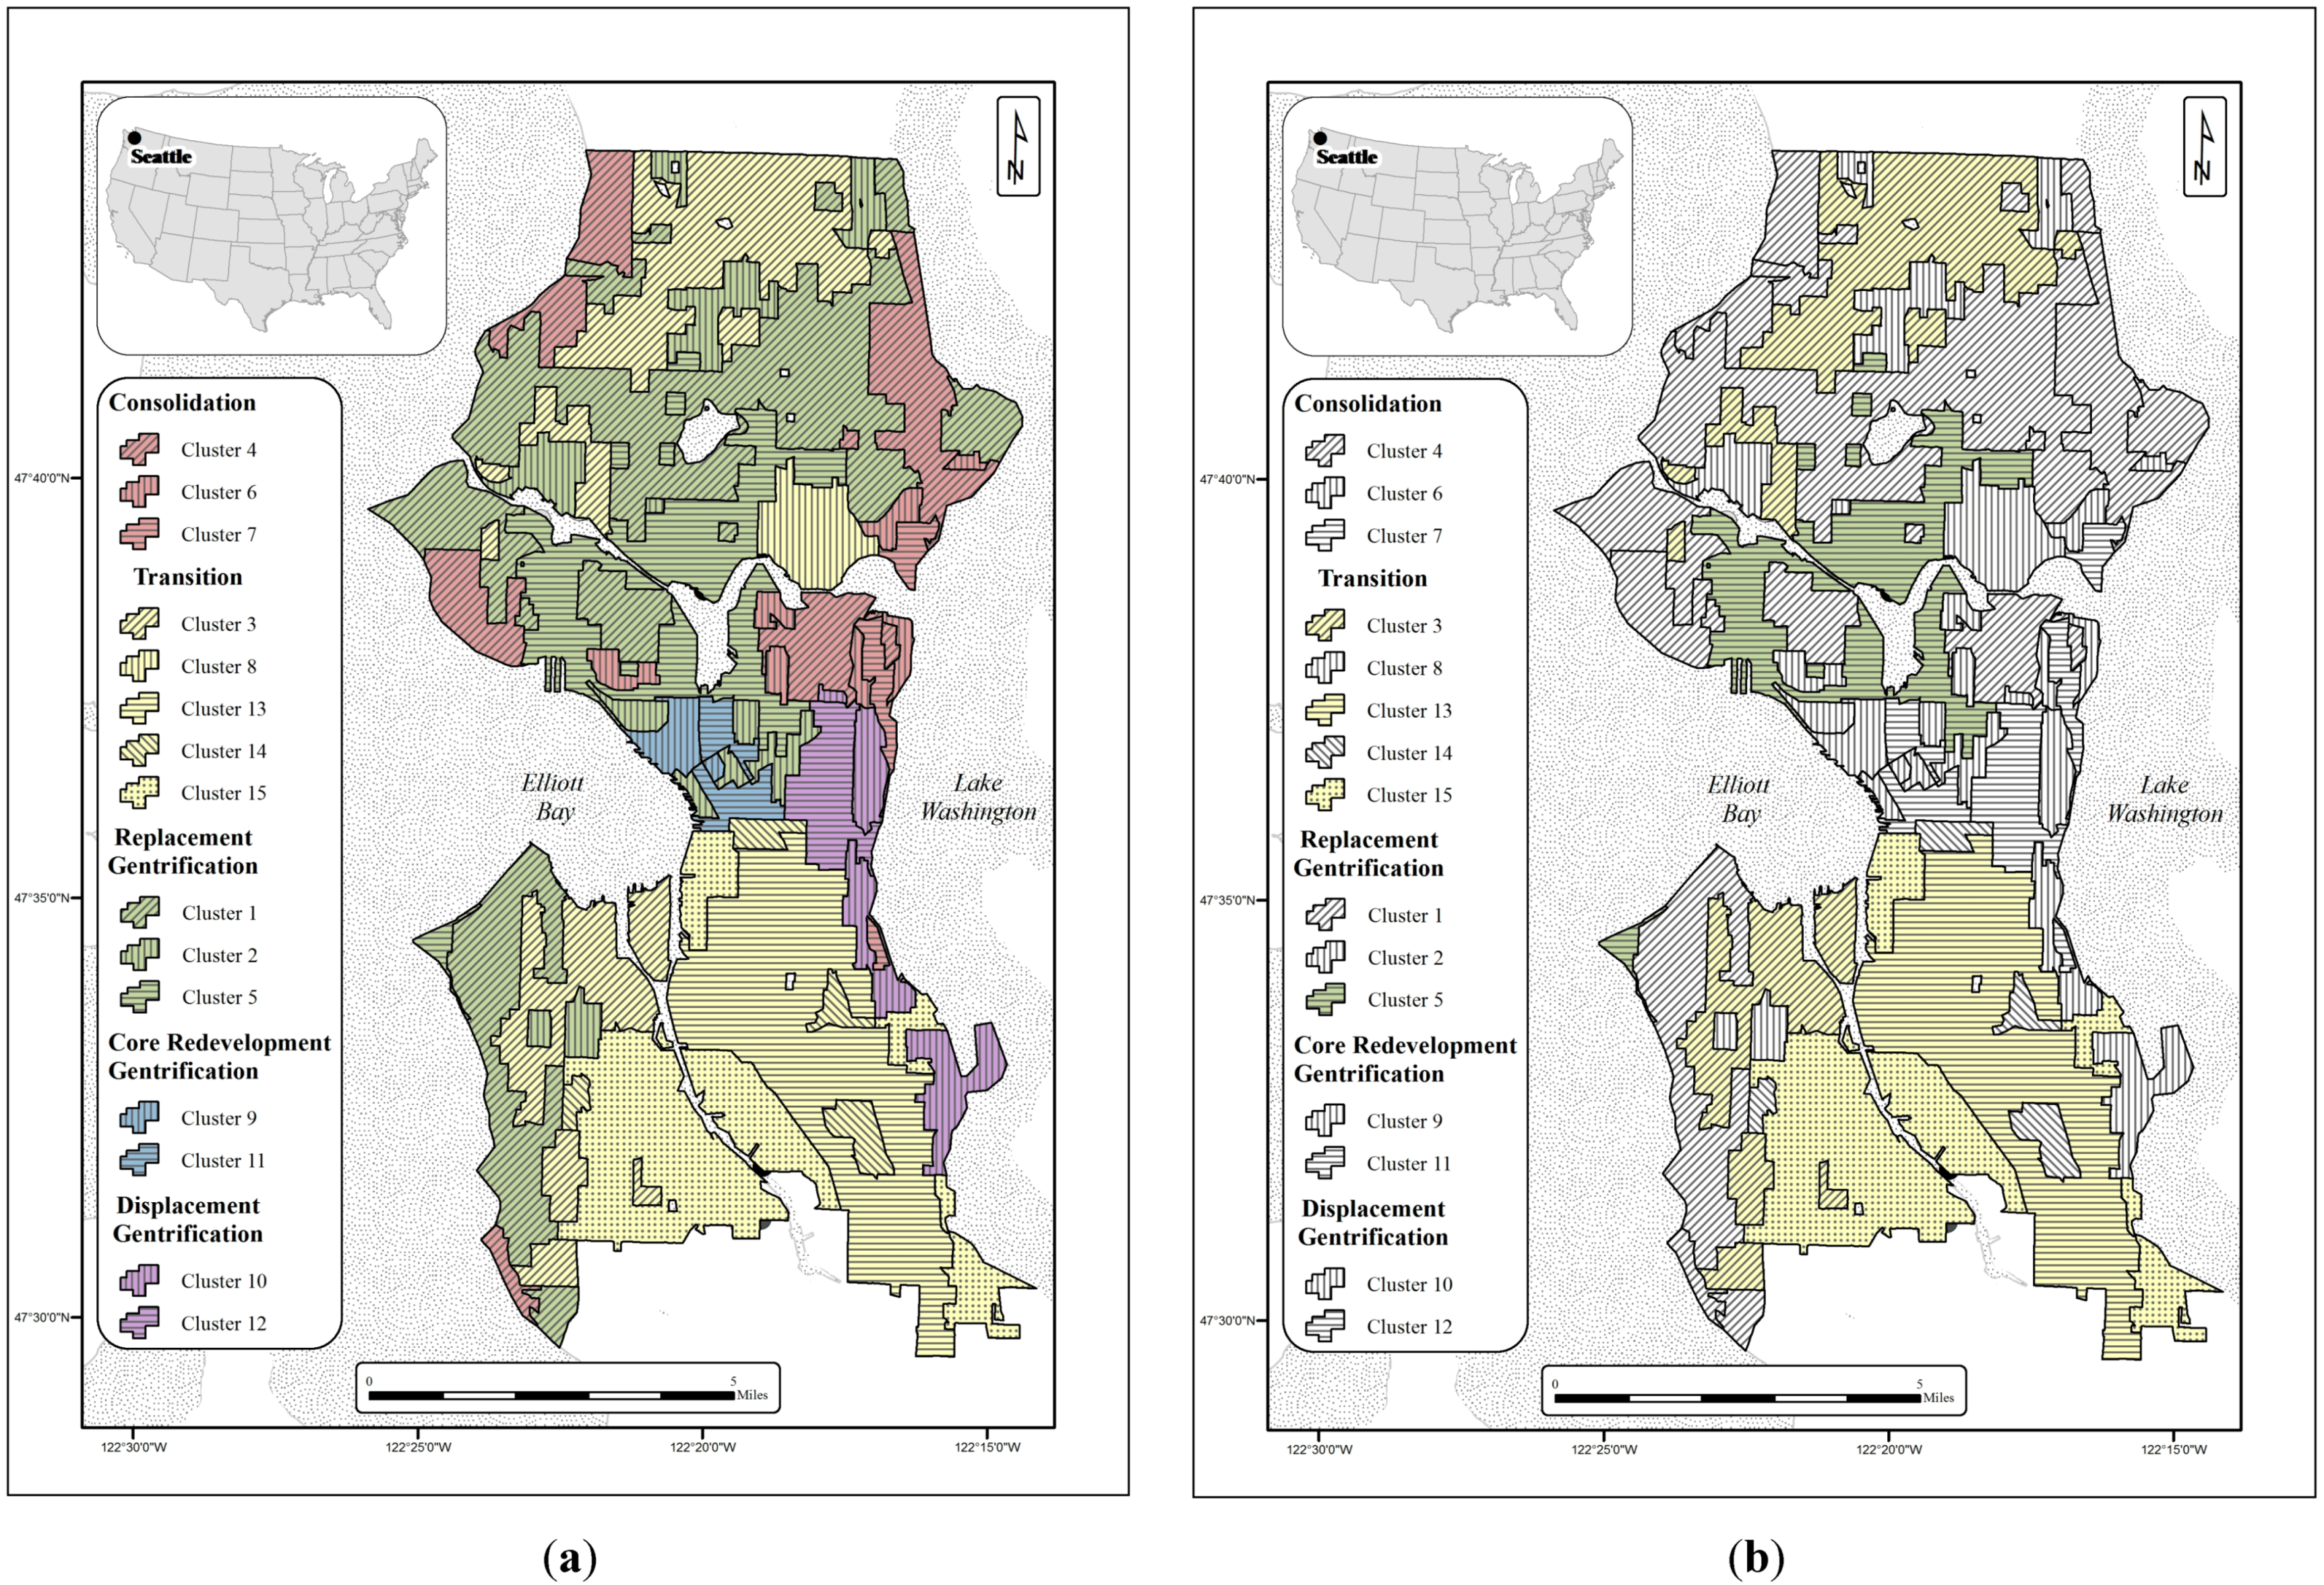
3.1. Seattle’s Gentrifying and Transitioning Urban Industrial Clusters

The results of the cluster analysis yielded groupings of CBGs with similar values on the seven factors derived from our PCA analyses. Like Morrill [114], we explored multiple cluster solutions and found a 15-cluster solution to be the most coherent ordering of Seattle’s urban structure considering quantitative relationships as well as historical geographies of locally recognized neighbourhoods (See Figure 2 and Supplemental Materials). A sixteenth cluster was excluded from statistical estimations because it encompassed the industrial district of Harbor Island at the mouth of the Duwamish River containing no residences. To classify gentrification and transition clusters, we examined trends in income, house value, education and occupation. If the rate of increase in 3 out of 4 of these indicators and the value of each variable at the end of the study period was higher than the city average, the cluster was classified as gentrifying. Transition clusters were those agglomerations that may have increased on 3 out of 4 variables, but the values in 2009 remained below the Seattle average. A closer look at the clusters in and near Seattle’s three industrial land use zones (3, 5, 13 and 15) in Table 2, Figure 2, and Table 3 illuminated some key trajectories in the city’s restructuring riskscape.
Table 1. Results of principal components analysis.
Category & Variable Name199020002009
Socioeconomic StatusRacial PolarizationHousehold StructureSocio-Racial StatusHousehold StructureSocio-Racial StatusHousehold Structure
Population
Population Age 25–34 0.746 −0.808 −0.789
Percent White alone 0.927 0.918 0.917
Percent Black alone −0.839 −0.678 −0.687
Percent Asian alone −0.635 −0.780 −0.708
Socioeconomic
College graduates0.837 0.873 0.838
Professional/Managerial0.823 0.862 0.741
Median Household Income0.713 −0.5510.6470.6380.5510.670
Poverty −0.5620.488−0.597 −0.476
Housing
2+ Person Non-family Households 0.734 −0.729 −0.616
Median Contract Rent0.627 0.555 0.493
Median House Value0.821 0.559 0.507
Owner-occupied −0.794 0.843 0.834
Percent Variance29.3023.2020.8641.9423.2334.9623.63
Cumulative Variance29.3052.5073.3641.9465.1734.9658.59
Notes: Loadings −0.45 to +0.45 not shown. Varimax rotation with Kaiser normalization.
Figure 2. Factorial Ecology of Seattle’s Development trajectories in 1990, 2000, 2009 for (a) all clusters and (b) industrial areas.
Sustainability 07 15718 g002
Cluster 3 sprawls across northern and southern parts of the city in three different agglomerations while covering a small portion of Ballard and the BINMIC industrial area. This cluster saw a small increase in its Black population and the percentage of residents in poverty while Asian residents and those aged 25–34 remained relatively stable. Median household incomes tracked the city average but median contract rent surpassed the average in 2000 and then fell below it in 2009. Cluster 3 attracted an increasing percentage of college graduates and management professionals both up from less than one-third of the area’s residents in 1990 to nearly half by 2009 suggesting an area growing in renters new to the workforce.
Table 2. Gentrification typology for clusters in and near Seattle’s industrial areas.
3Transition cluster with increasing social status; middle income; young, non-families; increasing minorities
13Transition cluster with Asian influx; little change in social status (working-class); above average home ownership
5Replacement cluster with increased social status; above average incomes; young, non-families; above average home values; primarily renters
15Transition cluster with Minority mixing; little change in social status (working-class); above average home ownership
Cluster 5 on the other hand stands out for its compactness and near alignment with the industrial areas on the edges of Lake Union and the BINMIC zone. This cluster saw an increase in young and nonfamily households while its residents also moved from below the average median household income in 1990 to above it in 2000 and 2009. Cluster 5 had increasing percentages of college graduates while also seeing one of Seattle’s biggest surges (nearly 20 percent) of residents with professional and managerial occupations. This replacement gentrification cluster had a significant class shift with residents paying consistently higher rents then in Clusters 3, 13, and 15. Cluster 5 also saw a decrease in Black alone residents with a slight increase in Asian alone population.
Conversely, Cluster fifteen’s trajectory in the center of the GDMIC industrial area was vastly different. Median household income in Cluster 15 remained below the city average in 1990, 2000, and 2009. While poverty declined between 1990 and 2000 in this cluster, it climbed from 12.3% to 15.8% between 2000 and 2009. Median house values increased at a higher rate than for the rest of the city (131.6% and 86.8%) but remained more than one hundred thousand dollars below the median value of a Seattle home. Moreover, Cluster 15’s gap of college graduates compared to the rest of the city increased between 1990 and 2009. Seventeen percent of Cluster 15 held a college degree in 1990 while 37.9% was the city average (20.9% difference). In 2009, 30.5% of Cluster 15 residents held a college degree while the city average was 54.3% (23.8% difference).
Table 3. Changes in Race and Age, Social Status (adjusted to 2000 dollars), and Professional Status for clusters encompassing and contiguous to industrial zones.
Cluster (n)Percent White AlonePercent Black Alone
199020002009199020002009
3 (83)85.8078.5278.992.583.924.73
5 (69)90.1486.1186.542.982.371.32
13 (51)25.1221.3525.8228.4321.4221.56
15 (31)63.5649.3957.3914.8615.4814.91
Seattle city75.9671.7871.6310.218.447.68
Cluster (n)Percent Asian alonePercent age 25–34
199020002009199020002009
3 (83)8.309.678.6121.7521.0721.51
5 (69)4.815.936.5531.5035.2235.07
13 (51)43.2345.7740.8118.3116.7416.90
15 (31)16.1719.7016.6319.2216.9717.85
Seattle city11.1912.5512.7921.7321.7121.73
Cluster (n)Median household incomeMedian household income
199020002009199020002009
3 (83)53,04759,36360,5798.019.419.46
5 (69)51,55764,82864,85410.518.799.28
13 (51)46,64954,13950,17616.3714.0615.96
15 (31)50,13358,40460,02913.1512.2515.77
Seattle city56,46358,86260,84312.3811.7912.24
Cluster (n)Median contract rentMedian house value
199020002009199020002009
3 (83)806934849204,521267,538387,558
5 (69)817978966280,153372,908491,893
13 (51)660771794148,402231,095330,622
15 (31)741874926146,134218,852338,416
Seattle city8159281024239,198334,105446,900
Cluster (n)Percent college graduatesPercent professional/managerial
199020002009199020002009
3 (83)28.3538.5849.4030.2342.5048.69
5 (69)52.2763.0168.8542.4157.3060.56
13 (51)15.8121.9327.1117.9127.2030.48
15 (31)16.9925.4330.4819.6130.9137.99
Seattle city37.9147.1954.3136.2748.4152.29

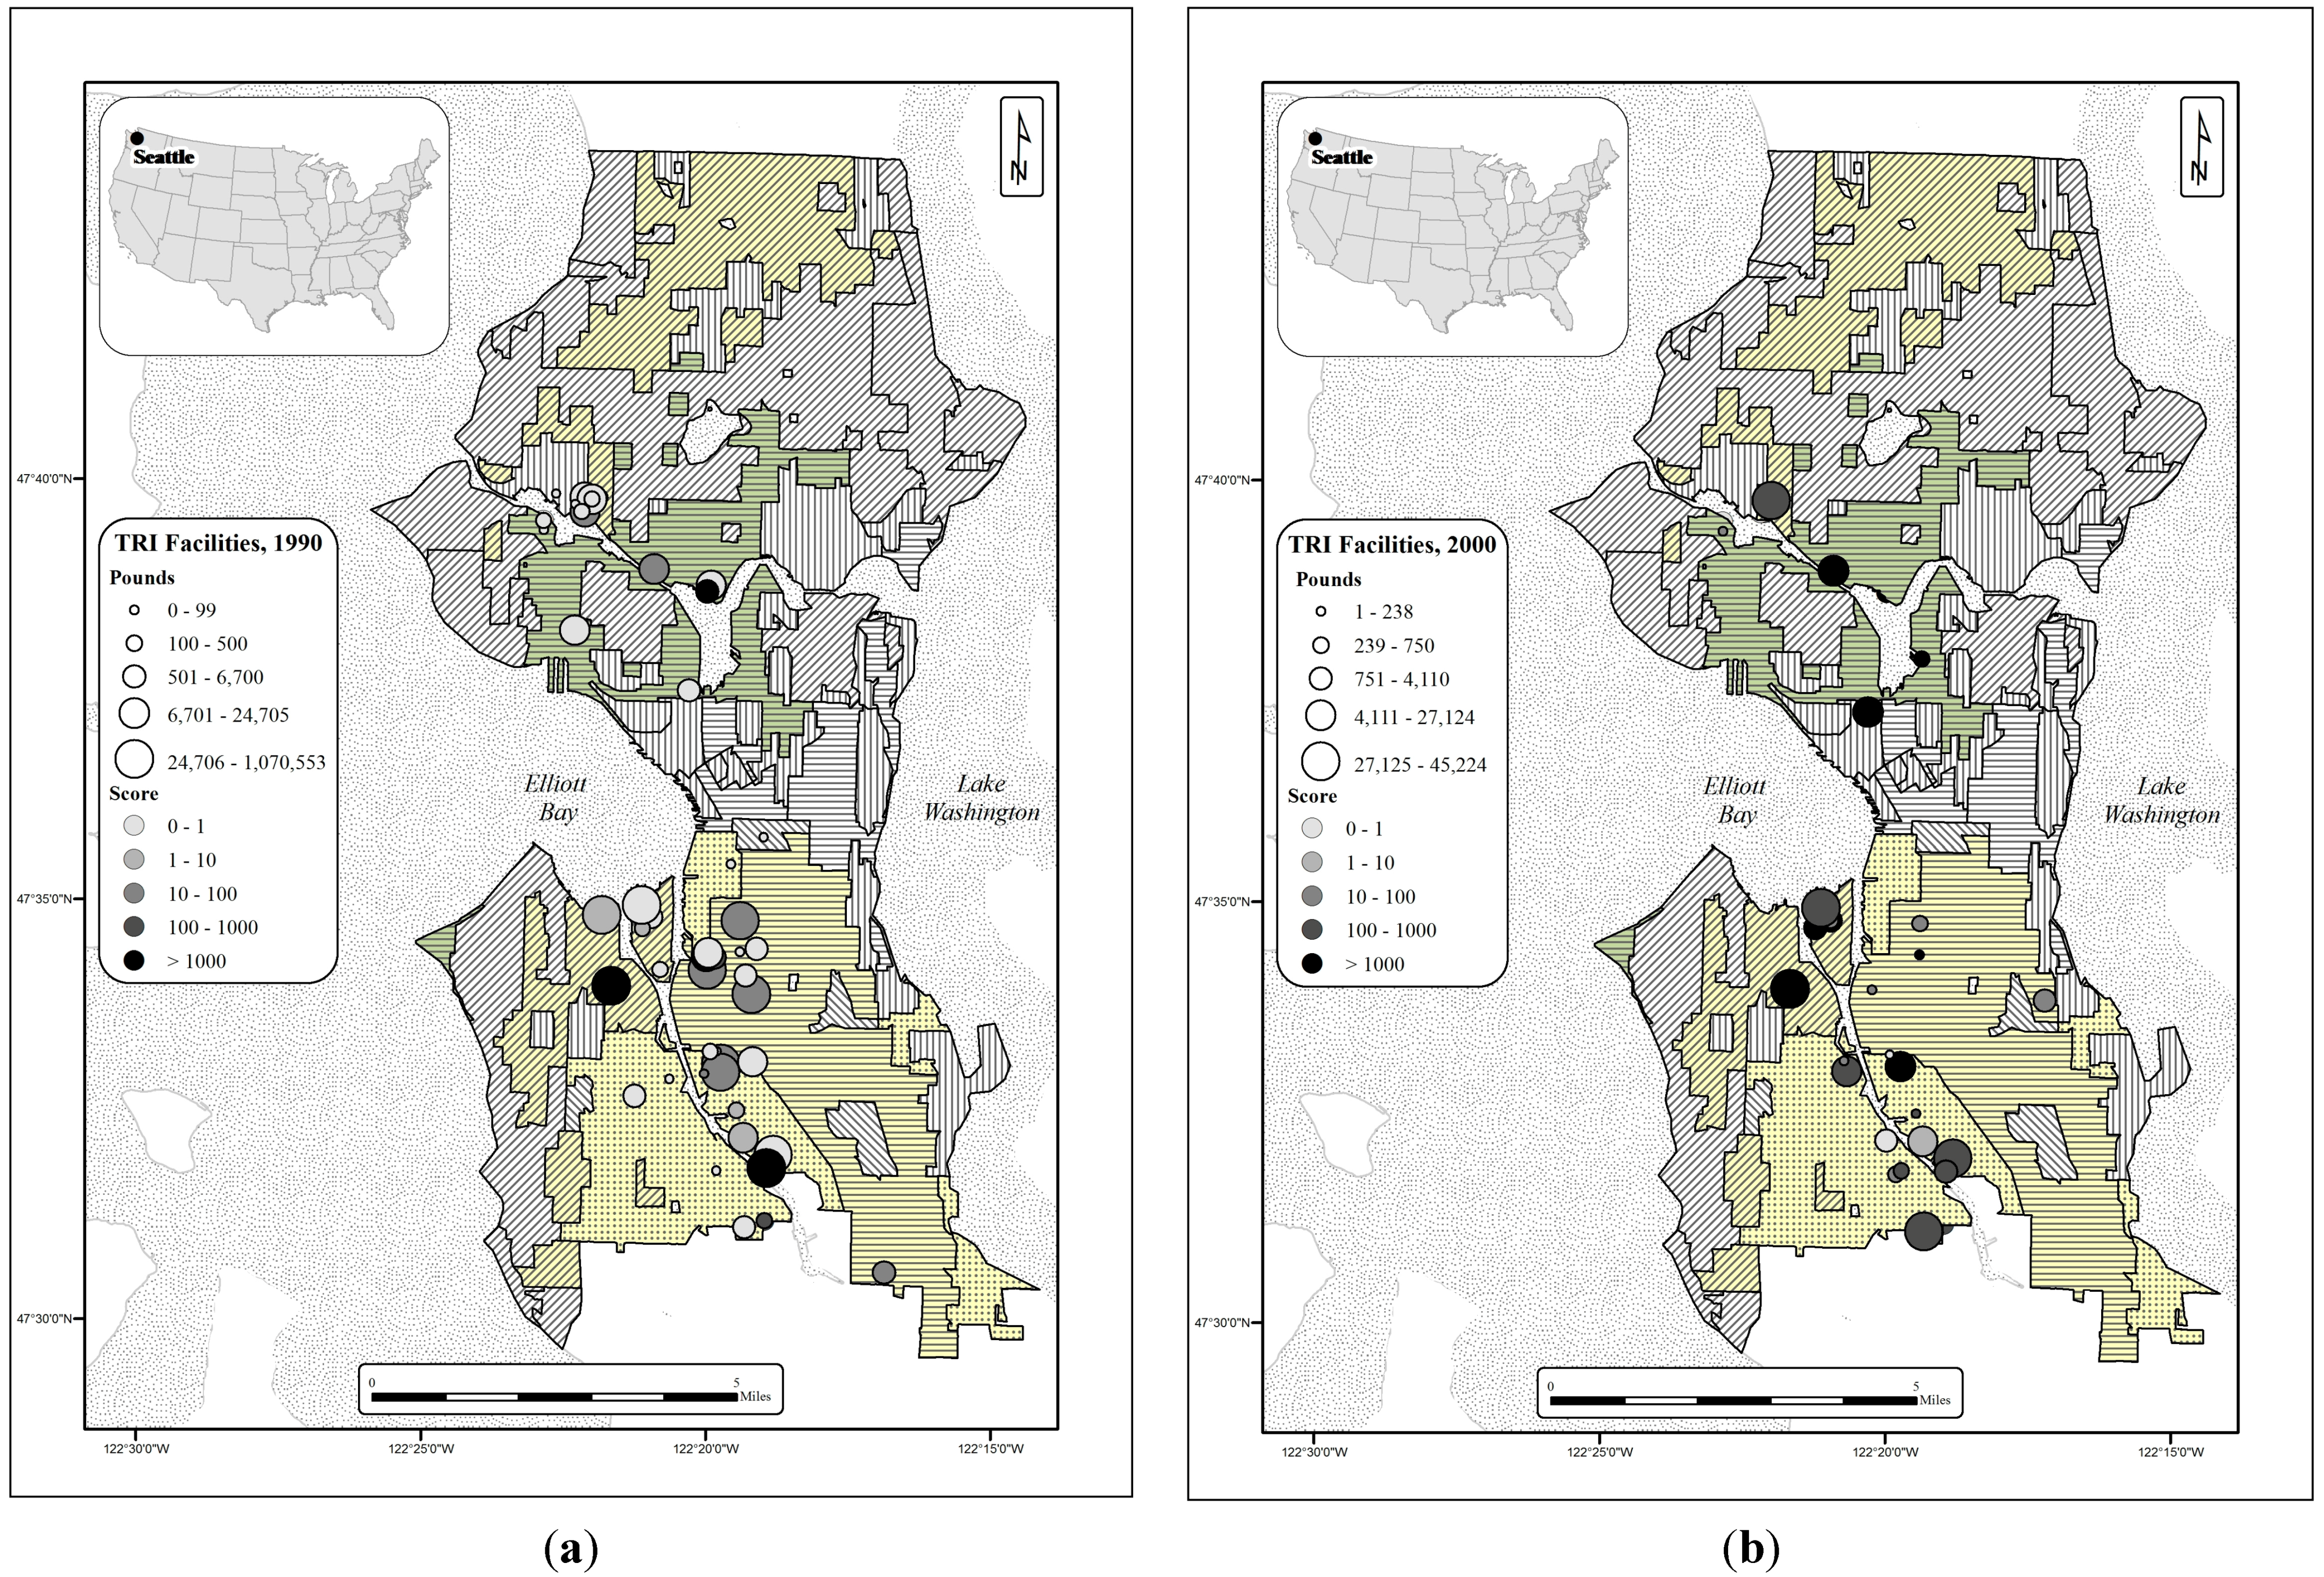
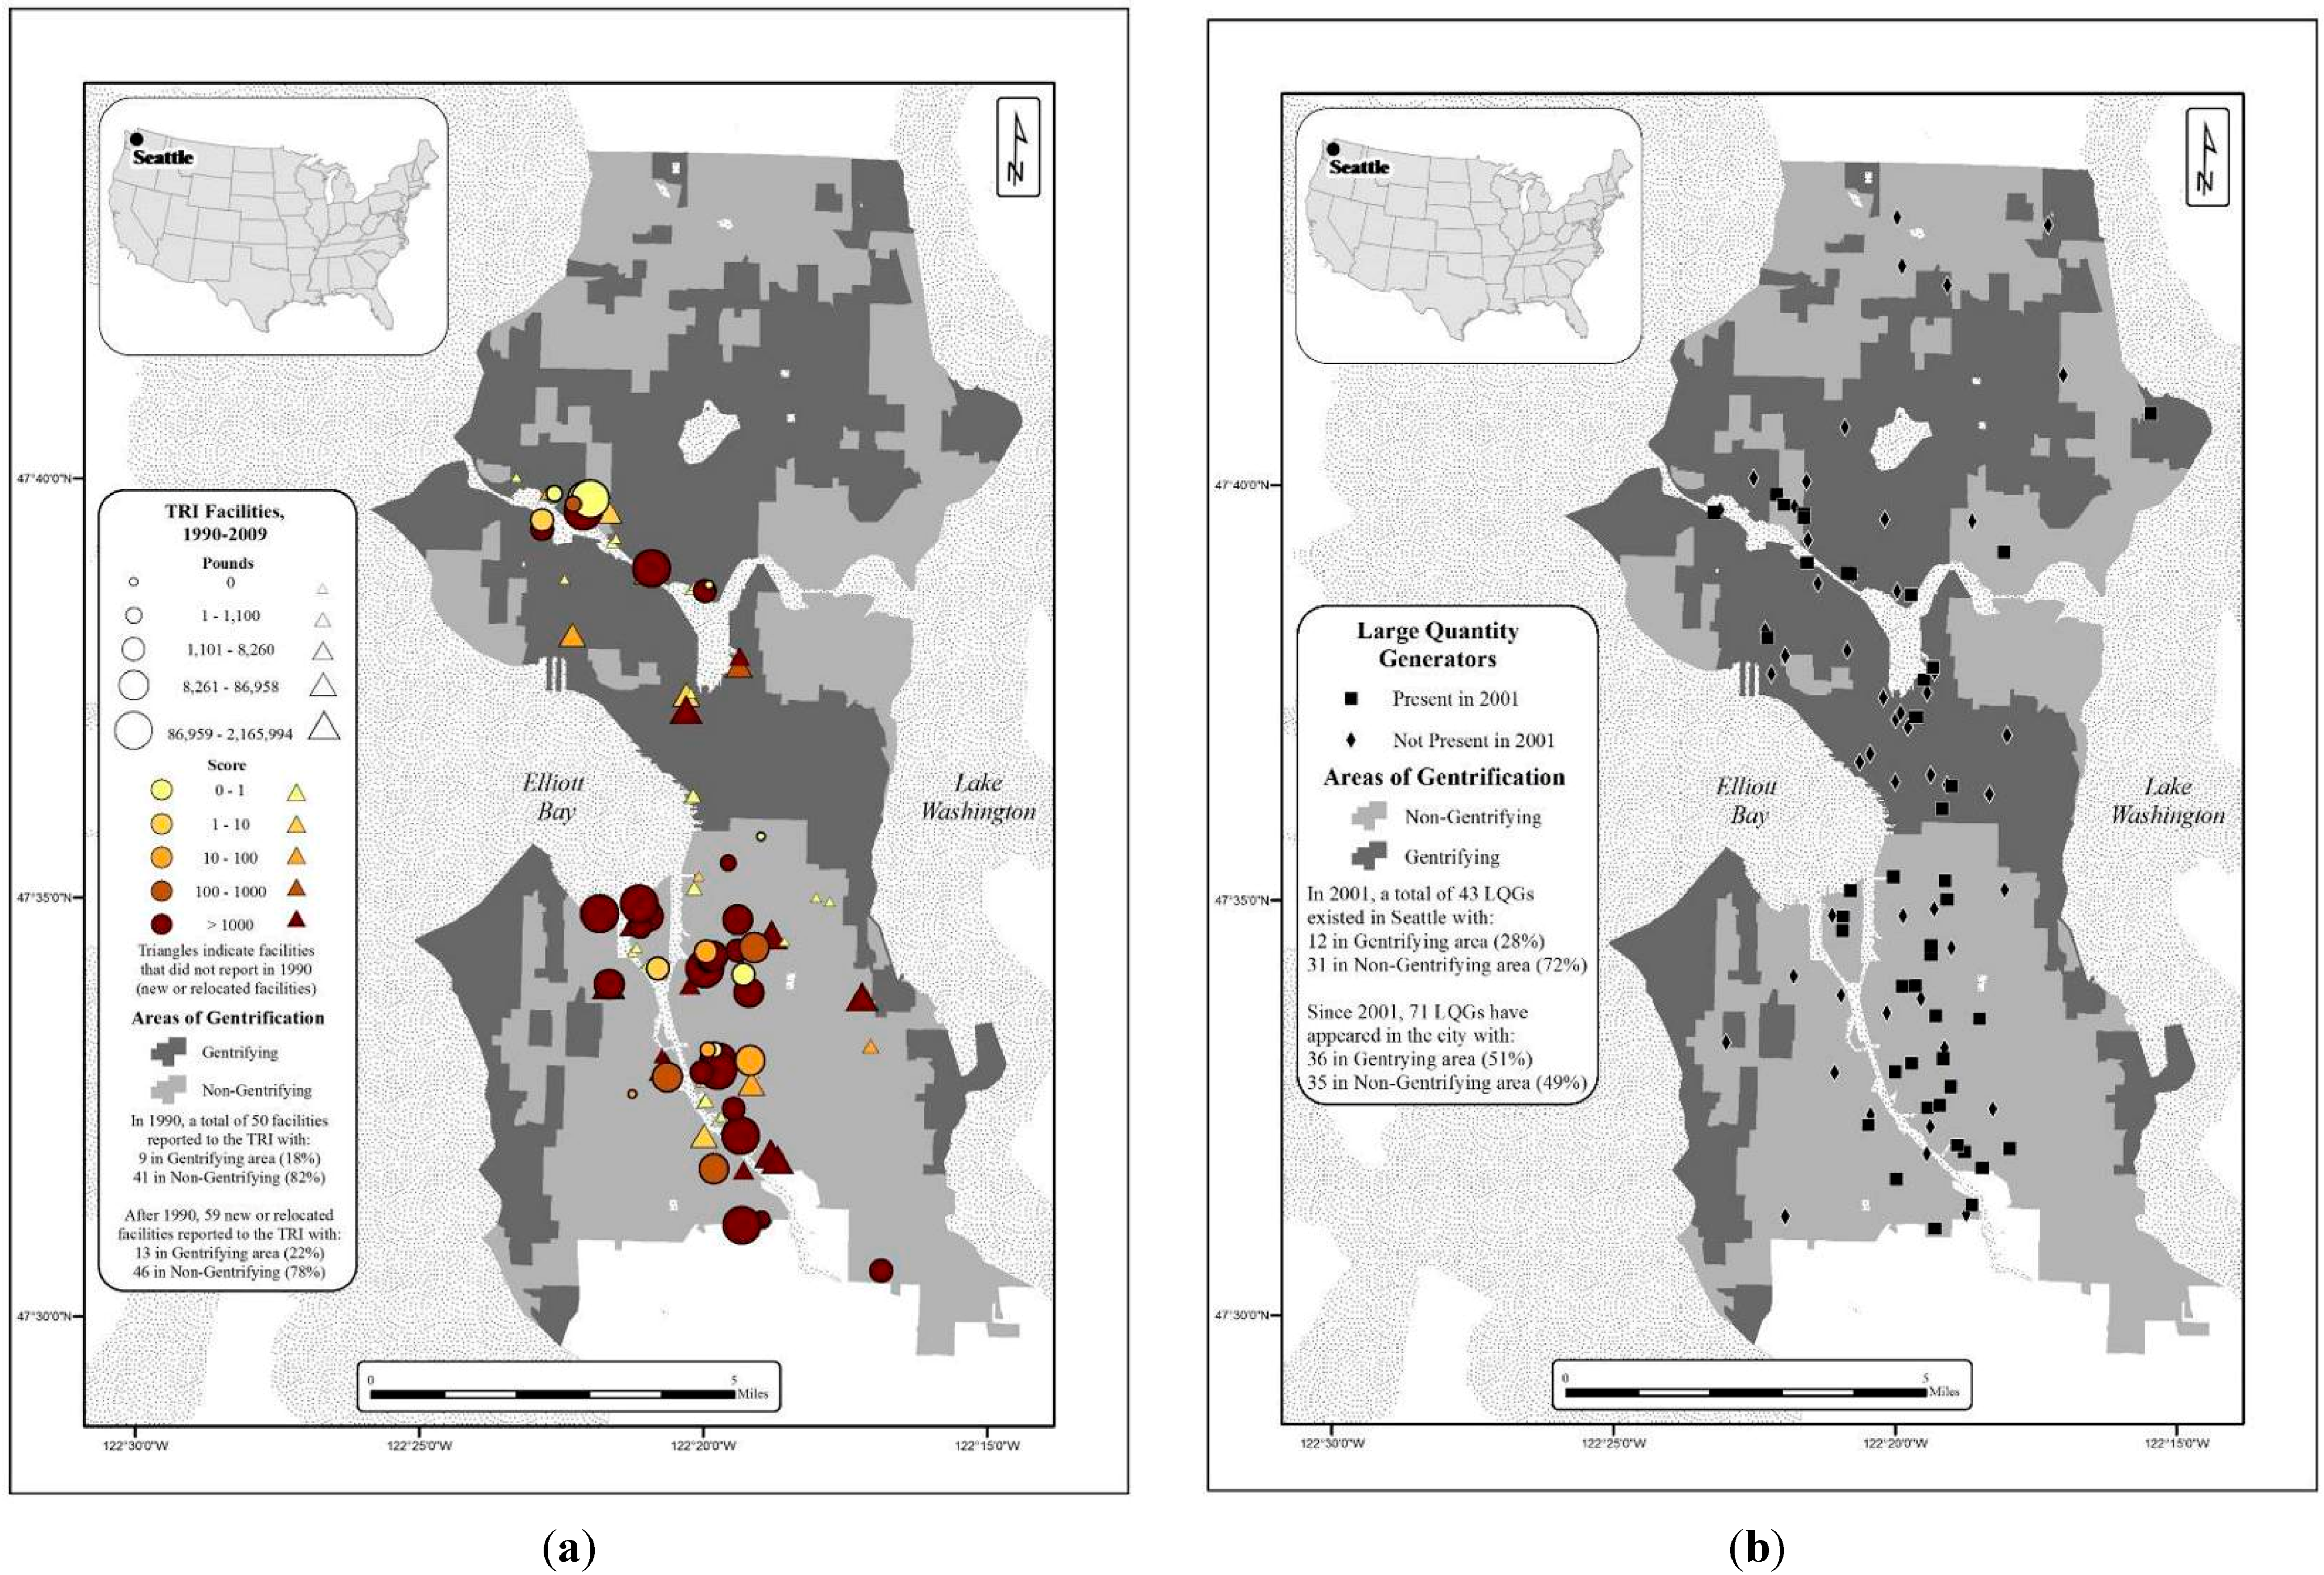
3.2. Seattle’s Shifting Riskscape

At the beginning of our study period, industrial toxic releases in the two clusters near BINMIC and SLU were not far behind the number of industrial facilities and risk levels seen in the two clusters near GDMIC (see Table 4). Clusters 3 and 5 hosted 19 TRI facilities in 1990 that produced a risk characterization above 13 million. In Clusters 13 and 15, 28 TRI facilities and their toxic emissions resulted in an exposure risk characterization of 17 million. By 2000, the BINMIC and SLU clusters exceeded the industrial emission and risk levels of GDMIC substantially. Nine industrial facilities in the industrial zones on the Northside produced nearly 78 percent of the air pollution exposure risk estimates while 16 facilities on the Southside of the city produced only 14 percent. By the end of our study period in 2009, Clusters 5 and 13 hosted only 3 TRI facilities, 4 were located in Cluster 3, and Cluster 15 hosted 11 industrial air polluters. More than 80 percent of the air pollution risk exposure estimates fell in the Southside’s Cluster 15 compared to nearly 16 percent in the Northside’s Cluster 3. Air emissions and their relative risk nearly disappeared in Clusters 5 and 13 as Seattle’s industrial air pollution riskscape shifted south (see Figure 3 and Figure 4).
Table 4. Seattle’s air pollution exposure risk characterizations by cluster from 1990–2009.
Cluster (No. of TRIs)PoundsRisk ValueTotal Risk, %Cumulative Risk, %
1990
Cluster 3 (12)330,2241,418,360.744.654.65
Cluster 5 (7)54,37911,707,273.8038.3643.00
Cluster 13 (13)140,70015,368,208.8950.3593.35
Cluster 15 (15)1,420,0902,023,126.556.6399.98
Top 10 facility totals1,182,59430,372,678.7499.5199.51
All facility totals (n = 58)2,478,74130,522,468.99100.00100.00
2000
Cluster 3 (6)113,79313,018.041.441.44
Cluster 5 (3)10,492691,922.9876.4277.85
Cluster 13 (4)231787,022.839.6187.46
Cluster 15 (12)130,95549,477.805.4692.93
Top 10 facility totals131,693902,696.1399.6999.69
All facility totals (n=34)285,737905,478.23100.00100.00
2009
Cluster 3 (4)15,6045612.8115.9315.93
Cluster 5 (1)100.830.0015.93
Cluster 13 (2)145111.720.3216.25
Cluster 15 (11)47,29629,218.2482.9299.17
Top 10 facility totals60,71634,662.9198.3798.37
All facility totals (n = 22)68,58035,237.07100.00100.00
1990–2009
Cluster 3 (21)2,012,2441,740,893.822.472.47
Cluster 5 (14)337,60117,161,948.5124.3326.80
Cluster 13 (22)599,02644,375,277.0962.9189.71
Cluster 15 (38)4,938,6646,625,084.589.3999.10
Top 10 facility totals2,630,54968,299,288.0896.8296.82
All facility totals (n = 113)8,978,34770,539,262.74100.00100.00
Figure 3. (a) Seattle’s Industrial Air Pollution Sources in the Toxics Release Inventory (TRI) in 1990 and (b) 2000.
Sustainability 07 15718 g003
Figure 4. (a) Seattle’s industrial air pollution sources in the Toxics Release Inventory (TRI) in 2009 and (b) 1990–2009.
Sustainability 07 15718 g004
Figure 5. (a) Seattle’s shifting toxic air pollution sources, 1990–2009 and (b) large quantity hazardous waste generators.
Sustainability 07 15718 g005
To further explore whether gentrification may have influenced toxic industrial locations, we also plotted facilities appearing in the RSEI data in 1990 with a circle and those reporting emissions at a later date with triangles. In other words, triangles represent new toxic air polluters across Seattle’s riskscape after 1990 (see Figure 5a). Likewise, and to expand on prior studies [22,23], we also obtained the spatial location and year of Large Quantity Generators (LQGs) of hazardous waste starting with 2001 represented by squares, and post-2001 sites with diamonds (see Figure 5b). We further dichotomized clusters into gentrifying and non-gentrifying CBGs with the former in a darker shade than the latter. In 1990, a total of 50 facilities reported toxic air emissions to the TRI with 18 percent (9) located in gentrifying areas while 82 percent (41) were in the non-gentrifying sections of Seattle. In the ensuing nineteen years, 59 new or relocated facilities reported air pollution emissions in the TRI (see Figure 5a). Only 22 percent (13) were in gentrifying clusters and 78 percent (46) in non-gentrifying areas. In 2001, there were 43 LQGs in Seattle with 28 percent (12) in gentrifying areas and 72 percent (31) in non-gentrifying areas. Between 2001 and 2013, 71 LQGs located to Seattle and a nearly equal number were present in gentrifying areas as non-gentrifying clusters (36 and 35 respectively). The distribution of Seattle’s hazardous waste handlers were more evenly spread across the city than toxic air polluters.

3.3. Seattle’s Industrial Zone Policy and Planning

In the early nineties, Seattle wasn’t only breaking environmental ground because of its sustainability focused comprehensive plan in 1994. Four years earlier, the city embraced the Comparative Risk Assessment paradigm prominent at the time [115] and launched a two-year project to identify and assess Seattle’s most pressing environmental challenges [116]. The committee’s air team ranked transportation pollution sources, wood burning, and environmental tobacco smoke as high risk challenges for the city while medium-high risk problems included other indoor air pollution and industrial point sources. The air team then prioritized these risks for city action based on not only the relative risks, but also on the city’s ability to address the problem. For example, the cross-media team ranked hazardous material use by business and industry in the highest relative-risk category but only ranked it in the second tier of priority actions “due to the effectiveness of existing regulations and the city’s relatively limited role in further addressing the problem” [116]. Likewise, industrial air pollution sources were placed among the lowest category of action priorities even as it ranked as a medium-high risk problem. The same report noted that “the pollution from point sources tends to be localized, so that large areas or large numbers of people are not affected” [116]. Seattle’s comparative risk assessment planning project would draw acclaim in a United Nations publication on the urban environment agenda [117].
A year later, the Mayor formulated and announced “Seattle’s Environmental Action Agenda” in 1992 that influenced the city’s next two budget cycles with 11 priorities including fostering stewardship, curbing cars, and protecting open space [118]. Moreover, the last section of the agenda titled “Improving Environmental Management and Coordination” identified several ideas for further action including the following. “Conduct a study of environmental equity in Seattle, and take appropriate measures” [118]. This recommendation was quickly implemented and in 1993, Seattle’s Planning Department completed the city’s first and only study of environmental equity [108].
For the two case studies: city planners performed two kinds of analyses: (1) an analysis of race and the location of commercial hazardous waste facilities; and (2) a descriptive study on the racial composition of communities with uncontrolled toxic waste sites. Interestingly, the authors of the environmental equity report noted a significant weakness in Seattle’s Environmental Priorities Project that had led in part to the equity analysis. “The priorities were based on a citywide examination of environmental risks. No attempt was made to evaluate environmental problems on a site-by-site basis or across population groups. Some population groups may experience a set of localized environmental problems that would not be identified in a city wide analysis” [108].
The city’s researchers identified 70 facilities that reported using EPA defined Extremely Hazardous Substances (EHS) with 11 in the BINMIC industrial area, seven around the Lake Union shoreline and the SLU industrial area and 25 across the GDMIC zone. Twelve were dispersed across nonindustrial areas of the city leaving 15 that either were not included on the map or were obscured in the symbology of overlapping points because of their close proximity to another facility. The report noted that “although the citywide proportion of non-white population groups is 24.7 percent, almost 35 percent of the people living in the same census blocks as the identified EHS facilities are persons of color”. Also, “Hispanics appear to be disproportionately represented in the two impact areas, with percent differences of over 83 percent and 55 percent between the immediate and greater EHS facility areas and the citywide totals respectively”. The report concluded in one section that “several population groups are, in fact, disproportionately represented in the impact areas”. However, in the concluding summary section, the report also stated the following. “Given the general lack of information on the correlation between risk sources and risk burdens that exists in the scientific community, it does not seem possible to determine with any certainty whether environmental risks are inequitably distributed in Seattle” [108]. Expectedly, the cities attention to environmental inequities in subsequent planning efforts disappeared after this 1993 report.
One scholar recalled that “for a time in 1994, it appeared the city would be the first public institution to complete the cycle of comparative risk by updating the analysis and repeating the problem rankings. The departure of key staff people, however, may have stopped that initiative” [119]. Nonetheless, the city was under a state mandate to produce a new comprehensive plan to manage growth. With automobile pollution at the top of the city’s environmental risk priorities, Seattle’s 1994 comprehensive plan aimed to steer new residents and their jobs into denser urban centers and urban villages (See the Supplemental Materials for a map of these designations). “The goal that unifies all the elements of the Comprehensive Plan is to preserve the best qualities of Seattle’s distinct neighbourhoods while responding positively and creatively to the pressures of change and growth. A key component of the City’s plan to achieve this goal is the urban village strategy” [120]. The report plan proclaimed that “The City will continue to work with its residents, businesses, and institutions to promote conditions that will help each of its communities thrive, but will pay special attention to those areas where the majority of growth and change is expected”. Moreover, the plan outlined different goals and policies for residential neighbourhoods, the new HUVs, and the city’s industrial zones.
For example, in the South Lake Union (SLU) section of the 1994 plan, the first stated goal for this neighborhood’s character aimed for “a mixed use neighborhood with an emphasis on small business and light industry” [120]. But for Manufacturing and Industrial Centers like BINMIC in the same plan, the goal was to “ensure that adequate accessible industrial land is available to promote a diversified employment base and sustain Seattle’s contribution to regional high-wage job growth”. Moreover, one of the seven policy statements for the city’s industrial areas prescribed the following.
Limit in industrial/manufacturing areas commercial or residential uses that are unrelated to the industrial function, that occur at intensities posing short- and long-term conflicts for industrial uses, or that threaten to convert significant amounts of industrial land to non-industrial uses.
[120]
However, the designation of SLU and its existing industrial area as a HUV embraced numerous non-industrial development possibilities. For instance, one HUV policy from the comprehensive plan aimed to “provide zoning to accommodate a wide range of housing types and retail and commercial services to support the business and residential population in the village, the surrounding community, and beyond”. Such a contradiction was worrisome for industrial interests when the comprehensive plan draft was released two years earlier. A landowner in the industrial South Lake Union area was quoted in 1992 as saying “business people are not enthusiastic about the wholesale creation of a housing neighborhood” [121]. Likewise, in 1995, the encroachment of non-industrial development in BINMIC pitted the City of Seattle and retailer Fred Meyer against a Ballard group named “Save Our Industrial Lands” (SOIL) in a court battle that lasted three years [122]. SOIL settled with the retailer in 1999 and the former site of Salmon Bay Steel Company became the home of a new Fred Meyer store [123].

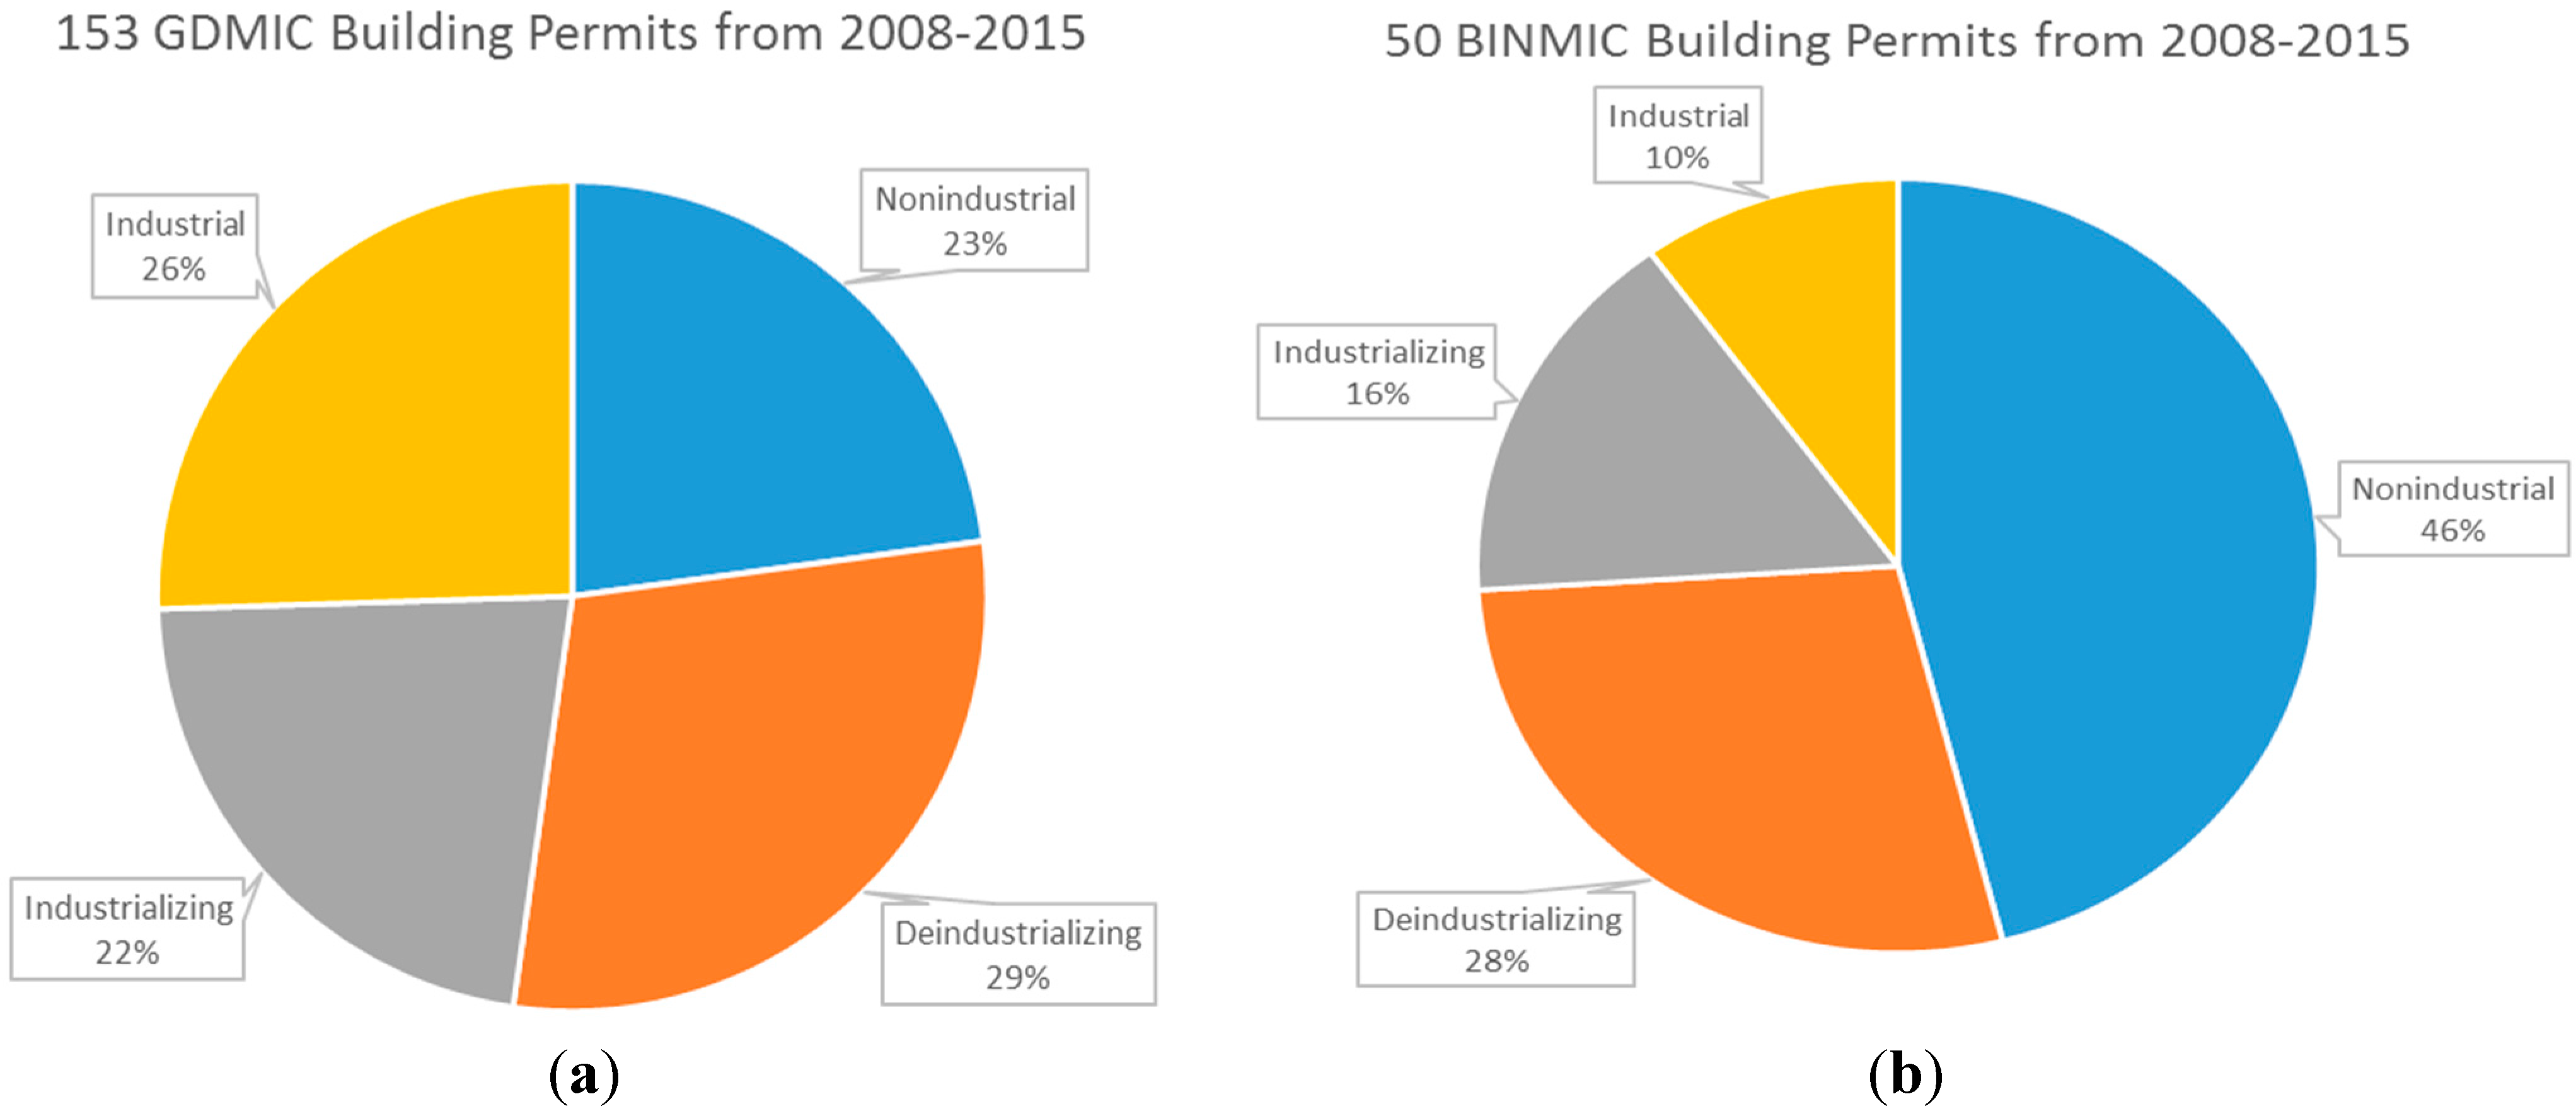
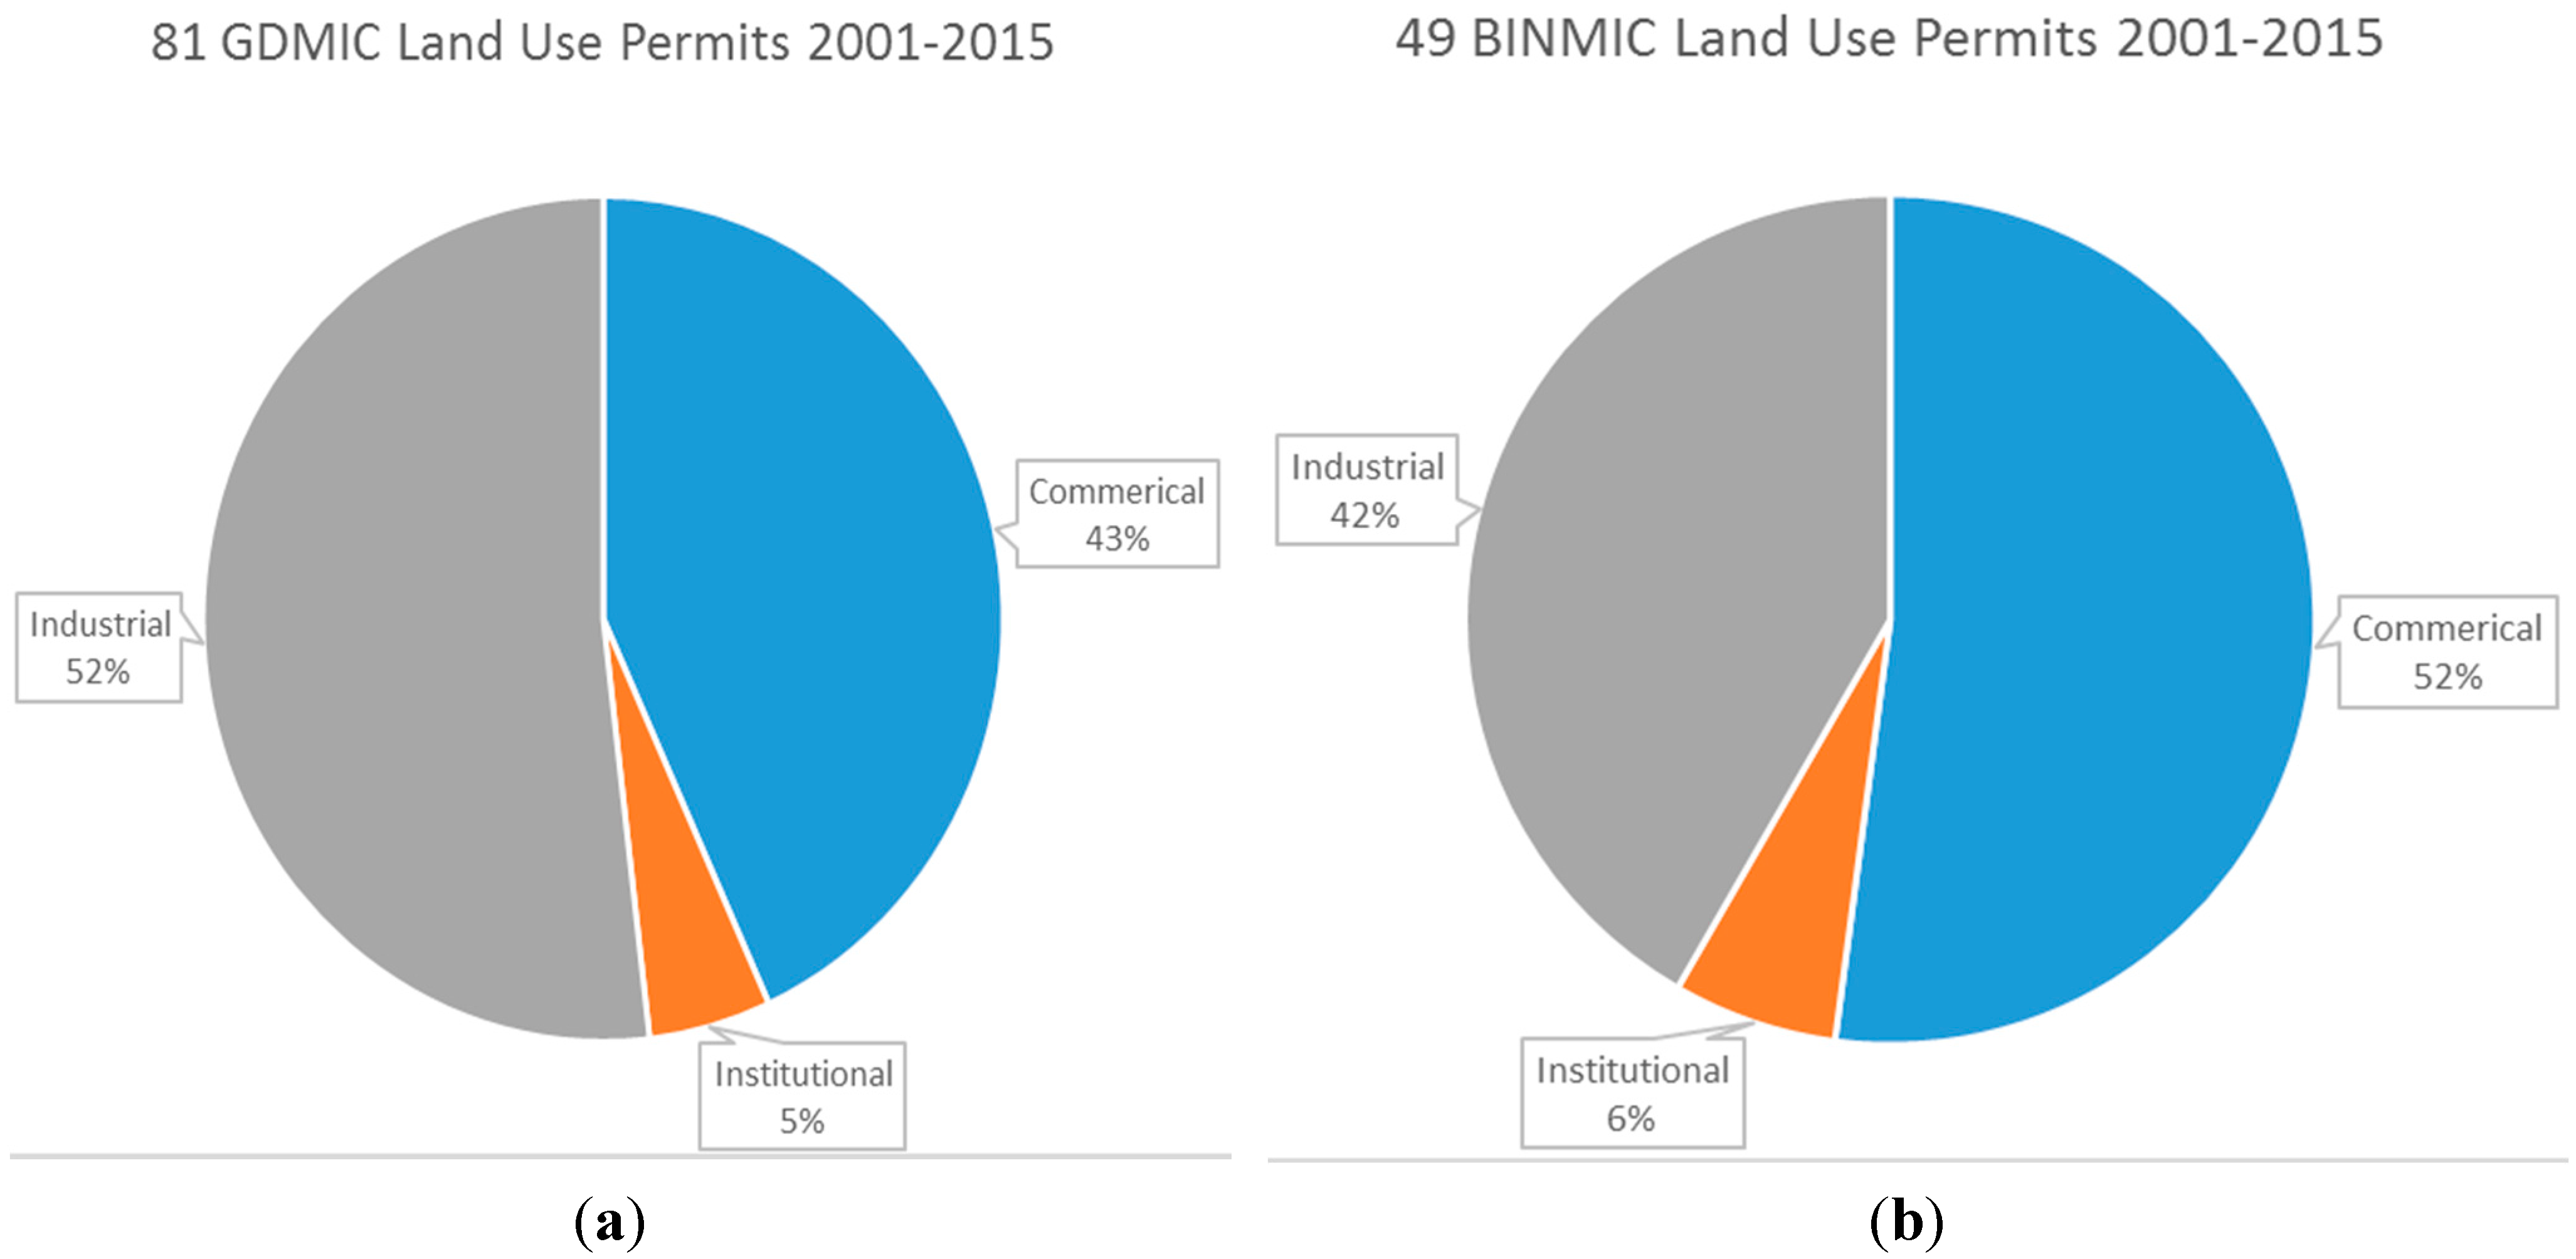
3.4. Non-Industrial Encroachments, Creeping Gentrification

Industrial area zoning changes and conflicts continued between 1995 and 2006 with more nonindustrial proposals for BINMIC and nearby shoreline [124,125,126,127,128,129], a big shift on the north end of GDMIC [130,131,132,133,134], some concern for GDMIC’s southern portion [135,136], but suspicion, cynicism and then resignation for SLU [137,138,139,140,141,142,143]. In the midst of these developments, the Seattle Times editorial board sounded an alarm in 2000 and called for the city to “Hold Fast on Zoning for Industrial Uses” [144]. A few months later, a city councilor described planning for the non-industrial developments. “We’ve done what we need to make sure the industrial base is protected. I don’t think you can absolutely prevent encroachment. What you can do is try to set policies that encourage as much as possible of the commercial development toward the north” [145]. Then, in 2007, the seemingly fragmented and decade of creeping deindustrialization in Seattle’s industrial zones spurred another city study.
Intent on understanding the key dilemmas with Seattle’s manufacturing and industrial areas, the city’s Department of Planning and Development (SDPD) performed a policy analysis of land use changes between 1996 and 2006 across BINMIC, GDMIC, and the other areas of industrial use like SLU [93]. SDPD analysts found that in the northern subareas of BINMIC next to the Ballard HUV, 20 percent of construction and land use permits proposed conversions from industrial to nonindustrial activity while 20 percent involved changes from one industrial use to another. Nonindustrial conversions also exceeded one out of every five permits (24 percent) in the industrial zones outside of the BINMIC and GDMIC areas like SLU and those along the shoreline of Lake Union. Conversely, in the Georgetown neighborhood of the Southeast section of GDMIC, only four percent of the permit activity over a decade involved nonindustrial conversions from industrial activity. In the southern section of GDMIC around the residential area of South Park, the analysis reported that 15 percent of permit changes were from one industrial use to another while 63 percent were industrial conversions from nonindustrial uses. This reflected, according to the report, “the area’s vibrant industrial economy” [93].
We replicated and extended this analysis by analyzing and mapping change of use construction permits between 2008 and 2015 and land use permits between 2001 and 2015 (see Figure 6, Figure 7 and Supplemental Materials). Among construction permits that included a change of use, we identified a total of 153 for the Greater Duwamish (GDMIC) manufacturing zone and 50 for the Ballard and Interbay (BINMIC) industrial area. The largest share of construction permit activity in GDMIC was for deindustrializing activity at 45 sites (29 percent) with 20 locations changing from industrial to nonindustrial and 25 new nonindustrial. Industrial to industrial uses followed closely behind at 39 sites (26 percent) while industrializing sites were the third most frequent construction change of use (14 Nonindustrial to Industrial and 20 New Industrial). Nonindustrial to nonindustrial changes were the fourth most frequent change of use. Consistent with its manufacturing character, the majority of land use permits (42 or 51 percent) in GDMIC involved industrial activity, 43 percent (35) were commercial, and 5 percent institutional. Conversely, 51 percent (25) in BINMIC involved commercial activity while 41 percent (20) were industrial and 6 percent (3) institutional.
Figure 6. (a) 2008–2015 Construction Change of Use Permits Issued in GDMIC and (b) BINMIC.
Sustainability 07 15718 g006
In the BINMIC zones, the majority of construction permits with a change of use were non-industrial to non-industrial activity represented at 23 sites or 46 percent of permit activity. Half of those permits were clustered at the top of BINMIC near the location of the Ballard Hub Urban Village (See Supplemental Materials). Deindustrializing conversions (industrial to nonindustrial and new nonindustrial) were the second most frequent change of use permit activity at 12 sites representing 28 percent of BINMIC’s change of use permit actions. Conversely, only 16 percent of BINMIC permits were for industrializing activity with 5 involving non-industrial to industrial conversions and 3 for new industrial development. In sum, 74 percent of BINMIC construction permits and 52 percent in GDMIC were for non-industrial uses. BINMIC also only saw 26 percent of its construction permit activity for industrial development while 48 percent of GDMIC’s permits were for industrial uses. In other words, BINMIC was becoming a predominately nonindustrial development area while GDMIC saw nearly equal amounts of industrial and nonindustrial development.
Figure 7. (a) 2001–2015 Land Use Permits Issued in GDMIC and (b) BINMIC.
Sustainability 07 15718 g007

4. Discussion

Seattle experienced a significant transformation of its economic and urban geography through a dramatic post-industrial shift. The city lost a significant share of its industrial footprint as air pollution decreased 99 percent and the simulated inhalation exposure risk also dropped by 96 percent. The environmental dimension of Seattle’s sustainability was dramatically better. Likewise, the economic indicators for the city suggested that performance on another sustainability dimension were also stellar. Median household incomes jumped by eight percent, poverty was down, and the city’s minimum wage was boosted by local initiative to support a living wage. Seattle’s share of its workforce in professional and managerial occupations also increased from thirty-six to fifty-two percent. Educational attainment surged for the city as its residents with a college degree grew from less than thirty-eight to fifty-four percent. Such transformations earned this Northwest city a third place rank among urban areas advancing a new economy [146] and the following kind of praise. “Seattle has completely transformed itself from a decaying old-economy provincial town into one of the world’s preeminent innovation hubs. In the process, its residents have become some of the most creative and best-paid workers in the United States” [147]. However, our research joins those finding an increasingly divided city but also speaks to a larger shortcoming of sustainability research that overlooks the contested geographies of post-industrial and industrial development.

4.1. Environmental Gentrification and the Post-Industrial City

The conventional thesis in the relatively new literature on environmental gentrification “predicts that environmental quality improvement in poor communities may spur gentrification and the displacement of residents” [51]. Our research supports a different, and more complex process. We observed strong gentrification signals across Seattle over our entire study period in areas with and without active pollution sources. In particular, the replacement gentrification observed in cluster 5 completely encompassed the BINMIC and SLU industrial areas even though there were active, and some of the relatively riskiest air pollution sources in two of our three study period cross-sections. In 1990, the gentrifying cluster 5 that included industrial zoned land hosted 7 facilities that produced a simulated 38 percent of the inhalation exposure risk to Seattle residents from industrial air pollution. Ten years later, cluster 5 still hosted three of the most hazardous facilities producing 76 percent of the city’s relative inhalation exposure risk from TRI facilities. Gentrification did not follow pollution cleanups and deindustrialization in the BINMIC area. Instead, industrial displacement through gentrification [66,67,68,69] better describes the process driving the restructuring of urban land use on Seattle’s Northside.
For example, newspaper accounts between 1994 and 2005 describe significant nonindustrial redevelopment proposals by the Seattle’s Port Authority and real estate investors for the BINMIC and SLU industrial lands. Nonindustrial redevelopment permits in these two areas also were much higher than in GDMIC revealing a more heated contest for land in North Seattle’s industrial areas. City planners also targeted three different parts in or near BINMIC and SLU for denser redevelopment. These results suggest that rather than gentrification following cleanup, gentrification was occurring in parallel if not preceding environmental improvements around BNMIC and SLU.

4.2. Planning for Environmental Discrimination?

While the Seattle’s industrial air pollution riskscape was spatially distributed between the northern and southern industrial areas in a relatively even pattern in both 1990 and 2000, it became extremely skewed by 2009. Several of the riskiest and many new TRI facilities were located in the southern half of the GDMIC industrial zone in the midst of cluster 15, one of the most socially vulnerable neighborhood grouping in the city. Conversely, the share of the city’s relative risk exposure of facilities in replacement gentrification clusters dropped from 38 to less than one percent during our study period. The riskiest industrial facilities and lowest socioeconomic strata converged in the areas represented by Custer 15 surrounding two residential neighbourhoods called South Park and Georgetown. In the 98108 ZIP code containing both communities, more than 70% of the 5,070 residents are non-white minorities, including Asian, Pacific Islander, Hispanic, African, African-American, and Native American [148]. Forty-two percent of residents are foreign-born, and more than 20 languages are spoken. Nearly a third (32%) of residents live below 200% of the poverty level and 78% of children at the local elementary school qualify for free or reduced price lunch. The neighbourhoods also have a significantly higher percentage of elderly residents (>65) and children (<5) than the city average who are more vulnerable to air toxics pollution exposures.
Even as the city was dismissing environmental inequality in a 1993 planning study, other studies and community groups were raising concerns about inequitable pollution burdens particularly in South Seattle. In 1991, the US Environmental Protection Agency (EPA) cited the Duwamish industrial zone for violating federal standards for particulate pollution [149,150]. Three years later, a Seattle Times study in 1994 highlighted the concentration of environmentally hazardous facilities near South Park and reported the following quote from one South Park resident [151]. “I don’t see a lot of environmental justice. I see a lot of environmental injustice”. In a second newspaper story on the same date, same source, the reporter noted that “most sites in Seattle where toxic chemicals are released or hazardous waste is stored are in neighbourhoods whose populations are less white or less affluent than the city as a whole” [152]. In 1995, the city’s mayor formed a task force to develop a city wide plan to address environmental justice and they released their report a year later [153]. However, there is little evidence that the mayor or other Seattle officials implemented any environmental justice action.
National research confirmed the relative shallow environmental justice efforts by Seattle. Warner [154] conducted a comparative study of 77 city’s efforts to integrate environmental justice in their sustainability planning. Focusing on website content, only five cities were identified with substantial amounts of information about environmental justice including Seattle. However, only one policy statement committing to “compliance with applicable environmental justice regulations” from Seattle’s Council on Airport Affairs was available on the website plus a link to the US EPA’s environmental justice website. Thus, the City of Seattle’s early symbolic efforts quickly faded as no policy or planning effort was sustained for five or more years even as other Seattle groups and agencies continued to identify environmental inequities.
In 1997, the city and county’s Department of Public Health [155] documented higher respiratory hospitalization rates, decreased life expectancies, and higher mortality rates in South Seattle. A local environmental justice group identified more than forty industrial and waste facilities in 2001 within a one to five-mile radius of South Park homes [156]. In 2002, the Puget Sound Clean Air Agency (PSCAA) used monitored data to evaluate cancer and non-cancer risks in different Seattle locations and found the highest risk estimates in the Duwamish industrial valley neighborhood of Georgetown [157]. Likewise, a 2008-2009 study sampling over 100 different air toxics across four sites in both Seattle and the industrial port of Tacoma to the South found that the potential cancer risks from Diesel emissions were the highest at the monitoring site just north of the Georgetown and South Park neighbourhoods [158]. Another longitudinal air toxics monitoring program for Seattle published in 2011 found higher inhalation cancer risks from data collected at two South Seattle sites compared to four other locations across the city [159]. Yet, Seattle city agencies, planners, and politicians continued to ignore the growing number of studies and community concerns registering how environmental injustice remained unaddressed in South Seattle.
Twenty years after an environmental justice movement gained national policy attention and South Seattle’s unequal environmental burdens were documented over and over, sections of one of the most sustainable cities in the world still do not enjoy the same environmental amenities as most other neighbourhoods in the city. Duwamish Valley residents instead have been burdened by a series of decisions over time that have seen Seattle promote nonindustrial development in Ballard, Interbay, and South Lake Union leaving new and relocating industrial development to concentrate in the southern section of GDMIC. In fact, the City’s struggles with the intersections of environmental injustice and social stratification were acknowledged when the EPA in 2014 selected a Duwamish Valley Coalition as one of 10 communities across the nation for a two-year Environmental Justice Collaborative Problem-Solving (EJCPS) grant to focus on cleaning up air pollution in the Georgetown and South Park neighbourhoods [160].

4.3. A Tale of Two Emerald Cities and Beyond

A recent compilation of air pollution levels, health data, and simulations of excess cancer risk from air toxics documents that air pollution is on the rise in Seattle again, asthma hospitalization rates for Duwamish Valley residents are significantly higher than the county and city, and excess cancer risks were much higher in South Park and Georgetown census tracts [161]. Since its groundbreaking comprehensive plan for sustainability in 1994, the City of Seattle and its urban geography has underwent a significant, but skewed transformation. Our research illuminated how the Emerald City has fractured into two different urban development trajectories because of gentrification, an increasingly skewed riskscape, and inaction on the part of city officials. In an ironic moment of déjà vu on Earth Day 2015, Seattle’s newest mayor recently announced a “first-of-its-kind” equity and environment initiative [162]. Two months later, the mayor then signed an executive order to reorganize Seattle’s Department of Planning and Development into a new office of Planning and Community Development [163]. The move was spurred in part by a local study reporting that while the city has had some success in directing growth to designated urban villages, neighborhood investments had been uneven [164]. In July of this year, the mayor then announced the findings of the city’s Task Force on Housing Affordability. He was quoted saying “my vision is where the people who work in Seattle can afford to live in Seattle. Without this plan, people will continue to be forced to live outside this city. We will continue to have a city of economic apartheid” [165]. But until Seattle’s leaders recognize the connections between gentrification, zoning, affordable housing, and skewed air pollution exposures, the city’s economic stratification and environmental injustice will continue to tarnish the Emerald City’s brand of sustainability.

4.4. Integrating Quantitative and Qualitative Methods

Our mixed-method research design also provides an alternative approach to avoid the over simplistic presumptions behind the prominent approaches to examining environmental gentrification. National level and structural gentrification analyses using census tracts or larger scales of analysis result in too coarse of a resolution to capture significant spatial variations at the neighborhood level. Thus, it often provides little to no guidance for policy and planning strategies. Likewise, studies using individual level mobility data to assess gentrification are too granular. Both methods display an over commitment to either a structural model of gentrification processes or the pure agency of behavioral individualism. Our methods detailed here instead paint a picture of how micro-structural analysis can be used to screen for hot spots of both environmental risk sources and socially disruptive gentrification trends.
In sum, our study is more consistent with prior research concluding that the plans of city officials and real estate developers can contribute to industrial displacement that in turn often results in a cleaner environment for redevelopment areas. Such a dynamic is better illuminated with our combination of longitudinal geographic cluster analysis, relative-risk air pollution screening, and qualitative policy analysis. Our study reveals the risky business of Seattle’s complicated yet intersecting trajectories of environmental inequality, socioeconomic stratification, and planning blind spots. Similar mixed-method and historical studies assessing the equity dimensions of urban land development, land use conflicts, and skewed riskscapes will be a crucial addition to the much larger research task assessing urban sustainability.

5. Conclusions

While Seattle has been heralded for its leadership in sustainability, we join the growing number of voices that critically interrogate this reputation. A livability and gentrification conflict marked twenty years of Seattle’s neighborhood geography resulting in a city divided by class, and to a lesser extent, by race. This trajectory is characterized by a pattern of development clusters highly stratified by occupation, income and property values. In the broadest simplification, Seattle has divided between an affluent and highly educated postindustrial workforce centered on South Lake Union and encroaching on the city’s northern industrial zones. A concentration of mixed, and predominately intermediate industrial and service workforce are increasingly locating in south central Seattle. Finally, the remaining burdens of the city’s remaining industrial economy are being relegated to the Duwamish Valley. Parts of Seattle fared poorly in each of sustainability’s three dimensions. A more just sustainability for this Emerald City and other metropolitan regions will require more research like ours that can inform the political and policy attention needed to confront the trajectories of inequitable development and environmental injustice to mitigate obscured industrial land use conflicts.

Supplementary Files

Supplementary File 1

Acknowledgments

The research was supported by Western Washington University’s Research and Sponsored Programs, the Department of Environmental Studies graduate program, and the Peninsulas Program of Huxley College of the Environment. We also thank the librarians staffing the Seattle room of the Seattle Public Library, Western Washington University’s Elissa Mowry, John Wilkens, and the editor of this special issue, Yehua Dennis Wei.

Author Contributions

Troy D. Abel originated the study, prepared the relative risk screening exposure modeling, conducted the qualitative analysis, and led the writing of the article. Jonah White designed and conducted the factor and cluster analysis and contributed to the writing of the article. Stacy Clauson collected and analyzed permit data and contributed to the writing of the article.

Conflicts of Interest

The authors declare no conflict of interest.

References and Notes

  1. Seattle City Council. The City of Seattle Comprehensive Plan: Toward a Sustainable Seattle: A Plan for Managing Growth, 1994–2014; Seattle City Council: Seattle, WA, USA, 1994.
  2. Beatley, T. Sustainability in Planning: The Arc and Trajectory of a Movement, and New Directions for the Twenty-First-Century City. In Planning Ideas the Matter: Livability, Territoriality, Governance, and Reflective Practice; MIT Press: Cambridge, MA, USA, 2012; pp. 91–124. [Google Scholar]
  3. World Commission on Environment and Development. Our Common Future; Oxford University Press: Oxford, UK, 1987. [Google Scholar]
  4. Dobson, A. Justice and the Environment: Conceptions of Environmental Sustainability; Oxford University Press: New York, NY, USA, 1998. [Google Scholar]
  5. Dobson, A. Social Justice and Environmental Sustainability: Ne’er the Twain Shall Meet. In Just Sustainabilities: Development in An Unequal World; Julian Agyeman, R.D.B., Evans, B., Eds.; MIT Press: Cambridge, MA, USA, 2003. [Google Scholar]
  6. Agyeman, J. Sustainable Communities and the Challenge of Environmental Justice; New York University Press: New York, NY, USA, 2005. [Google Scholar]
  7. Connelly, S. Mapping sustainable development as a contested concept. Local Environ. 2007, 12, 259–278. [Google Scholar] [CrossRef]
  8. McManus, P. Contested terrains: Politics, stories and discourses of sustainability. Environ. Polit. 1996, 5, 48–73. [Google Scholar] [CrossRef]
  9. Williams, C.C.; Millington, A.C. The diverse and contested meanings of sustainable development. Geogr. J. 2004, 170, 99–104. [Google Scholar] [CrossRef]
  10. Campbell, S. Green Cities, Growing Cities, Just Cities? Urban Planning and the Contradictions of Sustainable Development. J. Am. Plan. Assoc. 1996, 62, 296–312. [Google Scholar] [CrossRef]
  11. Godschalk, D.R. Land Use Planning Challenges: Coping with Conflicts in Visions of Sustainable Development and Livable Communities. J. Am. Plan. Assoc. 2004, 70, 5–13. [Google Scholar] [CrossRef]
  12. AtKisson, A. Developing indicators of sustainable community: Lessons from sustainable Seattle. Environ. Impact Assess. Rev. 1996, 16, 337–350. [Google Scholar] [CrossRef]
  13. Karlenzig, W. What makes today’s green city? In Growing Greener Cities: Urban Sustainability in the Twenty-First Century; Birch, E., Wachter, S., Eds.; University of Pennsylvania Press: Philadelphia, PA, USA, 2008; pp. 346–363. [Google Scholar]
  14. Portney, K. Taking Sustainable Cities Seriously: Economic Development, the Environment, and Quality of Life in American Cities; MIT Press: Cambridge, MA, USA, 2003. [Google Scholar]
  15. Karlenzig, W. How Green is Your City? The Sustainlane US City Rankings; New Society Publishers: Gabriola Island, BC, USA, 2007. [Google Scholar]
  16. Krueger, R.; Agyeman, J. Sustainability schizophrenia or “actually existing sustainabilities?” toward a broader understanding of the politics and promise of local sustainability in the US. Geoforum 2005, 36, 410–417. [Google Scholar] [CrossRef]
  17. Berke, P.R.; Conroy, M.M. “Are We Planning for Sustainable Development: An Evaluation of 30 Comprehensive Plans”. J. Am. Plan. Assoc. 2000, 66, 21–33. [Google Scholar] [CrossRef]
  18. Sanders, J.C. Seattle and the Roots of Urban Sustainability: Inventing Ecotopia; University of Pittsburgh Press: Pittsburgh, PA, USA, 2010. [Google Scholar]
  19. Abel, T.D.; White, J. Skewed riskscapes and gentrified inequities: Environmental exposure disparities in Seattle, Washington. Am. J. Public Health 2011, 101, 246–254. [Google Scholar] [CrossRef] [PubMed]
  20. Abel, T.; White, J. Gentrified sustainability: Inequitable development and Seattle’s skewed riskscape. Interdiscip. Environ. Rev. 2015, 16, 124–157. [Google Scholar] [CrossRef]
  21. Dierwechter, Y. The Spaces That Smart Growth Makes: Sustainability, Segregation, and Residential Change across Greater Seattle. Urban Geogr. 2014, 35, 691–714. [Google Scholar] [CrossRef]
  22. Dooling, S. Ecological Gentrification: A Research Agenda Exploring Justice in the City. Int. J. Urban Reg. Res. 2009, 33, 621–639. [Google Scholar] [CrossRef]
  23. Klingle, M. Emerald City: An Environmental History of Seattle; Yale University Press: New Haven, CT, USA, 2008. [Google Scholar]
  24. Bullard, R. Solid Waste Sites and the Black Houston Community. Sociol. Inq. 1983, 53, 273–288. [Google Scholar] [CrossRef] [PubMed]
  25. United States Government Accounting Office (GAO). Siting of Hazardous Waste Landfills and Their Correlation with Racial and Economic Status of Surrounding Communities; United States Government Accounting Office: Washington, DC, USA, 1983.
  26. United Church of Christ (UCC). Commission for Racial Justice. In Toxic Wastes and Race in the United States; United Church of Christ: New York, NY, USA, 1987. [Google Scholar]
  27. Ringquist, E.J. Assessing Evidence of Environmental Inequities: A Meta-Analysis. J. Policy Anal. Manag. 2005, 24, 223–247. [Google Scholar] [CrossRef]
  28. Downey, L. Environmental racial inequality in Detroit. Soc. Forces 2006, 85, 771–796. [Google Scholar] [CrossRef] [PubMed]
  29. Su, J.G.; Morello-Frosch, R.; Jesdale, B.M.; Kyle, A.D.; Shamasunder, B.; Jerrett, M. An index for assessing demographic inequalities in cumulative environmental hazards with application to Los Angeles, California. Environ. Sci. Technol. 2009, 43, 7626–7634. [Google Scholar] [CrossRef] [PubMed]
  30. Sadd, J.L.; Pastor, M.; Morello-Frosch, R.; Scoggins, J.; Jesdale, B. Playing it safe: Assessing cumulative impact and social vulnerability through an environmental justice screening method in the south coast air basin, California. Int. J. Environ. Res. Public Health 2011, 8, 1441–1459. [Google Scholar] [CrossRef] [PubMed]
  31. Marshall, J.D. Environmental inequality: Air pollution exposures in California’s South Coast Air Basin. Atmos. Environ. 2008, 42, 5499–5503. [Google Scholar] [CrossRef]
  32. Sze, J. Noxious New York: The Racial Politics of Urban Health and Environmental Justice; MIT Press: Cambridge, MA, USA, 2007. [Google Scholar]
  33. Elliott, J.R.; Frickel, S. The Historical Nature of Cities: A Study of Urbanization and Hazardous Waste Accumulation. Am. Sociol. Rev. 2013, 78, 521–543. [Google Scholar] [CrossRef]
  34. Abel, T.D. Skewed riskscapes and environmental injustice: A case study of metropolitan St. Louis. Environ. Manag. 2008, 42, 232–248. [Google Scholar] [CrossRef] [PubMed]
  35. Chakraborty, J.; Bosman, M.M. (Eds.) Spatial and Environmental Injustice in an American Metropolis: A Study of Tampa Bay, Florida; Cambria Press: Amherst, MA, USA, 2010.
  36. Pellow, D.N. Environmental inequality formation toward a theory of environmental injustice. Am. Behav. Sci. 2000, 43, 581–601. [Google Scholar] [CrossRef]
  37. Been, V. Locally undesirable land uses in minority neighborhoods: Disproportionate siting or market dynamics? Yale Law J. 1994, 103, 1383–1422. [Google Scholar] [CrossRef]
  38. Been, V.; Gupta, F. Coming to the Nuisance or Going to the Barrios-A Longitudinal Analysis of Environmental Justice Claims. Ecol. Law Q. 1997, 24, 1–56. [Google Scholar]
  39. Oakes, J.M.; Anderton, D.L.; Anderson, A.B. A longitudinal analysis of environmental equity in communities with hazardous waste facilities. Soc. Sci. Res. 1996, 25, 125–148. [Google Scholar] [CrossRef]
  40. Yandle, T.; Burton, D. Reexamining environmental justice: A statistical analysis of historical hazardous waste landfill siting patterns in metropolitan Texas. Soc. Sci. Q. 1996, 77, 477–492. [Google Scholar]
  41. Crowder, K.; Downey, L. Inter-neighborhood migration, race, and environmental hazards: Modeling micro-level processes of environmental inequality. Am. J. Sociol. 2010, 115, 1110–1149. [Google Scholar] [CrossRef] [PubMed]
  42. Pais, J.; Crowder, K.; Downey, L. Unequal Trajectories: Racial and Class Differences in Residential Exposure to Industrial Hazard. Soc. Forces 2013, 92, 1189–1215. [Google Scholar] [CrossRef] [PubMed]
  43. Pastor, M.; Sadd, J.; Hipp, J. Which Came First? Toxic Facilities, Minority Move-in, and Environmental Justice. J. Urban Aff. 2001, 23, 1–21. [Google Scholar] [CrossRef]
  44. Hamilton, J.T. Testing for environmental racism: Prejudice, profits, political power? J. Policy Anal. Manag. 1995, 14, 107–132. [Google Scholar] [CrossRef]
  45. National Academy of Public Administration (NAPA). Addressing Community Concerns: How Environmental Justice Relates to Land Use Planning and Zoning; NAPA: Washington, DC, USA, 2003. [Google Scholar]
  46. National Environmental Justice Advisory Council (NEJAC). Unintended Impacts of Redevelopment and Revitalization Efforts in Five Environmental Justice Communities; NEJAC: Washington, DC, USA, 2006.
  47. Cameron, T.A.; McConnaha, I.T. Evidence of environmental migration. Land Econ. 2006, 82, 273–290. [Google Scholar] [CrossRef]
  48. Quastel, N. Political ecologies of gentrification. Urban Geogr. 2009, 30, 694–725. [Google Scholar] [CrossRef]
  49. Dale, A.; Newman, L.L. Sustainable development for some: Green urban development and affordability. Local Environ. 2009, 14, 669–681. [Google Scholar] [CrossRef]
  50. Checker, M. Wiped out by the “greenwave”: Environmental gentrification and the paradoxical politics of urban sustainability. City Soc. 2011, 23, 210–229. [Google Scholar] [CrossRef]
  51. Eckerd, A. Cleaning up without clearing out? A spatial assessment of environmental gentrification. Urban Aff. Rev. 2011, 47, 31–59. [Google Scholar] [CrossRef]
  52. Gamper-Rabindran, S.; Timmins, C. Hazardous waste cleanup, neighborhood gentrification, and environmental justice: Evidence from restricted access census block data. Am. Econ. Rev. 2011, 101, 620–624. [Google Scholar] [CrossRef]
  53. Pearsall, H. Moving out or moving in? Resilience to environmental gentrification in New York City. Local Environ. 2012, 17, 1013–1026. [Google Scholar] [CrossRef]
  54. Wolch, J.R.; Byrne, J.; Newell, J.P. Urban green space, public health, and environmental justice: The challenge of making cities “just green enough”. Landsc. Urban Plan. 2014, 125, 234–244. [Google Scholar] [CrossRef]
  55. Goodling, E.; Green, J.; McClintock, N. Uneven development of the sustainable city: Shifting capital in Portland, Oregon. Urban Geogr. 2015, 36, 504–527. [Google Scholar] [CrossRef]
  56. Banzhaf, S.H.; Walsh, R.P. Do People Vote with Their Feet? An Empirical Test of Environmental Gentrification; Resources for the Future: Washington, DC, USA, 2006. [Google Scholar]
  57. Ley, D.; Dobson, C. Are there limits to gentrification? The contexts of impeded gentrification in Vancouver. Urban Stud. 2008, 45, 2471–2498. [Google Scholar] [CrossRef]
  58. Glass, R. Introduction: Aspects of Change. In London: Aspects of Change; Glass, R., Ed.; MacKibbon and Kee: London, UK, 1964. [Google Scholar]
  59. Hamnett, C. The blind men and the elephant: The explanation of gentrification. Trans. Inst. Br. Geogr. 1991, 16, 173–189. [Google Scholar] [CrossRef]
  60. Smith, N. Toward a theory of gentrification: A back to the city movement by capital, not people. J. Am. Plan. Assoc. 1979, 45, 538–548. [Google Scholar] [CrossRef]
  61. Smith, N. Gentrification. In The Dictionary of Human Geography, 4th ed.; Johnston, R.J., Gregory, D., Pratt, G., Watts, M., Eds.; Blackwell: Oxford, UK, 2000. [Google Scholar]
  62. Ley, D. The New Middle Class and the Remaking of the Central City; Oxford University Press: Oxford, UK, 1996. [Google Scholar]
  63. Bell, D. The Coming of the Post-Industrial Society; Basic Books: New York, NY, USA, 1973. [Google Scholar]
  64. Ley, D. Liberal ideology and the postindustrial city. Ann. Assoc. Am. Geogr. 1980, 70, 238–258. [Google Scholar] [CrossRef]
  65. Ley, D. Alternative explanations for inner-city gentrification: A Canadian assessment. Ann. Assoc. Am. Geogr. 1986, 76, 521–535. [Google Scholar] [CrossRef]
  66. Curran, W.; Hamilton, T. Just green enough: Contesting environmental gentrification in Greenpoint, Brooklyn. Local Environ. 2012, 17, 1027–1042. [Google Scholar] [CrossRef]
  67. Curran, W. Gentrification and the nature of work: Exploring the links in Williamsburg, Brooklyn. Environ. Plan. A 2004, 36, 1243–1258. [Google Scholar] [CrossRef]
  68. Curran, W.; Hanson, S. Getting globalized: Urban policy and industrial displacement in Williamsburg, Brooklyn. Urban Geogr. 2005, 266, 461–482. [Google Scholar] [CrossRef]
  69. Curran, W. “From the Frying Pan to the Oven”: Gentrification and the Experience of Industrial Displacement in Williamsburg, Brooklyn. Urban Stud. 2007, 44, 1427–1440. [Google Scholar] [CrossRef]
  70. O’Sullivan, D. Toward micro-scale spatial modeling of gentrification. J. Geogr. Syst. 2002, 4, 251–274. [Google Scholar] [CrossRef]
  71. Hwang, J. Gentrification in changing cities: Immigration, new diversity, and racial inequality in neighborhood renewal. Ann. Am. Acad. Polit. Soc. Sci. 2015, 660, 319–340. [Google Scholar] [CrossRef]
  72. Lees, L.; Slater, T.; Wyly, E.K. Gentrification; Routledge/Taylor & Francis Group: New York, NY, USA, 2008. [Google Scholar]
  73. Lees, L. Super-gentrification: The case of Brooklyn heights, New York City. Urban Stud. 2003, 40, 2487–2509. [Google Scholar] [CrossRef]
  74. Ley, D. Artists, aestheticisation and the field of gentrification. Urban Stud. 2003, 40, 2527–2544. [Google Scholar] [CrossRef]
  75. Smith, N.; DeFilippis, J. The reassertion of economics: 1990s gentrification in the Lower East Side. Int. J. Urban Reg. Res. 1999, 23, 638–653. [Google Scholar] [CrossRef]
  76. Cohen, A. Home, wage gap widens. Seattle Post Intelligencer, 11 September 2007. [Google Scholar]
  77. McGee, H.W. Seattle’s Central District, 1990—2006: Integration or Displacement? Urban Lawyer 2007, 39, 167–256. [Google Scholar]
  78. Rhodes, E.; Mayo, J. Only 9 areas in King County left for middle-income buyers. Seattle Times, 16 July 2006; A1. [Google Scholar]
  79. Westneat, D. Growth Gone Wild? Website Map Pins it down. Available online: http://www.seattletimes.com/seattle-news/growth-gone-wild-website-map-pins-it-down (accessed on 5 April 2015).
  80. Balk, G. Priced out? Growing Numbers Appear to Be Fleeing King County. Available online: http://www.seattletimes.com/seattle-news/data/priced-out-has-the-king-county-diaspora-begun (accessed on 5 April 2015).
  81. Bernard, S. In Georgetown, the Housing Is Affordable and the Air Unbreathable. Seattle Weekly. Available online: http://www.seattleweekly.com/home/960984-129/in-georgetown-the-housing-is-affordable (accessed on 24 October 2015).
  82. Florida, R. The Rise of the Creative Class—Revisited: Revised and Expanded; Basic books: New York, NY, USA, 2012. [Google Scholar]
  83. Florida, R.; Matheson, Z.; Adler, P.; Brydges, T. The Divided City and the Shape of the New Metropolis; Martin Prosperity Institute, Rotman School of Management, University of Toronto: Toronto, ON, Canada, 2014. [Google Scholar]
  84. Yin, R.K. Case Study Research: Design and Methods, Applied Social Research Methods Series, 3rd ed.; Sage Publications: Thousand Oaks, CA, USA, 2002; Volume 5. [Google Scholar]
  85. Muro, M.; Rothwell, J.; Andes, S.; Fikri, K.; Kulkarni, S. America’s Advanced Industries: What Are They, Where They Are, and Why They Matter. Available online: http://www.brookings.edu/~/media/Research/Files/Reports/2015/02/03-advanced-industries/final/AdvancedIndustry_FinalFeb2lores.pdf?la=en (accessed on 30 August 2015).
  86. Brookings Institute; JP Morgan Chase. The 10 Traits of Globally Fluent Metro Areas. Available online: http://www.brookings.edu/~/media/Multimedia/Interactives/2013/tentraits/Seattle.pdf (accessed on 30 August 2015).
  87. Seattle Jobs Initiative. Understanding King County’s Manufacturing Sector: Preparing Our Workforce for Good Job Opportunities. Available online: http://www.seattlejobsinitiative.com/wp-content/uploads/SJI_ManufacturingReport_vFINAL.pdf (accessed on 12 September 2015).
  88. Balk, G. Census: Seattle Is the Fastest-Growing Big City in the U.S. Available online: http://blogs.seattletimes.com/fyi-guy/2014/05/22/census-seattle-is-the-fastest-growing-big-city-in-the-u-s/ (accessed on 12 September 2015).
  89. Dierwechter, Y. Urban Growth Management and Its Discontents; Palgrave Macmillan: New York, NY, USA, 2008. [Google Scholar]
  90. Steinbrueck, P.; Winter, M.; Patterson, M.; Williamson, S.; Barbe, D.; Greaney, Y. Seattle Sustainable Neighbourhoods Assessment Project. Available online: http://www.seattle.gov/dpd/cs/groups/pan/@pan/documents/web_informational/p2233677.pdf (accessed on 15 September 2015).
  91. Seattle Department of Planning and Development. South Lake Union Urban Center Neighborhood Plan. Available online: http://www.seattle.gov/dpd/cs/groups/pan/@pan/documents/web_informational/dpds021899.pdf (accessed on 15 September 2015).
  92. City of Seattle Department of Planning and Development (SDPD). Urban Center/Village Employment Growth Report. Available online: http://www.seattle.gov/dPd/cs/groups/pan/@pan/documents/web_informational/dpds022046.pdf (accessed on 15 September 2015).
  93. City of Seattle Department of Planning and Development (SDPD). Seattle’s Industrial Lands Background Report; City of Seattle: Seattle, WA, USA, 2007.
  94. City of Seattle Department of Planning and Development (SDPD). Toward a Sustainable Seattle: A Plan for Managing Growth 2004–2024; City of Seattle: Seattle, WA, USA, 2005.
  95. Expedia’s move likely to prompt changes to Seattle Interbay and Bellevue. Available online: http://www.kirotv.com/news/news/expedias-move-likely-prompt-changes-seattle-interb/nkmCX/ (accessed on 8 July 2015).
  96. All Eyes On Interbay As Expedia Plans Move. Available online: http://blog.seattlepi.com/seattlerealestate/2015/04/15/all-eyes-on-interbay-as-expedia-plans-move/ (accessed on 8 July 2015).
  97. Seattle Department of Planning and Development. Envisioning Ballard to Interbay-What & Why 2015. Available online: http://www.seattle.gov/dpd/cityplanning/completeprojectslist/ballardinterbay/whatwhy/ (accessed on 31 August 2015).
  98. Puget Sound Regional Council. 2013 Regional Centers Monitoring Report: Ballard-Interbay MIC. Available online: http://www.psrc.org/assets/265/mic-profile-Seattle-Ballard-Interbay.pdf (accessed on 12 September 2015).
  99. Puget Sound Regional Council. 2013 Regional Centers Monitoring Report: Duwamish MIC. Available online: http://www.psrc.org/assets/270/mic-profile-Seattle-Duwamish.pdf (accessed on 12 September 2015).
  100. GeoLytics. CensusCD 1990 Long Form in 2000 Boundaries; GeoLytics: East Brunswick, NJ, USA, 2008. [Google Scholar]
  101. Dunteman, G.H. Principal Components Analysis; Sage: Newbury Park, CA, USA, 1989. [Google Scholar]
  102. Aldenderfer, M.S.; Blashfield, R.K. Cluster Analysis; Sage Publications: Beverly Hills, CA, USA, 1984. [Google Scholar]
  103. Lattin, J.M.; Carroll, J.D.; Green, P.E. Analyzing Multivariate Data; Thomson Brooks/Cole: Pacific Grove, CA, USA, 2003. [Google Scholar]
  104. Manufacturing facilities are required to report the release of any toxic chemical into the environment with EPA’s TRI program if (1) it is in the manufacturing, metal mining, coal mining, electrical utilities, hazardous waste treatment and disposal facilities, chemical plants, petroleum plants and terminals, solvent recovery services, or federal facilities industrial sectors; (2) has 10 or more full-time employees; and (3) manufactures or processes more than 25,000 pounds or otherwise uses more than 10,000 pounds of any listed chemical during the calendar year. Using self-reported TRI air release estimates, RSEI simulates a steady-state Gaussian plume of downwind pollutant concentrations from both stack and fugitive emission levels. RSEI than estimates a surrogate inhalation dose for neighboring census populations and produces a unit-less indicator value that can be used to rank relative impacts by geography, industry, and facility. See Risk-Screening Environmental Indicators (RSEI). Available online: www.epa.gov/oppt/rsei (accessed on 8 July 2015). and Schmidt, Charles W. The risk where you live. Environ. Health Perspect. 2003, 111, A404. [Google Scholar]
  105. The BRS is another EPA information disclosure program that requires Large-Quantity Generators (LQGs) to report their hazardous waste generation if they manage at least 1000 kilograms monthly. See United States Environmental Protection Agency (EPA). Biennial Report: Reportable and Non-Reportable Wastes; Office of Resource Conservation and Recovery: Washington, DC, USA, 2013.
  106. Atlas, M. Few and far between? An environmental equity analysis of the geographic distribution of hazardous waste generation. Soc. Sci. Q. 2002, 83, 365–378. [Google Scholar] [CrossRef]
  107. City of Seattle Department of Planning and Development (SDPD). Duwamish M/IC Policy and Land Use Study; City of Seattle: Seattle, WA, USA, 2013.
  108. City of Seattle Planning Department. Two Case Studies of the Spatial Relationship between Environmental Risks and Population Groups in Seattle; City of Seattle: Seattle, WA, USA, 1993.
  109. City of Seattle Department of Planning and Development (SDPD). Growth and Equity: Analyzing Impacts on Displacement and Opportunity Related to Seattle’s Growth Strategy; City of Seattle: Seattle, WA, USA, 2015.
  110. Land Use Permits. Available online: https://data.seattle.gov/Permitting/Land-Use-Permits/uyyd-8gak (accessed on 6 July 2015).
  111. Building Permits: Current. Available online: https://data.seattle.gov/Permitting/Building-Permits-Current/mags-97de (accessed on 6 July 2015).
  112. Kennedy, M.; Leonard, P. Dealing with Neighborhood Change: A Primer on Gentrification and Policy Choices; Brookings Institution Center on Urban and Metropolitan Policy and PolicyLink: Washington, DC, USA, 2001. [Google Scholar]
  113. Blackwell, A.G. Promoting equitable development. Indiana Law Rev. 2000, 34, 1273–1290. [Google Scholar]
  114. Morrill, R. Gentrification, Class, and Growth Management in Seattle, 1990–2000. In Global Perspectives on Urbanization; Pomeroy, G., Webster, G., Eds.; University Press of America: Lanham, MD, USA, 2008. [Google Scholar]
  115. United States Environmental Protection Agency (EPA). Reducing Risk: Setting Priorities and Strategies for Environmental Protection; Science Advisory Board: Washington, DC, USA, 1990.
  116. City of Seattle. Environmental Risks in Seattle: A Comparative Assessment; Office for Long-range Planning: Seattle, WA, USA, 1991.
  117. United Nations Centre for Human Settlements (HABITAT). Implementing the Urban Environmental Agenda; United Nations Environment Programme: Nairobi, Kenya, 1997.
  118. City of Seattle. Mayor’s Recommended Environmental Action Agenda: Environmental Stewardship in Seattle; Planning Department: Seattle, WA, USA, 1992.
  119. Davies, J.C. Comparing Environmental Risks: Tools for Setting Government Priorities; Routledge: London, UK, 1996. [Google Scholar]
  120. City of Seattle. Seattle’s Comprehensive Plan toward a Sustainable Seattle: A Plan for Managing Growth 1994–2014; Strategic Planning Office: Seattle, WA, USA, 1994.
  121. Lilly, D. Rice’s Idea for Urban Growth Draws Praise. Seattle Times, 20 March 1992; C1. [Google Scholar]
  122. Kokmen, L. Plot Thickens as Fred Meyer seeks to Build Store—An Industrial vs. Retail Saga. Seattle Times, 8 April 1996; E1. [Google Scholar]
  123. Stubbs, D. Fred Meyer Finally Comes to Ballard—Store Opening Closes Years of Controversy. Seattle Times, 10 November 1999; E5. [Google Scholar]
  124. Kraft, G. Commons Property is Better Site for Immunex Development. Seattle Times, 3 February 1996; A13. [Google Scholar]
  125. Solomon, C. Change is Coming to North Waterfront—but Slowly—Zoning is an Obstacle. Seattle Times, 13 December 1996; D1. [Google Scholar]
  126. Vinluan, F. Study eyes options at terminal if fisherman vacate some space. Seattle Times, 8 February 2002; C1. [Google Scholar]
  127. McOmber, J.M. Tenants on Lake Getting the Boot—Makeover in Works for Wallingford Waterfront. Seattle Times, 3 August 2002; C1. [Google Scholar]
  128. McOmber, J.M. Port’s Big Plans for Terminal 91–82 Acres of Prized but Unused Land Eyed for Immense New Development. Seattle Times, 11 October 2003; A1. [Google Scholar]
  129. Young, B.; Scott, A. City Council Says No to Housing on Seattle Port’s North Bay Tract. Seattle Times, 3 May 2005; B5. [Google Scholar]
  130. Boyer, T. Working Waterfront Losing a Mainstay. Seattle Times, 25 June 2005; A1. [Google Scholar]
  131. Boyer, T. North Bay Plan is Ok’d by Port—Multiple Uses Development Proposal Faces Obstacles. Seattle Times, 29 June 2005; E1. [Google Scholar]
  132. Lane, P. High-tech, Retail Complex Proposed—Development Linking Waterfront, Sports Arenas would require a Change from Industrial Zoning. Seattle Times, 18 February 2000; D1. [Google Scholar]
  133. Seven, R. How goes Sodo?—Beyond the Trucks and Trains, It’s a Work in Progress. Seattle Times, 19 October 2003; 18. [Google Scholar]
  134. McOmber, J.M. Cargo or Condos? The Future of Terminal 46. Seattle Times, 4 April 2004; E1. [Google Scholar]
  135. Stockton, P. Heralding the New Seattle—Is Blue-Collar going Extinct? Creeping Gentrification has South Park, Georgetown, and Sodo Residents Wondering if they’re the Next Fremont. Seattle Times, 1 October 2000; L1. [Google Scholar]
  136. Stockton, P. Long Ordeal Ends with Company Leaving. Seattle Times, 10 August 2002; A1. [Google Scholar]
  137. Bjorhus, J. Allen Raises Rents, Dander, Suspicions—Technology Corridor South of Lake Union? Seattle Times, 4 April 1997; B1. [Google Scholar]
  138. Editorial. Beware Taller Buildings near South Lake Union. Seattle Times. 20 December 2000, p. B6. Available online: http://0-search-proquest-com.brum.beds.ac.uk/docview/383345652?accountid=15006 (accessed on 13 July 2015).
  139. Editorial. A New South Lake Union, warts and all. Seattle Times. 18 June 2001, p. B4. Available online: http://0-search-proquest-com.brum.beds.ac.uk/docview/383319082?accountid=15006 (accessed on 13 July 2015).
  140. McOmber, J.M.; Young, B. Paul Allen’s Makeover offers High Risks, Huge Payoffs. Seattle Times, 27 April 2003; A1. [Google Scholar]
  141. Young, B. Compton: Free Trip on Allen Jet may have Left “Unfortunate Impression”—Disclosure Comes as Council Takes Up Developer’s Lake Union Plans. Seattle Times, 27 August 2003; A1. [Google Scholar]
  142. Young, B. Panel Oks Taller Buildings for Biotechs at S. Lake Union. Seattle Times, 4 December 2003; B1. [Google Scholar]
  143. Young, B. Coalition Gives up on Vulcan Talks—South Lake Union Development. Seattle Times, 9 March 2005; B2. [Google Scholar]
  144. Editorial. Hold Fast on Zoning for Industrial Uses. Seattle Times, 20 March 2000; B4. [Google Scholar]
  145. Conlin, R. So Long to Blue-Collar Zone?—New City Plan Leaves Ample Room for Offices and Other Development in Once-Industrial Stadium Area. Seattle Times, 5 May 2000; A1. [Google Scholar]
  146. Atkinson, R.D.; Gottlieb, P.D. The Metropolitan New Economy Index; Progressive Policy Institute and Center for Regional Economic Issues: Washington, DC, USA, 2001. [Google Scholar]
  147. Moretti, E. The New Geography of Jobs; Houghton Mifflin Harcourt: New York, NY, USA, 2012. [Google Scholar]
  148. United States Census. American Fact Finder. Available online: http://factfinder.census.gov/ (accessed on 28 July 2014).
  149. United States Environmental Protection Agency (EPA). Approval and Promulgation of Implementation Plans and Designation of Areas for Air Quality Planning Purposes: Washington. Fed. Regist. 2001, 66, 14492–14500. [Google Scholar]
  150. Ortega, B. Paying the Price for Cleaner Air—Drivers Expected to Foot the Bill. Seattle Times, 21 November 1991; B1. [Google Scholar]
  151. Pryne, E. South Park—We’re Seattle’s Dumping Ground. Seattle Times, 24 February 1994; A1. [Google Scholar]
  152. Priyne, E. The Search for Environmental Justice—Tackling a Toxic Issue. Seattle Times, 24 February 1994; A1. [Google Scholar]
  153. City of Seattle. Environmental Justice Task Force Report; Mayor’s Office: Seattle, WA, USA, 1996.
  154. Warner, K. Linking local sustainability initiatives with environmental justice. Local Environ. 2002, 7, 35–47. [Google Scholar] [CrossRef]
  155. Seattle King County Department of Public Health. Hospitalization Rates for Respiratory Diseases by Age; Seattle King County Department of Public Health: Seattle, WA, USA, 1997.
  156. Community Coalition for Environmental Justice. Global Struggles Local Struggles: Indigenous People, People of Color and the Working Class in Washington State and Beyond Fight for Social and Environmental Justice; Community Coalition for Environmental Justice: Seattle, WA, USA, 2001. [Google Scholar]
  157. Keill, L.; Maykut, N. Puget Sound Air Toxics Evaluation; Puget Sound Clean Air Agency (PSCAA): Seattle, WA, USA, 2002. [Google Scholar]
  158. Yost, M.; Gilroy, M.; Strange, K.H. Tacoma and Seattle Area Air Toxics Evaluation; Puget Sound Clean Air Agency (PSCAA): Seattle, WA, USA, 2010. [Google Scholar]
  159. Wu, C.; Liu, L.J.S.; Cullen, A.; Westberg, H. Williamson, John. Spatial–Temporal and cancer risk assessment of selected hazardous air pollutants in Seattle. Environ. Int. 2011, 37, 11–17. [Google Scholar] [PubMed]
  160. United States Environmental Protection Agency Newsroom. EPA Awards 2014 Environmental Justice Collaborative Problem-Solving Cooperative Agreements. Available online: http://yosemite.epa.gov/opa/admpress.nsf/8b770facf5edf6f185257359003fb69e/d4e4de8dbee4ef5585257d5500485609!OpenDocument (accessed on 16 September 2014).
  161. Clauson, S.; Abel, T.D. A Tale of Two Emerald Cities: Environmental Inequality Formation and Participatory Geography in Action. In Proceeding of the Annual Meeting of the Association of American Geographers, Chicago, IL, USA, 21–25 April 2015.
  162. City of Seattle. Mayor Murray Launches First-Of-Its-Kind Equity and Environment Initiative. Available online: http://murray.seattle.gov/mayor-murray-launches-first-of-its-kind-equity-environment-initiative/#sthash.2LlW8hCz.5rMKORLF.dpbs (accessed on 16 July 2015).
  163. Beekman, D. New City Office would Oversee Growth, Quality-of-Life Issues. Seattle Times, 24 June 2015; B1. [Google Scholar]
  164. Beekman, D. A Mixed Report on City’s “Urban Villages”. Seattle Times, 30 January 2015; B1. [Google Scholar]
  165. Beekman, D. Mayor: Build Affordable Housing or Pay Fees. Seattle Times, 14 July 2015; B1. [Google Scholar]

