Article

Development of a High Performance PES Ultrafiltration Hollow Fiber Membrane for Oily Wastewater Treatment Using Response Surface Methodology

Faculty of Mechanical Engineering, Universiti Teknologi Malaysia, Skudai 81310, Malaysia
*
Author to whom correspondence should be addressed.
Sustainability 2015, 7(12), 16465-16482; https://0-doi-org.brum.beds.ac.uk/10.3390/su71215826
Submission received: 17 October 2015 / Revised: 2 December 2015 / Accepted: 8 December 2015 / Published: 11 December 2015
(This article belongs to the Section Sustainable Engineering and Science)

Abstract

:
This study attempts to optimize the spinning process used for fabricating hollow fiber membranes using the response surface methodology (RSM). The spinning factors considered for the experimental design are the dope extrusion rate (DER), air gap length (AGL), coagulation bath temperature (CBT), bore fluid ratio (BFR), and post-treatment time (PT) whilst the response investigated is rejection. The optimal spinning conditions promising the high rejection performance of polyethersulfone (PES) ultrafiltration hollow fiber membranes for oily wastewater treatment are at the dope extrusion rate of 2.13 cm3/min, air gap length of 0 cm, coagulation bath temperature of 30 °C, and bore fluid ratio (NMP/H2O) of 0.01/99.99 wt %. This study will ultimately enable the membrane fabricators to produce high-performance membranes that contribute towards the availability of a more sustainable water supply system.

Graphical Abstract

1. Introduction

Water is an important element in life. Oceans are providing 97.5% water for our planet but only 1% is reachable for consumption. Currently, the world is undergoing a critical water quality crisis because of the increasing number of populations, poor practices of industrialization and urbanization, as well as the uncontrollable discharge of polluted and harmful water [1]. It is obvious that freshwater and oceanic ecosystems across the earth are gradually endangered and polluted. Thus, it is strongly agreed that future water demand cannot be fulfilled unless wastewater management is restructured. As an important resource for life, sustainable development, and good ecosystems, water is a very important agenda for research and technological evolution programs. As we know, inadequacy of wastewater management gives a direct influence on the biological diversity of ecosystems, disturbing the basic principle of our life support systems. In other words, lack of infrastructure and good management plan to handle the rising capacity of wastewater generated are the main problem of the water crisis. One of the most important central roles of wastewater management in sustainable development is to increase the reuse potential of wastewater as water is becoming scarce and polluted day by day [2]. Therefore, cheap and reliable treatment methods are needed so that water could be safely used and dangerous contaminants of heavy metals and harmful microbes in wastewater could be removed up to a safer level. To overcome this issue, membrane separation has become a well-known technique for wastewater reuse applications, because it is capable of clearing away complex particles of dissolved and particulate contaminants in wastewater especially for treating oily wastewater [3,4,5,6].
Nowadays, the development of asymmetric membranes for ultrafiltration has attracted much attention and support from both the academia and industry, considering their business potentials and benefits. In common, a dry/wet spinning technique of a phase inversion process is commonly used to fabricate hollow fiber membranes, which possess an asymmetric structure. During the dry/wet spinning process, several spinning conditions will influence the hollow fiber membranes’ properties such as structures, dimensions, and separation performances. In order to explore the relationship between membrane properties and spinning conditions, a lot of studies have been done [7,8]. For the past few years, spinning conditions have been recognized as the controlling factors for the preparation of superior performance asymmetric hollow fiber membranes. To date, many studies have been performed to explore the effects of the concentration of dope solution, air gap length, dope extrusion rate, and bore fluid ratio on the hollow fiber membranes’ properties and performances. For example, Chung and Hu [9] discovered that by increasing the air gap length, the flux of polyethersulfone (PES) hollow fiber membranes is decreased. Chung et al. [10] reported that PES ultrafiltration hollow fiber membranes prepared at various dope extrusion rates, possess different selectivity and permeability for both gas and liquid filtration processes. However, not much has been said regarding the collective effect of dope extrusion rate, air gap length, coagulation bath temperature, bore fluid ratio, and post-treatment time on the performance of PES ultrafiltration hollow fiber membranes.
In applying spinning system technology to fabricate PES hollow fiber membranes, the relevant operating parameters have an important impact on their performance and are, therefore, worth further exploration. As we realize, in enhancing the performance of membranes, the optimization of the spinning conditions is a very critical matter. Finding an optimal solution by using an appropriate optimization method is quite challenging for researchers. Moreover, complexities in the spinning process have increased where the interaction effects between the spinning conditions also contribute to finding the optimal spinning conditions. It should be mentioned that from previous studies in solving these spinning condition optimization problems, they were handled mostly by using a conventional technique of experimentation that varied one of the independent spinning conditions and fixed the others. From previous studies, there are many researchers who have used the parameter-by-parameter optimization method based on trial and error tests to optimize the spinning conditions in fabricating hollow fiber membranes. The complexity of membrane preparation problems as numerous parameters are involved is one of the main reasons why very little work has been done to vary all these parameters simultaneously [11,12]. Chung et al. [11,13], Ismail et al. [14], and Qin et al. [15] varied the dope extrusion rate factor only and fixed other factors in fabricating PES ultrafiltration hollow fiber membranes. Likewise, Kapantaidakis et al. [16], Khayet [17] and Qin et al. [18] varied the air gap length only and fixed other factors during membrane fabrication. Additionally, there are several researchers who varied two or more factors of these spinning conditions by using the parameter-by-parameter optimization technique [9,16]. Apparently, the drawbacks of this method are that it needs a lot of experimental work and time, does not consider any interaction between the spinning conditions during the spinning process, and has a lower capability in optimization. Thus, it requires tremendous effort to obtain the optimum spinning conditions. Even though the traditional orthogonal technique has the ability of considering several parameters at the same time, it still cannot acquire the relationship equation that links the spinning parameters with the outcomes, and it is not easy to discover the optimal spinning parameter values and optimal response value. Furthermore, many kinds of defects usually happen on the outer layer of the membranes due to discontinuous spinning process, and the common problem is the preparation of hollow fiber membranes cannot be performed effectively because of the inappropriate settings of the spinning conditions. In general, most researchers are seeking for the appropriate settings using a small number of experiments by keeping all conditions fixed and only varying one condition in a small range as it is practical to be performed [19].
These shortcomings of the parameter-by-parameter optimization technique can be solved via a response surface methodology (RSM), which consists of a design of experiments (DOE). By using this technique, all parameters are explored simultaneously via a set of experimental runs. Generally, RSM is a group of statistical and mathematical approaches that can be used for exploring processes, as well as for identifying and calculating the relative significance of a few affecting parameters even when complex interactions have appeared, which at last will improve and optimize the process investigated [20]. The basics of statistical design such as DOE, regression modeling techniques and optimization approaches are necessary to develop a proper response surface model. These basic parts are normally grouped into RSM. Thus, RSM provides a lot of benefits compared to the regularly-applied conventional technique. RSM is faster, reliable, and more informative, and it minimizes the total number of experimental runs enormously which contributes to speeding up experimental work and reducing expenses. Furthermore, it has been successfully used in many fields, such as biotechnology, biology, medical, chemical engineering, and many more. Thus, this study focused on the RSM approach to optimize the spinning conditions in the development of PES ultrafiltration hollow fiber membranes. The Design-Expert Version 6.0.5 software was utilized for the experimental design, regression analysis of experimental data and prediction of coefficients of the regression equation. The spinning conditions investigated were the dope extrusion rate, air gap length, coagulation bath temperature, bore fluid ratio, and post-treatment time. Main effects and interaction effects of these spinning conditions on the rejection performance of PES hollow fiber membranes were explored.

2. Experimental Procedures

2.1. Materials

Polyethersulfone (PES) pellets, bought from Solvay Advanced Polymers, were used as the main membrane forming materials. N-methyl-2-pyrrolidone (NMP), bought from Merck in Darmstadt, Germany, was utilized as a solvent in order to dissolve the PES without additional purification. Fluka in Milwaukee has provided the polyethylene glycol (PEG 400) and it was used as an additive to enhance the properties of PES membranes. Cutting oil purchased from Ridge Tool Company (RIDGID), was utilized to synthesize oily wastewater with different concentrations of oily solutions.

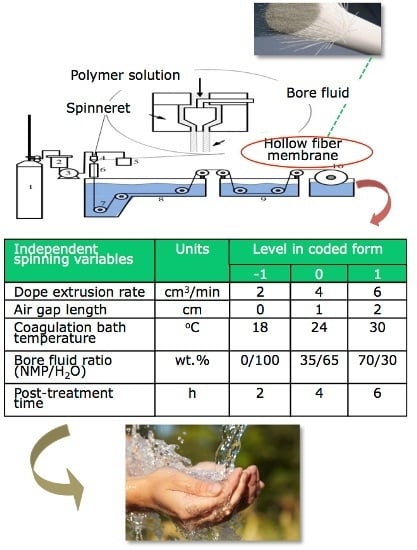
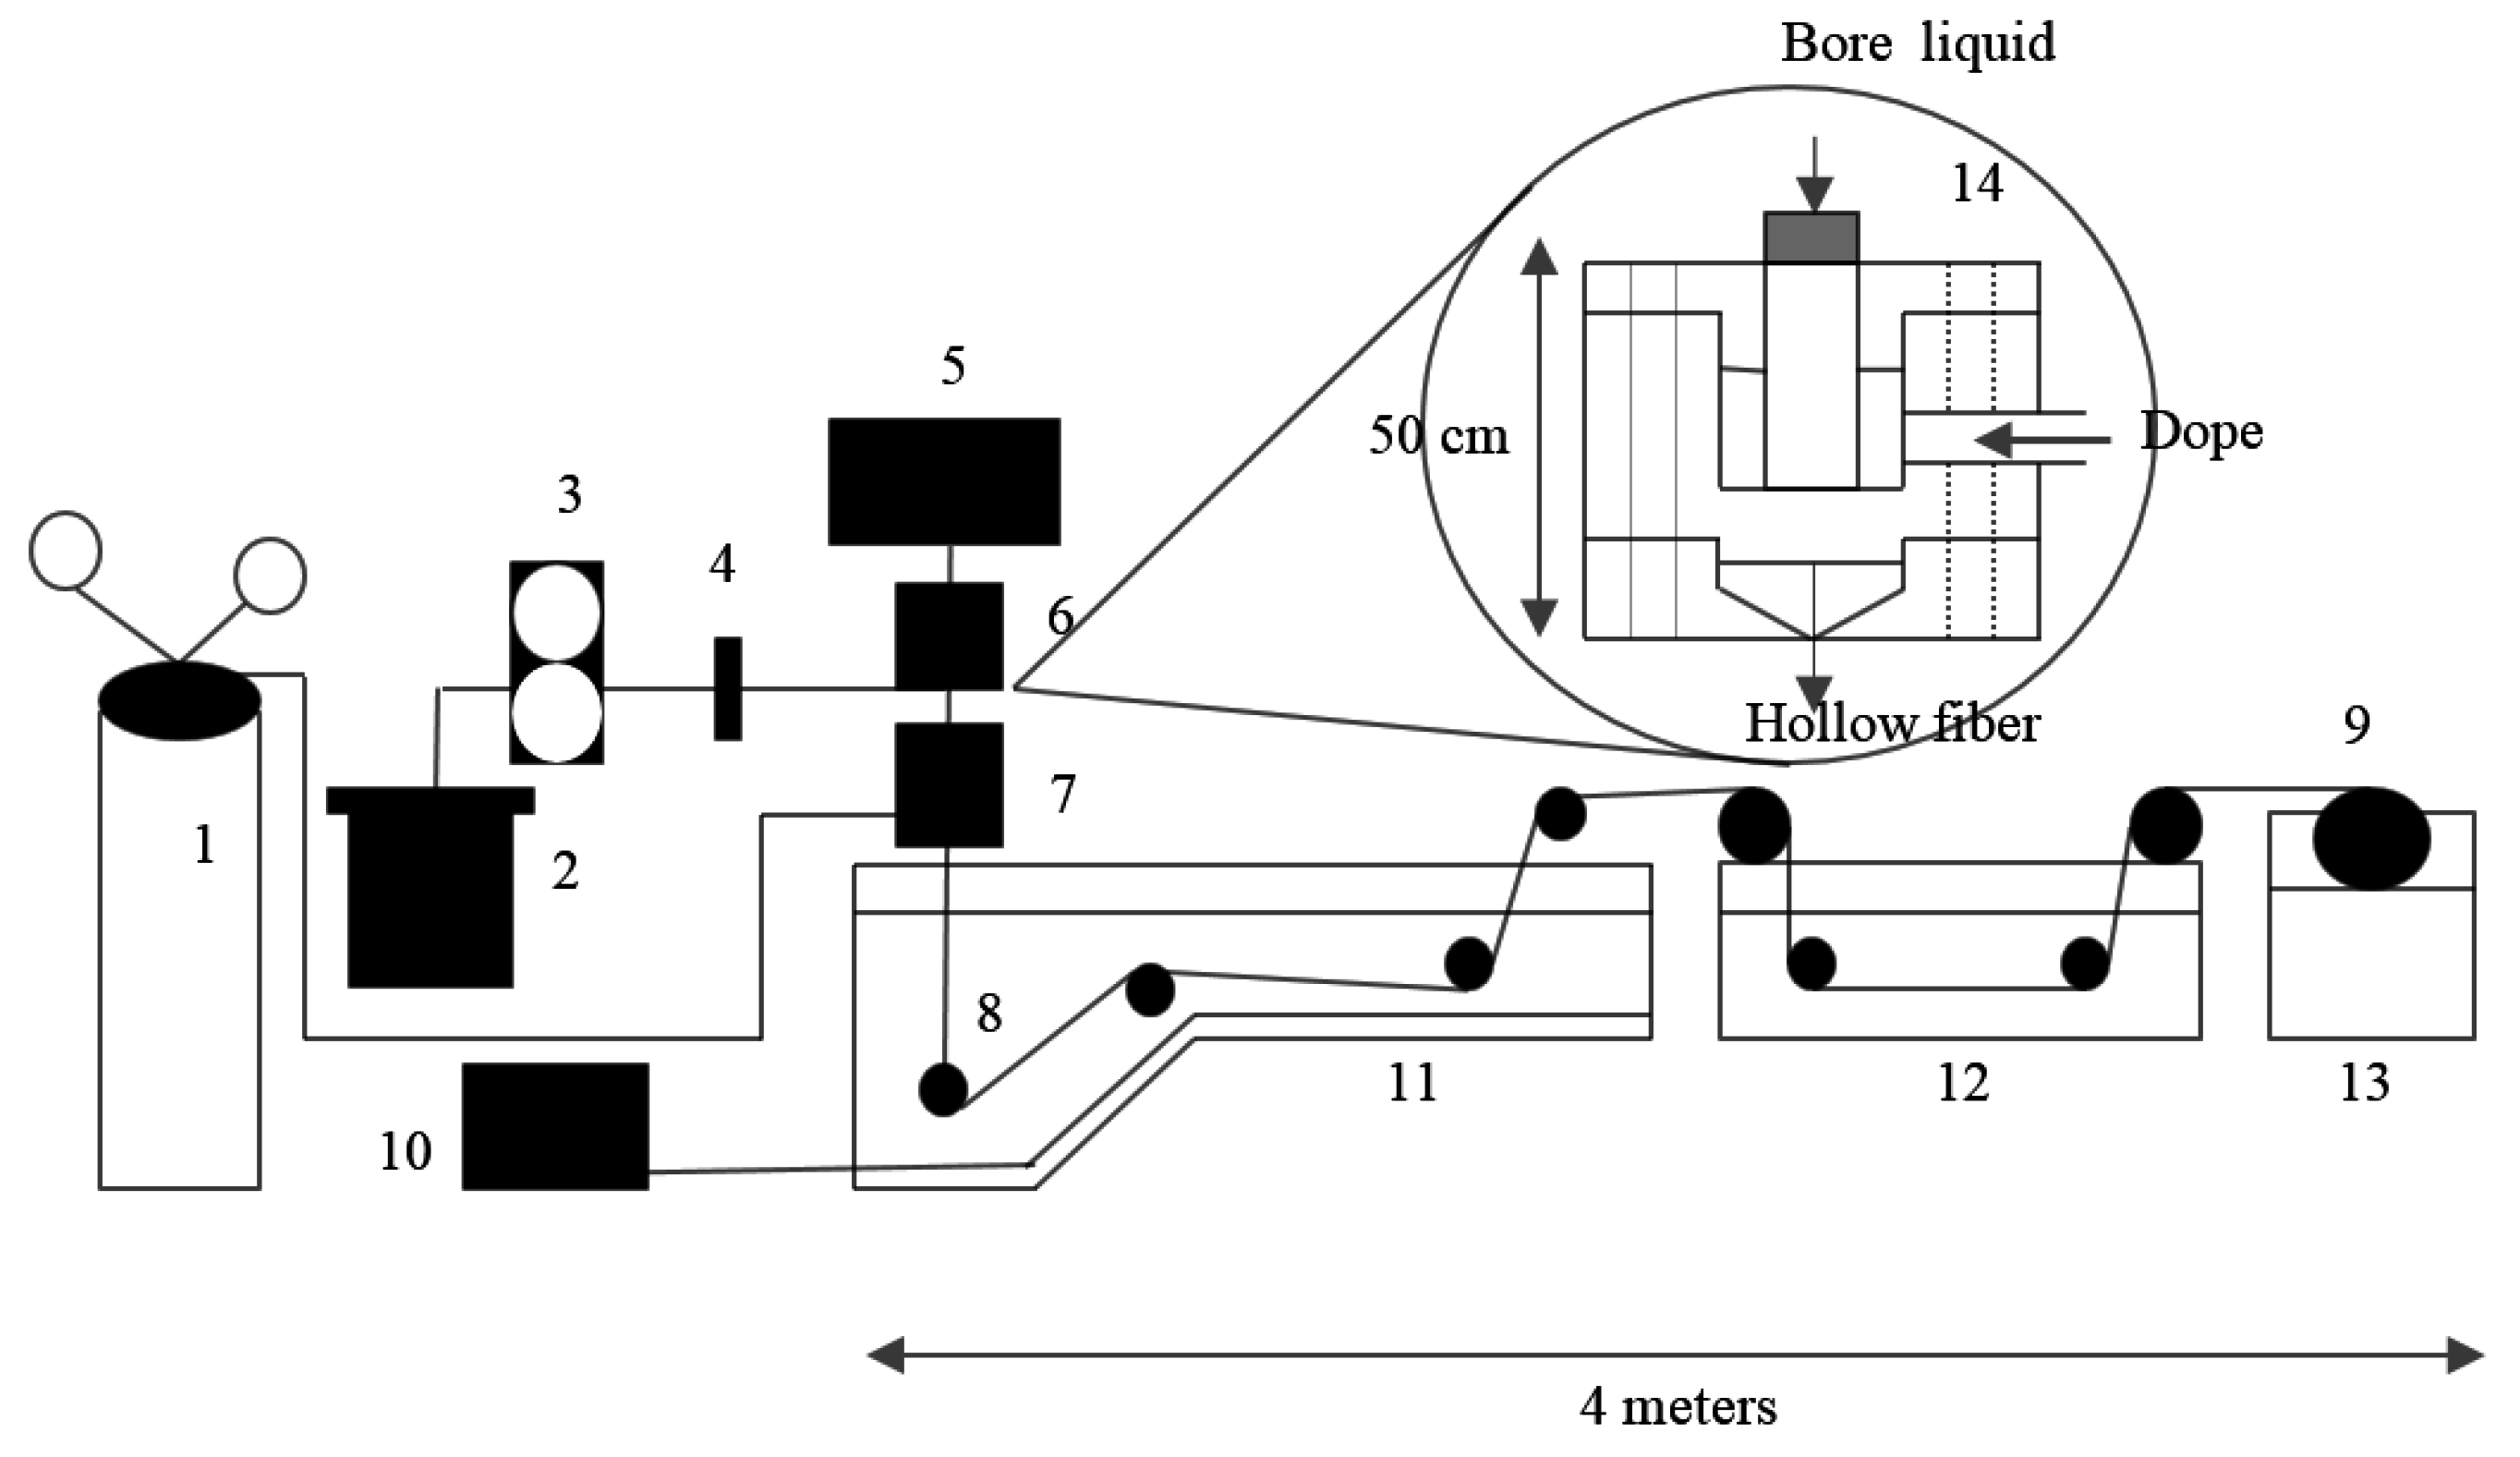
2.2. Procedures of the Dry/Wet Spinning Process

A dope solution comprising 15.25% PES concentration, 66.43% NMP, 14.3% PEG, and 4.02% water was prepared using a vigorous mixture. Asymmetric PES hollow fiber membranes were fabricated in the spinning equipment as shown in Figure 1 using a spinneret with dimensions of 1100 μm (outer diameter) and 550 μm (inner diameter).
Figure 1. Hollow fiber membrane spinning system: (1) nitrogen cylinder; (2) dope reservoir; (3) gear pump; (4) on-line filter, 7 mm; (5) syringe pump; (6) spinneret; (7) forced convective tube; (8) roller; (9) wind-up drum; (10) refrigeration/heating unit; (11) coagulation bath; (12) washing/treatment bath; (13) wind-up bath; and (14) schematic spinneret [21].
Sustainability 07 15826 g001
A dope reservoir was linked with an N2 gas cylinder. The process started when the dope solution and the bore fluid solution were extruded at the same time through a tube-in-orifice. During the extrusion process, shear stress occurred inside the spinneret at a controlled rate. For the bore fluid solution composition, it consisted of mixtures of pure water and NMP with various ratios. Then, the membranes passed through an air gap with a particular height. After that, the membranes entered a coagulation bath at a controlled temperature, which consisted of tap water. Subsequently, the membranes passed through a few continuous rollers from the coagulation bath to the washing bath. Next, the membranes were gathered onto a wind-up drum. Following this, the membranes were cleaned and immersed in water for two days at the ambient temperature. The membranes were gathered and after that they were treated to clear away any residual solvent. The membranes were submerged into a methanol solution for a specific duration to minimize membrane shrinkage, which normally occurred during the process of drying. The water in the membrane pores was substituted with the exchanged reagent (methanol) during this post-treatment procedure. The exchanged reagent used has a lower surface tension. Lastly, prior to a characterization process, the membranes were dried at the room temperature.

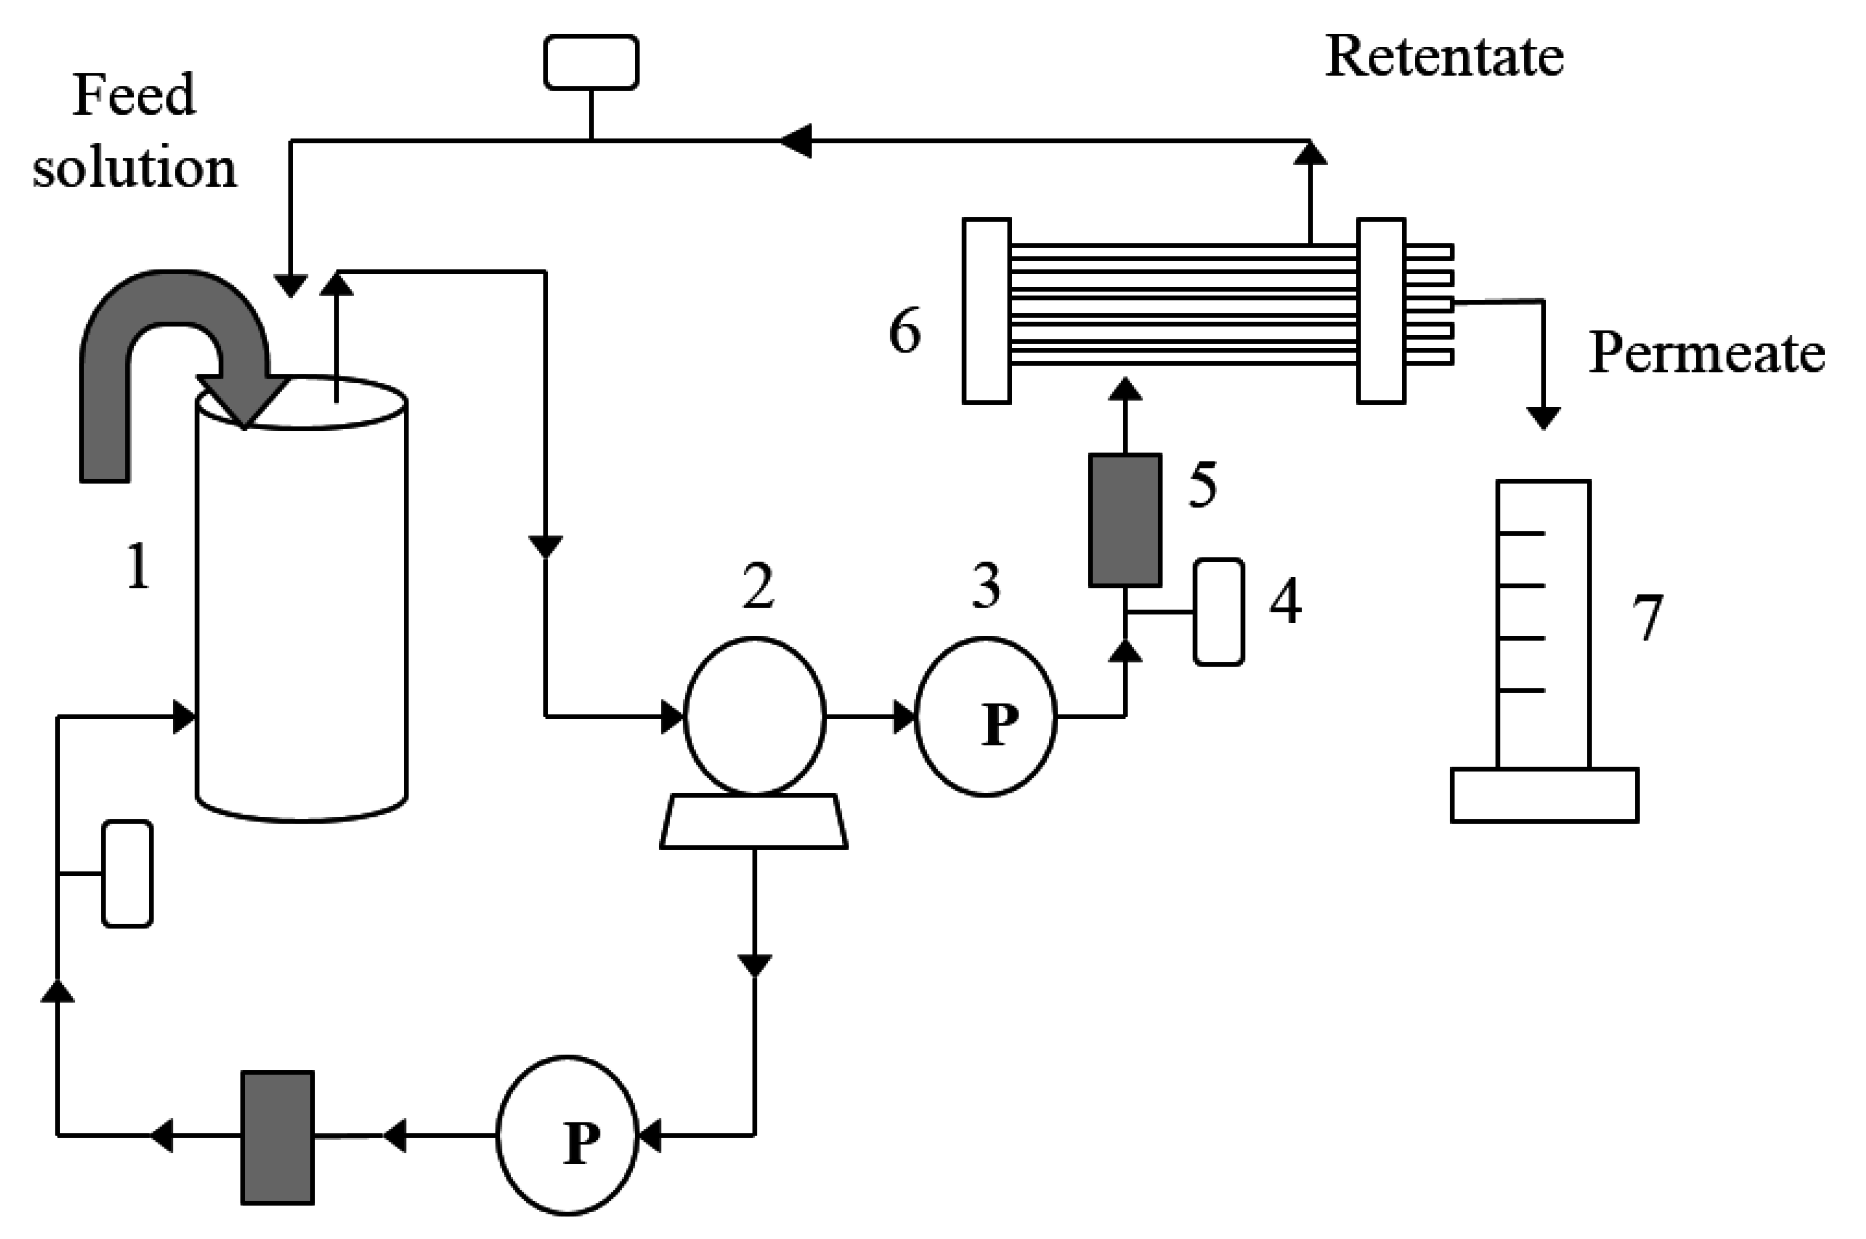
2.3. Oily Wastewater Treatment by Ultrafiltration Process

The ultrafiltration experiments were operated in a cross flow separation setup as illustrated in Figure 2. The water flux rig comprised a pump, a 4 L feed tank, and an ultrafiltration hollow fiber membrane module. A transmembrane pressure (TMP) of 1 bar was proposed, which was a suitable operating TMP for the ultrafiltration process. A cooling system was used to keep the feed solution temperature at 25 °C.
Figure 2. Schematic diagram of the ultrafiltration process of hollow fiber membranes: (1) feed tank; (2) pump; (3) pressure gauge; (4) control valve; (5) flow meter; (6) hollow fiber membrane module; and (7) measuring cylinder.
Sustainability 07 15826 g002
For characterization of the rejection performance, a synthesized oily solution of 250 ppm oil concentration was used as the oily wastewater samples because this concentration is typically or normally prepared for most oily wastewater [22,23,24,25,26]. In addition, this concentration is comparable with other oil related effluent sources (palm oil mill = 50–1000 ppm, car/motorcycle workshop = 14–420 ppm, petroleum refining = 20–4000 mg/L, metal processing and finishing = 100–20,000 mg/L, cleaning bilge water from ships = 30–2000 mg/L, car washing = 50–2000 mg/L, and wood preservation = 50–1500 mg/L) [27,28,29]. In order to reduce the variation of wastewater quality, synthetic oily water was used to represent the attributes of oily wastewater (feed solution). In this respect, distilled water and cutting oil were mixed and blended using a blender for several minutes at the room temperature until they were well mixed. A UV-VIS spectrophotometer (DR 5000, Hach, Colorado, CO, USA) with absorbance measured at 294 nm was used to characterize both the feed and permeate oil concentrations. It was discovered that absorbance and oil concentration have a linear relationship between them. A sum of 31 bundles of the membranes were potted to investigate 28 different combinations of the spinning conditions for experimentation and three combinations of the spinning conditions for validation. The rejection performance was computed using the following formula:
R ( % ) = [ C f C p C f ] × 100 = [ 1 C p C f ] × 100
  • Cp = the solute concentration of permeate;
  • Cf = the solute concentration of feed.

2.4. Experimental Design

In terms of experiments, we used a central composite design (CCD), by which the factorial part is a fractional factorial design with resolution V and overall, it consists of combinations of high levels and low levels, center points as well as axial points. CCD is a preferable method compared to other methods such as Box-Behnken design (BBD), etc., because the CCD methodology provides better information at or beyond the limits of the spinning process, while the BBD method does not provide information at the spinning process limits and it cannot be built up in two steps beginning with a 2k design. In this research, the five chosen spinning variables, which are dope extrusion rate (DER), air gap length (AGL), coagulation bath temperature (CBT), bore fluid ratio (BFR) and post-treatment time (PT), and their respective details are given in Table 1. The design matrix involves 28 trials by which it consists of a half fractional factorial experiment with design resolution V, as well as four replications of center points and eight axial points, while, the output response evaluated is rejection. The layout of the experiments produced via the Design-Expert Version 6.0.5 software and the outcomes obtained are displayed in Table 2.
Table 1. Spinning condition values for the real spinning process.
Spinning VariablesUnitsLevel in Coded Form
−101
DER, (A)cm3/min246
AGL, (B)cm012
CBT, (C)°C182430
BFR, (D)NMP/H2O, wt %0/10035/6570/30
PT, (E)h246
Table 2. Experimental results for spinning experiments.
Std. OrderRun OrderValues of Spinning ConditionsResponse
ABCDERejection (%)
1420180/100634.76
21360180/100262.40
3722180/100241.59
4562180/100697.67
51920300/100299.95
61660300/1006100
7122300/100671
8862300/100296.19
92201870/3028.98
1011601870/30622
1112221870/30665.93
123621870/30293
1318203070/30652.86
1414603070/30210.08
1510223070/30285.11
1620623070/30690
1715412435/65455
189412435/65446.51
196412435/65447.77
2017412435/65446.42
2128212435/65436.42
2225612435/65449
2327402435/65449.10
2426422435/65445.99
2523411835/65448.00
2622413035/65447.00
272441240/100481.25
2821412470/30454.82

2.5. Response Surface Methodology

From Table 2, the experimental data were used to find the coefficients of the second-order regression model for rejection. Plots of contour and response surface were generated for various interactions between two spinning parameters. The plots of three-dimensional surface produce a precise geometrical representation and provide good knowledge regarding the performance of the spinning system.

3. Results and Discussion
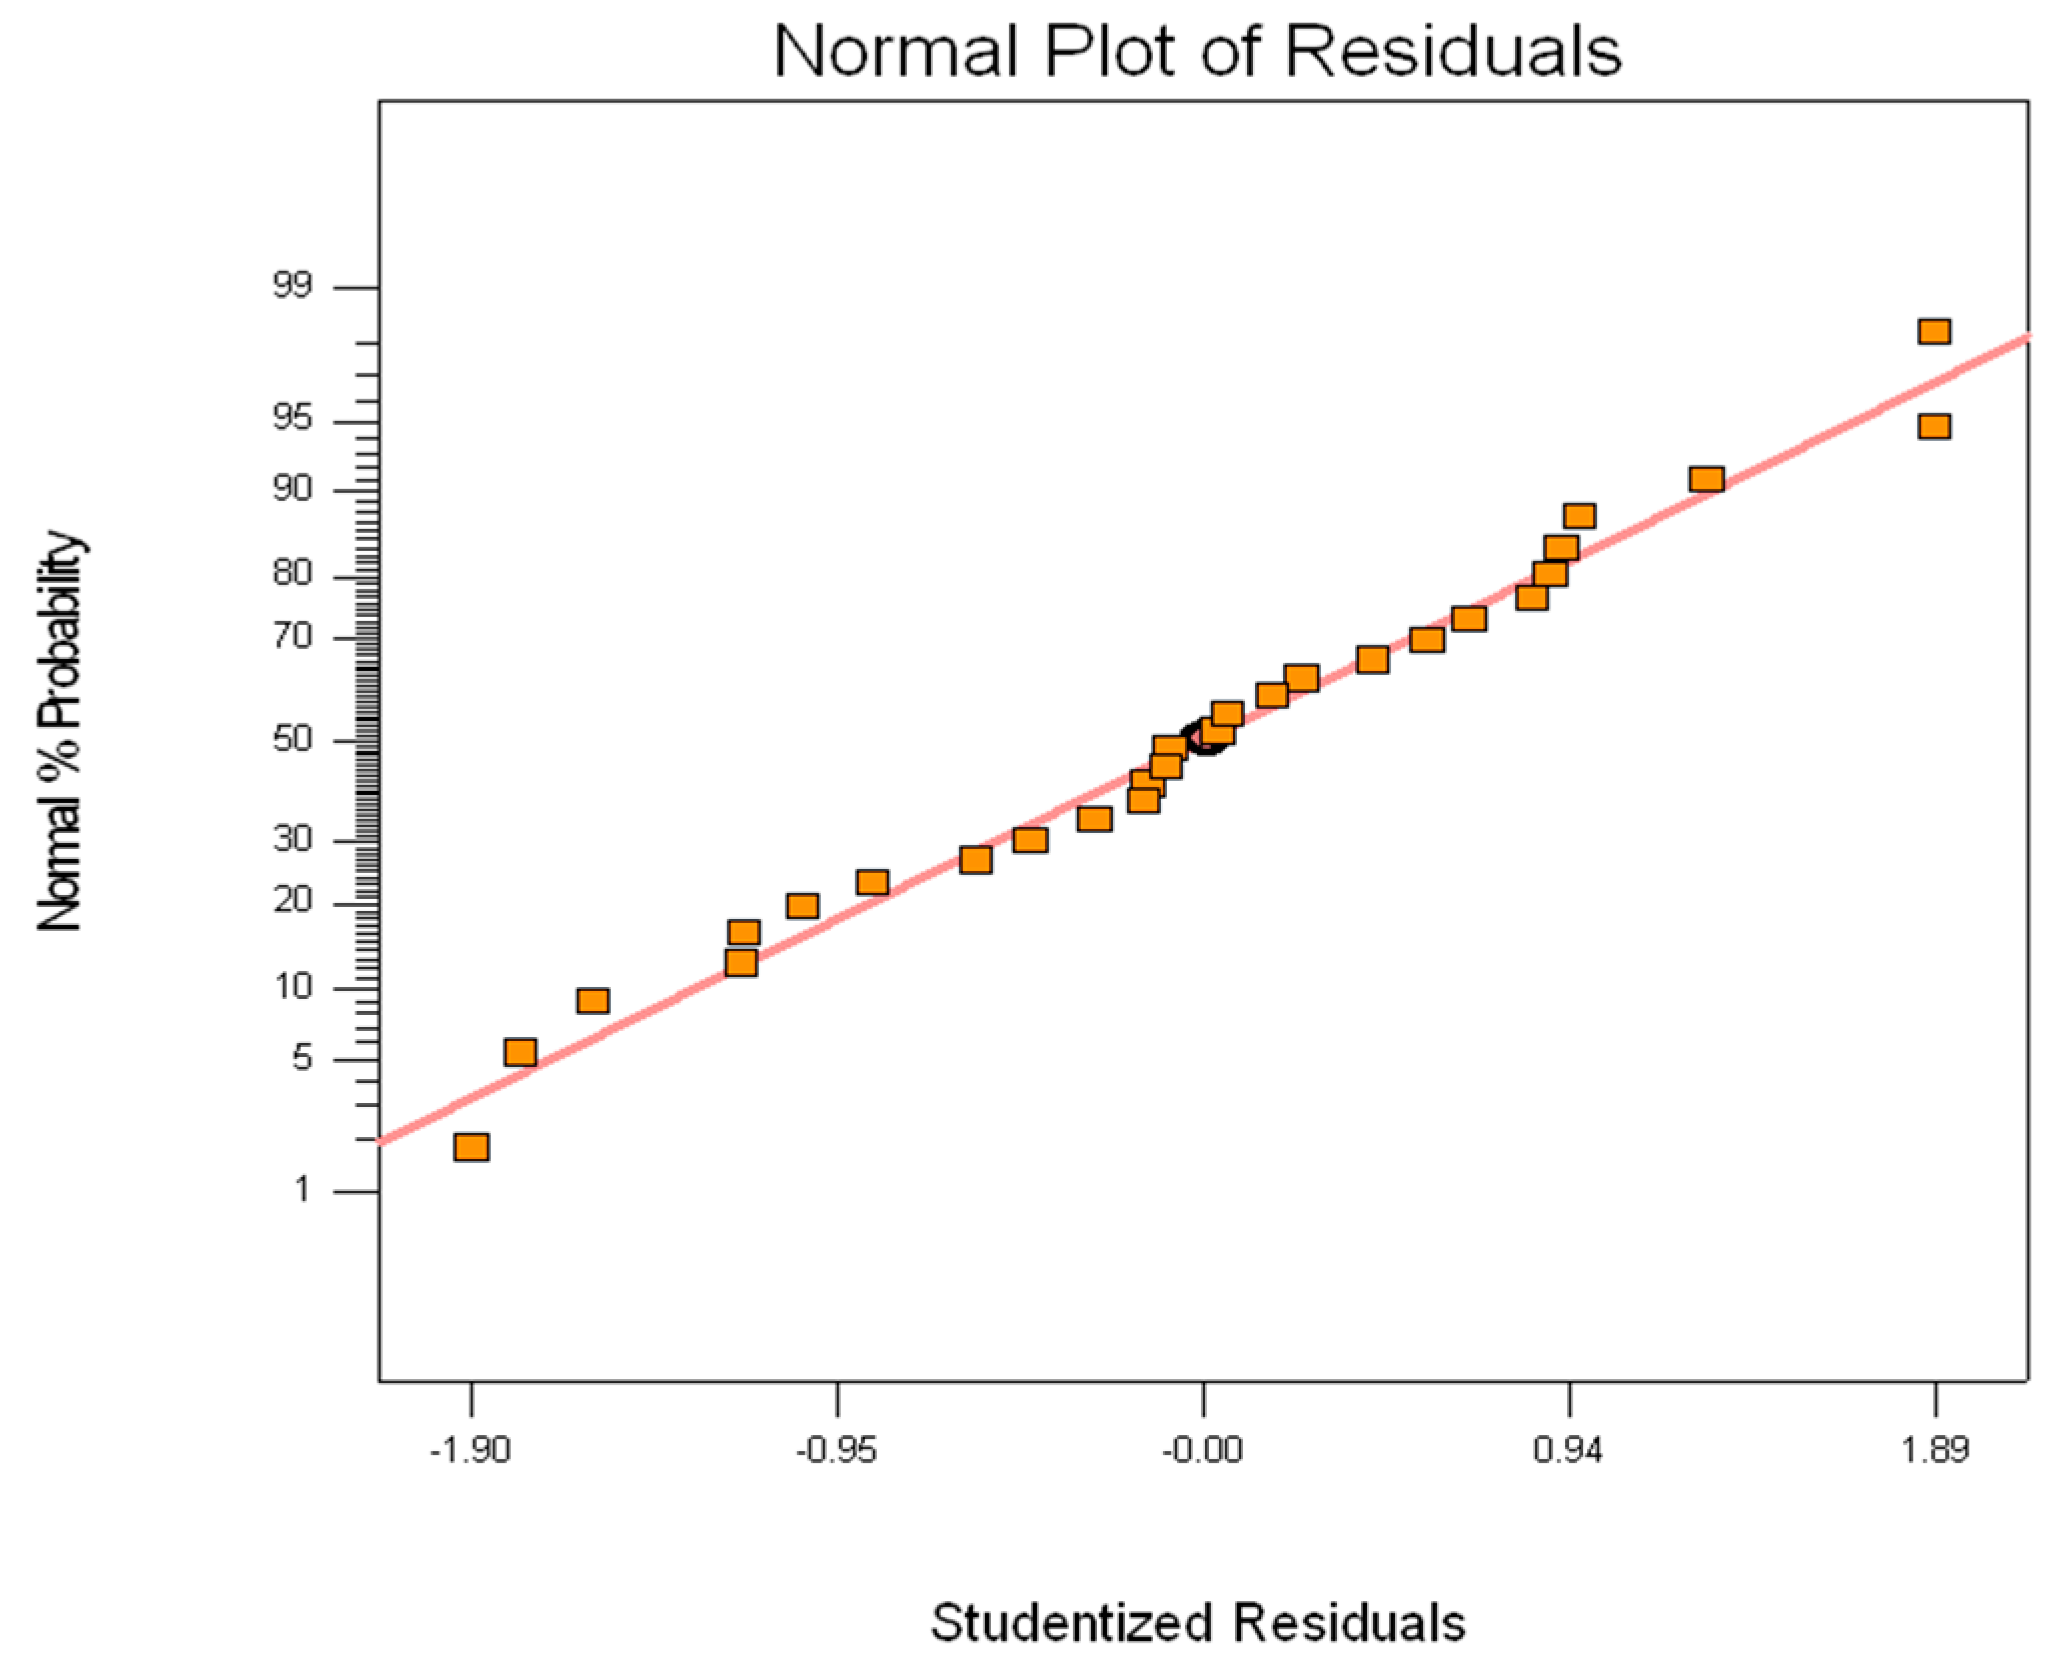
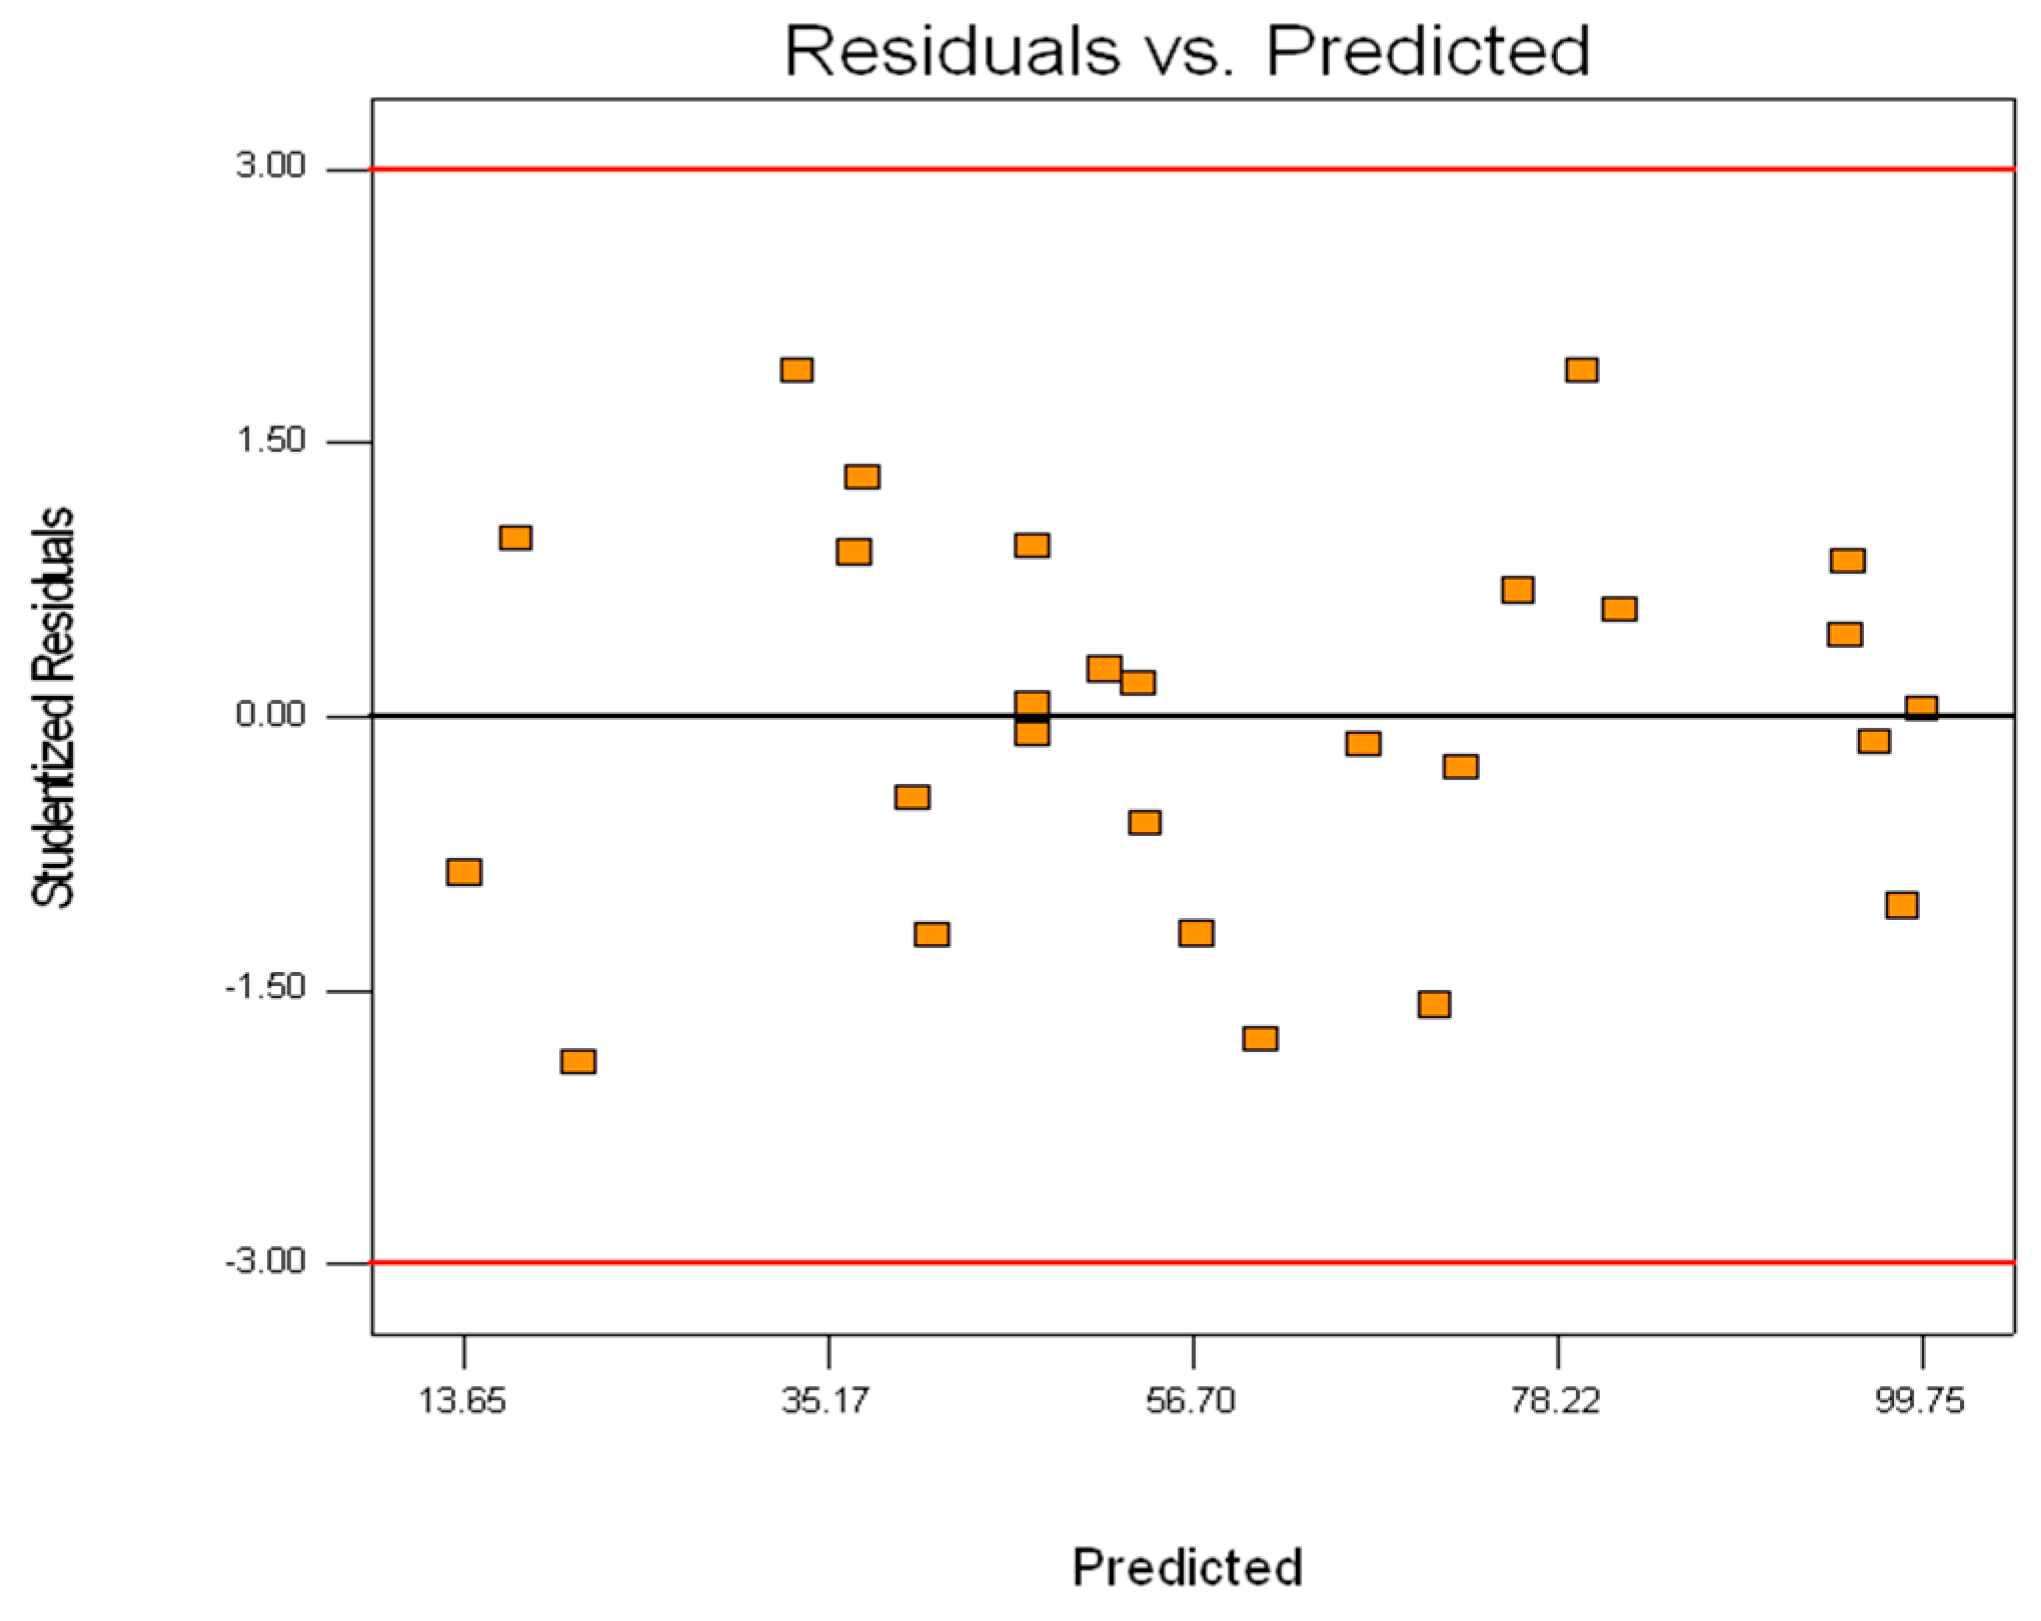
3.1. ANOVA Analysis

An ANOVA analysis was implemented to check the developed model. Table 3 exhibits the ANOVA table for the rejection surface quadratic model. From Table 3, the “Prob > F” value for the rejection model is smaller than 0.05 and it shows the model is significant. In other words, it shows the terms in the rejection model have an important influence on the response. Therefore, the main effects of DER (A), AGL (B), CBT (C), and BFR (D), the second order effect of D2, as well as the two-level interactions of AB, AC, AD, BC, and BD are the rejection model terms which are significant. The terms that are not significant (A2, B2, and C2) were then eliminated by the software, thus generating an improved model. In order to remove the insignificant model terms, the backward elimination approach was used. Note that the term CD was not eliminated because it was required to support the hierarchy of the model. Table 4 depicts the resulting ANOVA table for the rejection reduced quadratic model and the “Prob > F” value for the model is still significant. The main effects of DER (A), AGL (B), CBT (C), and BFR (D), the two-level interactions of AB, AC, AD, BC, BD, and CD, as well as the second order effect of D2 are significant model terms. AGL (B) is the most critical spinning condition related to the rejection performance. This is due to the fact that increasing the air gap length is acknowledged to influence the outer skin formation of the membranes, thus affecting the rejection performance. Additionally, the results show that the interaction between AGL (B) and BFR (D) also gives a critical effect to the rejection value. However, PT (E) is found to be insignificant during the development of the first-order rejection model and it has been removed from the model. Though PT (E) is indicated as not having a significant impact on the rejection performance in this study, post-treatment was found to have a significant effect on the permeation properties of hollow fiber membranes and was claimed to be another factor worth examining according to Kim et al. [30], Wan et al. [31], and Wang et al. [32]. They claimed that post-treatment is a solvent exchange process to remove solvent residue and a lack of proper post-treatment would cause shrinkage, thus reducing the porosity and changing the pore structure of the membranes. Therefore, one of the ways to explore the effect of post-treatment on membrane performance is by varying the duration of the treatment, which is PT.
Table 3. Resulting ANOVA table for rejection surface quadratic model.
SourceSum of SquaresDFMean SquareF ValueProb > F
Block561.591561.59
Model16,760.58141197.1811.83<0.0001sig.
A850.641850.648.410.0133
B3371.5713371.5733.33<0.0001
C1757.4511757.4517.370.0013
D2267.5612267.5622.420.0005
A259.65159.650.590.4574
B26.693 × 10−416.693 × 10−46.617 × 10−60.9980
C29.509 × 10−319.509 × 10−39.4 × 10−50.9924
D21062.4611062.4610.500.0071
AB830.881830.888.210.0142
AC1163.8311163.8311.510.0053
AD712.361712.367.040.0210
BC513.481513.485.080.0438
BD3328.7113328.7132.91<0.0001
CD426.221426.224.210.0626
Residual1213.8812101.16
Lack of Fit1163.539129.287.700.0601not sig
Pure Error50.35316.78
Cor Total18,534.0427
Std. Dev.10.06R-Squared0.9325
Mean58.53Adj R-Squared0.8537
C.V.17.18Pred R-Squared0.5729
PRESS7676.77Adeq Precision11.325
Table 4. Resulting ANOVA table for rejection reduced quadratic model.
SourceSum of SquaresDFMean SquareF ValueProb > F
Block561.591561.59
Model16,685.59111516.8717.65<0.0001sig.
A850.641850.649.900.0067
B3371.5713371.5739.24<0.0001
C1757.4511757.4520.450.0004
D2267.5612267.5626.390.0001
D21462.8911462.8917.030.0009
AB830.881830.889.670.0072
AC1163.8311163.8313.540.0022
AD712.361712.368.290.0115
BC513.481513.485.980.0273
BD3328.7113328.7138.74<0.0001
CD426.221426.224.960.0417
Residual1288.871585.92
Lack of Fit1238.5212103.216.150.0805not sig
Pure Error50.35316.78
Cor Total18,536.0427
Std. Dev.9.27R-Squared0.9283
Mean58.53Adj R-Squared0.8757
C.V.15.84Pred R-Squared0.7056
PRESS5291.71Adeq Precision13.632
The insignificant lack of fit represents that the model is fit and desirable. The R2 value of 0.9283 is quite close to one and this suggests that the predicted quadratic model defines the real behavior of the spinning system. In addition, the closer the adjusted R2 value to the R2 advocates the higher significance of the model. Furthermore, the “Adeq Precision” value is higher than four and it exhibits sufficient model discrimination. The final empirical rejection model of actual factors is formulated as below:
R = 86.99 + 20.23 × A + 7.51 × B + 6.29 × C 0.77 × D + 0.014 × D 2 + 3.60 × A × B 0.71 × A × C 0.095 × A × D 0.94 × B × C + 0.41 × B × D 0.025 × C × D
This model is capable of estimating the rejection value within the range of experimental variables. Figure 3 displays the normal plot of residuals for the rejection model. The plot shows that the residuals are normally distributed along the normal probability line. It means that the error distribution is approximately normal for all series of data, which implies that the model is adequate. Figure 4 exhibits the studentized residuals versus the predicted values in which all data are shown to be in the range, and no abnormal trend exists.
Figure 3. Normal probability plot of residuals for rejection.
Sustainability 07 15826 g003
Figure 4. Plot of residuals vs. predicted responses for rejection.
Sustainability 07 15826 g004
In order to rank the order of the spinning conditions based on their significance, the F value could be utilized. In this research, the order of importance is discovered to be AGL > BFR > CBT > DER. By using the point prediction capability of the Design-Expert software, the obtained optimal spinning conditions are displayed in Table 5.
Table 5. Optimum spinning conditions.
FactorsResult
DER (A)2.13
AGL (B)0
CBT (C)30
BFR (D)0.01/99.99

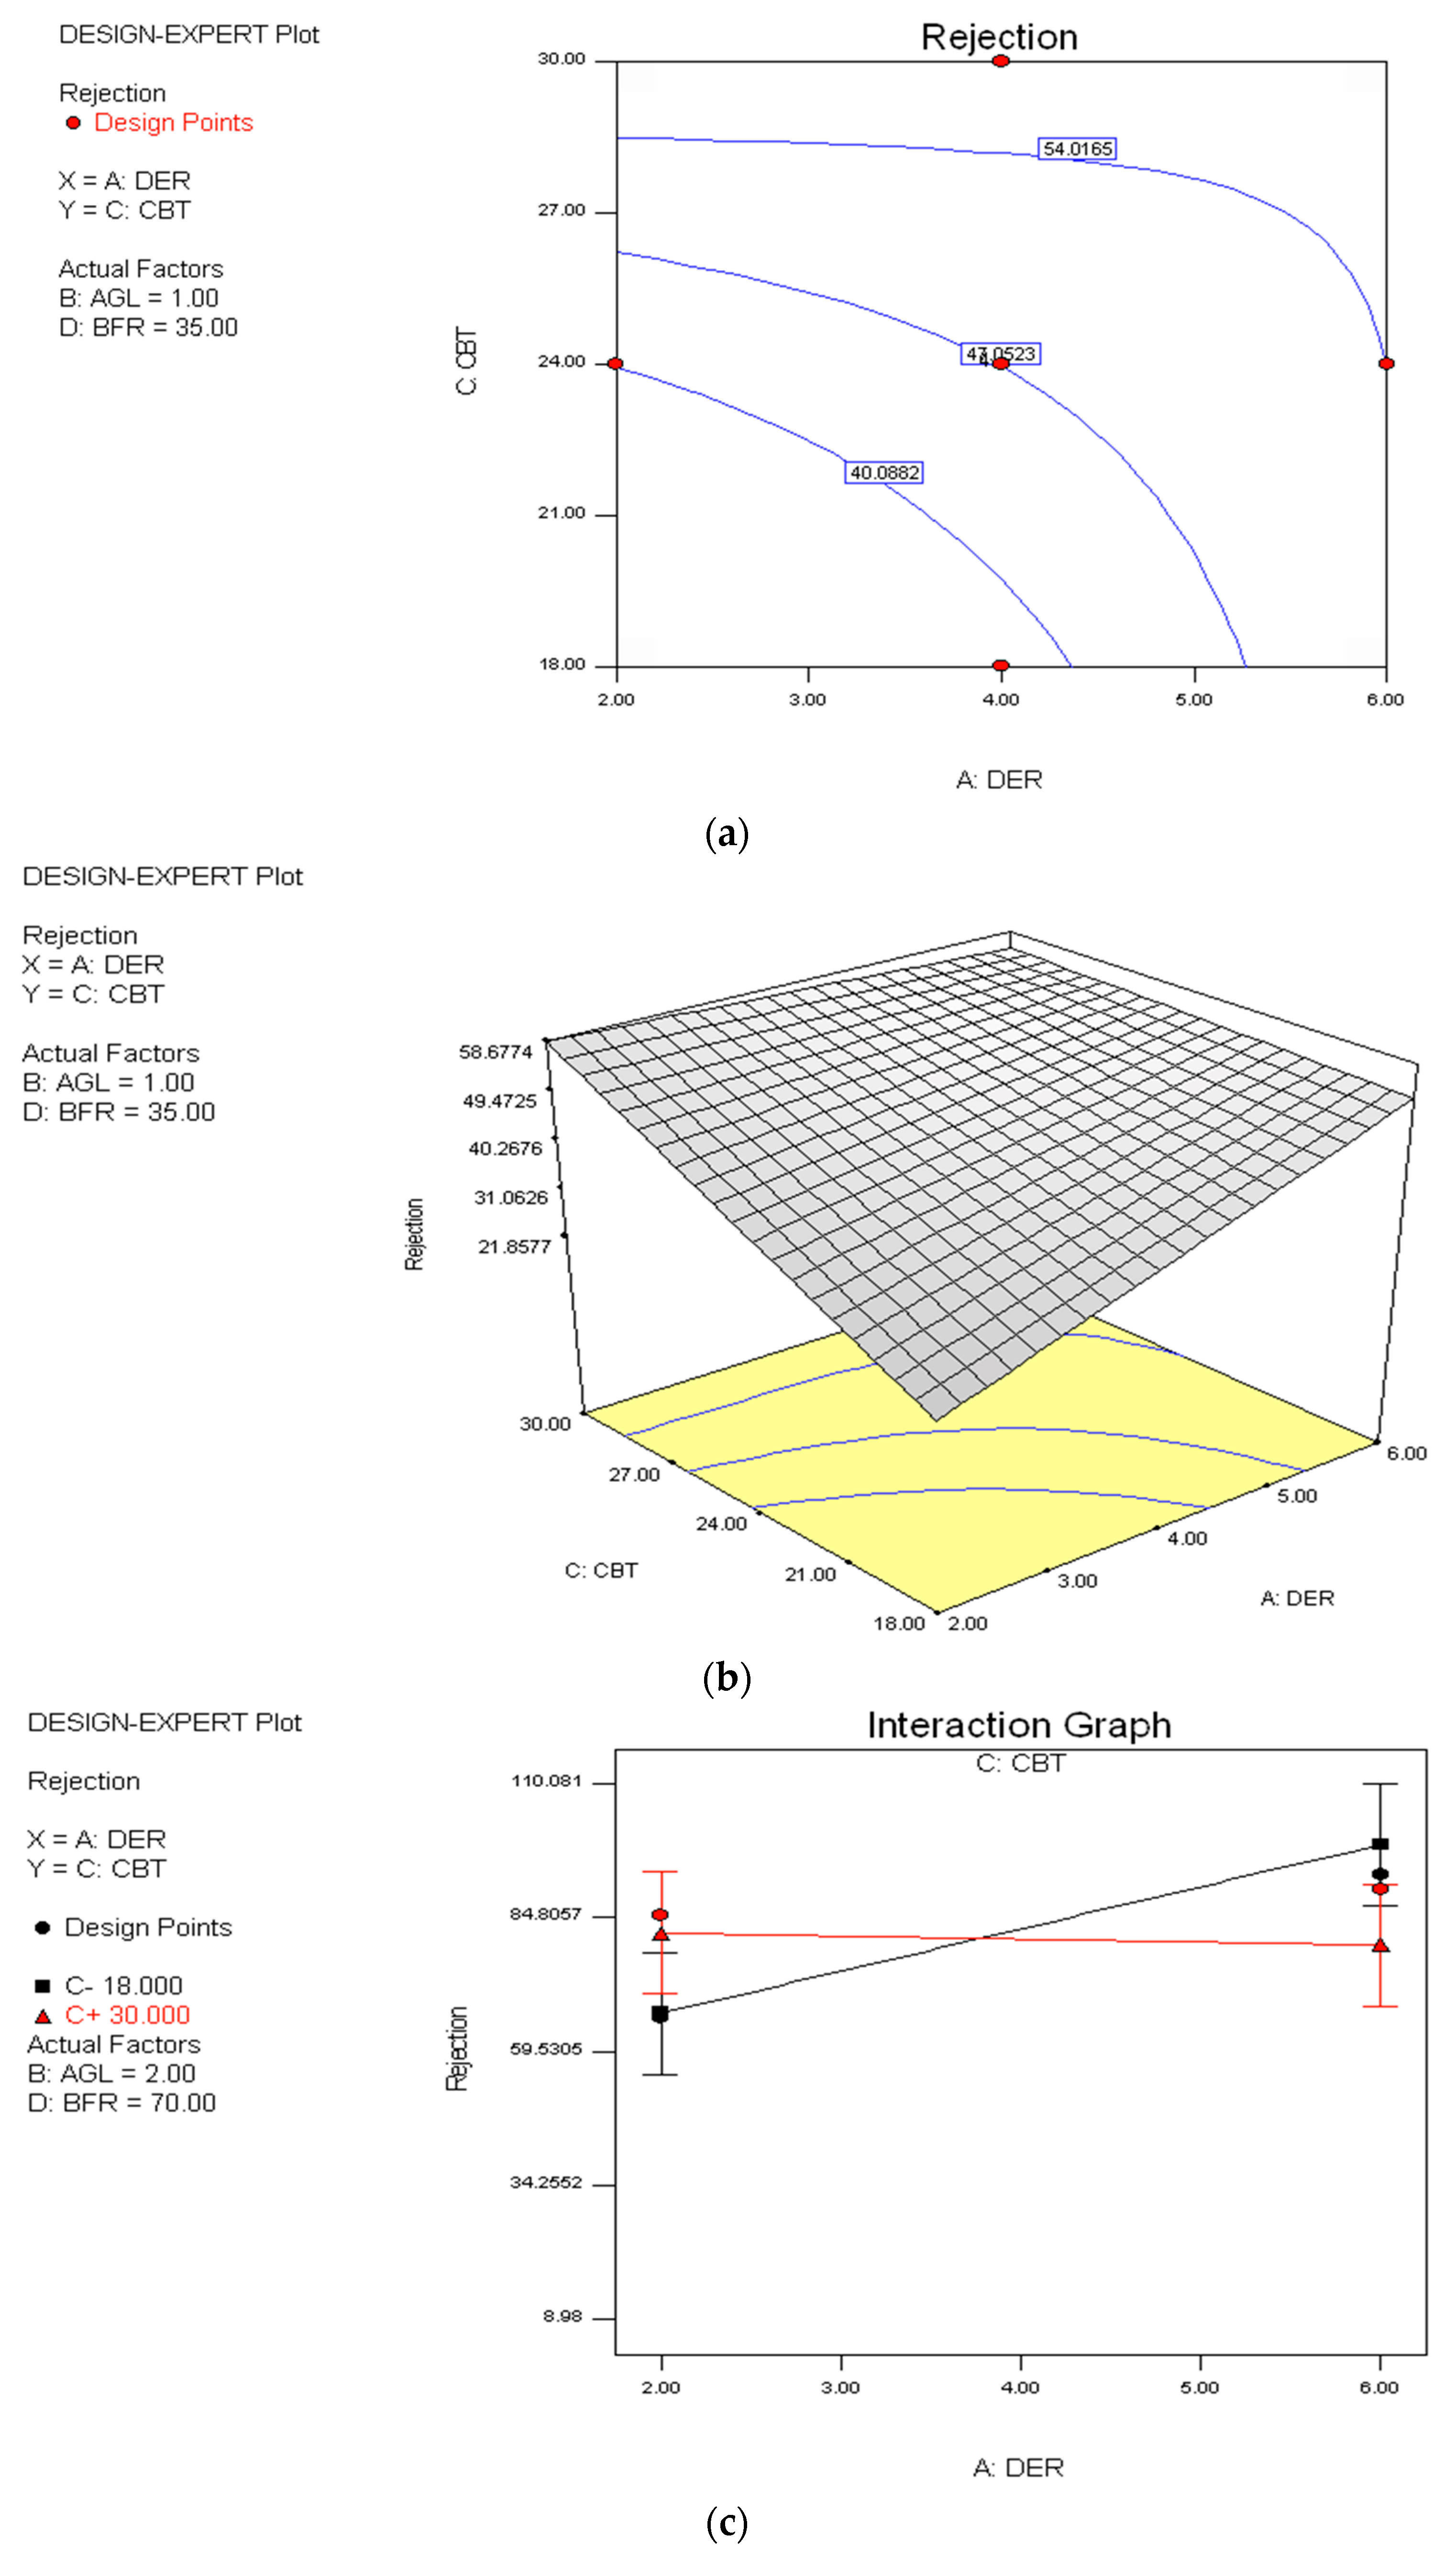
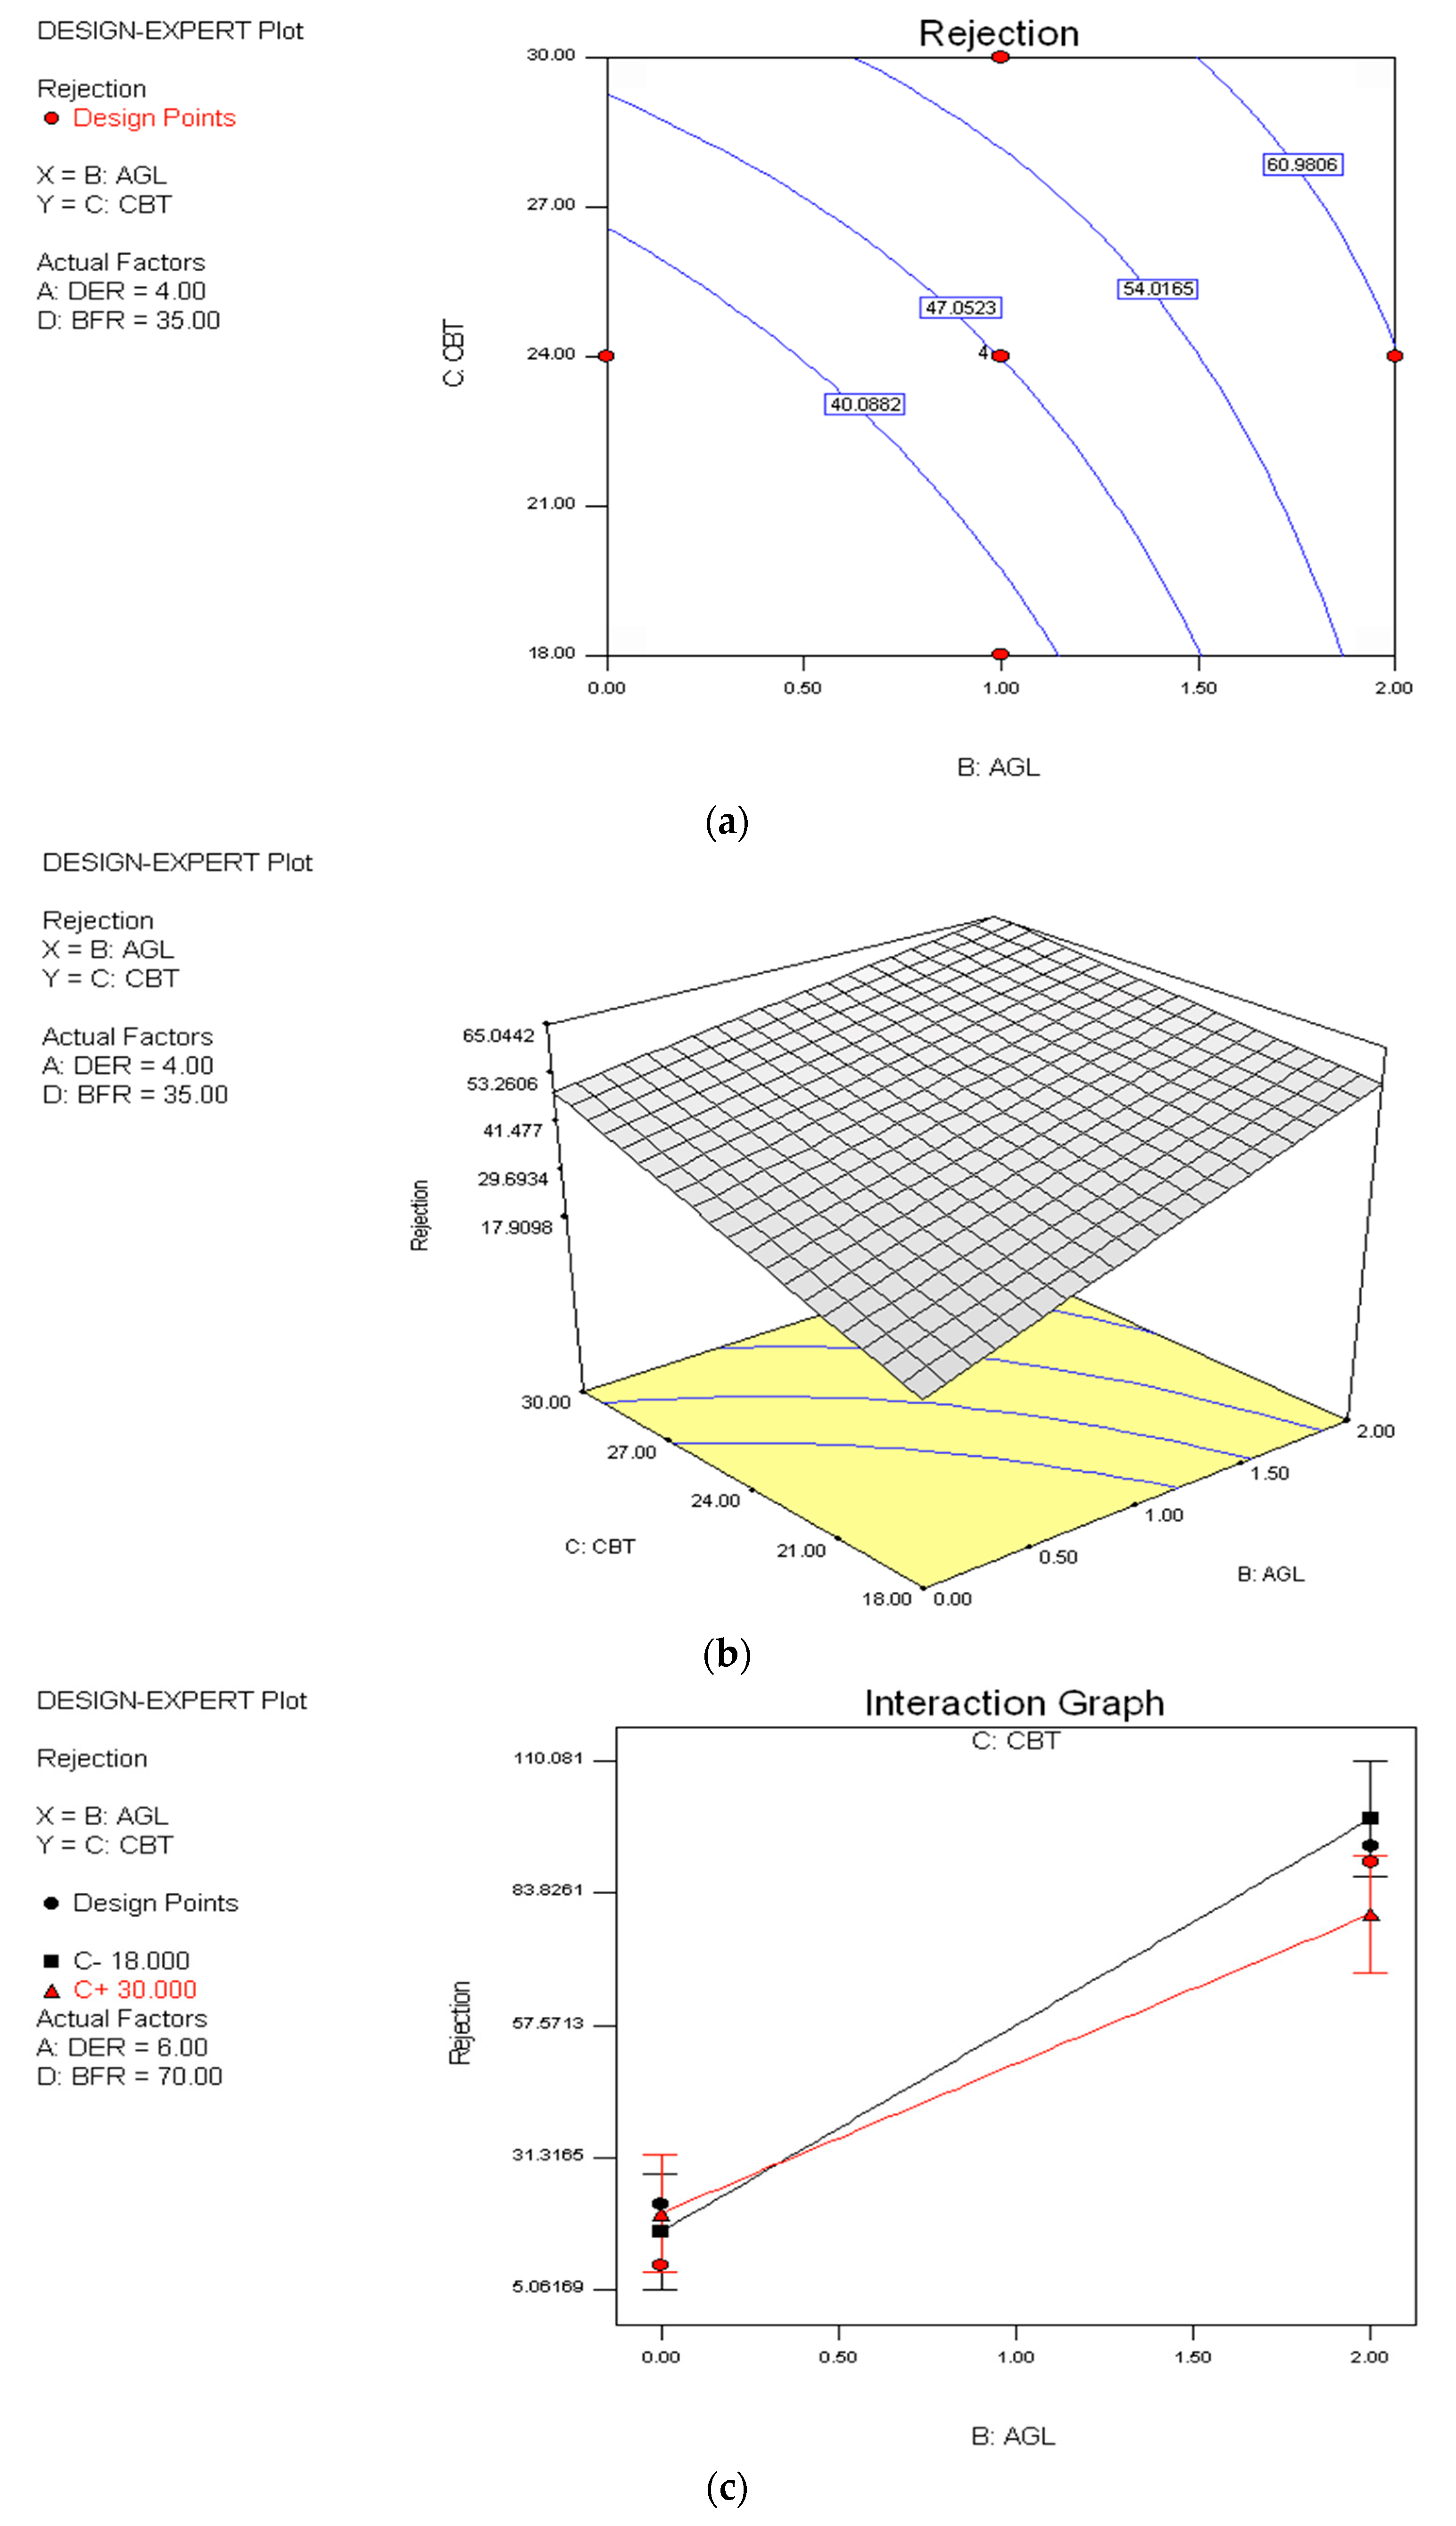
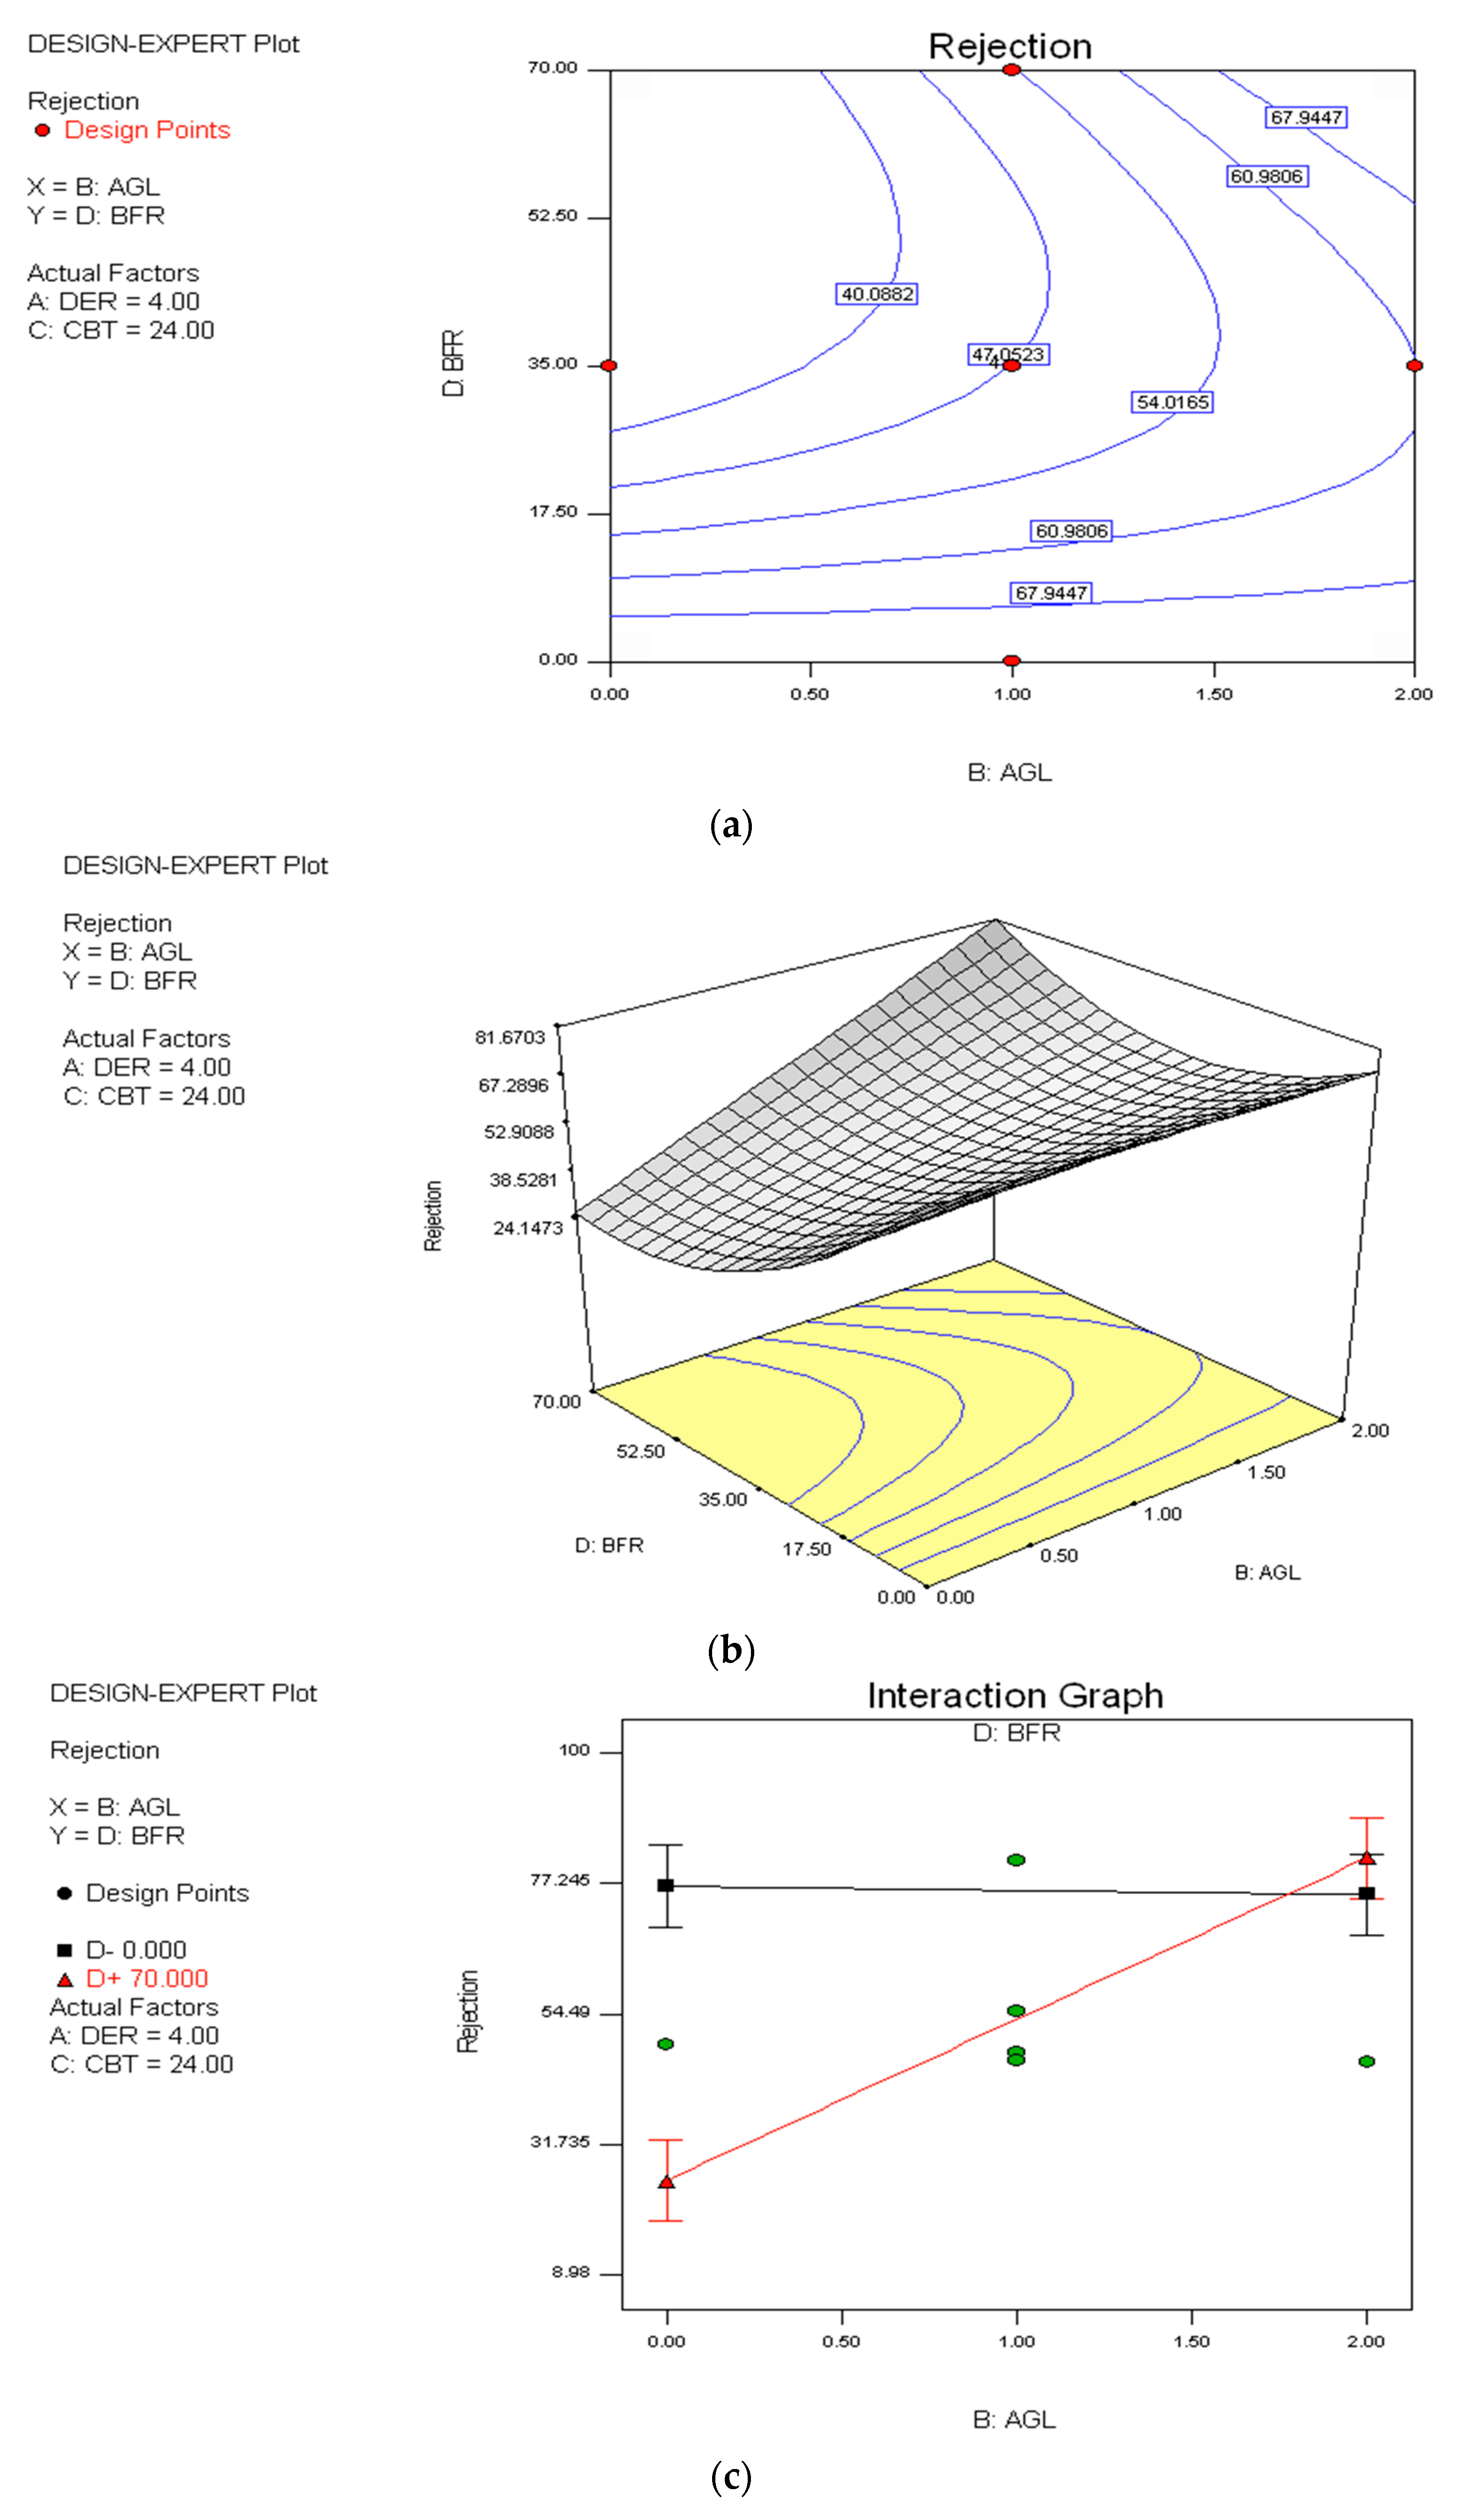
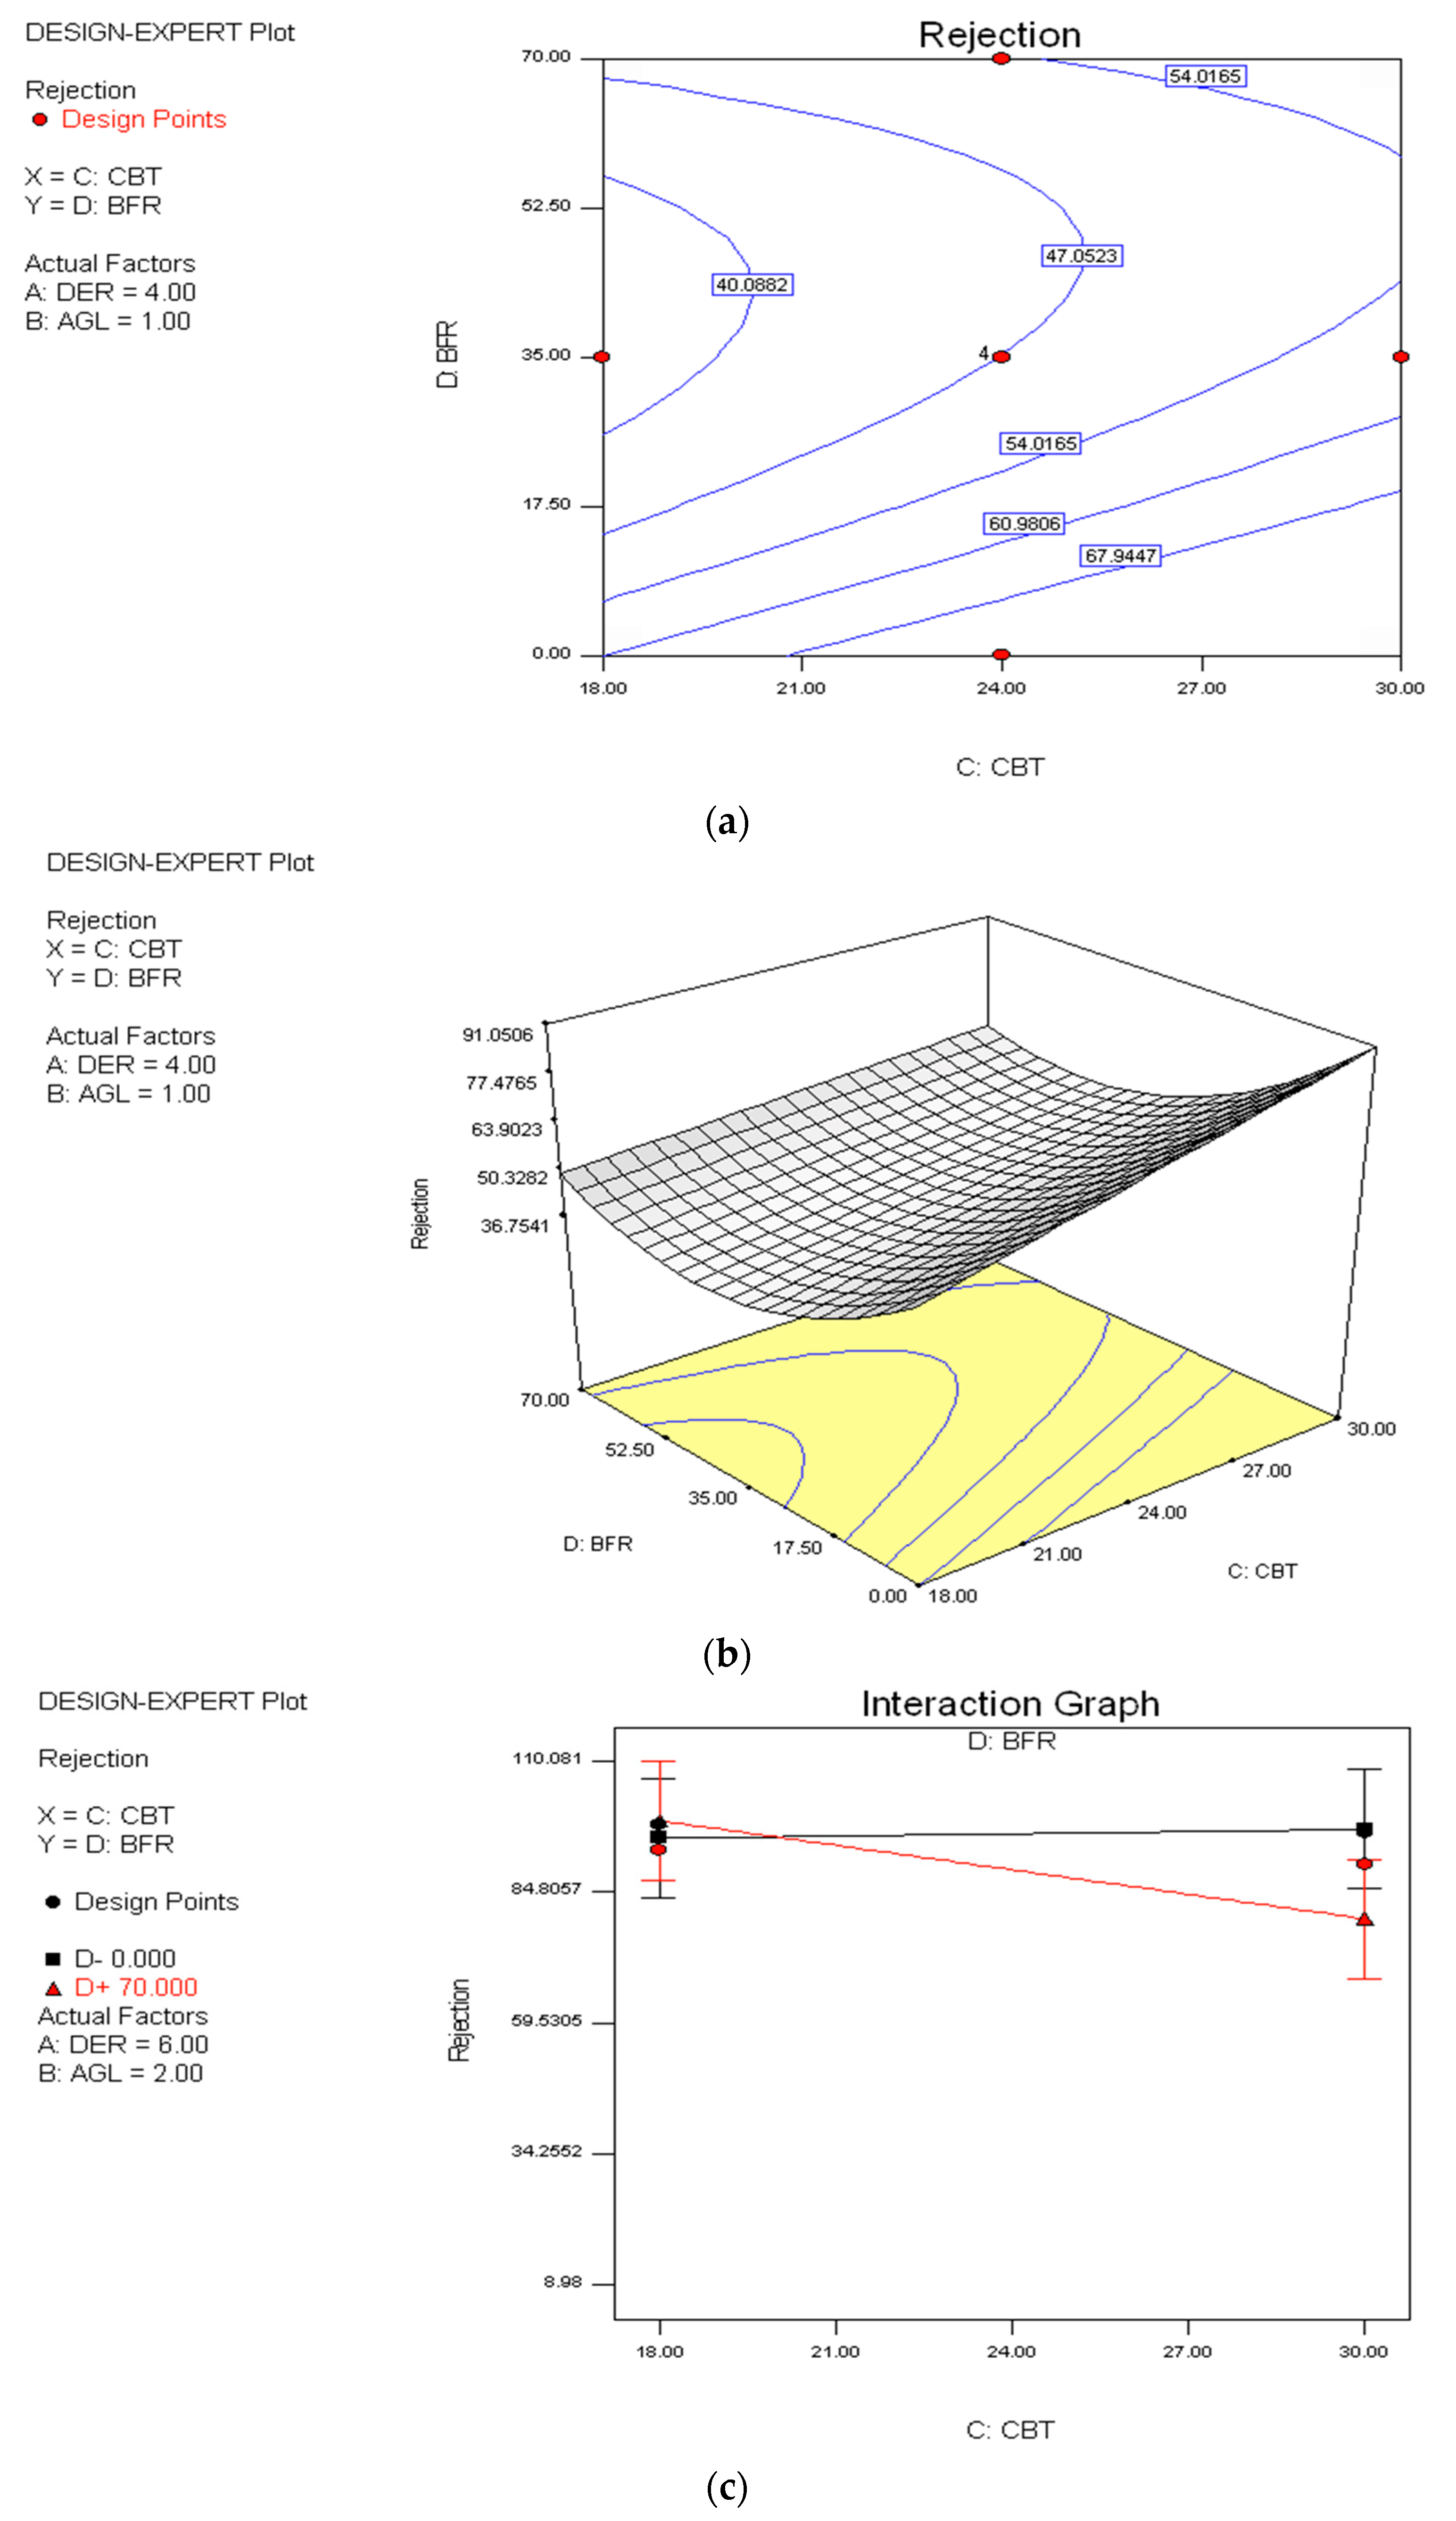
3.2. Effect of Spinning Variables on Rejection

The plots of contour, three-dimensional surface, and interaction illustrate the influence of different spinning conditions on rejection and they are portrayed in Figure 5, Figure 6, Figure 7, Figure 8, Figure 9 and Figure 10. Figure 5a,b illustrate that rejection increases when increasing both DER and AGL while fixing CBT and BFR at their center points. Further investigation in Figure 5c shows that at a lower DER, a better rejection is obtainable at 0 cm AGL when CBT and BFR are not at their center points. However, at a DER above approximately 2.6 cm3/min, the reverse occurs where a better rejection is achievable at 2 cm AGL. This is because the interaction between DER and AGL gives a significant effect on rejection. Figure 6a,b exhibit that as DER and CBT increase, rejection is increased when AGL and BFR are fixed at their center points. Figure 6c shows that at a lower DER, a better rejection is achievable at 30 °C CBT. However, at a DER above approximately 3.8 cm3/min, the reverse occurs where a better rejection is obtainable at 18 °C CBT because the interaction between DER and CBT is significant (conditions fixed at AGL of 2 cm and BFR of 70 wt % NMP). Figure 7a,b show that as BFR increases, rejection is increased. However, as BFR is within the range of 22 to 43.75 wt % NMP, rejection decreases, while as BFR decreases from 22 to 0 wt % NMP, rejection increases (for DER between 4 to 4.5 cm3/min). Additionally, at any particular DER, the best rejection is obtainable when BFR is approximately from 0 to 8.75 wt % NMP. Figure 7c shows that at a lower DER, a better rejection is obtainable at 70 wt % NMP in BFR. However, the reverse occurs at DER approximately 3.4 cm3/min and above where a better rejection is obtainable at 0 wt % NMP in BFR when AGL and CBR are not at their center points. From Figure 8a,b, they show that rejection increases when increasing both AGL and CBT while fixing DER and BFR at their center points. However in Figure 8c, it shows that the interaction between AGL and CBT has a significant effect on rejection when DER and BFR are not at their center points. At a lower AGL, a better rejection is achievable at 30 °C CBT but when AGL is above approximately 0.35 cm, the reverse occurs where a better rejection is obtainable at 18 °C CBT. Figure 9a–c show that at a lower AGL, a better rejection is obtainable at 0 wt % NMP in BFR, however at an AGL approximately 1.75 cm and above, a better rejection is obtainable at 70 wt % NMP in BFR when DER and CBT are fixed at their center points. Figure 10a,b show that rejection decreases when BFR is increased but the reverse happens when BFR reaches about 43.75 wt % NMP and above (DER and AGL are fixed at their center points). A good rejection is obtainable when BFR is within the range of approximately 0 to 8.75 wt % NMP. When, DER and AGL are not at their center points, the interaction between CBT and BFR has a significant effect on rejection (Figure 10c). At a lower CBT, a better rejection is obtainable at 70 wt % NMP. However, at approximately 20 °C CBT and above, the reverse occurs where a better rejection is achievable at 0 wt % NMP.
Figure 5. The plots for rejection between DER and AGL: (a) contour; (b) 3D surface; and (c) interaction.
Sustainability 07 15826 g005
Figure 6. The plots for rejection between DER and CBT: (a) contour; (b) 3D surface; and (c) interaction.
Sustainability 07 15826 g006
Figure 7. The plots for rejection between DER and BFR: (a) contour; (b) 3D surface; and (c) interaction.
Sustainability 07 15826 g007
Figure 8. The plots for rejection between AGL and CBT: (a) contour; (b) 3D surface; and (c) interaction.
Sustainability 07 15826 g008
Figure 9. The plots for rejection between AGL and BFR: (a) contour; (b) 3D surface; and (c) interaction.
Sustainability 07 15826 g009
Figure 10. The plots for rejection between CBT and BFR: (a) contour; (b) 3D surface; and (c) interaction.
Sustainability 07 15826 g010

4. Model Validation and Confirmation Run

For validating the adequacy of the rejection model generated, three confirmation runs were conducted. For all confirmation experiments, the test conditions chosen were conditions that have not been utilized in previous trials, yet still in the range of the spinning condition levels which have been described earlier. From the software, the point prediction capability was used to estimate the rejection values of the confirmation runs in association with a 95% prediction interval. The values of the estimation were dependent on the rejection regression model generated earlier. After that, all the values of the prediction were compared with the values of the actual experiments to compute the residual and percentage of error for each condition. Table 6 exhibits the results computed. As a comparison between the actual and estimated values for rejection, the percentage of error obtained is as follows: −5.90 to 2.60%. From these results, the empirical model generated is reasonably precise for predicting rejection because all the actual values from the confirmation runs are within a 95% prediction interval.
Table 6. Confirmation runs for rejection.
No.DERAGLCBTBFRPTActualPredictedResidualError
(cm3/min)(cm)(°C)(NMP/H2O, wt %)(h)(%)
12.200300/100699.6099.420.180.18
251.5300/100694.6292.162.462.60
32.130300.01/99.99593.9499.48−5.54−5.90

5. Conclusions

The work presented in this article has proven the usefulness of RSM to find the optimal spinning conditions in the fabrication of PES ultrafiltration hollow fiber membranes. The effects of varying DER, AGL, CBT, BFR, and PT on rejection were explored via RSM. The ANOVA results displayed that the main effect of AGL and interaction of AGL with BFR are the most significant factors that influence the rejection performance of PES ultrafiltration hollow fiber membranes. The rejection model developed using RSM is considerably accurate and it can be utilized for prediction purposes within the limits of the variables investigated. In addition to this, the plots of surface and contour are absolutely beneficial in visualizing the main and interaction effects of the variables. According to the regression model, a maximum rejection of 99.48% could be achieved under the following preparation conditions: a dope extrusion rate of 2.13 cm3/min, an air gap length of 0 cm, a coagulation bath temperature of 30 °C, and a bore fluid ratio (NMP/H2O) of 0.01/99.99 wt %.
At this point, it is relevant to highlight that using these proposed optimal spinning conditions represents an effective approach to produce PES ultrafiltration hollow fiber membranes used in oily wastewater treatment.

Acknowledgments

The authors would like to thank the Ministry of Higher Education (MOHE) and Universiti Teknologi Malaysia (UTM) for the financial support given to this research through the Long Term Research Grant Scheme (LRGS) (Funding number: 4L804). Also, the authors would like to thank the Advanced Membrane Technology Center (AMTEC), UTM for its technical support.

Author Contributions

The research conducted in this paper is part of a PhD thesis of Noor Adila Aluwi Shakir under the guidance of Kuan Yew Wong, Mohd Yusof Noordin and Izman Sudin. All authors have read and approved the final manuscript.

Conflicts of Interest

The authors declare no conflict of interest.

References

  1. Howe, C.; Smith, J.B.; Henderson, J. Climate Change and Water: International Perspectives on Mitigation and Adaptation; American Water Works Association: Denver, CO, USA; IWA Publishing: London, UK, 2010. [Google Scholar]
  2. Mujeriego, R.; Asano, T. The role of advanced treatment in wastewater reclamation and reuse. Water Sci. Technol. 1999, 40, 1–9. [Google Scholar]
  3. Sójka-Ledakowicz, J.; Koprowski, T.; Machnowski, W.; Knudsen, H.H. Membrane filtration of textile dyehouse wastewater for technological water reuse. Desalination 1998, 119, 1–10. [Google Scholar] [CrossRef]
  4. Sadr Ghayeni, S.B.; Madaeni, S.S.; Fane, A.G.; Schneider, R.P. Aspects of microfiltration and reverse osmosis in municipal wastewater reuse. Desalination 1996, 106, 25–29. [Google Scholar] [CrossRef]
  5. Fähnrich, A.; Mavrov, V.; Chmiel, H. Membrane processes for water reuse in the food industry. Desalination 1998, 119, 213–216. [Google Scholar] [CrossRef]
  6. Fane, A.G. Membranes for water production and wastewater reuse. Desalination 1996, 106, 1–9. [Google Scholar] [CrossRef]
  7. Qin, J.J.; Chung, T.S.; Cao, C.; Vora, R.H. Effect of temperature on intrinsic permeation properties of 6FDA-Durene/1,3-phenylenediamine (mPDA) copolyimide and fabrication of its hollow fiber membranes for CO2/CH4 separation. J. Membr. Sci. 2005, 250, 95–103. [Google Scholar] [CrossRef]
  8. Khayet, M.; Feng, C.Y.; Khulbe, K.C.; Matsuura, T. Preparation and characterization of polyvinylidene fluoride hollow fiber membranes for ultrafiltration. Polymer 2002, 43, 3879–3890. [Google Scholar] [CrossRef]
  9. Chung, T.S.; Hu, X. Effect of air-gap distance on the morphology and thermal properties of polyethersulfone hollow fibers. J. Appl. Polym. Sci. 1997, 66, 1067–1077. [Google Scholar] [CrossRef]
  10. Chung, T.S.; Qin, J.J.; Gu, J. Effect of shear rate within the spinneret on morphology, separation performance and mechanical properties of ultrafiltration polyethersulfone hollow fiber membranes. Chem. Eng. Sci. 2000, 55, 1077–1091. [Google Scholar] [CrossRef]
  11. Chung, T.S.; Qin, J.J.; Huan, A.; Toh, K.C. Visualization of the effect of die shear rate on the outer surface morphology of ultrafiltration membranes by AFM. J. Membr. Sci. 2002, 196, 251–266. [Google Scholar] [CrossRef]
  12. Xu, Z.L.; Qusay, F.A. Polyethersulfone (PES) hollow fiber ultrafiltration membranes prepared by PES/non-solvent/NMP solution. J. Membr. Sci. 2004, 233, 101–111. [Google Scholar] [CrossRef]
  13. Chung, T.S.; Teoh, S.K.; Lau, W.W.Y.; Srinivasan, M.P. Effect of shear stress within the spinneret on hollow fiber membrane morphology and separation performance. Ind. Eng. Chem. Res. 1998, 37, 3930–3938. [Google Scholar] [CrossRef]
  14. Ismail, A.F.; Mustaffar, M.I.; Illias, R.M.; Abdullah, M.S. Effect of dope extrusion rate on morphology and performance of hollow fibers membrane for ultrafiltration. Sep. Purif. Technol. 2006, 49, 10–19. [Google Scholar] [CrossRef]
  15. Qin, J.J.; Wang, R.; Chung, T.S. Investigation of shear stress effect within a spinneret on flux, separation and thermomechanical properties of hollow fiber ultrafiltration membranes. J. Membr. Sci. 2000, 175, 197–213. [Google Scholar] [CrossRef]
  16. Kapantaidakis, G.C.; Koops, G.H.; Wessling, M. Effect of spinning conditions on the structure and the gas permeation properties of high flux polyethersulfone-polyimide blend hollow fibers. Desalination 2002, 144, 121–125. [Google Scholar] [CrossRef]
  17. Khayet, M. The effect of air gap length on the internal and external morphology of hollow fiber membranes. Chem. Eng. Sci. 2003, 58, 3091–3104. [Google Scholar] [CrossRef]
  18. Qin, J.J.; Gu, J.; Chung, T.S. Effect of wet and dry-jet wet spinning on the shear-induced orientation during the formation of ultrafiltration hollow fiber membranes. J. Membr. Sci. 2001, 182, 57–75. [Google Scholar] [CrossRef]
  19. Khayet, M.; Cojocaru, C.; Essalhi, M.; García-Payo, M.C.; Arribas, P.; García-Fernández, L. Hollow fiber spinning experimental design and analysis of defects for fabrication of optimized membranes for membrane distillation. Desalination 2012, 287, 146–158. [Google Scholar] [CrossRef]
  20. Montgomery, D.C. Design and Analysis of Experiments, 4th ed.; John Wiley & Sons: New York, NY, USA, 1996. [Google Scholar]
  21. Ismail, A.F. Novel Studies of Molecular Orientation in Synthetic Polymeric Membranes for Gas Separation. Ph.D. Thesis, University of Strathclyde, Glasgow, UK, 1997. [Google Scholar]
  22. Makki, H.F.; Al-Alawy, A.F.; Al-Hassani, M.H.; Rashad, Z.W. Membranes separation process for oily wastewater treatment. J. Eng. 2011, 17, 235–252. [Google Scholar]
  23. Ong, C.S.; Lau, W.J.; Goh, P.S.; Ng, B.C.; Ismail, A.F. Preparation and characterization of PVDF-PVP-TiO2 composite hollow fiber membranes for oily wastewater treatment using submerged membrane system. Desalin. Water Treat. 2015, 53, 1213–1223. [Google Scholar]
  24. Al-Alawy, A.F.; Al-Musawi, S.M. Microfiltration membranes for separating oil/water emulsion. Iraqi J. Chem. Petrol. Eng. 2013, 14, 53–70. [Google Scholar]
  25. Oliveira de Lima, L.M.; da Silva, J.H.; Ribeiro Patricio, A.A.; de Barros Neto, E.L.; Dantas Neto, A.A.; de Castro Dantas, T.N.; de Alencar Moura, M.C.P. Oily wastewater treatment through a separation process using bubbles without froth formation. Petrol. Sci. Technol. 2008, 26, 994–1004. [Google Scholar] [CrossRef]
  26. Sekman, E.; Top, S.; Uslu, E.; Varank, G.; Bilgili, M.S. Treatment of oily wastewater from port waste reception facilities by electrocoagulation. Int. J. Environ. Res. 2011, 5, 1079–1086. [Google Scholar]
  27. Agustin, M.B.; Sengpracha, W.P.; Phutdhawong, W. Electrocoagulation of palm oil mill effluent. Int. J. Environ. Res. Public Health 2008, 5, 177–180. [Google Scholar] [CrossRef] [PubMed]
  28. Kurian, J.; Natarajan, K. Studies on wastewater from automobile service stations. Indian J. Environ. Health 1997, 39, 37–43. [Google Scholar]
  29. Patterson, J.W. Industrial Wastewater Treatment Technology, 2nd ed.; Butterworth: Stoneham, MA, USA, 1985. [Google Scholar]
  30. Kim, I.C.; Yun, H.G.; Lee, K.H. Preparation of asymmetric polyacrylonitrile membrane with small pore size by phase inversion and post-treatment process. J. Membr. Sci. 2002, 199, 75–84. [Google Scholar] [CrossRef]
  31. Wan, L.S.; Xu, Z.K.; Huang, X.J.; Che, A.F.; Wang, Z.G. A novel process for the post-treatment of polyacrylonitrile-based membranes: Performance improvement and possible mechanism. J. Membr. Sci. 2006, 277, 157–164. [Google Scholar] [CrossRef]
  32. Wang, D.; Li, K.; Teo, W.K. Porous PVDF asymmetric hollow fiber membranes prepared with the use of small molecular additives. J. Membr. Sci. 2000, 178, 13–23. [Google Scholar] [CrossRef]

