Article

A Simplified Methodology for Evaluating the Impact of Point Thermal Bridges on the High-Energy Performance of a Passive House

by
Jolanta Šadauskienė
1,*,
Juozas Ramanauskas
1,2,
Lina Šeduikytė
1,
Mindaugas Daukšys
1 and
Algimantas Vasylius
1
1
Faculty of Civil Engineering and Architecture, Kaunas University of Technology, Studentų st. 48, Kaunas LT-51367, Lithuania
2
Institute of Architecture and Construction of Kaunas University of Technology, Tunelio st. 60, Kaunas LT-44405, Lithuania
*
Author to whom correspondence should be addressed.
Sustainability 2015, 7(12), 16687-16702; https://0-doi-org.brum.beds.ac.uk/10.3390/su71215840
Submission received: 9 November 2015 / Revised: 10 December 2015 / Accepted: 14 December 2015 / Published: 17 December 2015

Abstract

:
In the design of high-energy performance buildings with ventilated facade systems, the evaluation of point thermal bridges is complicated and is often ignored in practice. This paper analyzes the relationship between the point thermal bridges resulting from aluminum fasteners, which are used for installation facades cladding, and the thermal properties of materials that are used in external walls layers and dimension of layers. Research has shown that the influence of the point thermal bridges on the U-value of the entire wall may achieve an average of up to 30% regarding thermal properties of materials of the external wall layers and the dimension of layers. With the increase in thermal conductivity of the bearing layer material and the thickness of the thermal insulation layer, the point thermal transmittance χ-value increased. For this reason, the U-value of the entire wall may increase by up to 35%. With the increase of the thickness of the bearing layer and thermal conductivity value of thermal insulation layer, the point thermal transmittance χ-value decreased by up to 28%. A simplified methodology is presented for the evaluation of point thermal bridges based on the thermal and geometrical properties of external wall layers.

Graphical Abstract

1. Introduction

In the design of high-energy performance buildings according to Passive House standards, it is necessary to identify and evaluate the factors that increase a building’s energy losses. Because the air flow must be carefully considered and assessed, energy consumption should be below 15 kWh/m2/year. One such factor is the thermal bridge, where the thermal resistance of the building envelope is significantly changed by full or partial penetration of the building envelope by materials with a different thermal conductivity, and/or a change in thickness of the fabric, and/or a difference between the internal and external areas, such as occurs at wall/floor/ceiling junctions [1]. According to our literature review, the total impact of thermal bridges on the heating energy needed is considerable and can vary from 5% to 35%. Theodosiou and Papadopoulos [2] report that the majority of buildings are partially insulated and that thermal bridges are not considered by the calculation procedure, but in fact thermal losses in the cases of such buildings are up to 35% higher than initially estimated. Evola [3] found that in the mild Mediterranean climate the correction of thermal bridges turns out to be an effective measure for reducing the primary energy needs for heating. On average, the overall annual energy savings approximate 8.5%. Ascione [4] learned that thermal bridges can increase the heating demand of buildings by over 20%. This influence depends on weather conditions [5], level of insulation [6], the thermal bridges’ construction [7,8,9], the type of building (use and geometry), and the method used to implement its effect within the calculation of the building energy demand [4]. Approaches of thermal bridges in regulation are different in the EPBD context [10]. Thermal bridges can affect a single point, a linear area, or a spatial configuration. Usually linear thermal bridges, which occur at the junction between two or more elements of the building envelope, are evaluated in the calculations of the building energy demand. There are numerous scientific studies where linear thermal bridges have been investigated by different calculation and simulation methodologies, such as static/dynamic and 1D/2D/3D. Gao [11] and Tadeu [12] used a reduction technique to reduce the complexity of a 3D heat transfer model. Ascione [13,14] used a 2D and 1D numerical model due to the comparing effects of thermal bridges between calculated and measured values. Sierra [15] used a 2D model to assess thermal bridges, because they occur around windows.
Linear thermal bridges can be implemented through the analysis of each thermogram corresponding to an object’s surface temperature [16,17,18]. Bianchi [19] said that thermographic analysis allows for the identification of thermal bridges in buildings’ envelope. However, this method does not indicate the value of thermal transmittance.
Most studies present empirical relationships of linear thermal bridges, from which the thermal transmittance ψ value of certain construction elements can be determined [7,20]. Based on these values, numerical calculation software is created and catalogues are prepared. The European Standard [21], which contains 76 cases referring to eight typologies of thermal bridges (roofs, corners, intermediate floors, internal walls, slab-on-ground floors, suspended ground floors, pillars, and windows and door openings) is one of the most commonly used atlases. However, in the case of point thermal bridges, their effect is often neglected in analyses aimed at defining the building energy performance [10]. Nevertheless, it is an important factor in the design of high-energy performance buildings. It is especially important in the design of buildings with ventilated facade systems, where profiles of thermal insulation panels are fixed directly to the bearing layer of walls or brackets are used in order to reduce the influence of a thermal bridge on the properties of the thermal insulation layer [22]. Studies show that if solid metal profiles (which penetrate the thermal insulation layer) are used to fix thermal insulation, the thermal resistance might be cut in half [23,24,25]. If these additional heat losses incurred due to point thermal transmittance are neglected or evaluated incorrectly, the energy efficiency calculations for the building may be incorrect. Therefore, the selection of heating systems may be problematic as the required indoor temperature conditions will not be ensured because of extreme outdoor and indoor temperature differences. Angelis and Serra [26] state that this may be the cause for moisture condensation and mold growth in places where there are thermal bridges.
In practice, in order to know the true value of a point thermal bridge, numerical simulations or experimental measurements of a specific construction must be done. However, it is difficult to evaluate the point thermal transmittance without special software in the design stage [27]. Therefore, in the design stage it is important to apply the simplified methodology for the evaluation of the point thermal transmittance, which includes thermal and geometrical properties of construction materials.
The aims of this work were to: evaluate the point thermal transmittance χ-value of the aluminum fastener that penetrates the thermal insulation; and obtain an empirical relationship that would help predict the point thermal transmittance χ-value according to the thickness of the thermal insulation material, the value of thermal conductivity coefficient of the thermal insulation layer, and the type of bearing layer material; and to develop a simplified methodology for evaluating point thermal bridges for high-energy performance based on Passive House.

2. Methodology

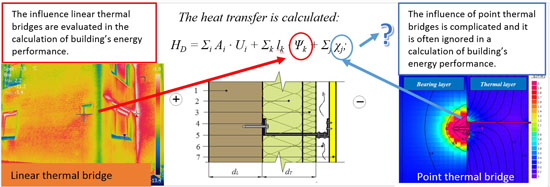
2.1. Calculation of U-value of Building Element Assessing Thermal Bridges

Calculation of the direct heat transfer coefficient includes the contribution due to thermal bridges, according to EN ISO 14683 [21] (Equation (1)):
h D = i A i · U i + k l k · Ψ k + j χ j
Thermal bridges may be defined according to EN ISO 10211 [1]. The linear thermal transmittance (Ψ) of linear thermal bridge is calculated from Equation (2):
Ψ = L 2 D U j · l j
Linear thermal transmittance values depend on the system of dimensions used in calculating the areas of 1-D heat flow, i.e. in the calculation of (ΣUjlj) (Equation (2)). However, the heat transfer coefficient hD is the same provided that all thermal bridges are taken into account (Equation (1)). It means that the point thermal transmittance should be evaluated.
In practice, the influence of point thermal bridges (insofar as they result from the intersection of linear thermal bridges) is neglected and so the correction term involving point thermal bridges can be omitted from Equation (1). If, however, there are significant point thermal bridges, the point thermal transmittances should be calculated in accordance with EN ISO 10211 [1]. The point thermal transmittance (χ-value) of the thermal bridges is calculated as shown in Equation (3):
χ = L 3 D i = 1 N i U i · A i j = 1 N j Ψ j · l j
To determine the point thermal transmittance χ-value of a fastener by 3-D methodology, specific heat losses through repeated surface area with a fastener H and without a fastener HS are calculated. The difference between these specific heat losses is the point thermal transmittance χ-value (Equation (4)):
χ = H H S
Since fasteners penetrate the insulation layer in local areas, their influence on heat transfer is evaluated by point thermal transmittance. If this point thermal transmittance is repetitive in the envelope, they can be evaluated using the transmittance correction factor ΔU (Equation (5)), taking into account their number in 1 m2 of the envelope or fasteners density per certain surface area of the envelope:
Δ U = χ · n
Then the thermal transmittance U-value of the envelope can be determined from EN ISO 6946 [27] (Equation (6)):
U = U i + Δ U
Calculations of Ui-values follow national requirements [28]. However, the U-value must be less than 0.15 W/(m2K), according to Passive House standards.

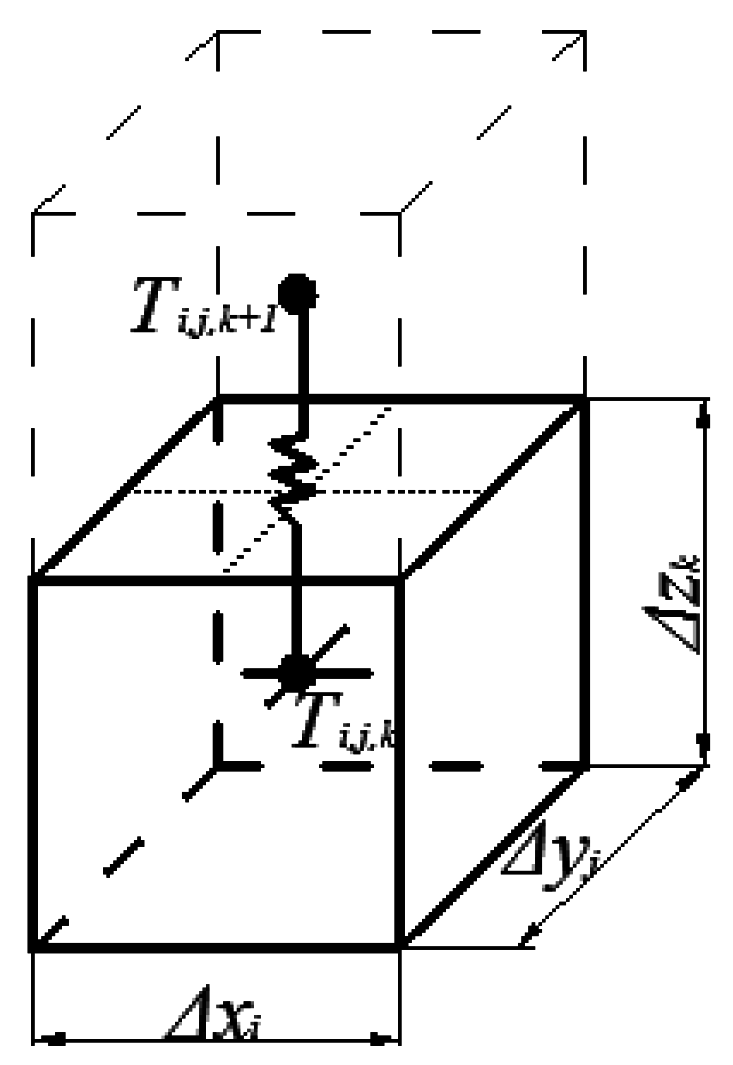
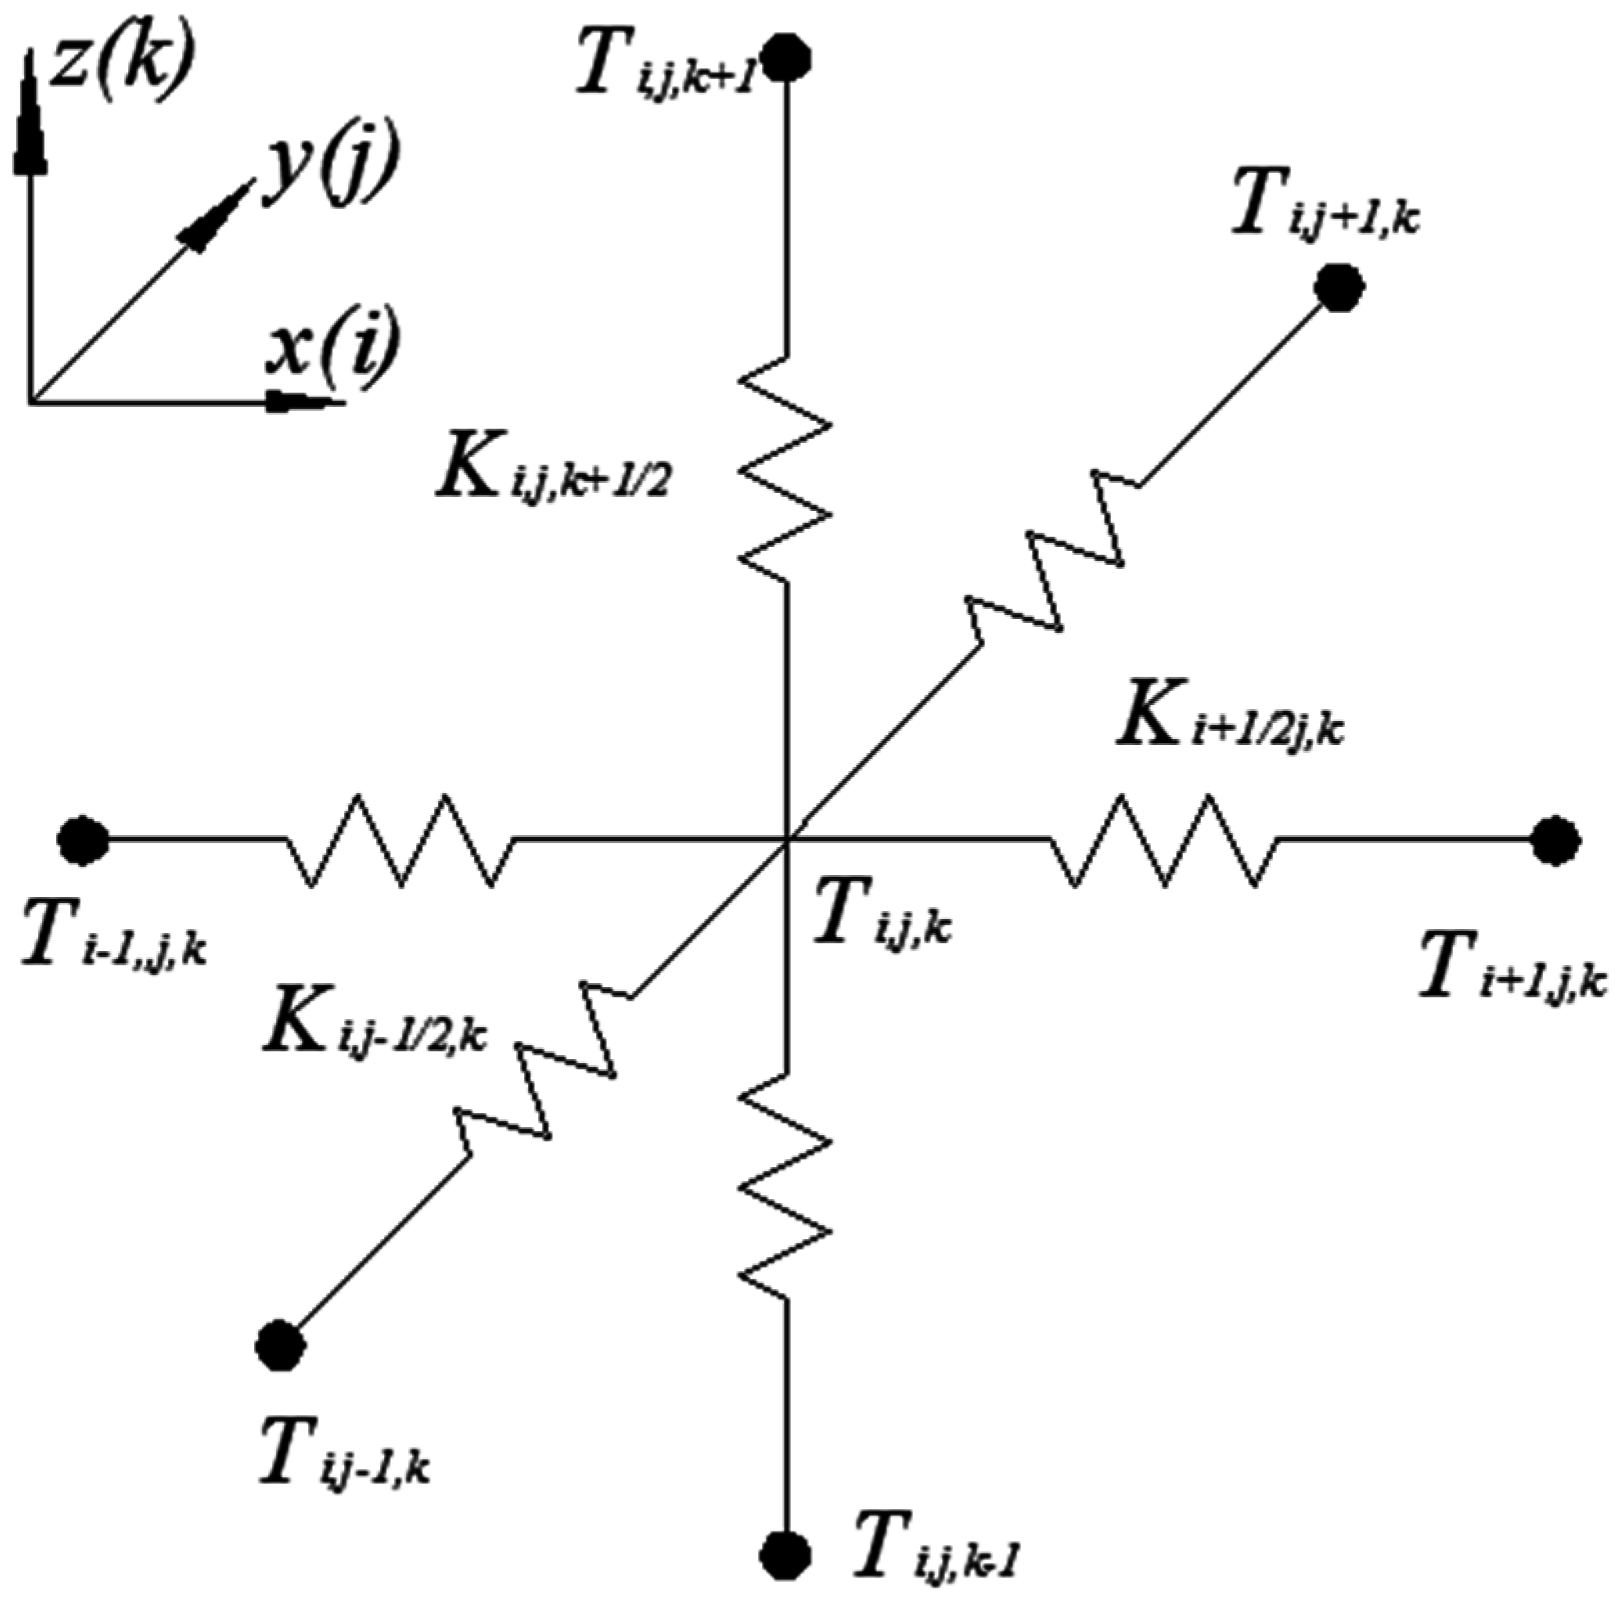
2.2. Numerical Simulation

A temperature field of calculation program, HEAT3, was used to determine the point thermal transmittance (χ-value) according to the requirements of the International Organization for Standardization (ISO) [1]. In the numerical formulation, the partial differential equation is replaced by the discrete approximation. The temperature field approximates at discrete points. This gives a computational mesh. The increments in the x, y, and z directions are denoted by Δxi, Δyj, and Δzk, respectively [29].
Figure 1 shows a cell (i,j,k) with the side lengths Δxi, Δyj, and Δzk. There are six adjacent cells. Figure 1 also shows the cell (i,j,k + 1) located directly above. The heat flow Qi,j,k+1/2 from cell (i,j,k) to cell (i,j,k + 1) is given by the thermal conductance multiplied by the temperature difference between these two cells (Equation (7)):
Q i , j , k + 1 / 2 = K i , j , k + 1 / 2 · ( T i , j , k T i , j , k + 1 )
The other five heat flows pertaining to cell (i,j,k) are calculated in the same way.
Figure 1. Computational cells (i,j,k) and (i,j,k + 1).
Sustainability 07 15840 g001
Figure 2 shows six thermal conductances of cell (i,j,k). The conductance Ki,j,k + 1/2 between the two cells (i,j,k) and (i,j,k + 1) is calculated as follows (Equation (8)) [30]:
K i , j , k + 1 / 2 = Δ x i · Δ y i Δ z k ( 2 · λ i , j , k + 1 / 2 ) + Δ z k + 1 ( 2 · λ i , j , k + 1 ) + R T i , j , k + 1 / 2 .
Figure 2. Thermal conductance connected to cell (i,j,k).
Sustainability 07 15840 g002
The first term in the denominator is the thermal resistance in the z direction for half of the cell (i,j,k); the second term is the resistance for half of the cell (i,j,k + 1). The third term, Ri,j,k + 1/2, is an optional additional thermal resistance at the interface between the two cells (i,j,k) and (i,j,k + 1).
Equation (8) is valid for all internal cells (an internal cell has at least one cell on each side). For boundary cells, Equation 8 was modified in the following way. Consider cell (1,j,k), which lies at a boundary. The conductance that couples the temperature T1,j,k with a boundary temperature was (Equation (9)):
K 1 2 , j , k = Δ y j · Δ z k Δ x 1 ( 2 · λ 1 , j , k ) + R 1 2 , j , k .
Energy balance is calculated for each cell. There are six adjacent cells. The total heat flow to cell (i,j,k) from the six adjacent cells is summed for the variable Qi,j,k (Equation (10)):
Q i,j,k = K i 1 2 , j , k ( T i 1 , j,k T i , j , k ) + K i + 1 2 , j , k ( T i + 1 , j , k T i , j , k ) + K i , j 1 2 , k ( T i , j 1 , k T i , j , k ) + K i , j + 1 2 , k ( T i , j + 1 , k T i , j , k ) + K i , j , k 1 2 ( T i , j , k 1 T i , j , k ) + K i , j , k + 1 2 ( T i , j , k + 1 T i , j , k )

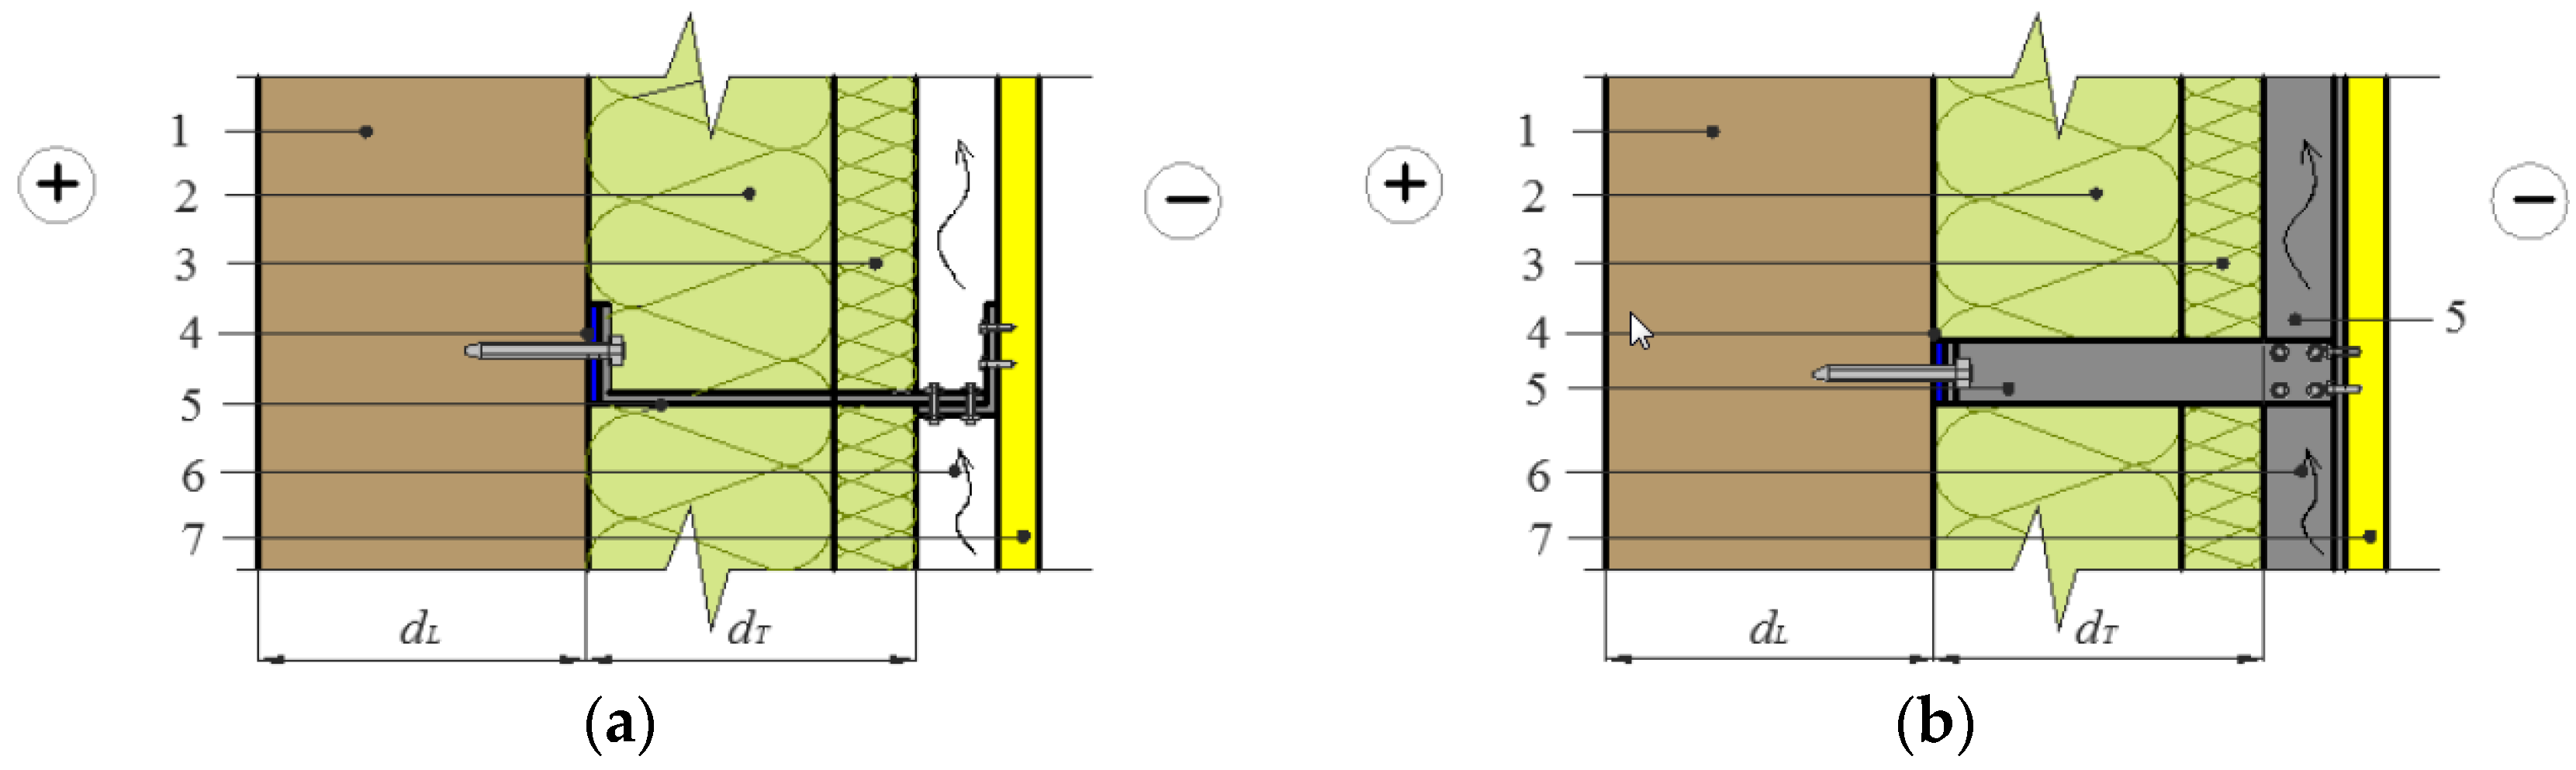
2.3. Simulation Parameters

A ventilated facade system with aluminum fastener was chosen for the calculations (Figure 3). Fastening brackets of 3 mm wall thickness and 40 mm width were used. The value of thermal conductivity of the investigated fastening bracket was λ = 160 W/(m∙K). Five millimeter thick plastic gaskets were inserted between the fixing bracket and the wall. The value of thermal conductivity of the investigated gasket was λ = 0.17 W/(m∙K). The distance between the axes of the aluminum framework elements was 600 mm in the horizontal and vertical planes. A typical element of the framework according to the axes of symmetry was 600 mm × 600 mm with fastening brackets in the middle. The surface area of such framework element was 0.36 m2, and the number of fastening brackets per 1 m2 of the wall area was n = 2.778 pcs./m2.
The χ-value of the aluminium fastener and the relationship between this value and the properties of other materials included in the structure were calculated for different variants of the structure by changing the thermal conductivity and thickness of the bearing and insulation layers (Table 1).
For the analysis of point thermal bridges, the basic variant of the structure of the wall was selected: thickness of the bearing layer dL = 200 mm, the thermal conductivity of the material of the bearing layer λL = 0.5 W/(m∙K), thickness of the insulation layer dT = 150 mm, and the thermal conductivity of the material of the insulation layer λT = 0.034 W/(m∙K).
Figure 3. The schema of investigating an external wall with a ventilated facade system, when different aluminum fastening elements were used. (a) View from the top; (b) view from side: 1- a bearing layer of a wall; 2- thermal insulation layer; 3- wind insulation layer; 4- gasket; 5- aluminium fasteners; 6- ventilated air gap; 7- facade panel.
Sustainability 07 15840 g003
Table 1. Variations of calculated parameters.
VariantsdL (mm)λL (W/ m∙K)dT (mm)λT (W/ m∙K)
Basic data2000.51500.034
12000.1 ÷ 11500.034
250 ÷ 5000.51500.034
32000.51500.030 ÷ 0.040
42000.5100 ÷ 2000.034

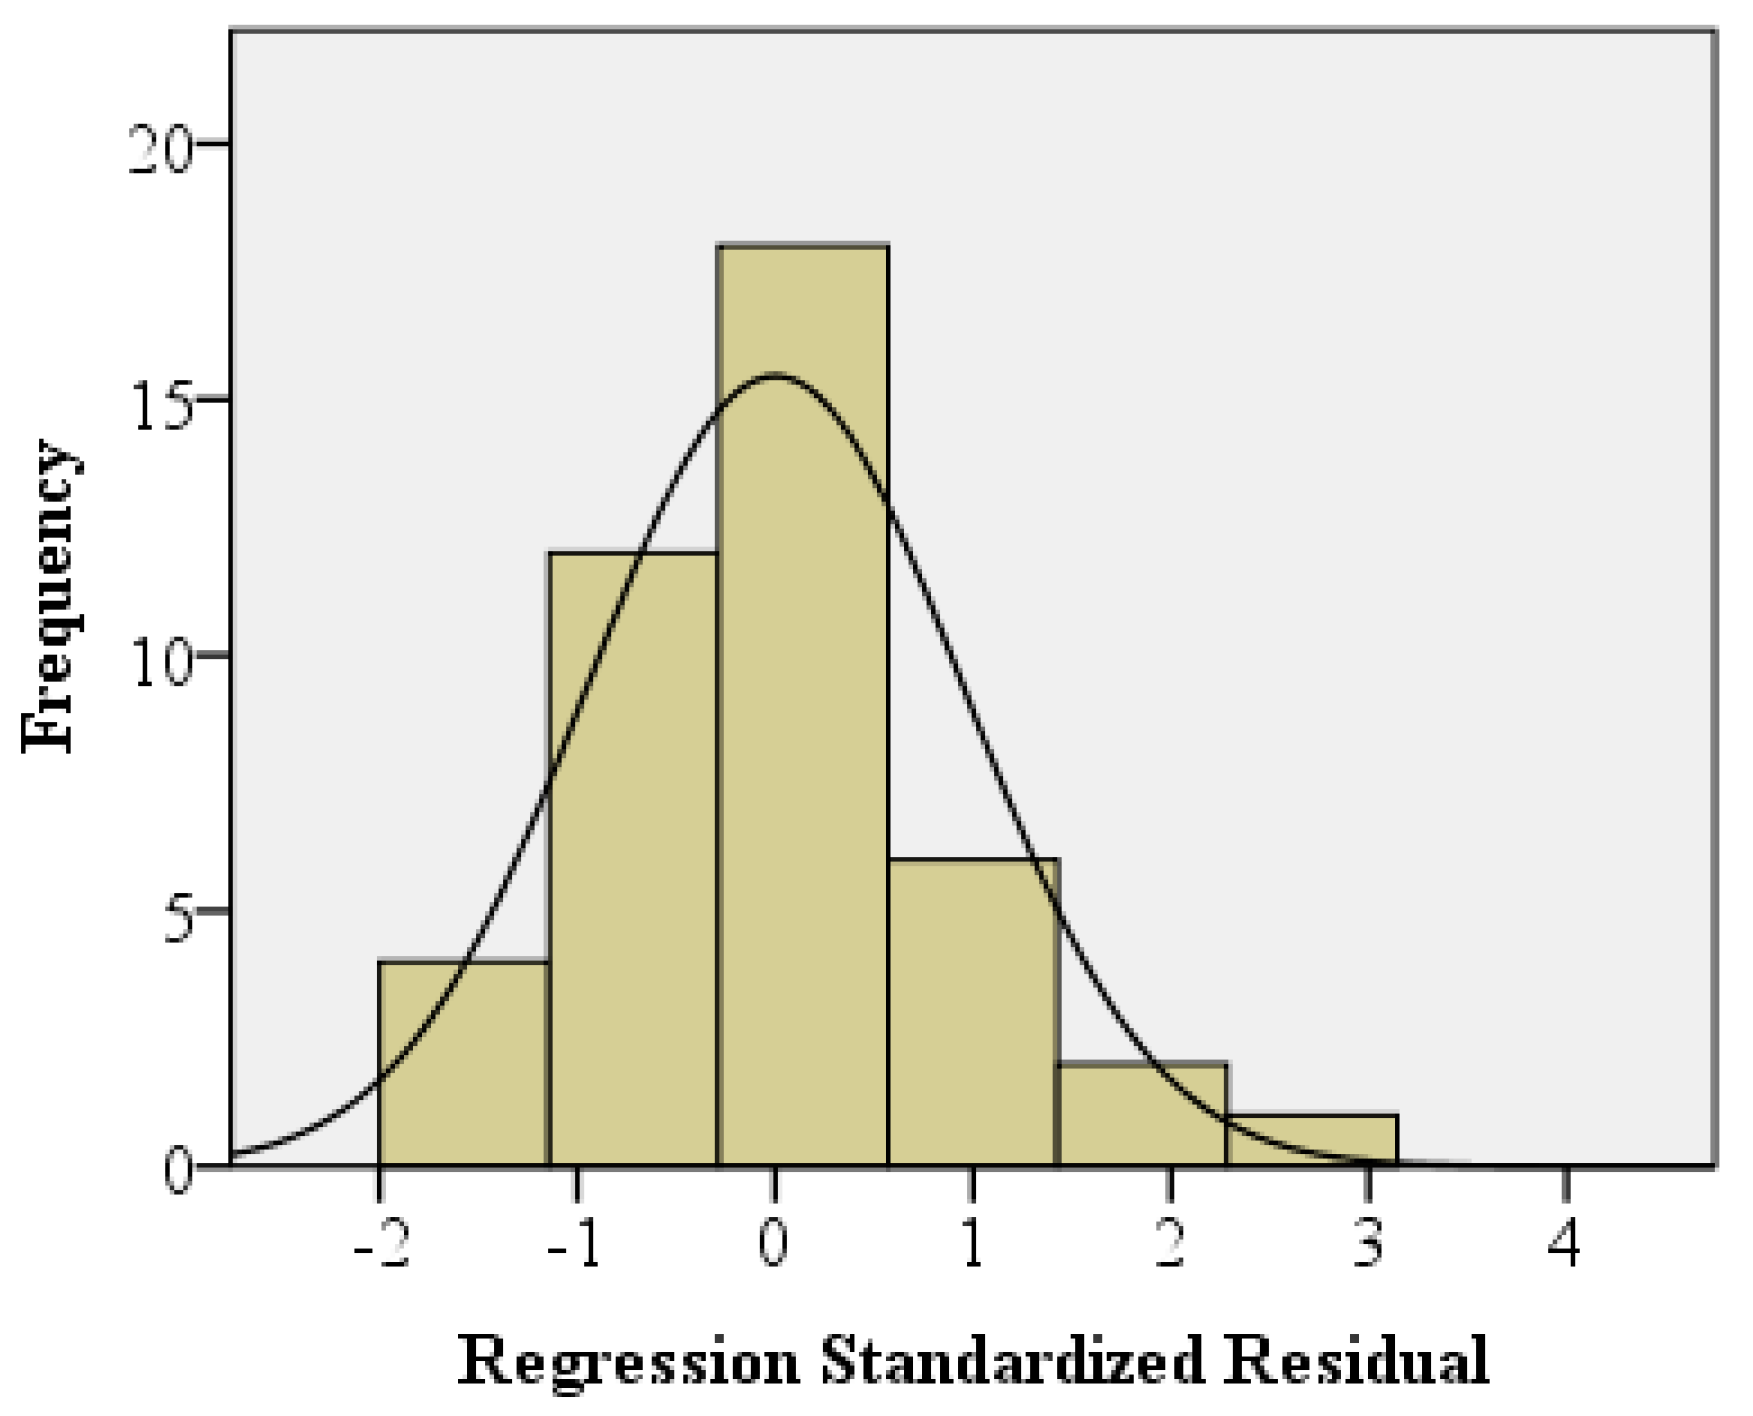
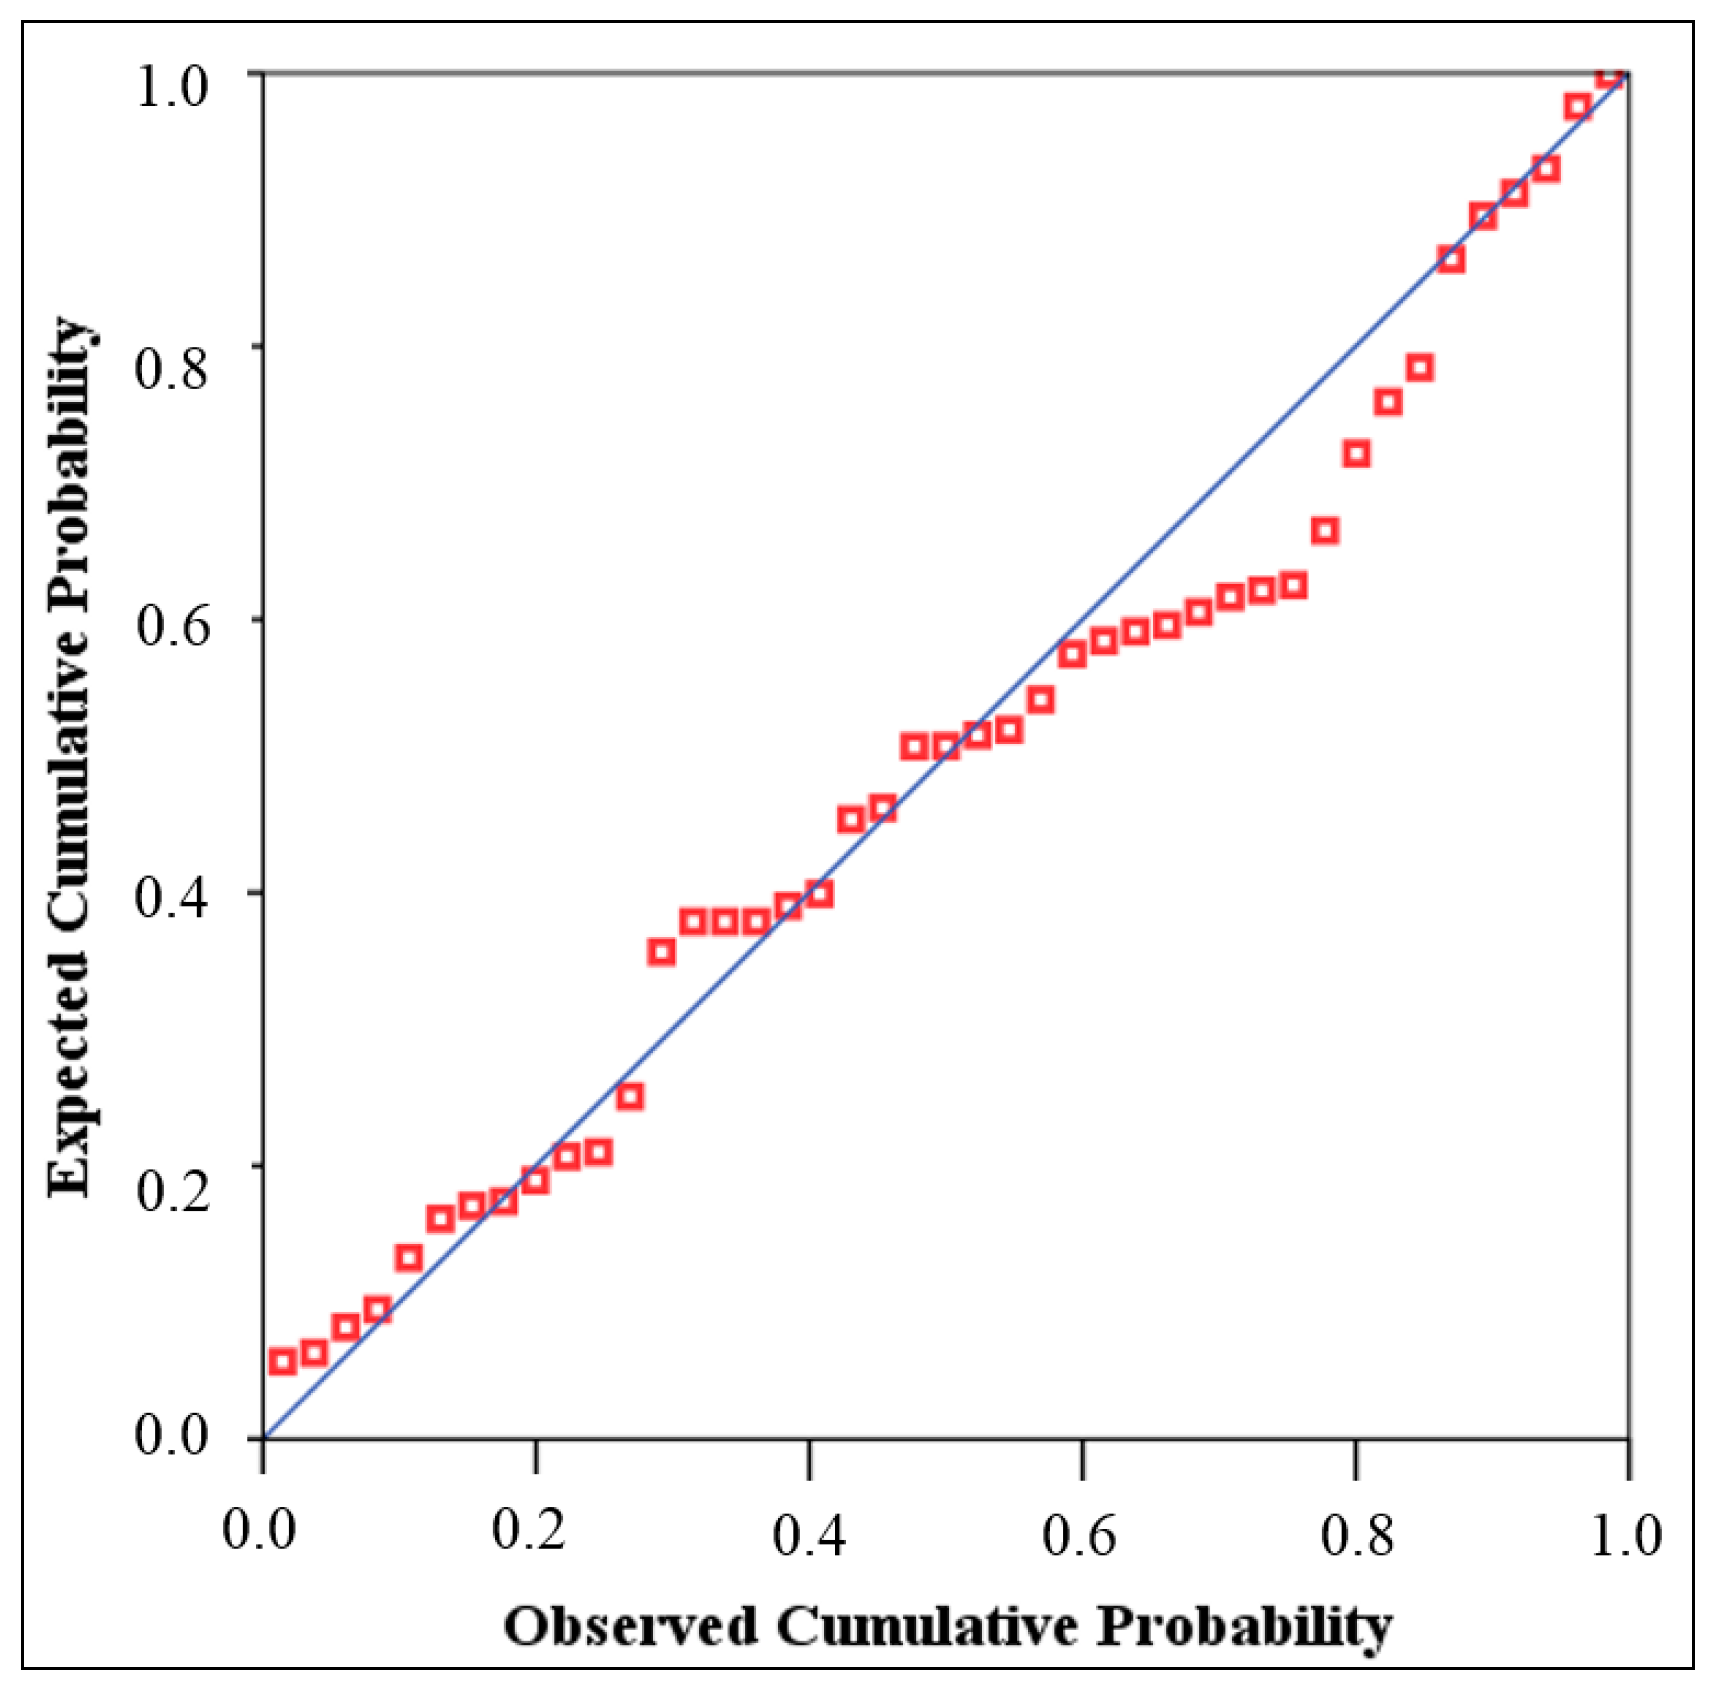
2.4. Statistical Evaluation

The linear regression approach was used in order to determine the thermal transmittance according to the relationship between the thermal conductivity of insulation material and its thickness as well as the thermal conductivity of the bearing layer material and its thickness. The aim of the regression analysis was to determine the empirical relationship and evaluate the precision of the relationship between point thermal transmittance and the properties of construction materials, as well as the reliability and accuracy of the calculation results.
The thermal bridge was the dependent variable, and the thermal conductivity of the bearing layer and insulation layer materials and the thickness of the bearing layer and insulation layer were the interval variables χ = f(λL, dL, λT, dT). Correlation coefficient R was used to evaluate the strength of association between the variables. For the statistical significance, the obtained p-value was compared to significance level α = 0.05.
The adequacy of the linear regression model was evaluated according to the value of the coefficient of determination R2, according to ANOVA p-value < 0.05, according to VIF ≤ 4 (checked for the existence of multicollinearity problem). Outliers were checked for the difference in DFBETA < 1. T (Student) tests were used to evaluate the statistical significance of the variables; a p-p plot was done to find the relative frequency of residual standard errors and random variables.
The linearity of a regression model was evaluated to verify the hypothesis (Equation (11)):
{ H 0 : β 1 = β 2 = β 3 = β 4 = 0 ;           H a : β i 0 ,           i = 1 , , 4.                      
The zero hypothesis H0 showed whether the coefficient of independent variables λLi, dLi, λTi, dTi, i = 1, 2, ..., n is equal to zero. The alternative hypothesis Ha showed whether at least one coefficient of independent variables λLi, dLi, λTi, dTi, i =1, 2, ..., n is not equal to zero. β—is the coefficient of independent variables λLi, dLi, λTi, dTi, i =1, 2, ..., n.
The hypothesis was verified by using Fisher distribution with the right critical values (Equation (12)):
F = S S R ¯ S S E ¯ ~ F ( K , n K 1 ) .

3. Results

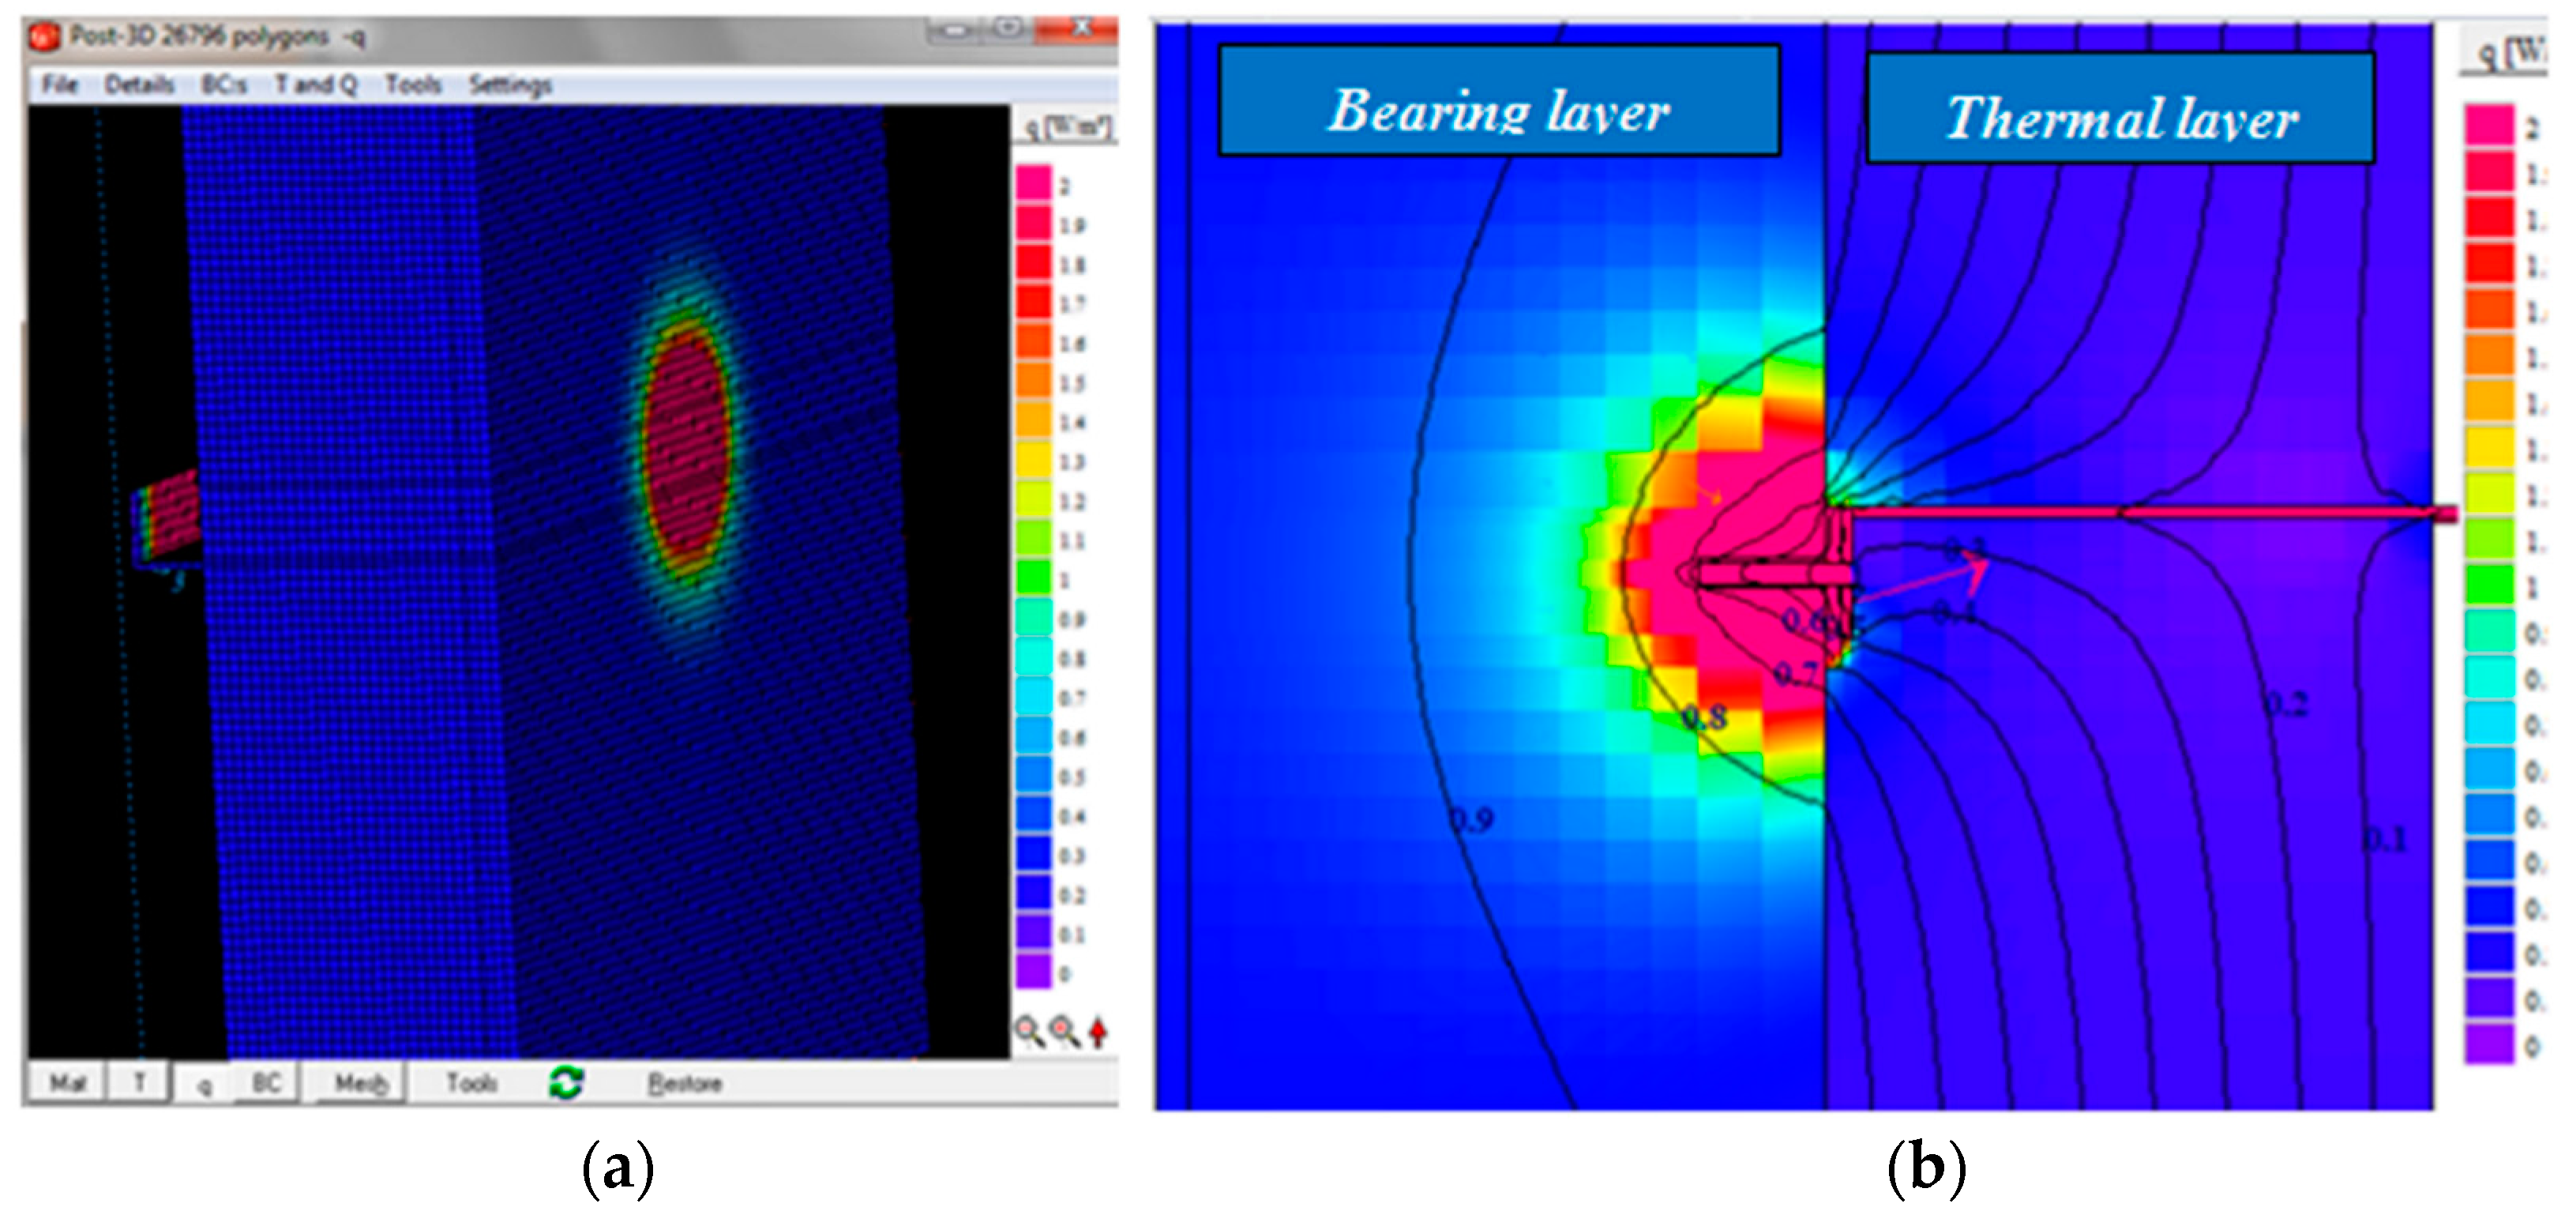
3.1. Heat Flow Behavior Through Point Thermal Bridge

A 3-D temperature field simulation was done in order It is dashto determine the influence of the point thermal bridge on the behavior of the heat flow in the external wall of the building.
Figure 4 illustrates how heat accumulation (on the cold side) or heat dissipation (on the warm side) depends on the material of the bearing layer. Heat flow increased through the point thermal bridge on the warm side of the surface of thermal insulation material layer (see Figure 4a). The area of heat dissipation depends on the thermal properties of the bearing layer. On the cold side of thermal insulation material, heat-conductive materials and surfaces created by the fasteners create good conditions for heat dissipation; therefore, the value of the thermal conductivity of the point thermal bridge will be higher. As a result, the external wall cladding fixing system is important.
Figure 4. 2D heat flow through the point thermal bridge. (a) 3D view without bearing layer; (b) 2D view.
Sustainability 07 15840 g004
The heat flow at the point thermal bridge location is not even and not parallel. Figure 4b (2-D view) better represents the trend of the heat flow through a fastener. Heat flow in materials is distributed in all directions. However, the wall consists of different layers with different thermal properties, and this distribution is uneven. On the warm side of thermal insulation material, the heat flow direction depends not only on the internal surface but also on the surrounding insulation material. On the cold side of insulation, heat flows through the thermal bridge not only outwards but also inwards into the thermal insulation material.
Fasteners that penetrate the insulation layer have much higher values of thermal conductive than the thermal insulation material; therefore, significant heat flow at the place of intersection reduces the thermal resistance efficiency of the thermal insulation material. The point thermal transmittance χ-value depends not only on the fastener type and material, but also on the properties of materials in the wall structure, such as the thickness and thermal conductivity of the thermal insulation material and the thickness and thermal conductivity of the bearing layer material.

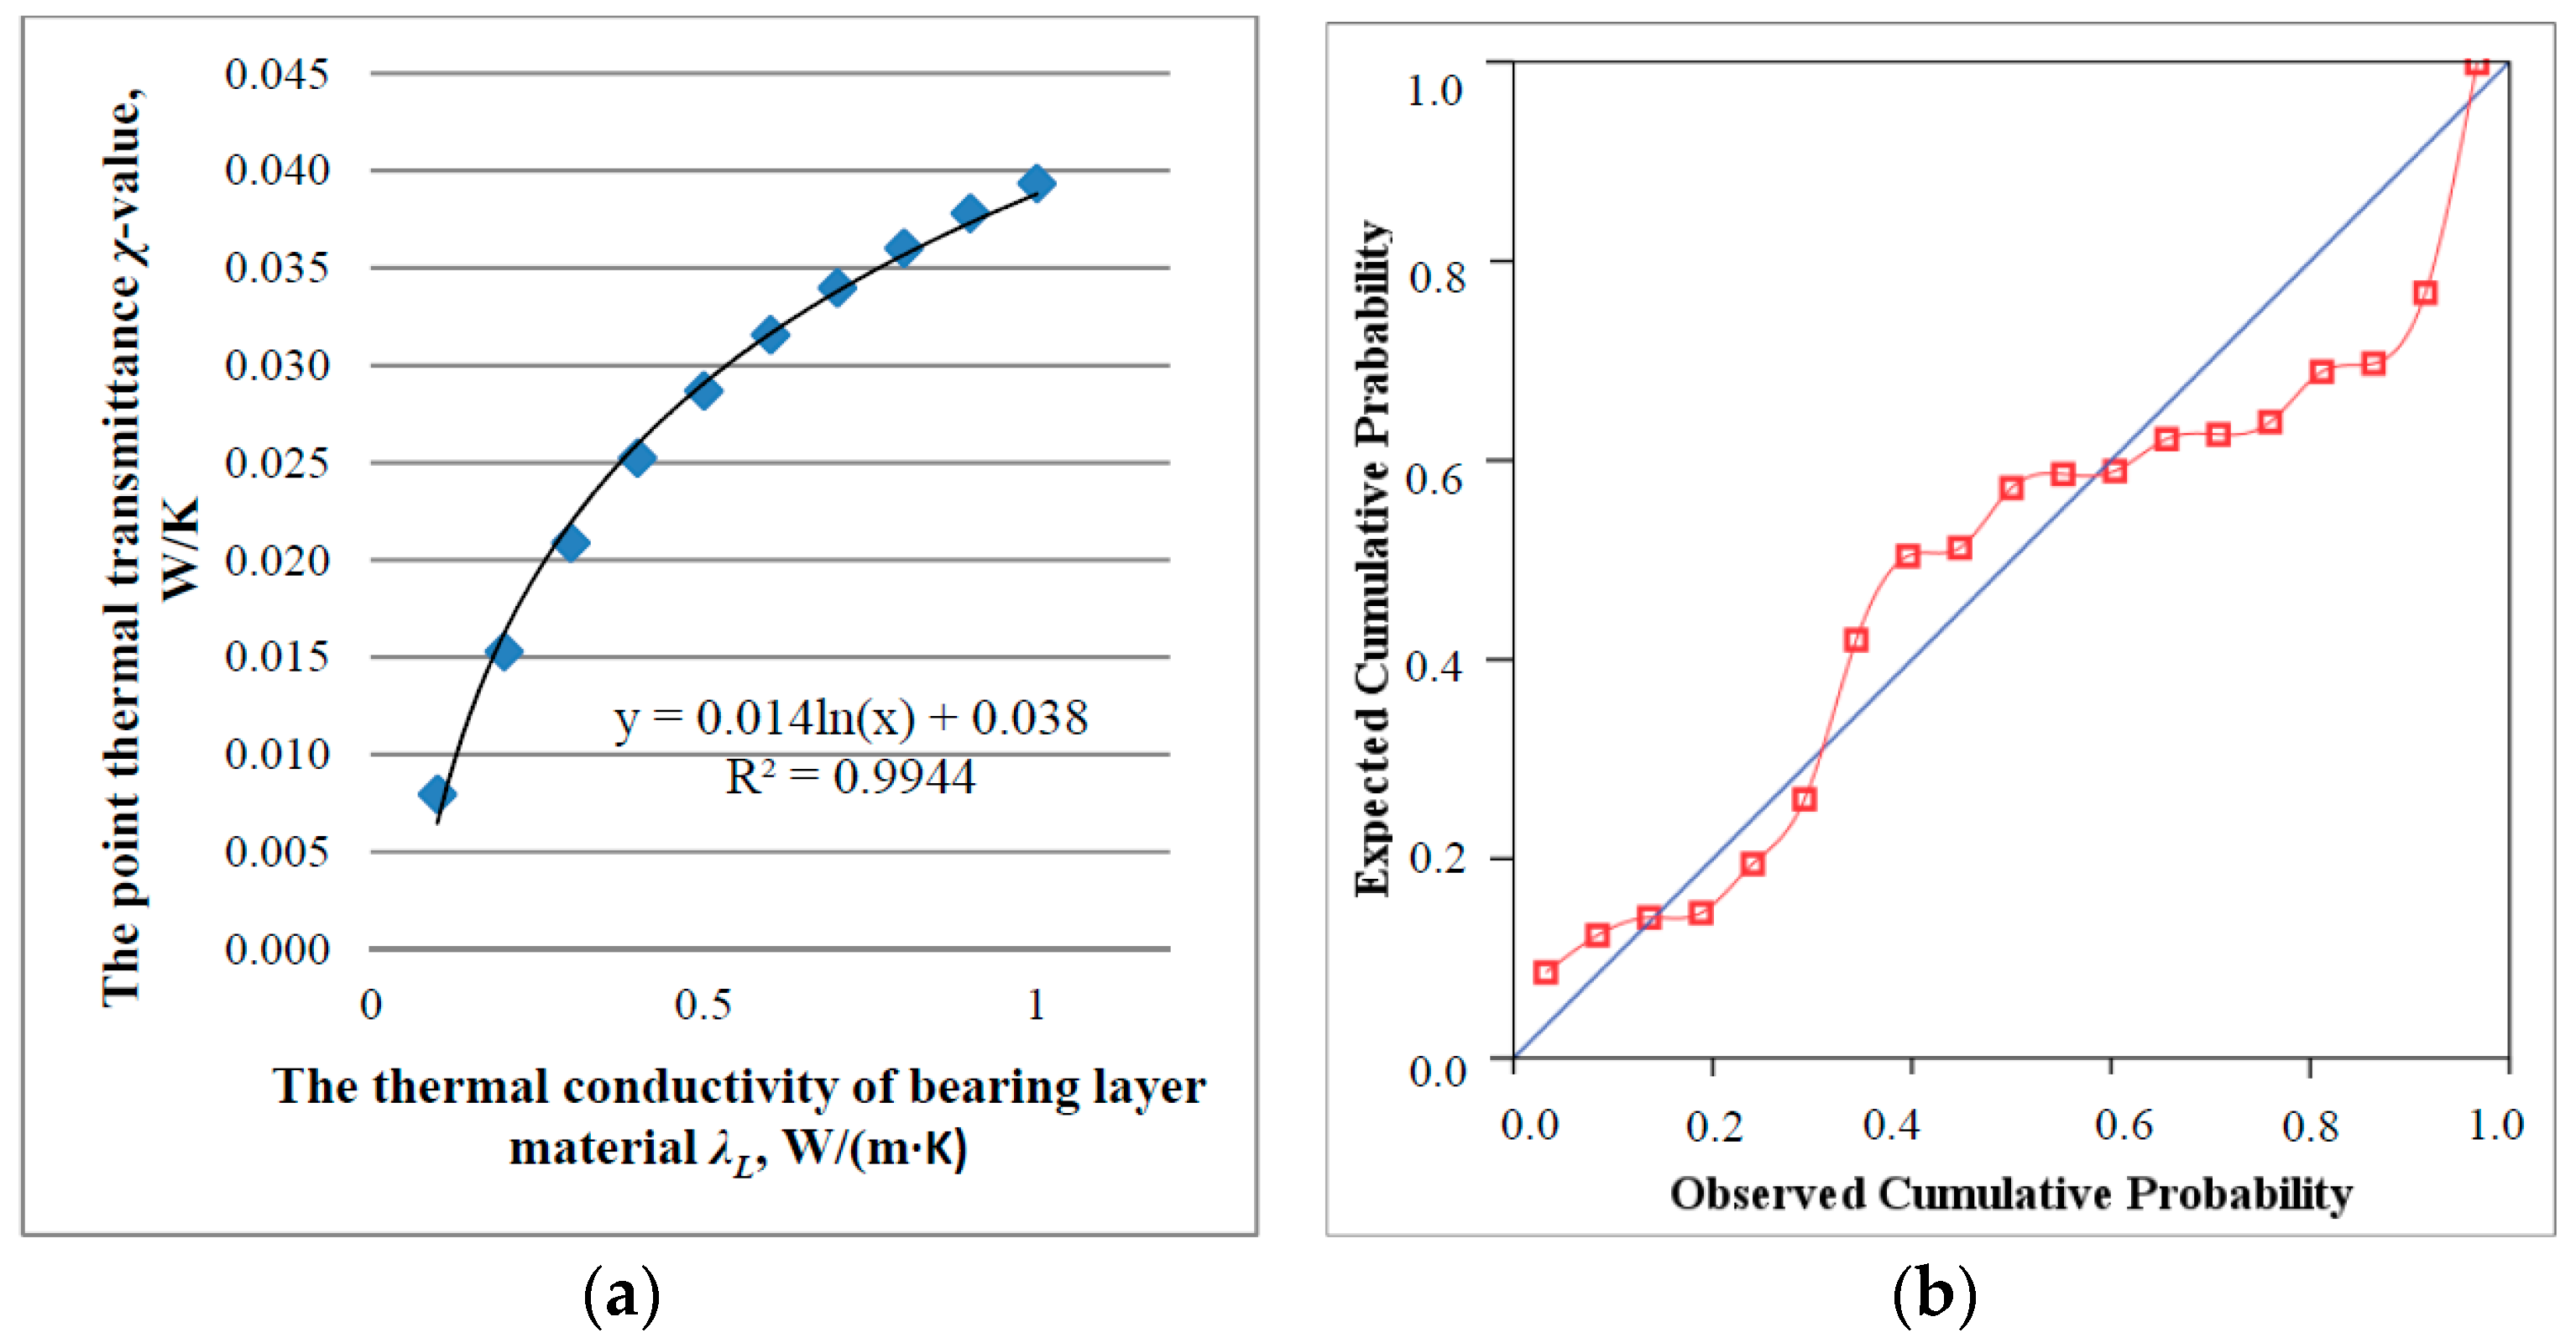
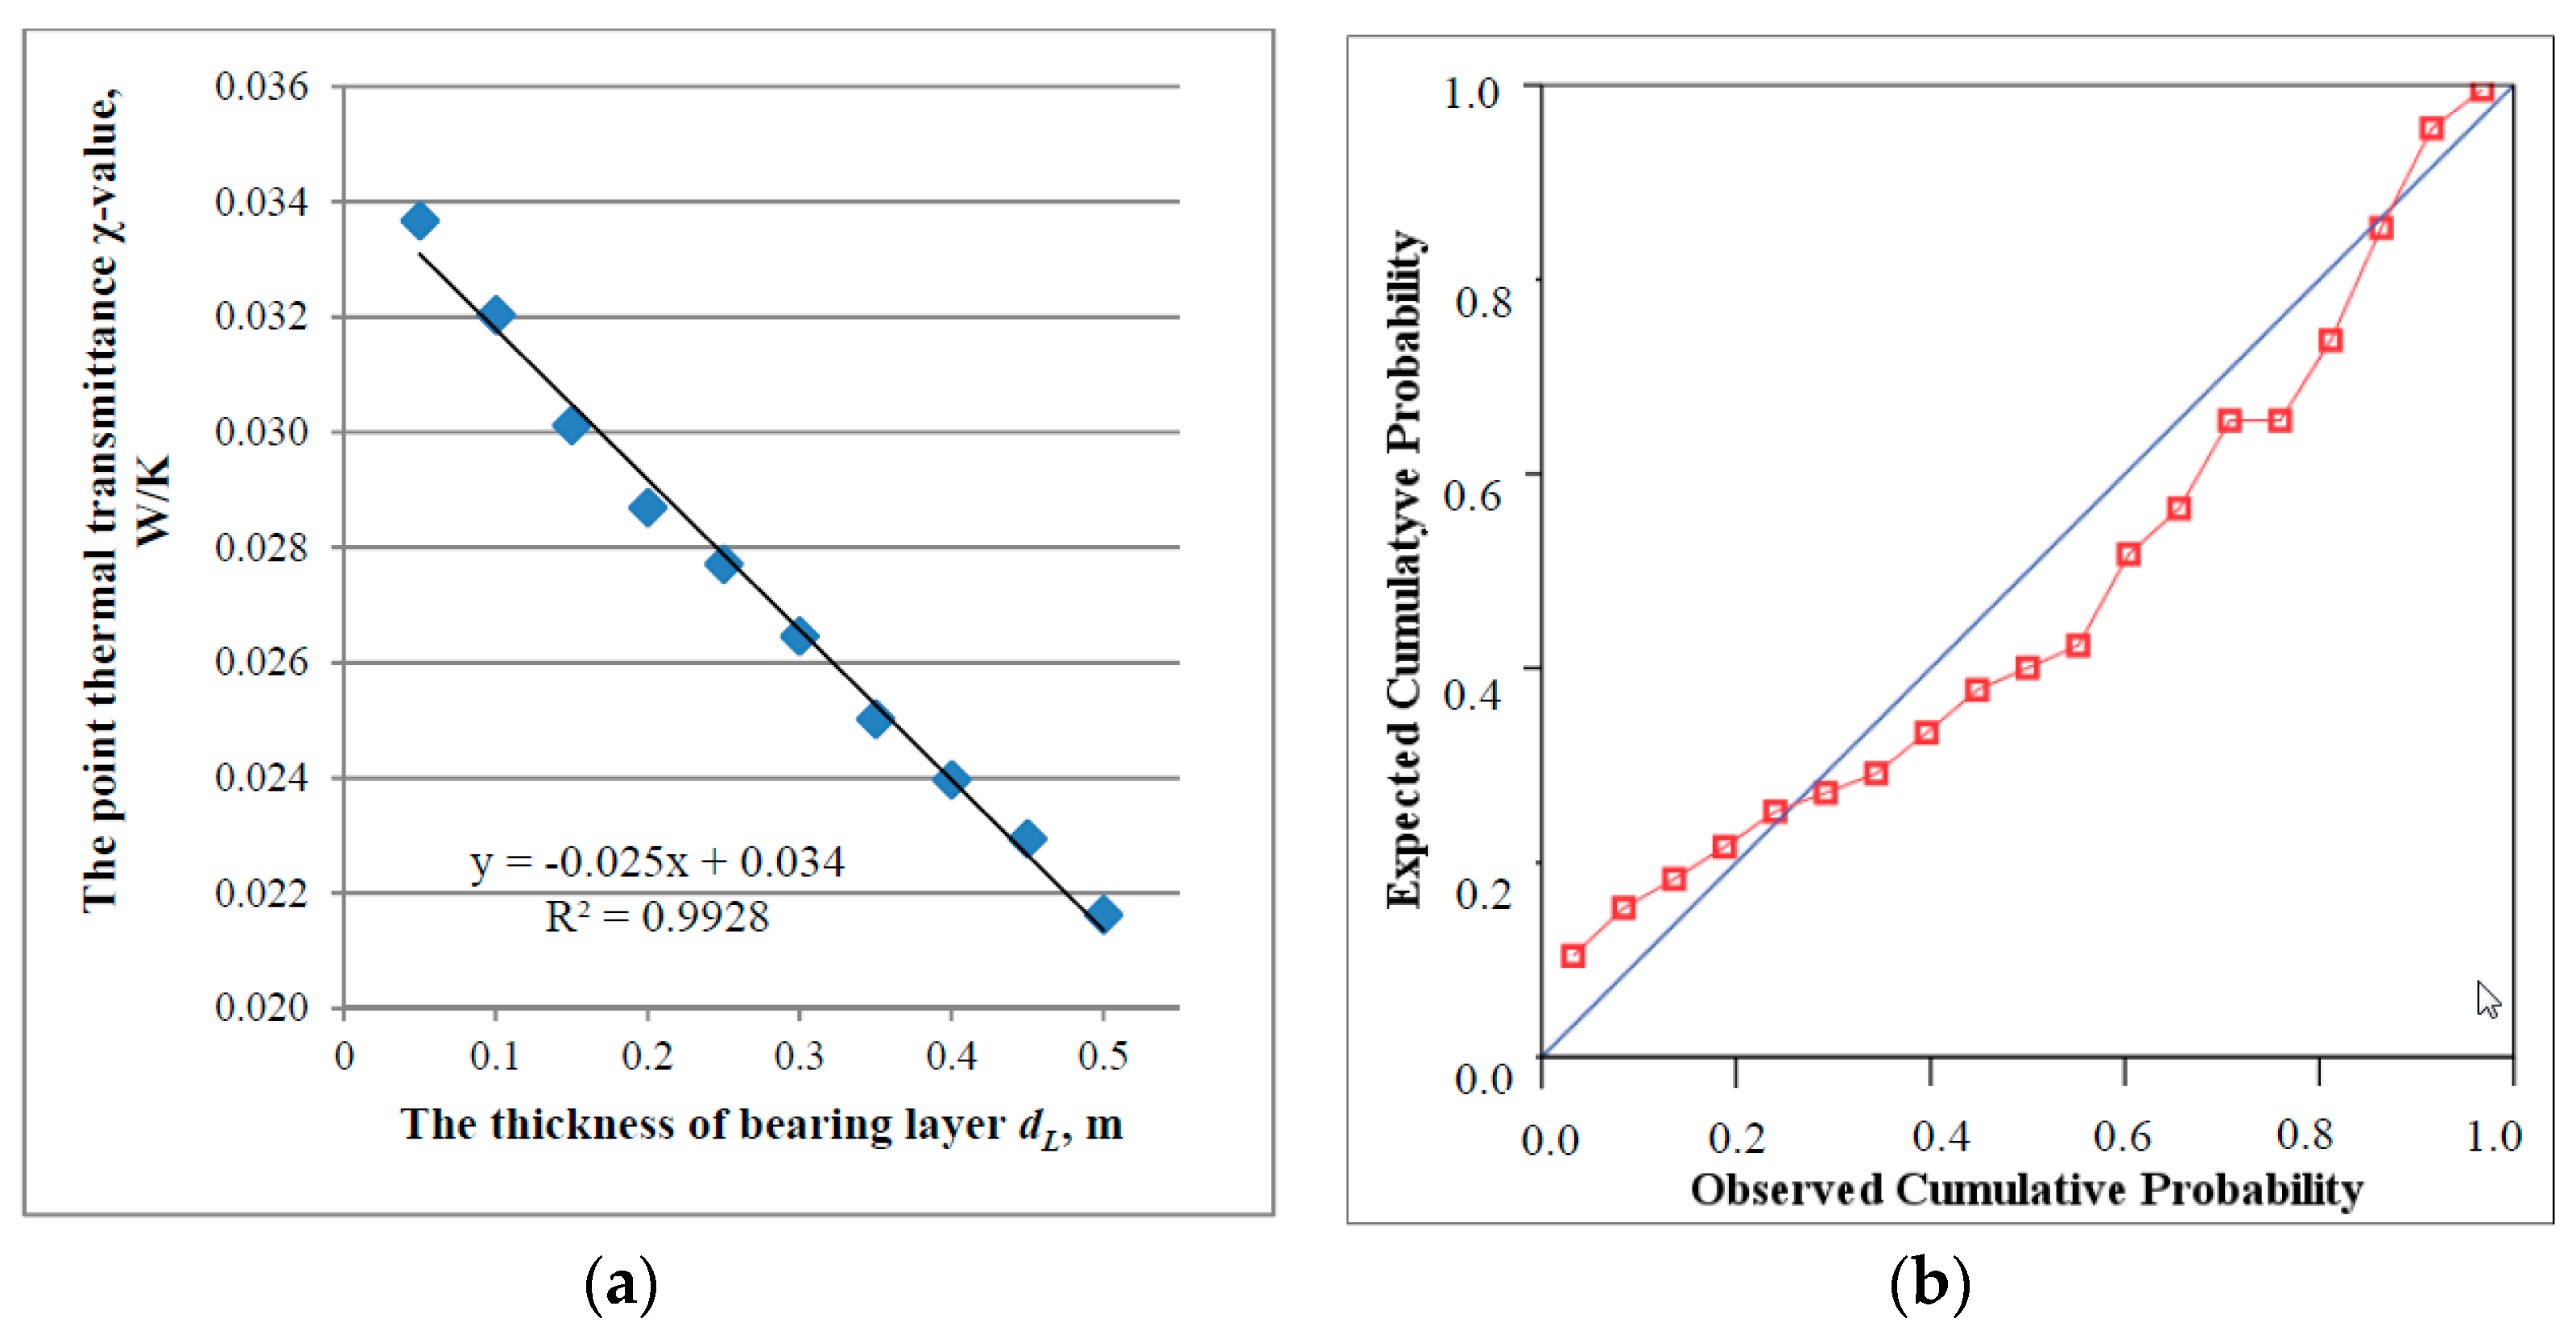
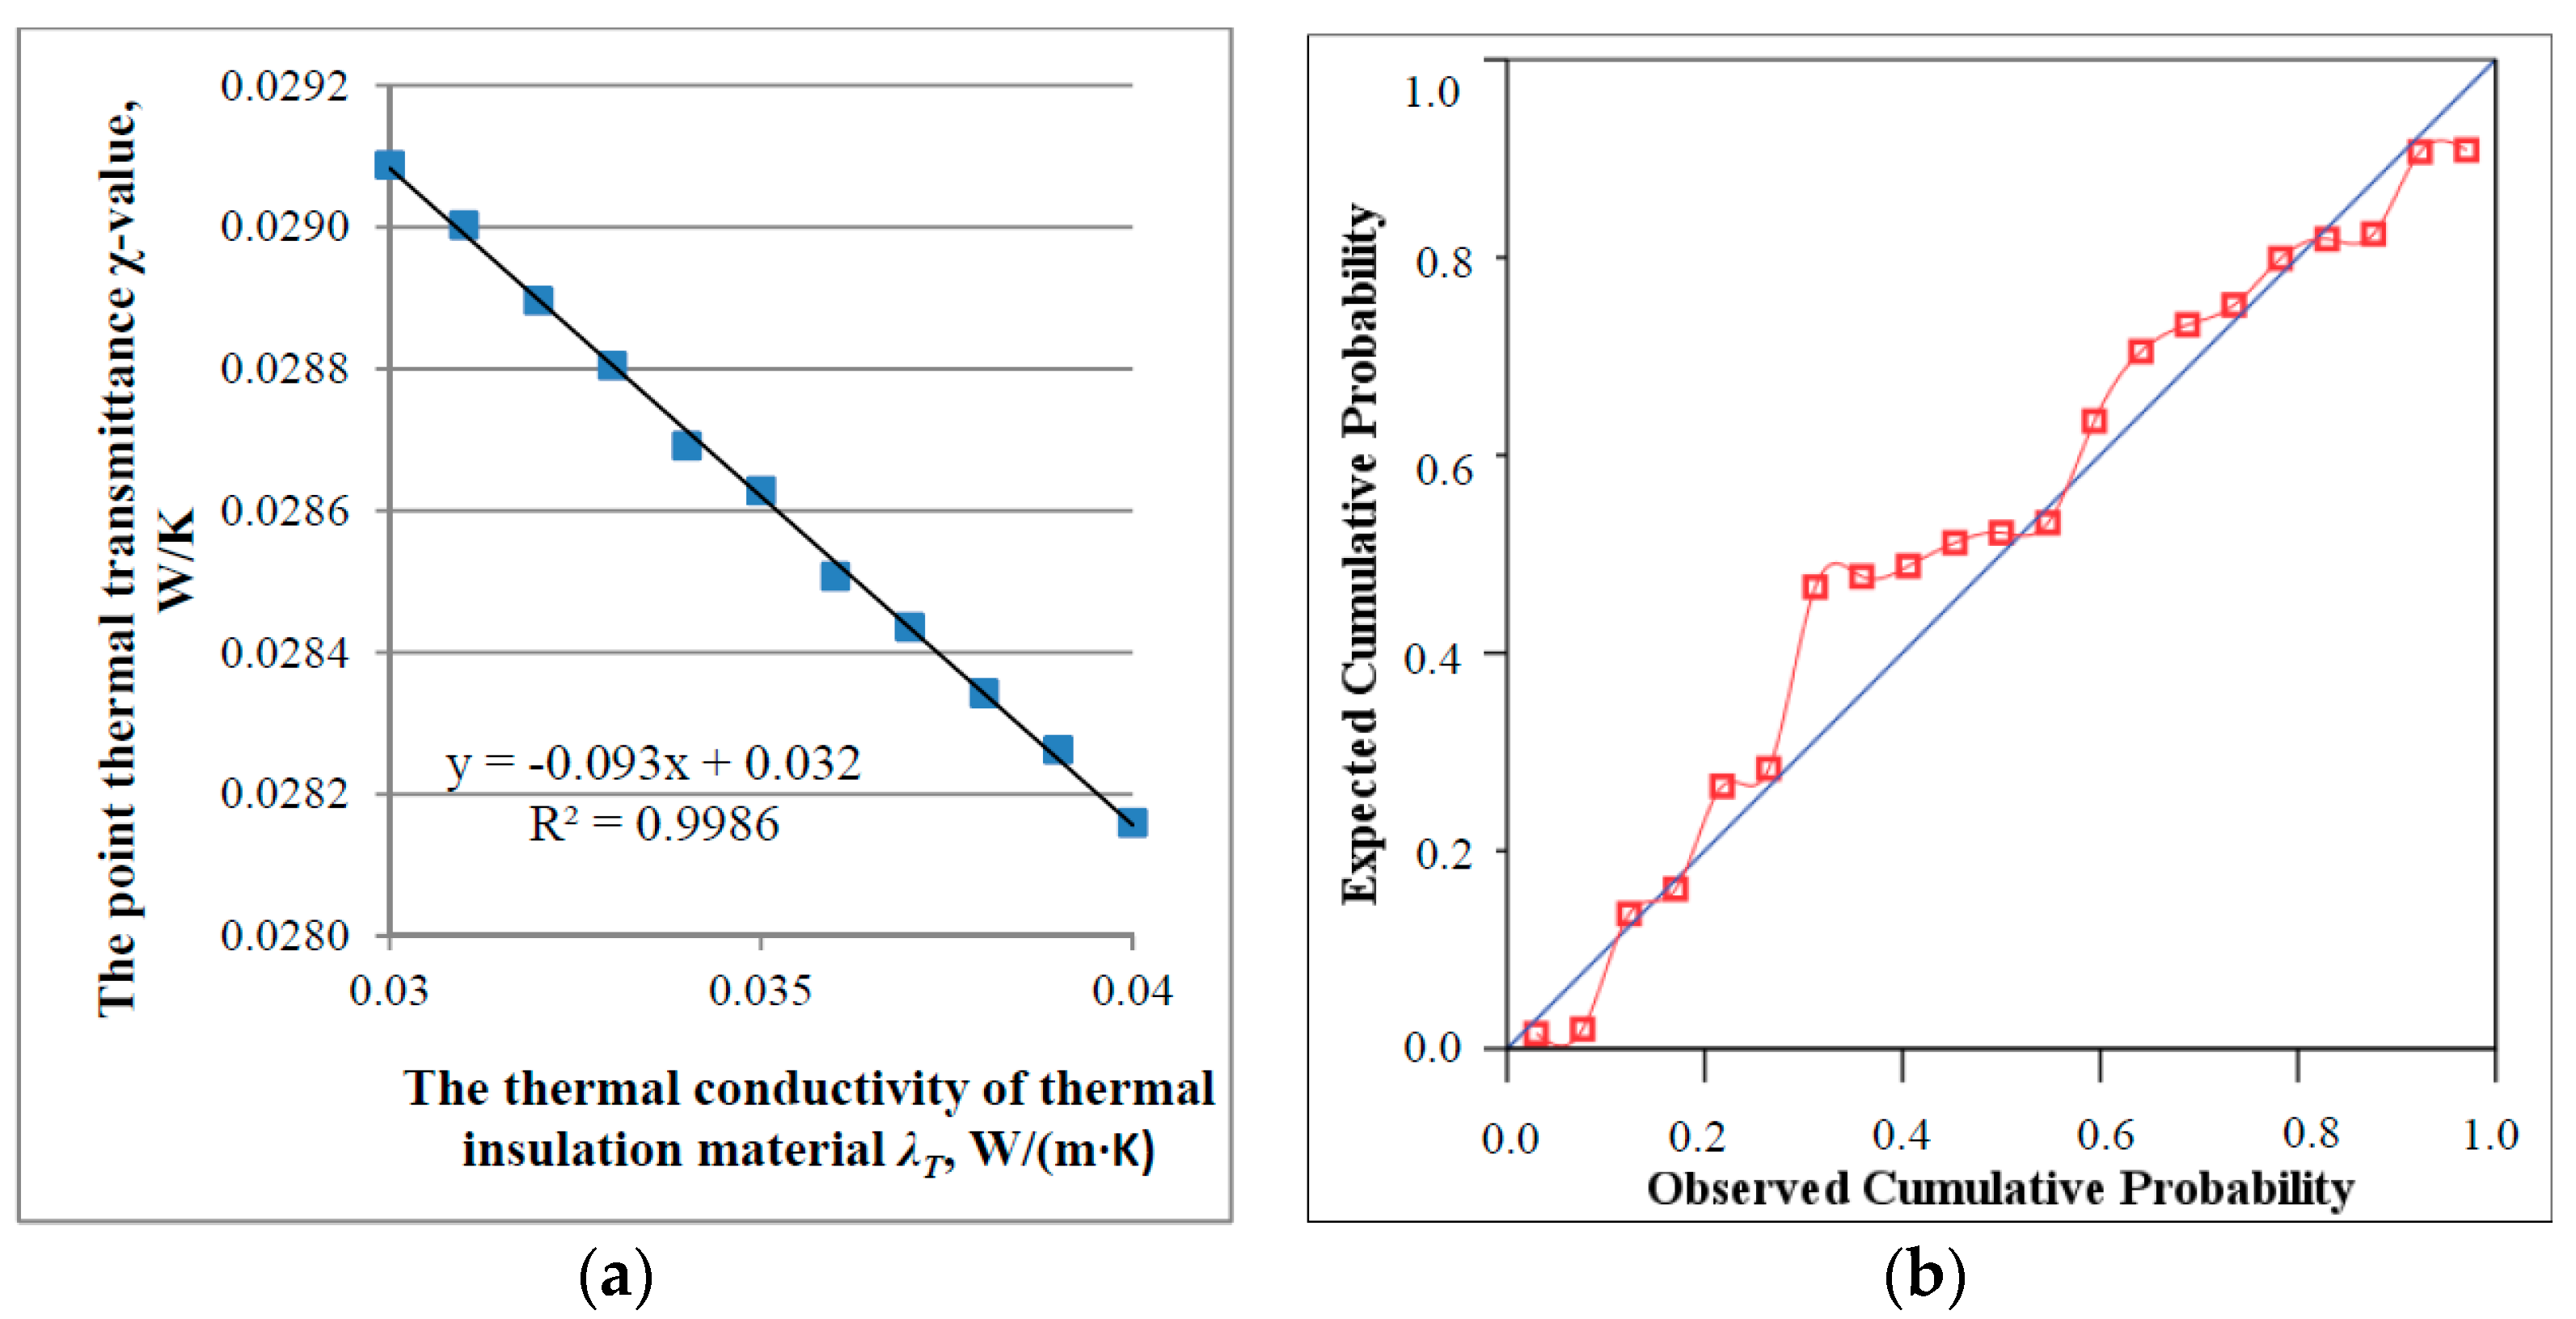
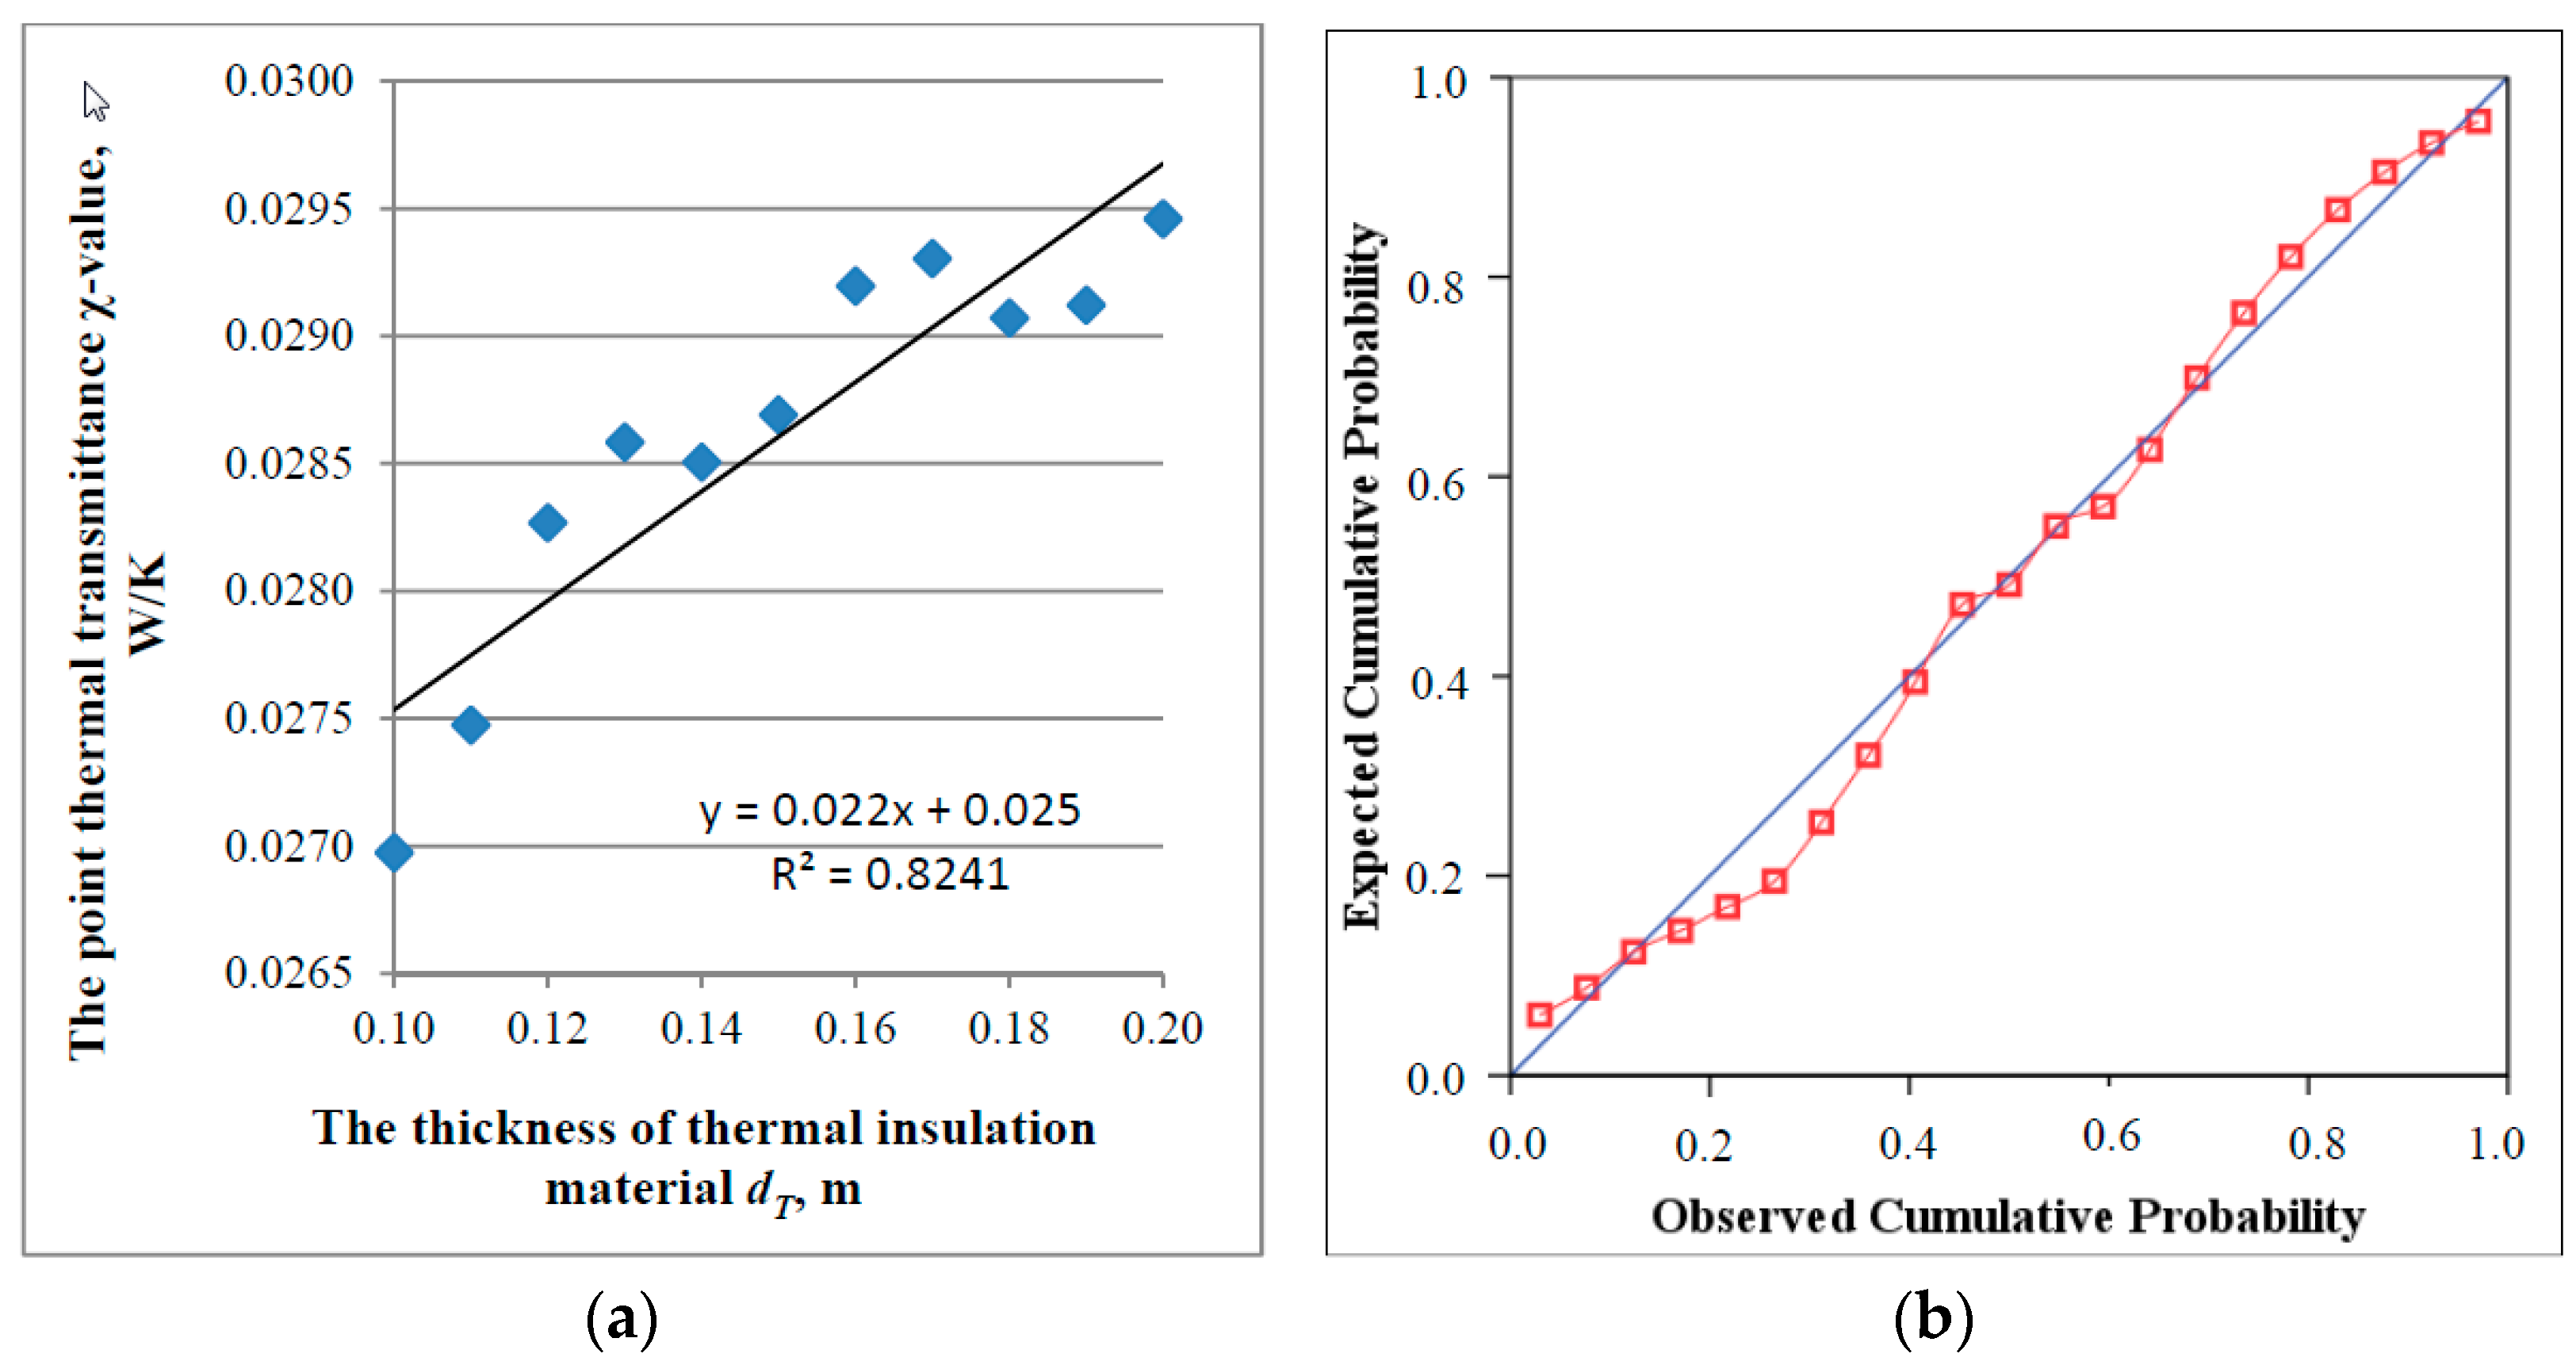
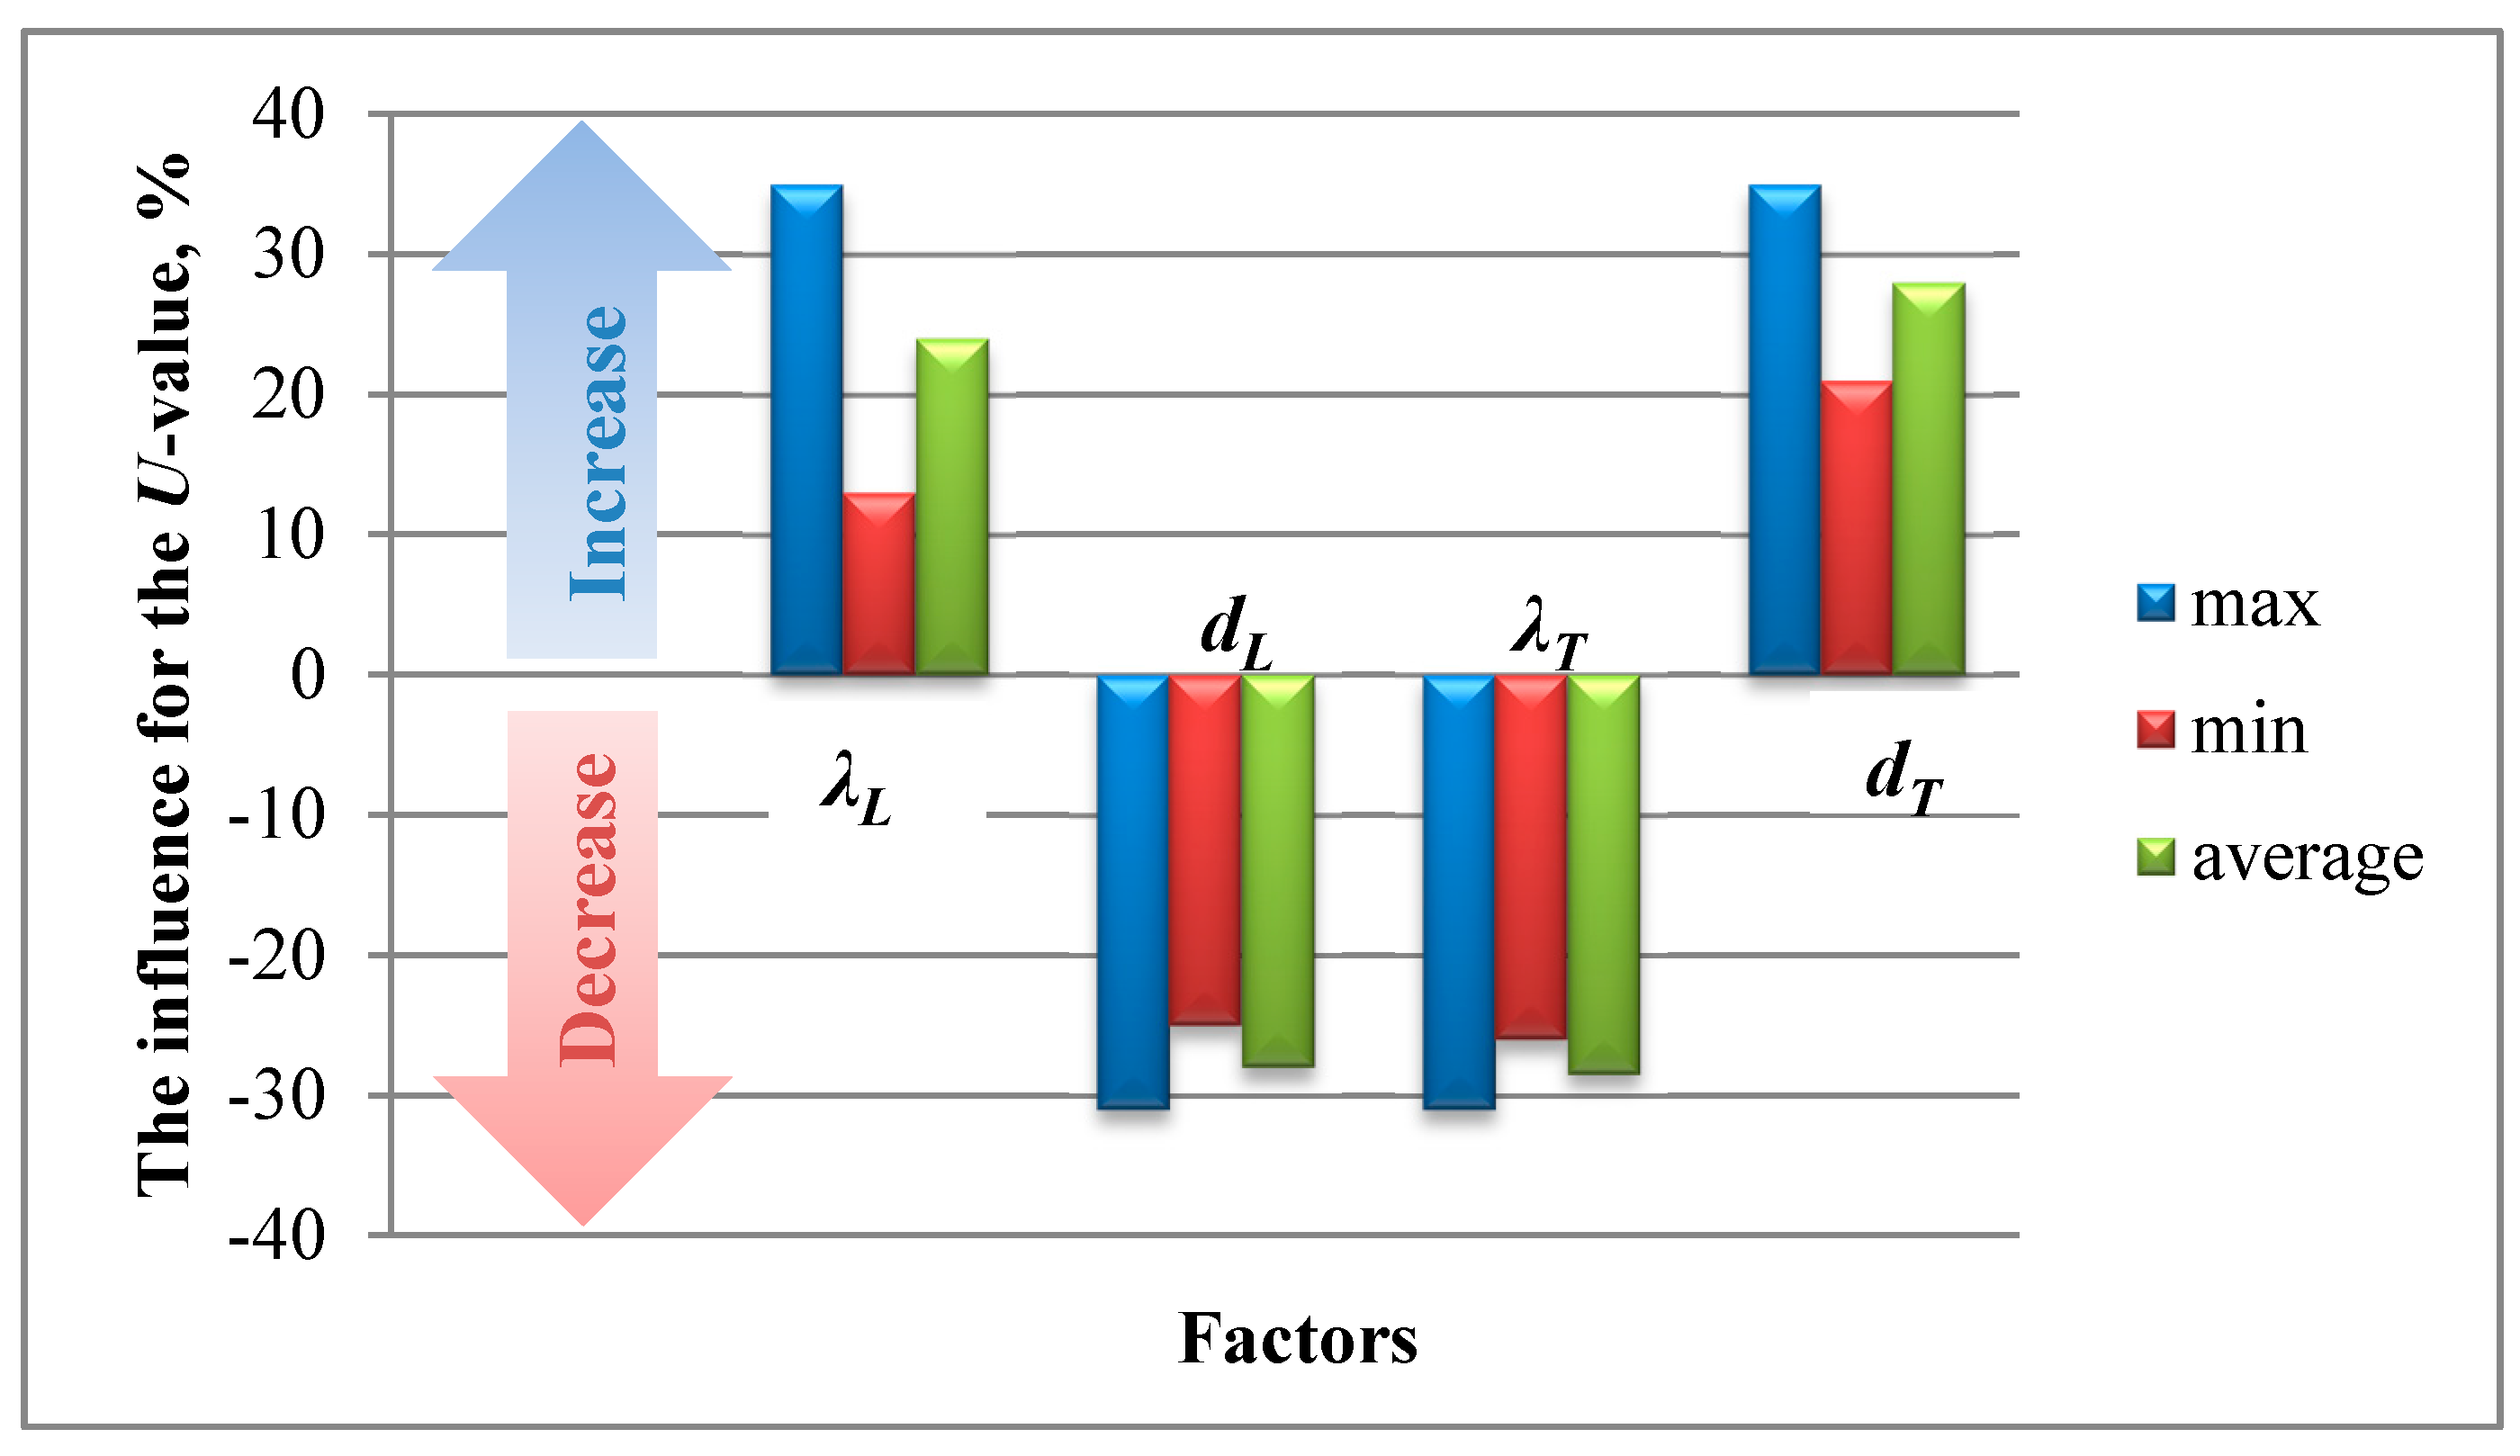
3.2. Evaluation of the Dependence of a Point Thermal Bridge

After determining the trend of heat flow behavior through fastener, we calculated the thermal transmittance χ-values, with different values of the thermal conductivity of the bearing layer, the bearing layer thickness, the thermal conductivity of the thermal insulation layer, and the thermal insulation layer thickness. Figure 5a illustrates the relationship between the fastener’s thermal transmittance χ-value and the thermal conductivity of the bearing layer material (Alternative 1 in Table 1). If the thermal conductivity λL of the bearing layer material is increased, the influence of the χ-value on the total wall’s thermal transmittance is increased. The chart shows that when the λL-value of the bearing layer’s material increases from 0.1 to 1.0 W/(m∙K), the χ-value increases from 0.008 to 0.039 W/K, i.e., by almost 5 times. Accordingly, due to the influence of the fasteners, the thermal transmittance correction factor ΔU will increase from 0.022 to 0.109 W/(m2∙K), whereas the influence of the fasteners on the U-value of the entire wall will increase from 13% to 35%. P-P plots, presented in Figure 5b, show that the regression model is appropriate in those cases when the values of point thermal transmittance depend on the thermal conductivity coefficient χ = f (λL).
Figure 5. Relationship between the calculated value of the thermal transmittance of the fastener and the value of the thermal conductivity of the bearing layer material. (a) Dependence; (b) P-P plot.
Sustainability 07 15840 g005
The thickness of the bearing layer also has an effect on the point thermal bridge. Figure 6a shows the change in the point thermal transmittance with the change of the bearing layer thickness from 50 mm to 500 mm (Alternative 2 in Table 1). It was determined that with the increase in the thickness of the bearing layer of the wall, the χ-value decreases from 0.034 to 0.022 W/K. The ΔU accordingly decreases from 0.094 to 0.060 W/(m2∙K) due to the influence of the fasteners. The influence of the fasteners on the U-value of the entire wall will drop from 31% to 25%. In this case, the increase in the thickness of the bearing layer of the wall by 100 mm reduces the χ-value by approximately 10%. P-P plots presented in Figure 6b show that the regression model is appropriate in those cases when the values of point thermal transmittance depend on the thickness χ = f (dL) of the bearing layer of the wall.
Figure 6. Relationship between the calculated value of the thermal transmittance and the thickness of the bearing layer of wall. (a) Dependence; (b) P-P plot.
Sustainability 07 15840 g006
The point thermal bridge of the fasteners also depends on the thermal conductivity of the thermal insulation material. Figure 7 illustrates the change in the point thermal transmittance with the change of thermal insulation material thermal conductivity λT from 0.030 to 0.040 W/(m∙K) (Alternative 3 in Table 1). It was determined that with the increase of the thermal conductivity coefficient of thermal insulation material, the χ-value drops from 0.029 to 0.028 W/K and the ΔU accordingly decreases from 0.081 to 0.078 W/(m2∙K) due to the influence of the fasteners, whereas the influence of the fasteners on the U-value of the entire wall will drop from 31% to 26%. In this case, the increase in the value of thermal insulation material thermal conductivity coefficient by 0.01 W/(m∙K) reduces the point thermal transmittance by approximately 4%. P-P plots presented in Figure 7a show that the regression model is appropriate in those cases when the values of point thermal transmittance depend on the thermal conductivity coefficient of the thermal insulation material χ = f (λT).
Figure 7. Relationship between the calculated value of the thermal transmittance χ-value and thermal conductivity λT-value of thermal insulation material. (a) Dependence; (b) P-P plot.
Sustainability 07 15840 g007
The point thermal bridge of the fasteners also depends on the thickness of the thermal insulation material. Figure 8 illustrates the change in the point thermal transmittance with the change in the thickness of thermal insulation material dT from 100 mm to 200 mm (Alternative 4 in Table 1). It was determined that with the increase in dL the χ-value increases from 0.027 to 0.029 W/K and the ΔU accordingly increases from 0.075 to 0.082 W/(m2∙K) due to the influence of the fasteners, whereas the influence of the fasteners on the U-value of the entire wall will increase from 21% to 35%. In this case, the increase in the thickness of thermal insulation material from 100 mm to 200 mm increases the χ-value by approximately 7%. P-P plots presented in Figure 8a show that the regression model is appropriate in those cases when the values of point thermal transmittance depend on the thickness of thermal insulation material χ = f (dT).
Figure 8. Relationship between the calculated value of the thermal transmittance and thermal insulation thickness dT-value. (a) Dependence; (b) P-P plot.
Sustainability 07 15840 g008

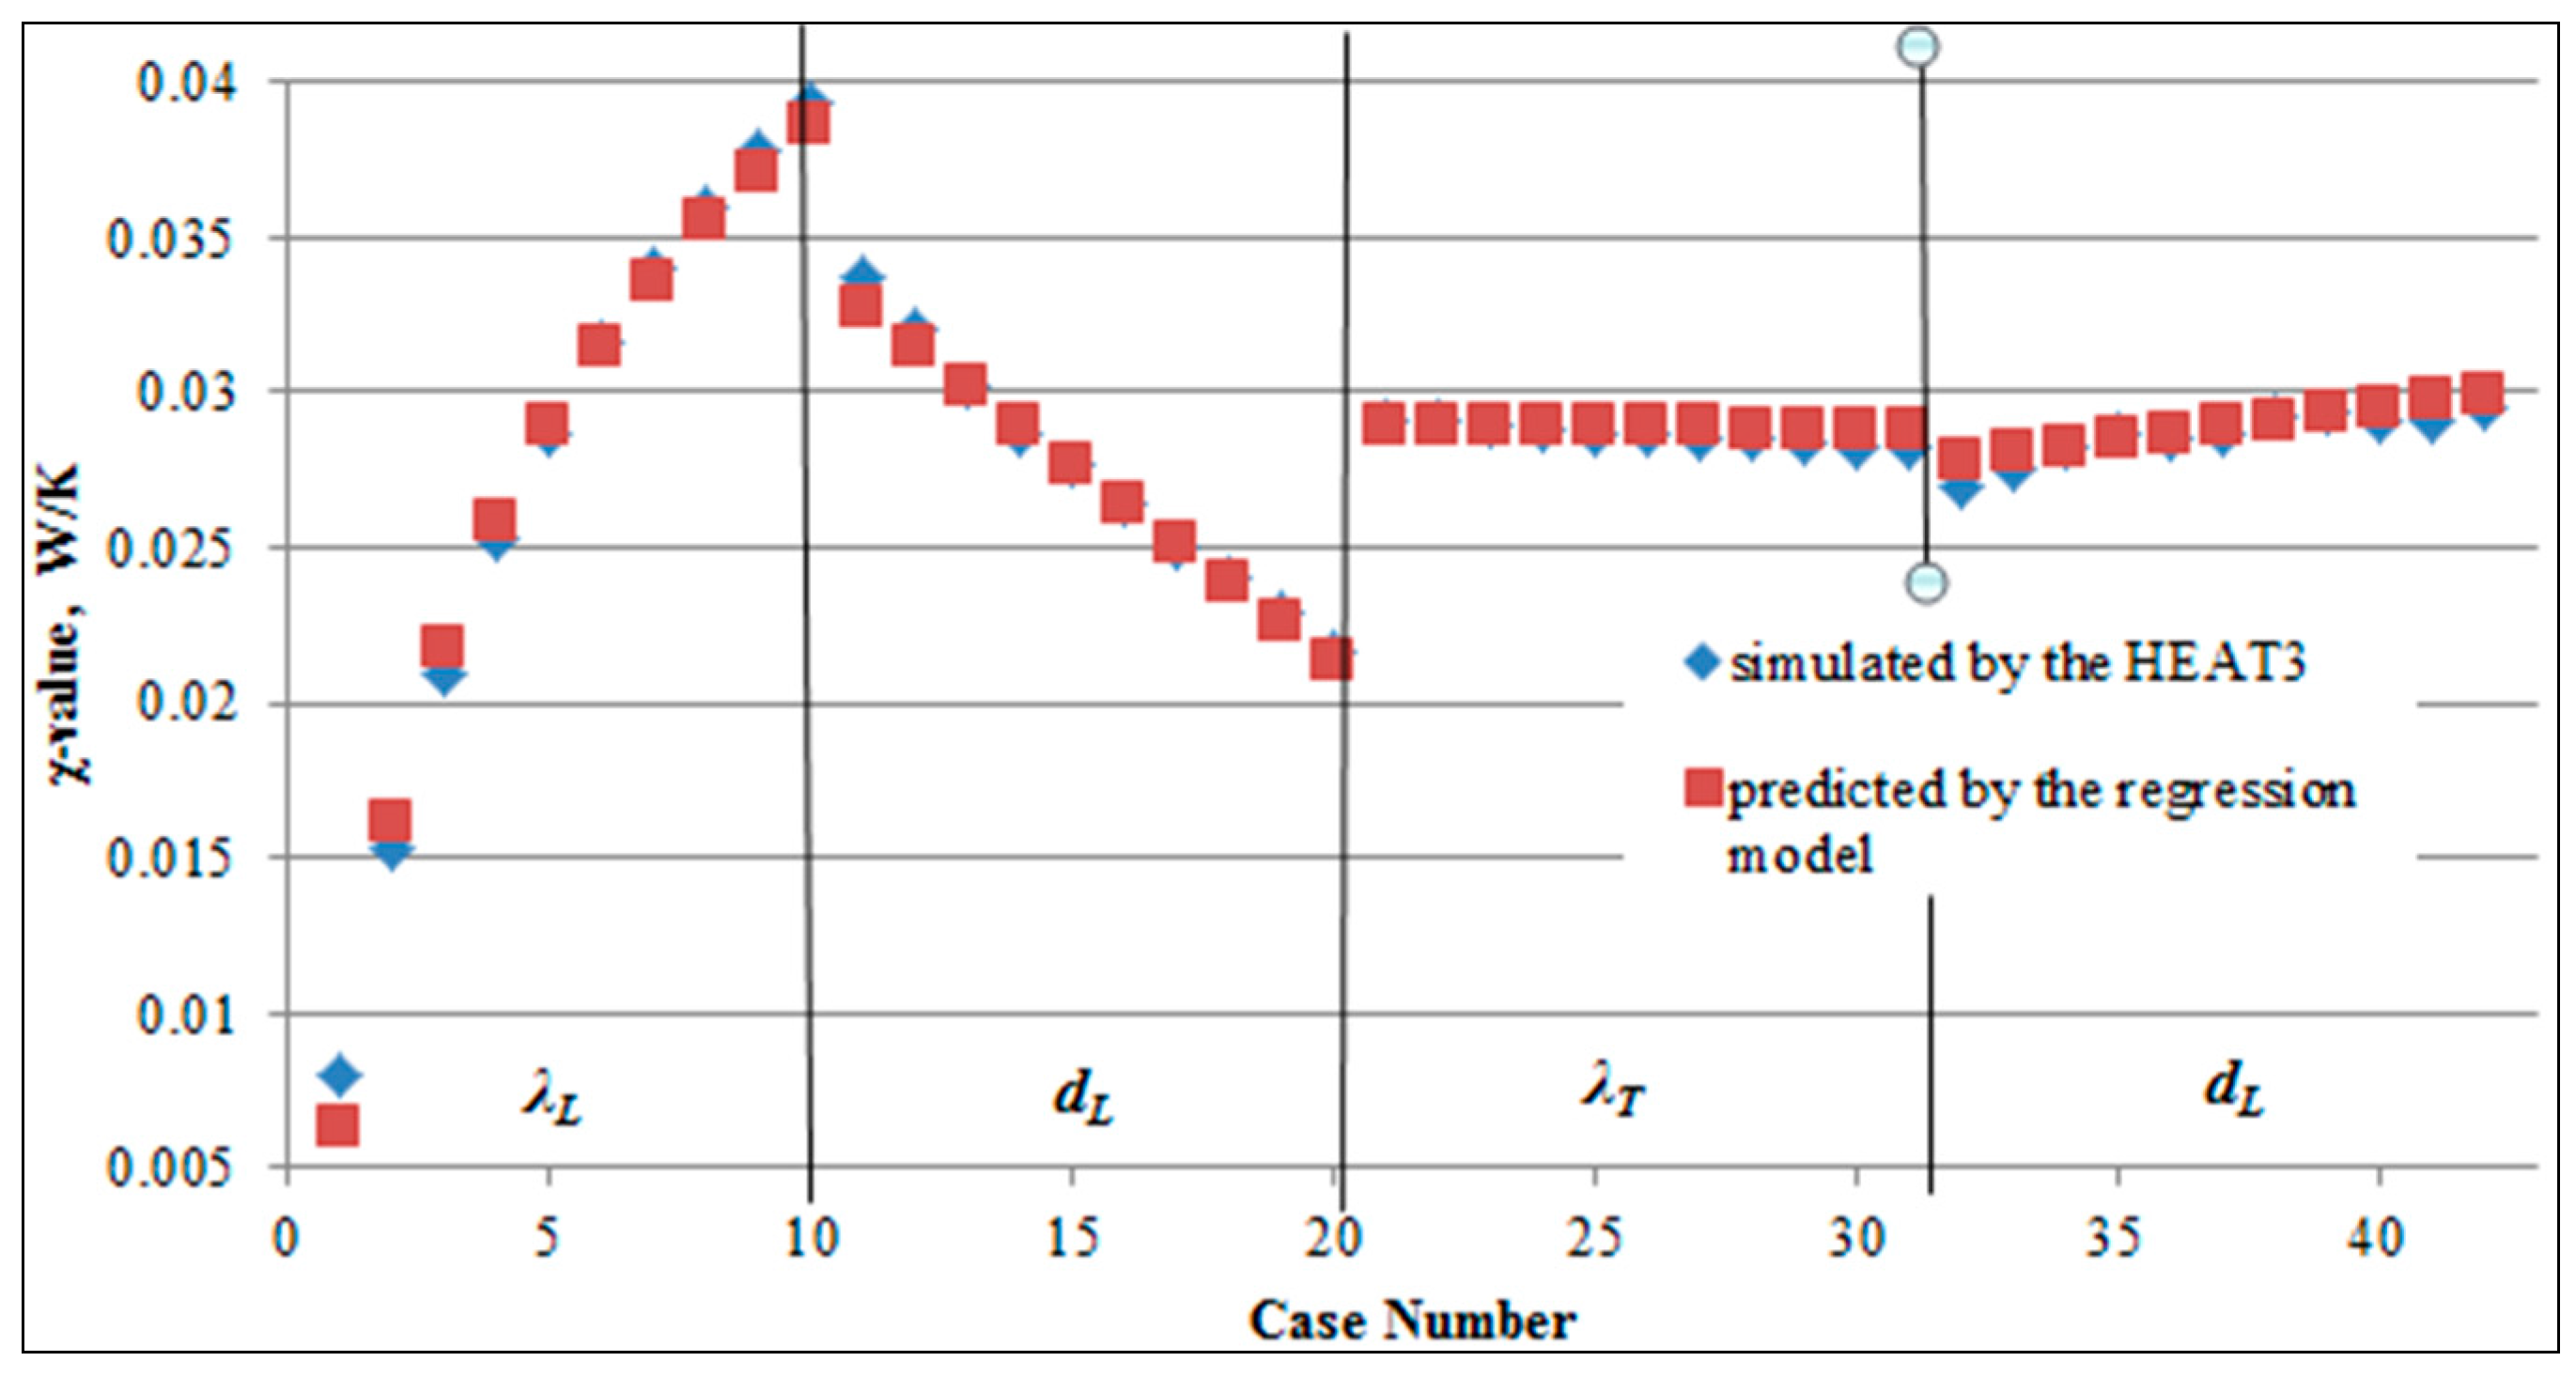
3.3. Simplified Methodology for the Evaluation of the Point Thermal Bridge

The previous section described the dependence of thermal bridges created by the fasteners of walls with a ventilated facades system on the thermal conductivity coefficient χ = f (λL) and thickness χ = f (dL) of the bearing layer material, as well as on the thermal conductivity coefficient χ = f (λT) and thickness χ = f (dT) of the thermal insulation material. If the left-side values of these equations are the same, the general functional dependency may be expressed as follows (Equation (13)):
χ = f ( λ L , d L , λ T , d T ) .
In the presence of functional dependency, the change in the values of thermal conductivity and thickness of the wall’s material and layers precisely describes the change in the point thermal transmittance χ–value. Therefore, a system of equations can be produced (Equation (14)):
χ = { 0.038 + 0.014 l n ( λ L ) , 0.1 λ L 1 ; 0.034 0.025 d L , 50 d L 500 ; 0.032 0.093 λ T , 0.030 λ T 0.040 ; 0.025 + 0.022 d T , 100 d T 200 .
The solution of this system gives a mathematical expression (Equation (15)):
χ = 0.041 + 0.014 l n ( λ L ) 0.025 d L 0.016 λ T + 0.022 d T .
To determine the reliability and accuracy of these calculation results and evaluate the precision of the dependence of point thermal bridges on the properties of other materials in the structure, a multiple regression approach was used.
The strength of the relationship between the variables was evaluated by means of correlation coefficient R2 = 0.991. To evaluate the statistical significance of the correlation coefficient, the obtained p-value was compared to the α-value α = 0.05 (the level of significance). Adjusted R Square shows that the selected linear regression model with independent variables λLi, dLi, λTi, dTi, i = 1,2,...,n, gives a 99% explanation for the distribution of point thermal transmittance values around the average.
ANOVA p-value 0.00 < 0.05 showed that there are no independent variables (“regressors”) related to the dependent variable (χ) in the model. T (Student) tests with separate regressors showed that all variables are statistically significant. However, the evaluation of the significance of regressors’ influence suggests that the thermal conductivity coefficient value λL of the material of the bearing layer has the biggest effect on the forecasted point thermal transmittance values because DFB Beta (difference in beta) is the biggest (0.926). However, DFBeta < 1 in individual observations shows the absence of exceptions. Variance inflation factor (VIF < 4) shows the absence of the multicollinearity problem.
Regarding standardized residuals, the histogram presented in Figure 9 shows that the distribution of the variable is normal.
Figure 9. Histogram. Dependent variable χ-value.
Sustainability 07 15840 g009
A P-P chart (Figure 10) illustrates the absence of major exceptions.
Figure 10. Normal P-P plot of regression standardized residuals.
Sustainability 07 15840 g010
Point estimates of coefficients in the empirical equation (β0 = 0.041; βλL = 0.014 βdL = (–0.025) βλT = (–0.016) βdT = 0.022) show that if the effect of the point thermal transmittance on the heat loss of the building is equal to one point, the thermal conductivity coefficient of the bearing layer material increases by 0.014 points, with the remaining variables captured, and the thermal insulation value increases by 0.022 points. If the effect of the point thermal transmittance on the heat loss of the building is equal to one point, the bearing layer of the wall thickness value drops by 0.025 points, with the remaining variables captured; the thermal conductivity coefficient value of the thermal insulation material drops by 0.016 points accordingly.
The hypothesis (Equation 11) was verified by evaluating the linearity of the regression model. The obtained p-value is equal to 0.00, which is less than α = 0.05. The H0 hypothesis was rejected, meaning that the developed multiple linear regression model is suitable to forecast the values of thermal bridges according to the thermal and geometrical properties of the structure, which is described in Section 2.1. The same is confirmed by Figure 11, showing the comparison of the point thermal transmittance values calculated by two methods: HEAT3 simulation and simplified method (regression model).
Figure 11. The values of point thermal transmittance determined by means of HEAT3 simulation and by means of the simplified method.
Sustainability 07 15840 g011

4. Discussion

The results of the point thermal transmittance χ-value calculation show that the evaluation of thermal bridges’ effect is very important for the design of high-energy performance buildings according to Passive House standards. Because, the point thermal transmittance χ-value of thermal bridges depends not only on the thermal properties of fastener materials and fastener dimensions but also on the thermal properties of the materials that are used in external wall layers and the dimensions of those layers. According to the results (Figure 12), it can be stated that the influence of the point thermal bridges on the U-value of the entire wall may achieve an average of 30%. Our investigation showed that, of all tested factors, the biggest influences on the χ-value and U-value of the entire wall are the thermal conductivity of the bearing layer material and the thickness of the insulating layer. For this reason, the U-value of the entire wall may increase by up to 35%.
This result shows that with the increase of thermal insulation thickness and thermal conductivity of the bearing layer material of a wall with a ventilated facade system, the U-value of entire external wall will be greater than is commonly held (because it is not evaluated for point thermal bridges). Therefore, the total real consumption of the high-efficiency building may be higher than that provided by an energy performance assessment of buildings. Theodosiou [31] came to the same conclusion: point thermal bridge effects in cladding systems can constitute a significant part of buildings’ thermal balance. Neglecting their presence can lead to significant underestimation of actual heat flows, which can account form 5% to almost 20% of total heat flows through the building envelope, depending mostly on the thermal transmittance of the load bearing wall and the ventilation characteristics of the air cavity. Ascione [6] found that, if the thickness of the thermal insulation layer increases, the U-value of the entire wall will not provide the optimal value in some cases that directly depend on climate conditions. In addition, the material of the bearing layer of the external wall, with its significant thermal properties, can be different from the masonry, made of monolithic concrete, which has low thermal properties. When designing high-energy performance buildings according to Passive House standards, the U-value of the entire wall must be less than 0.15 W/(m2K). If this requirement is not satisfied, one must compensate by increasing the insulation layer thickness. So, if the influence of point thermal bridges is not evaluated, buildings cannot achieve high-efficiency energy in practice. It is also very important to properly select the material between the aluminum fastener and the bearing layer of the external wall (gasket, sleeve), as this can significantly reduce the heat flow between the fastener and the dense, heat-conductive material of the bearing layer. In this case a gasket was chosen whose thermal conductivity value was λ = 0.17 W/(m∙K).
When the influence of the thermal properties of the thermal insulation layer is analyzed, it can be observed that with an increase in the effectiveness of the thermal insulation layer, the influence of the thermal bridge decreases (Figure 7a). Figure 12 shows that a decrease in the value of the thermal conductivity coefficient of the thermal insulation material (considering point thermal bridges) reduces the U-value of the entire exterior wall. This tendency is due to the difference in the thermal conductivity values of the thermal insulation material and the aluminum fastener. Therefore, the influence of the point thermal bridges, considering the increase of the effectiveness of the thermal insulation layer, might be not so positive for the U-value of the entire exterior wall if polymeric materials with ”solid, non-elastic structures” are used in the bearing layer of the external walls. On the other hand, the aluminum fastener is among the most conductive materials (λ= 160 W/(m∙K)), so the use of fasteners made from other materials (steel, fiberglass) will significantly decrease the influence of the point thermal bridge on the wall’s thermal conductivity.
The point thermal bridges depend on different parameters of the external wall (thickness of the layers and thermal properties of the materials); if these differences are evaluated, it is possible to predict values for the point thermal transmittance. This is achieved if the calculated value of the basic design variant and the differences between the external wall structure and the basic one are known.
This is important for the design of high-energy performance buildings according to Passive House standards, because the calculation of the point of thermal bridges is complicated, requiring additional knowledge, special software, and the skills to use it. For these reasons, point thermal bridges are quite often ignored in practice. This might lead to large errors in assessing high-energy performance buildings and the design of heating and ventilation systems.
Figure 12. The influence of the point thermal bridge for the U-value according to investigated factors.
Sustainability 07 15840 g012

5. Conclusions

The results of this investigation show that the influence of point thermal bridges on the U-value of the entire wall may achieve an average of 30% regarding the thermal properties of the materials that are used in external wall layers. This conclusion is very important for the design of high-energy performance buildings according to Passive House standards.
Tests have shown that an increase in the thermal conductivity of the bearing layer material and in the thickness of the thermal insulation layer may increase the U-value of the entire wall by up to 35% as a result of the effect of point thermal bridges.
As well as the possibility of increasing the U-value, this is very important for the selection of the material between the aluminum fastener and the bearing layer of the external wall (gasket, sleeve). This gasket or sleeve may significantly reduce the heat flow between the aluminum fastener and dense heat conductive material of the bearing layer of the wall.
The point thermal bridge may decrease the U-value of the entire wall by up to 28% regarding the increase in bearing layer thickness and using insulation materials with higher thermal conductivity.
Tests revealed the strong dependence of the point thermal bridge on the thermal conductivity of the bearing layer material and the thickness of the wall bearing layer. For this reason, thermal bridges should receive greater consideration. It is not enough to use the diagrams of typical fasteners, as these very often do not take into account the exact thickness and thermal characteristics of materials.
Knowing the functional dependency of point thermal transmittance values on the thermal properties of fastener materials and fastener dimensions, it is possible to calculate the specific point thermal bridge by means of a simplified calculation using the empirical relationship (Equation (15)), which gives a sufficiently precise (95%) calculation of point thermal transmittance values according to the thermal and geometrical properties of wall materials based on the basic variant calculated by means of 3-D thermal field calculation software.
By applying the method described in this article, it would be possible to give values of point thermal transmittance for basic constructions in the catalogues, while other alternatives could be evaluated according to available functional dependencies.

Acknowledgments

This research was supported by the Basic Science Research Program through the Kaunas Technology University (KTU) funded by the Ministry of the Environment of the Republic of Lithuania.

Author Contributions

The proposed research is part of a study carried out by all of the authors in collaboration, with continuous reciprocal feedback during the literature review, the development of the simplified methodology, the selection of parameters and criteria for the investigation study, and the writing of the text. Indeed, all authors contributed in all phases of the work.

Conflicts of Interest

The authors declare no conflict of interest.

Nomenclature

A
Area of element i of the building envelope [m2]
Ui
Thermal transmittance of element i of the building envelope [W/(m2∙K)]
Uj
Thermal transmittance of the 1-D component j separating the two environments being considered [W/(m2∙K)]
ΔU
Transmittance correction factor [W/(m2∙K)]
K
Thermal conductance [W/K]
lj
Length within the 2-D geometrical model over which the value of Uj applies [m]
lk
Length of linear thermal bridge k [m]
χj
Point thermal transmittance of the point thermal bridge j [W/K]
L2D
Linear thermal coupling coefficient obtained from a 2-D calculation of the component separating the two environments being considered [W/m∙K]
L3D
Thermal coupling coefficient obtained from a 3-D calculation of the component separating the two environments being considered [W/m∙K]
n
Number of fasteners per surface area [pcs./m2]
HS
Specific heat losses through repeated surface area without a fastener [W/K]
H
Specific heat losses through repeated surface area with a fastener [W/K]
H0
Zero hypothesis [-]
Ha
Alternative hypothesis [-]
F
Fisher distribution [-]
hD
Direct heat transfer coefficient [W/K]
Qi,j,k,
Total heat flow to cell (i,j,k) from the six adjacent cells [W]
T
Temperature [K]
RT
Thermal resistance [(m2·K)/W]
R
Correlation coefficient [-]
d
Thickness of the layer [m]
S S R ¯
Regression sum of squares [-]
S S E ¯
Residual sum of squares [-]
Greek letters
 
λ
Thermal conductivity coefficient [W/(m·K)]
Ψk
Linear thermal transmittance of linear thermal bridge k [W/(m∙K)]
Ψj
Linear thermal transmittance of linear thermal bridge j [W/(m∙K)]
Δxi·Δyj
Conductance referring to the total heat flow through the area [m]
Δzk
Z-direction for half of the cell (i,j,k) [m]
α
Significance level [-]
β
Coefficient of independent variables [-]
Subscripts
 
L
Refers to the bearing layer of the external wall [-]
T
Refers to the insulation layer of the external wall [-]

References

  1. The International Organization for Standardization (ISO). Thermal Bridges in Building Construction—Heat Flows and Surface Temperatures--Detailed Calculations; The International Organization for Standardization (ISO): Geneva, Switzerland, 2007. [Google Scholar]
  2. Theodosiou, T.G.; Papadopoulos, A.M. The impact of thermal bridges on the energy demand of buildings with double brick wall constructions. Energy Build. 2008, 40, 2083–2089. [Google Scholar] [CrossRef]
  3. Evola, G.; Margani, G.; Marletta, L. Energy and cost evaluation of thermal bridge correction in Mediterranean climate. Energy Build. 2011, 43, 2385–2393. [Google Scholar] [CrossRef]
  4. Ascione, F.; Bianco, N.; de Rossi, F.; Turni, G.; Vanoli, G.P. Different methods for the modelling of thermal bridges into energy simulation programs: Comparisons of accuracy for flat heterogeneous roofs in Italian climates. Appl. Energy 2012, 97, 405–418. [Google Scholar] [CrossRef]
  5. Theodosiou, T.; Tsikaloudaki, K.; Bikas, D.; Aravantinos, D.; Kontoleon, K.N. Assessing the Use of Simplilied and Analytical Methods for Approaching Thermal Bridges with Regard to Their Impact on the Thermal Performance of the Building Envelope. Available online: http://wsb14barcelona.org/programme/pdf_poster/P-059.pdf (accessed on 20 October 2015).
  6. Ascione, F.; Bianco, N.; de Masi, R.F.; Mauro, G.M.; Vanoli, G.P. Design of the building envelope: A novel multi-objective approach for the optimization of energy performance and thermal comfort. Sustainability 2015, 7, 10809–10836. [Google Scholar] [CrossRef]
  7. Capozzoli, A.; Gorrino, A.; Corrado, V. A building thermal bridges sensitivity analysis. Appl. Energy 2013, 107, 229–243. [Google Scholar] [CrossRef]
  8. Ge, H.; McClung, V.R.; Zhang, S. Impact of balcony thermal bridges on the overall thermal performance of multi-unit residential buildings: A case study. Energy Build. 2013, 60, 163–173. [Google Scholar] [CrossRef]
  9. Cappelletti, F.; Gasparella, A.; Romagnoni, P.; Baggio, P. Analysis of the influence of installation thermal bridges on windows performance: The case of clay block walls. Energy Build. 2011, 43, 1435–1442. [Google Scholar] [CrossRef]
  10. Citterio, M.; Cocco, M.; Erhorn-Klutting, H. Thermal Bridges in the EPBD Context: Overview on MS Approaches in Regulations. Available online: http://www.buildup.eu/sites/default/files/P064_EN_ASIEPI_WP4_IP1_p3073.pdf (accessed on 15 June 2015).
  11. Gao, Y.; Roux, J.J.; Zhao, L.H.; Jiang, Y. Dinamical building simulation: A low order model for thermal bridges losses. Energy Build. 2008, 40, 2236–2243. [Google Scholar] [CrossRef]
  12. Tadeu, A.; Simoes, I.; Simoes, N.; Prata, J. Simulation of dynamic liner thermal bridges using a boundary element method model in the frequency domain. Energy Build. 2011, 43, 3685–3695. [Google Scholar] [CrossRef]
  13. Ascione, F.; Bianco, N.; de Masi, R.F.; Mauro, G.M.; Musto, M.; Vanoli, G.P. Experimental validation of a numerical code by thin film heat flux sensors for the resolution of thermal bridges in dynamic conditions. Appl. Energy 2014, 124, 213–222. [Google Scholar] [CrossRef]
  14. Ascione, F.; Bianco, N.; De Masi, R.F.; de’Rossi, F.; Vanoli, G.P. Simplified state space representation for evaluating thermal bridges in building: Modelling, application and validation of a methodology. Appl. Therm. Eng. 2013, 61, 344–354. [Google Scholar] [CrossRef]
  15. Sierra, f.; Bai, J.; Maksoud, T. Impact of the simplification of the methodology used to assess the thermal bridge of the head of an opening. Energy Build. 2015, 87, 342–347. [Google Scholar] [CrossRef]
  16. Albatici, R.; Tonelli, A.M. Infrared thermovision technique for the assessment of thermal transmittance value of opaque building elements on site. Energy Build. 2010, 42, 2177–2183. [Google Scholar] [CrossRef]
  17. Desogus, G.; Mura, S.; Ricciu, R. Comparing different approaches to in situ measurement of building components thermal resistance. Energy Build. 2011, 43, 2613–2620. [Google Scholar] [CrossRef]
  18. Martin, K.; Escudero, C.; Erkoreka, A.; Flores, I.; Sala, J.M. Equivalent wall method for dynamic characterization of thermal bridges. Energy Build. 2012, 55, 704–714. [Google Scholar] [CrossRef]
  19. Bianchi, F.; Pisello, A.L.; Baldinelli, G.; Asdrubali, F. Infrared thermography assessment of thermal bridges in building envelope: Experimental validation in a test room setup. Sustainability 2014, 6, 7107–7120. [Google Scholar] [CrossRef]
  20. Berggren, B.; Wall, M. Calculation of thermal bridges in (Nordic) building envelopes—Risk of performance failure due to inconsistent use of methodology. Energy Build. 2013, 65, 331–339. [Google Scholar] [CrossRef]
  21. The International Organization for Standardization (ISO). Thermal Bridges in Building Construction—Linear Thermal Transmittance—Simplified Methods and Default Values; The International Organization for Standardization (ISO): Geneva, Switzerland, 2007. [Google Scholar]
  22. Petranek, V.; Subrit, R.; Plachy, J.; Nevrivova, L.; Petricek, T.; Kalousek, L.; Caha, Z. Thermal bridges in insulation system. Therm. Power Electr. Eng. 2013. [Google Scholar] [CrossRef]
  23. Qasass, R.; Gorgolewski, M.; Ge, H. Timber framing factor in Toronto residential house construction. Archit. Sci. Rev. 2014, 57, 159–168. [Google Scholar] [CrossRef]
  24. Gomes, A.P.; de Souza, H.A.; Tribess, A. Impact of thermal bridging on the performance of building using Light Steel Framing in Brazil. Appl. Therm. Eng. 2013, 52, 84–89. [Google Scholar] [CrossRef]
  25. Martin, K.; Erkoreka, A.; Flores, I.; Odriozola, M.; Sala, J.M. Problems in the calculation of thermal bridges in dynamic conditions. Energy Build. 2011, 43, 529–535. [Google Scholar] [CrossRef]
  26. De Andelis, E.; Serra, E. Light steel-frame walls: Thermal insulation performances and thermal bridges. Energy Procedia 2014, 45, 362–371. [Google Scholar] [CrossRef]
  27. The International Organization for Standardization (ISO). Building Components and Building Elements—Thermal Resistance and Thermal Transmittance—Calculation Method; The International Organization for Standardization (ISO): Geneva, Switzerland, 2007. [Google Scholar]
  28. Ministry of Environment of Republic of Lithuania. STR 2.05.01:2013. Energy performance of Buildings Design; Ministry of Environment of Republic of Lithuania: Vilnius, Lithuania, 2013. (In Lithuanian) [Google Scholar]
  29. Blomberg, T. Heat Conduction in two and three Dimensions Computer Modelling of Building Physics Applications; Report TVBH-1008; Byggnadsfysik LTH, Lunds Tekniska Högskola: Lund, Sweden, 1996. [Google Scholar]
  30. Claesson, J. Dynamic Thermal Networks: A Methodology to Account for Time-dependent Heat Conduction. Available online: http://www.irbnet.de/daten/iconda/CIB2503.pdf (accessed on 2 September 2015).
  31. Theodosiou, T.G.; Tsikaloudaki, A.G.; Kontoleon, K.J.; Bikas, D.K. Thermal bridging analysis on cladding systems for building facades. Energy Build. 2015, 109, 377–384. [Google Scholar] [CrossRef]

