Article

Waste Energy Recovery from Natural Gas Distribution Network: CELSIUS Project Demonstrator in Genoa

by
Davide Borelli
,
Francesco Devia
,
Margherita Marré Brunenghi
,
Corrado Schenone
*,† and
Alessandro Spoladore
DIME—Dipartimento di Ingegneria Meccanica, Energetica, Gestionale e dei Trasporti, Università degli Studi di Genova, Via All’Opera Pia 15/A, 16145 Genova, Italy
*
Author to whom correspondence should be addressed.
These authors contributed equally to this work.
Sustainability 2015, 7(12), 16703-16719; https://0-doi-org.brum.beds.ac.uk/10.3390/su71215841
Submission received: 5 October 2015 / Revised: 1 December 2015 / Accepted: 14 December 2015 / Published: 18 December 2015

Abstract

:
Increasing energy efficiency by the smart recovery of waste energy is the scope of the CELSIUS Project (Combined Efficient Large Scale Integrated Urban Systems). The CELSIUS consortium includes a world-leading partnership of outstanding research, innovation and implementation organizations, and gather competence and excellence from five European cities with complementary baseline positions regarding the sustainable use of energy: Cologne, Genoa, Gothenburg, London, and Rotterdam. Lasting four-years and coordinated by the City of Gothenburg, the project faces with an holistic approach technical, economic, administrative, social, legal and political issues concerning smart district heating and cooling, aiming to establish best practice solutions. This will be done through the implementation of twelve new high-reaching demonstration projects, which cover the most major aspects of innovative urban heating and cooling for a smart city. The Genoa demonstrator was designed in order to recover energy from the pressure drop between the main supply line and the city natural gas network. The potential mechanical energy is converted to electricity by a turboexpander/generator system, which has been integrated in a combined heat and power plant to supply a district heating network. The performed energy analysis assessed natural gas saving and greenhouse gas reduction achieved through the smart systems integration.

1. Introduction

The European Union (EU) strongly pursues the reduction of greenhouse gas (GHG) emissions in order to implement the Kyoto Protocol commitments, with a final target of 20% per year emissions saved by 2020 [1]. To this purpose a better use of energy in urban areas assumes a crucial role, since they are responsible for almost 80% of total GHG emissions but, at the same time, they play a crucial role in the safeguarding of the environment and in creating more resilient urban conditions [2]. In particular, it is estimated that in European countries almost 40% of energy is consumed in buildings and the 70% of this energy is deployed in heating and conditioning, so defining a leading sector in the effort to get a sustainable use of power resources [3].
EU policies aim for energy efficiency improvement, renewable energy source (RES) usage increase, and GHG emission reduction by 2020 through a large number of programs and regulatory actions. Since the beginning of this century the EU has been implementing operating environmental policies to confront climate change scenarios and support low-emissions activities. It is worth noting from the document “A European Strategy for Sustainable, Competitive and Secure Energy” [4], that it anticipated the exigency of a common planning approach to energy efficiency and RES exploitation, or the “Strategic Energy Review” [5], which introduced the well-know 20-20-20 strategy. Moreover, the “Renewable Energy and Climate Change Package” [6], launched the Covenant of Mayors initiative, all the way up to the “Roadmap for Moving to a Low-carbon Economy in 2050” [7] until the “2030 Framework for Climate and Energy Policies” [8],. The EU strategy has been following a general address at international level [9], aiming for an environmental policy for GHG reduction [10] and energy saving [11], especially focusing on a more intense use of innovative technologies [12,13].
Nevertheless, turning general determination into operative policies is not easy; the transition from a principles and objectives statement to implementation of actions may be complex. Indeed, the real impact of improvement actions is not easy to assess, and their effectiveness needs to be carefully analyzed [14]. It is therefore crucial to demonstrate innovative technologies able to facilitate saving actions as well as to promote a deep involvement of citizens, stakeholders, and institutions, beginning with municipalities, the basic unit of public administration in much of the world [15]. The “Smart Cities and Communities” initiative within the 7th Framework Programme moves in this direction, by operatively promoting carbon savings in cities through the efficient use of energy potentials and the effective recovery of energy losses in urban areas.
The EU project CELSIUS “Combined Efficient Large Scale Integrated Urban Systems” aims to demonstrate the possibility to boost energy efficiency through the smart integration of urban systems. District heating and cooling (DHC) can be enhanced by a smart waste energy recovery strategy involving different categories of plants and cities. Thus, twelve demonstration projects, covering the most major aspects of innovative urban heating and cooling for a smart city were delivered in Gothenburg, Cologne, London, Rotterdam, and Genoa [16].
In Genoa, the focus is about energy recovery from the pressure drop between the main supply line and the city natural gas network. The potential mechanical energy is converted into electricity by a turboexpander/generator system, which has been integrated in a combined heat and power (CHP) plant in order to supply a district heating network. This smart integration of infrastructures makes a large energy saving, with a recovery of up to 2.9 MWh/year of electricity by the turboexpander and 500,000 Sm3/year of NG saved overall, and with a corresponding reduction of CO2 emissions of over 1000 tons per year. Project implementation, demonstrator performance, and outcome analysis are reported in the present paper, together with time domain results for the energy network, aiming to communicate the innovative solution implemented.

2. CELSIUS Project

2.1. Project Goals, Partnership and Roadmap

The CELSIUS project is a district heating-cooling demonstration and transfer knowledge project which focuses on increased excellence in smart and integrated urban energy systems. It is a co-funded project by European Union’s Seventh Framework Programme for research, technological development and demonstration (grant agreement No. 314441) in the framework of smart cities projects. It supports the achievement of EU’s 20-20-20 goals by helping cities in addressing energy resilience and security, energy poverty as well as reducing GHG emissions. By creating resilient low carbon energy system, Celsius cities will be able to support energy needs and demand for citizens as well as contribute to mitigate climate change.
The main partners consist of five city groups, with a combination of municipalities, research centers and utility companies for each one. This combined groups represent a key factor as they gather together the main actors involved in heating and cooling infrastructures and systems. CELSIUS cities are the City of Gothenburg, City of Rotterdam, Cologne City, Comune di Genova and London City also including the Islington Council. They have already a proven track-record as well as a strong commitment to increase energy efficiency. All of them are already members of the Covenant of Mayors, the mainstream European movement involving local and regional authorities, voluntarily committing to increasing energy efficiency and use of renewable energy sources in their territories. Research centers are very well represented with members from Imperial College in London, London School of Economics, Technical Research Institute of Sweden, Interactive Institute Ab, Technische Universteit Delft, Fachhochschule Koln, and University of Genoa with specific excellence function as within system integration, production, storage etc. with which they support the demonstrators. The complementary utility companies are Gothenburg Energy for Gothenburg, RheinEnergie for Cologne, UK Power Net for London, Warmtebedrijf Exploitatie and Noun for Rotterdam, and Genova Reti Gas for Genova. They are a strong and committed group who will take major investments in this project as of 55 millions of € and have collectively previously spent hundreds of millions of euros. For CELSIUS these utility companies will build twelve new demonstrators and as well use more than twenty already operational demonstrators to be able to present the full CELSIUS City concept.
An important part of the CELSIUS demonstration projects is devoted to illustrate how cities can become more energy efficient by using the potential of DHC systems to capture and exploit the wide-range of waste heat sources—heat being produced within the city and not being used but just discharged into the local environment—that are available within cities [17]. The CELSIUS project intends also to help cities to understand and embrace the role that the DHC system can play in a city’s future energy system. Moreover, in addition to technical demonstration projects, CELSIUS assesses financial, political, and social barriers to DHC networks, trying to develop solutions to overcome them and developing new business models, in order to both value resource conservation and encourage cities to develop more self-sufficient energy systems. To this extent, as part of this wider engagement, the CELSIUS project aims to recruit fifty cities from across the EU that are interested in the role the DHC system can play. These will form a network of “CELSIUS cities” and the CELSIUS project will use its extensive range of knowledge and expertise—namely “CELSIUS toolbox”—in all areas of intelligent DHC networks to help them better understand how the DHC system can contribute to develop secure, affordable, and low carbon energy systems in their city [18,19].
To this extent, a part of the project would be dedicated to create an expert team, constituted of a mix of utility company managers, technical expertise, and senior personnel. This group of selected people will be involved from time to time in the support of the new city and will provide the necessary know how, depending on the needs of the city itself. This contribution could range from the first steps a city needs to take, in understanding the role that the DHC system could play, to gaining political support within the city for it. Moreover, it can vary from developing a strategic position to help towards planning, developing, specifying, constructing, extending, and/or optimizing intelligent DHC systems within the selected cities.
To begin with, a selected group of seven cities (Athens, Riga, Ghent, Gdynia, Warsaw, Gdansk, and Villadecans)—the Replication Cities (RC)—has been involved in the project. These cities are not directly partners of the project, but have an interest to replicate CELSIUS solutions fitting specifically to their needs, characteristics and city plans. They have already committed themselves via a Letter of Support to be test pilots for the CELSIUS Roadmap.
The idea is to create a complete and general “vision”of a Celsius City, not only to provide just a technical toolbox [20]. A roadmap that can summarize all the learning, expertise and technologies gained by the five partner cities into an approach that can be used to support large-scale deployment of energy infrastructure projects across the EU. This vision, spread out as much as possible, will lead to create political acceptance of the important role intelligent DHC system have to play in the EU’s present and future energy systems and to lobby for a supportive policy, legislative and regulatory framework.

2.2. Demonstrators

There is ever increasing urgency for Europe to make the transformation to a low-carbon and resource efficient economy to meet climate and energy security targets and, more importantly, to avoid catastrophic climate change.
Nowadays, almost 50% of the total energy consumed in the EU is used for the generation of heat for either residential or industrial purposes and the majority of this energy is produced using fossil fuels. With few exceptions, cooling is, achieved through processes driven either by electricity, which is still mainly produced from fossil fuels, or waste heat, where generated and is often not even captured or used for meeting heat demand elsewhere.
Several key challenges obstruct Europe’s cities to become the resource efficient and low carbon cities they are required to be in the global economy of the 21st Century.
First of all, many European cities show a lack of thermal grid coverage. To reverse this trend, it is needed the development of new ground-breaking and financially competitive thermal grids; state-of-the-art solutions have already been implemented in some urban areas, but the lessons learnt and experiences need to be shared more widely. At present, new efficient thermal networks tend to be limited to small areas as this is the easier way in a city to start the building of district heating.
Another important challenge is represented by the huge amount of waste or secondary energy generated but not captured and utilized for heating purposes nowadays in the EU. Waste heat produced in the EU would actually be sufficient for heating the EU’s entire building stock. At the same time, there is just not the heating distribution grid available to transfer it to where it is demanded and thus it can be used. Therefore, it is currently necessary to demonstrate and develop innovative technologies able of raising the recovery of waste energy. In addition, it is crucial to define, implement, and test business models that evaluate an agreed fair price, for example in respect to industrial waste heat providers, for delivering waste heat to a network or a final user.
In this sense, it is fruitful to capitalize existing experience and ongoing research activity, in particular regarding Energy Networks Integration and Urban Energy Hubs. Celsius demonstrators just operate in this direction, opening to on-field application of concepts as Distributed Energy Resources optimization [21] and Urban Energy Hub [22]. This last approach analyzes the relations between input and output energy flows and thus can be used to reduce energy consumption and optimize waste energy recovery. The energy hub concept includes decentralized and local energy technologies such as photovoltaic, biomass, or small hydro power, together with district heating systems, building and district conversion, and storage technologies at neighborhood level [23]. These methods, as well as simulation tools for district scale energy systems [24], can be therefore capitalized and applied in order to increase the efficiency of urban energy systems.
In order to use energy in the most sustainable way, it seems of crucial importance to reduce peak loads and avoid unnecessary energy supply from fossil fuel driven processes. As the construction and industrial sectors develop more energy efficient solutions, this will start to skew energy demand away from heat, increasingly redirecting it towards cooling. In addition, more energy efficient buildings will also have more dynamic energy demand profiles that will require intelligent storage and load control in combination with energy management systems and increased awareness of the end user.
The solution seems to be intelligent process integration built on flexible systems that are ready for a dynamic world using less energy, so that the energy supplied can ultimately come from energy efficient and renewable energy technologies, such as CHP [25].
One of the main goals of CELSIUS project is to demonstrate a cost-effective and energy efficient heating and cooling system for replication and massive role, while ensuring a healthy urban environment. Nonethless recovering waste energy in an efficient and smart way seems crucial like favouring the integration of renewable energy. A possible goal seems a total primary energy reduction of 4500 TWh/year, and a reduction of 900 MMTCD (Million Metric Tonnes of Carbon Dioxide) per year.
The CELSIUS project will show the range of opportunities that exist for using DHC networks to maximize the efficient use of primary and secondary energy sources in a city: this will be done through a series of related and complementary demonstration projects. CELSIUS intends to play a leading role in allowing cities to make a cost effective transition to a low carbon and resource efficient economically competitive city.
The CELSIUS project will have twelve new demonstration projects (see Table 1) and, in addition, twenty existing ones in Cologne, Genoa, Gothenburg, London, and Rotterdam. These cities will evaluate and apply the technical, social, and economic feasibility of the CELSIUS vision and concept and will use the experience and learning to compile a competitive and energy efficient CELSIUS urban heating and cooling concept. The aim is that the product of the CELSIUS project, a toolbox, will then be able to support any city in Europe to maximize the utilization of its primary and secondary energy resources in an integrated way that minimizes its operational costs and carbon emissions whilst maximizing its energy efficiency [26].
Table 1. Former CELSIUS new demonstrators list.
NameCodeCity
Using buildings as short term storageGO1Gothenburg
District heating to white goodsGO2Gothenburg
District heating to shipsGO3Gothenburg
The Heat HubRO1Rotterdam
Industrial EcologyRO2Rotterdam
Connection of existing industriesRO3Rotterdam
Integrating cooling solutionsRO4Rotterdam
Active Network Management and Demand ResponseLO1London
Capture of two sources of waste heat and the integration of a thermal storeLO2London
The extension of the Bunhill “seed” networkLO3London
Sewage WaterCO1Cologne
Energy recovery from the natural gas distribution networkGE1Genoa
Through a collaboration with key-actors across the value chain—cities, utilities, industry, innovative and energy-efficient technology suppliers, politicians, and financiers and the leading European universities and research centers—CELSIUS will assure that the targets for the demonstrators will be achieved. They will in fact contribute to developing the CELSIUS toolbox and will be physically available for new replication cities in each stage of the implementation.

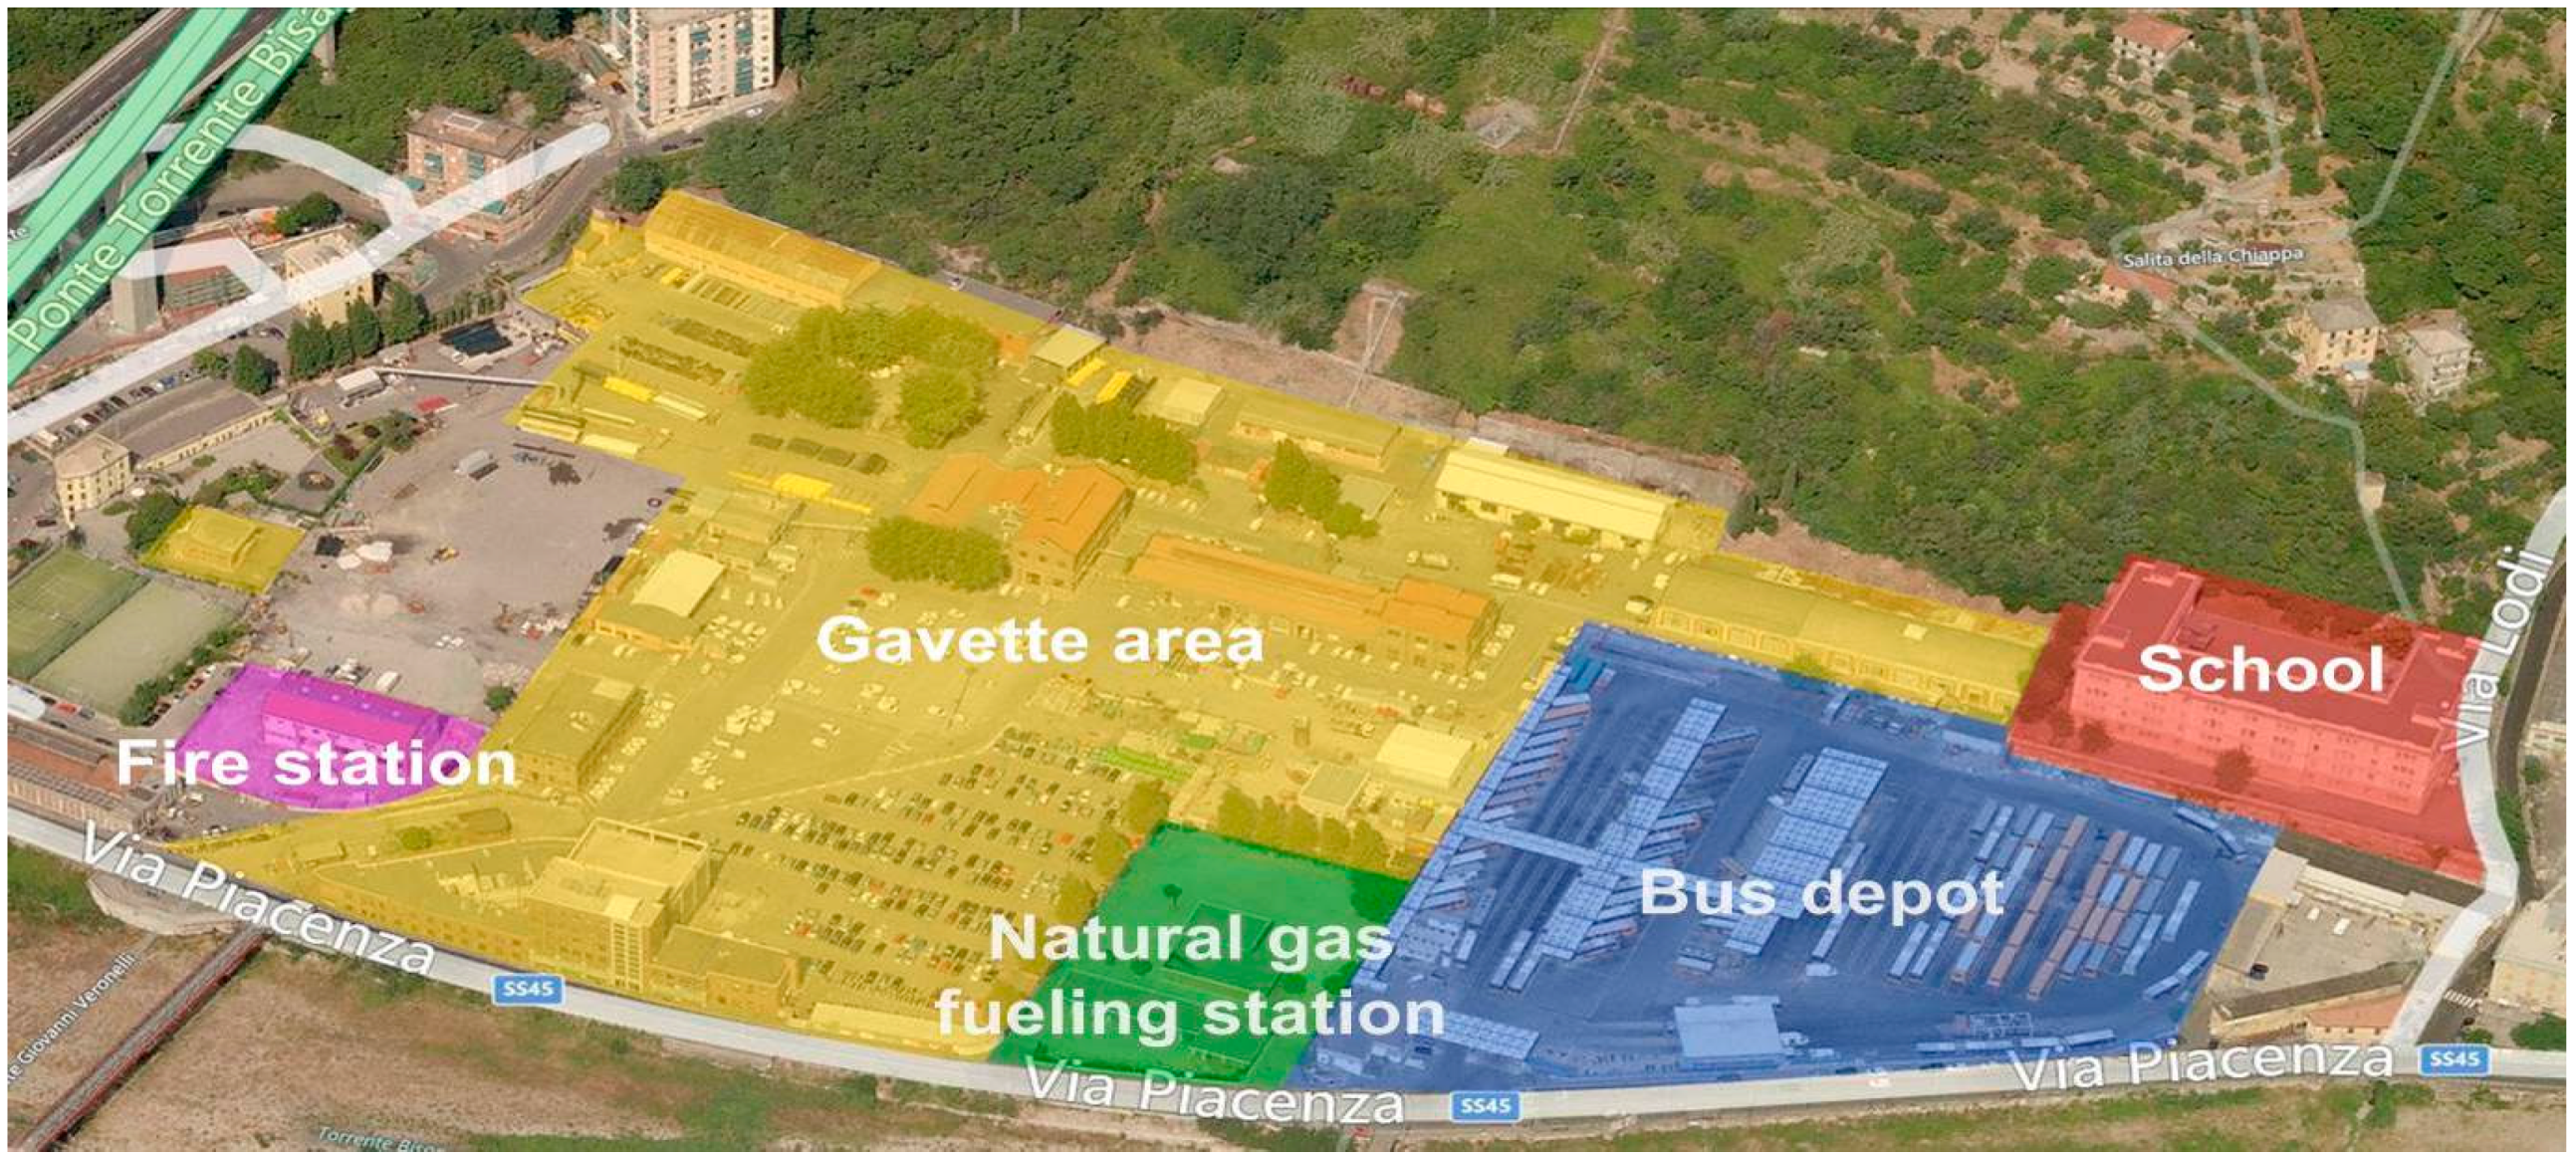
3. The Genoa’s Demonstrator

The district of Genoa Gavette is located in the north of the city (Latitude: 44.435|Longitude: 8.959). The area includes different industrial activities, residential buildings and offices. From the energy point of view, the whole district requires a high amount of heat and a discrete electrical demand throughout the year (Figure 1).
The high concentration of energy demand, as is described in the following paragraphs, provides the economic basis for a possible innovative improvement of production systems.
Major area’s industries concern the distribution of natural gas, accomplished by two different activities: through a central expander, for the distribution through the town piping network, and through a compressor station for the refueling of vehicles.
Additional needs come from the electrical and thermal demands to supply a central fire department, a school, mechanical workshops, dressing rooms, and offices of companies operating in the nearby areas such as public transport and distribution of domestic water and gas.
Figure 1. Aerial representation of the Gavette district.
Sustainability 07 15841 g001

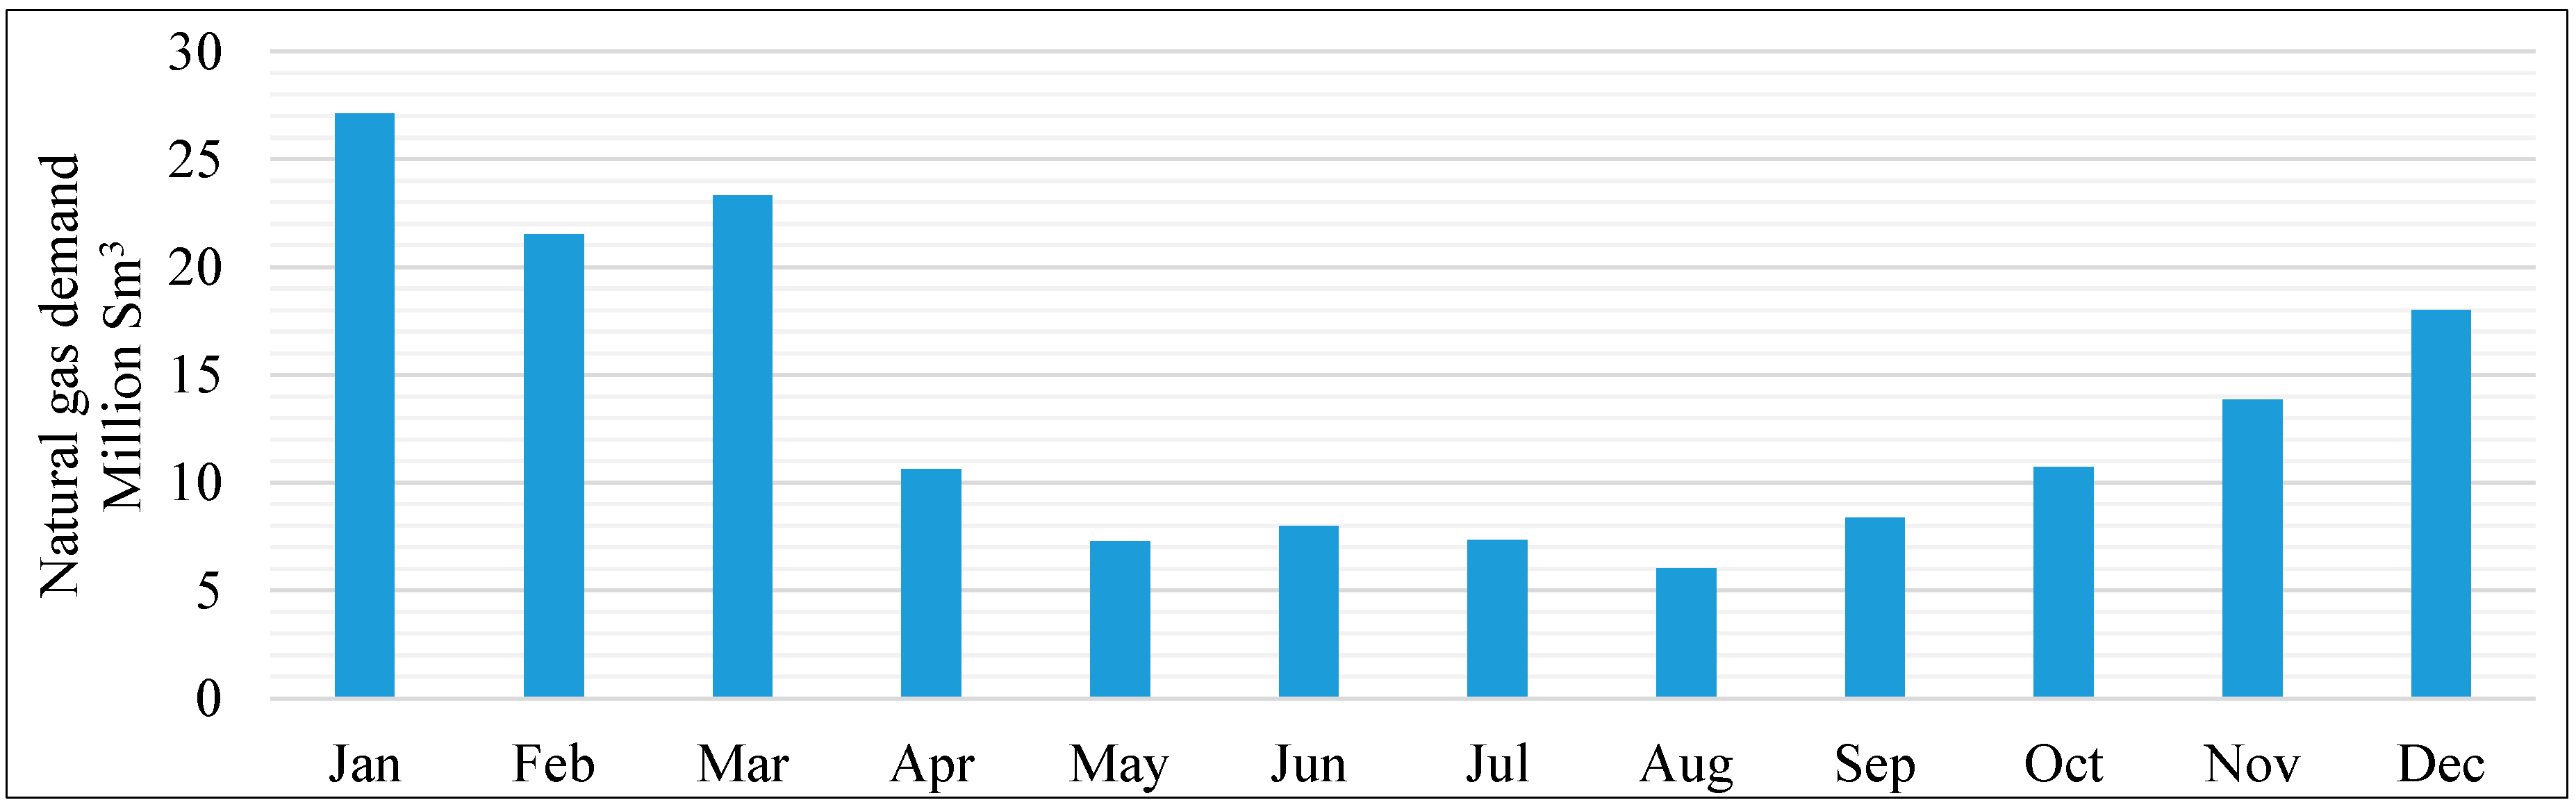
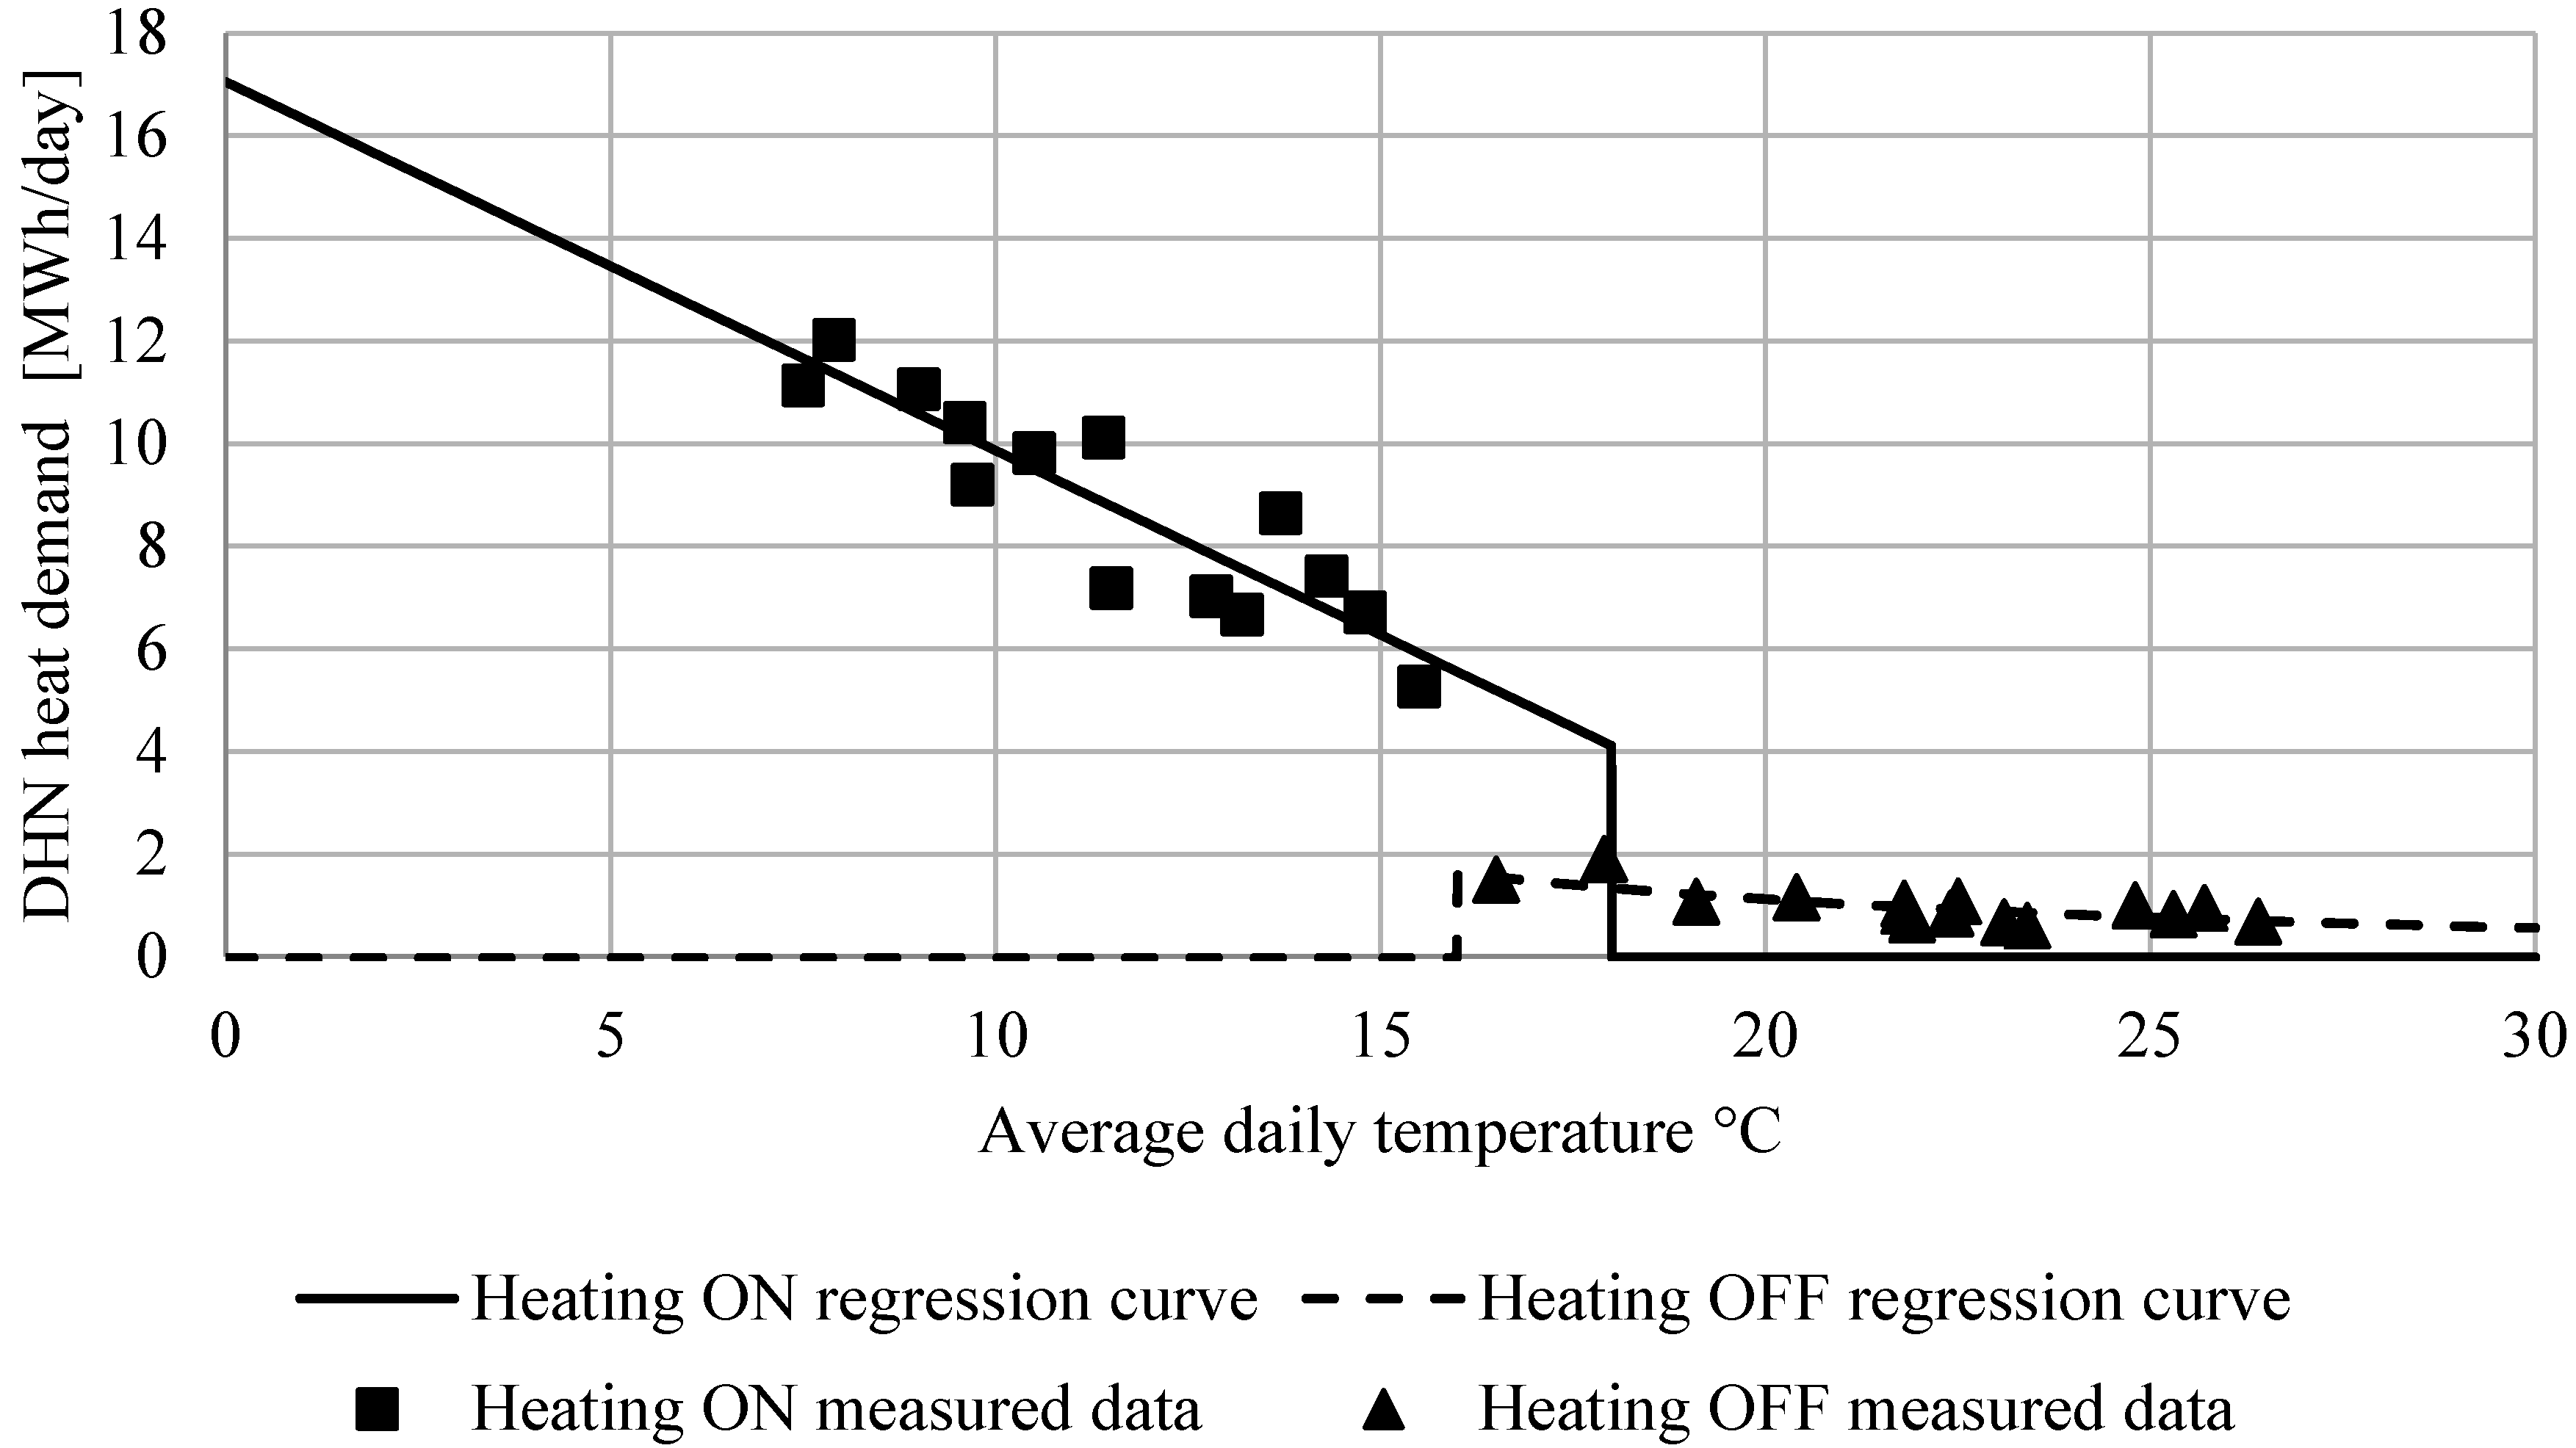
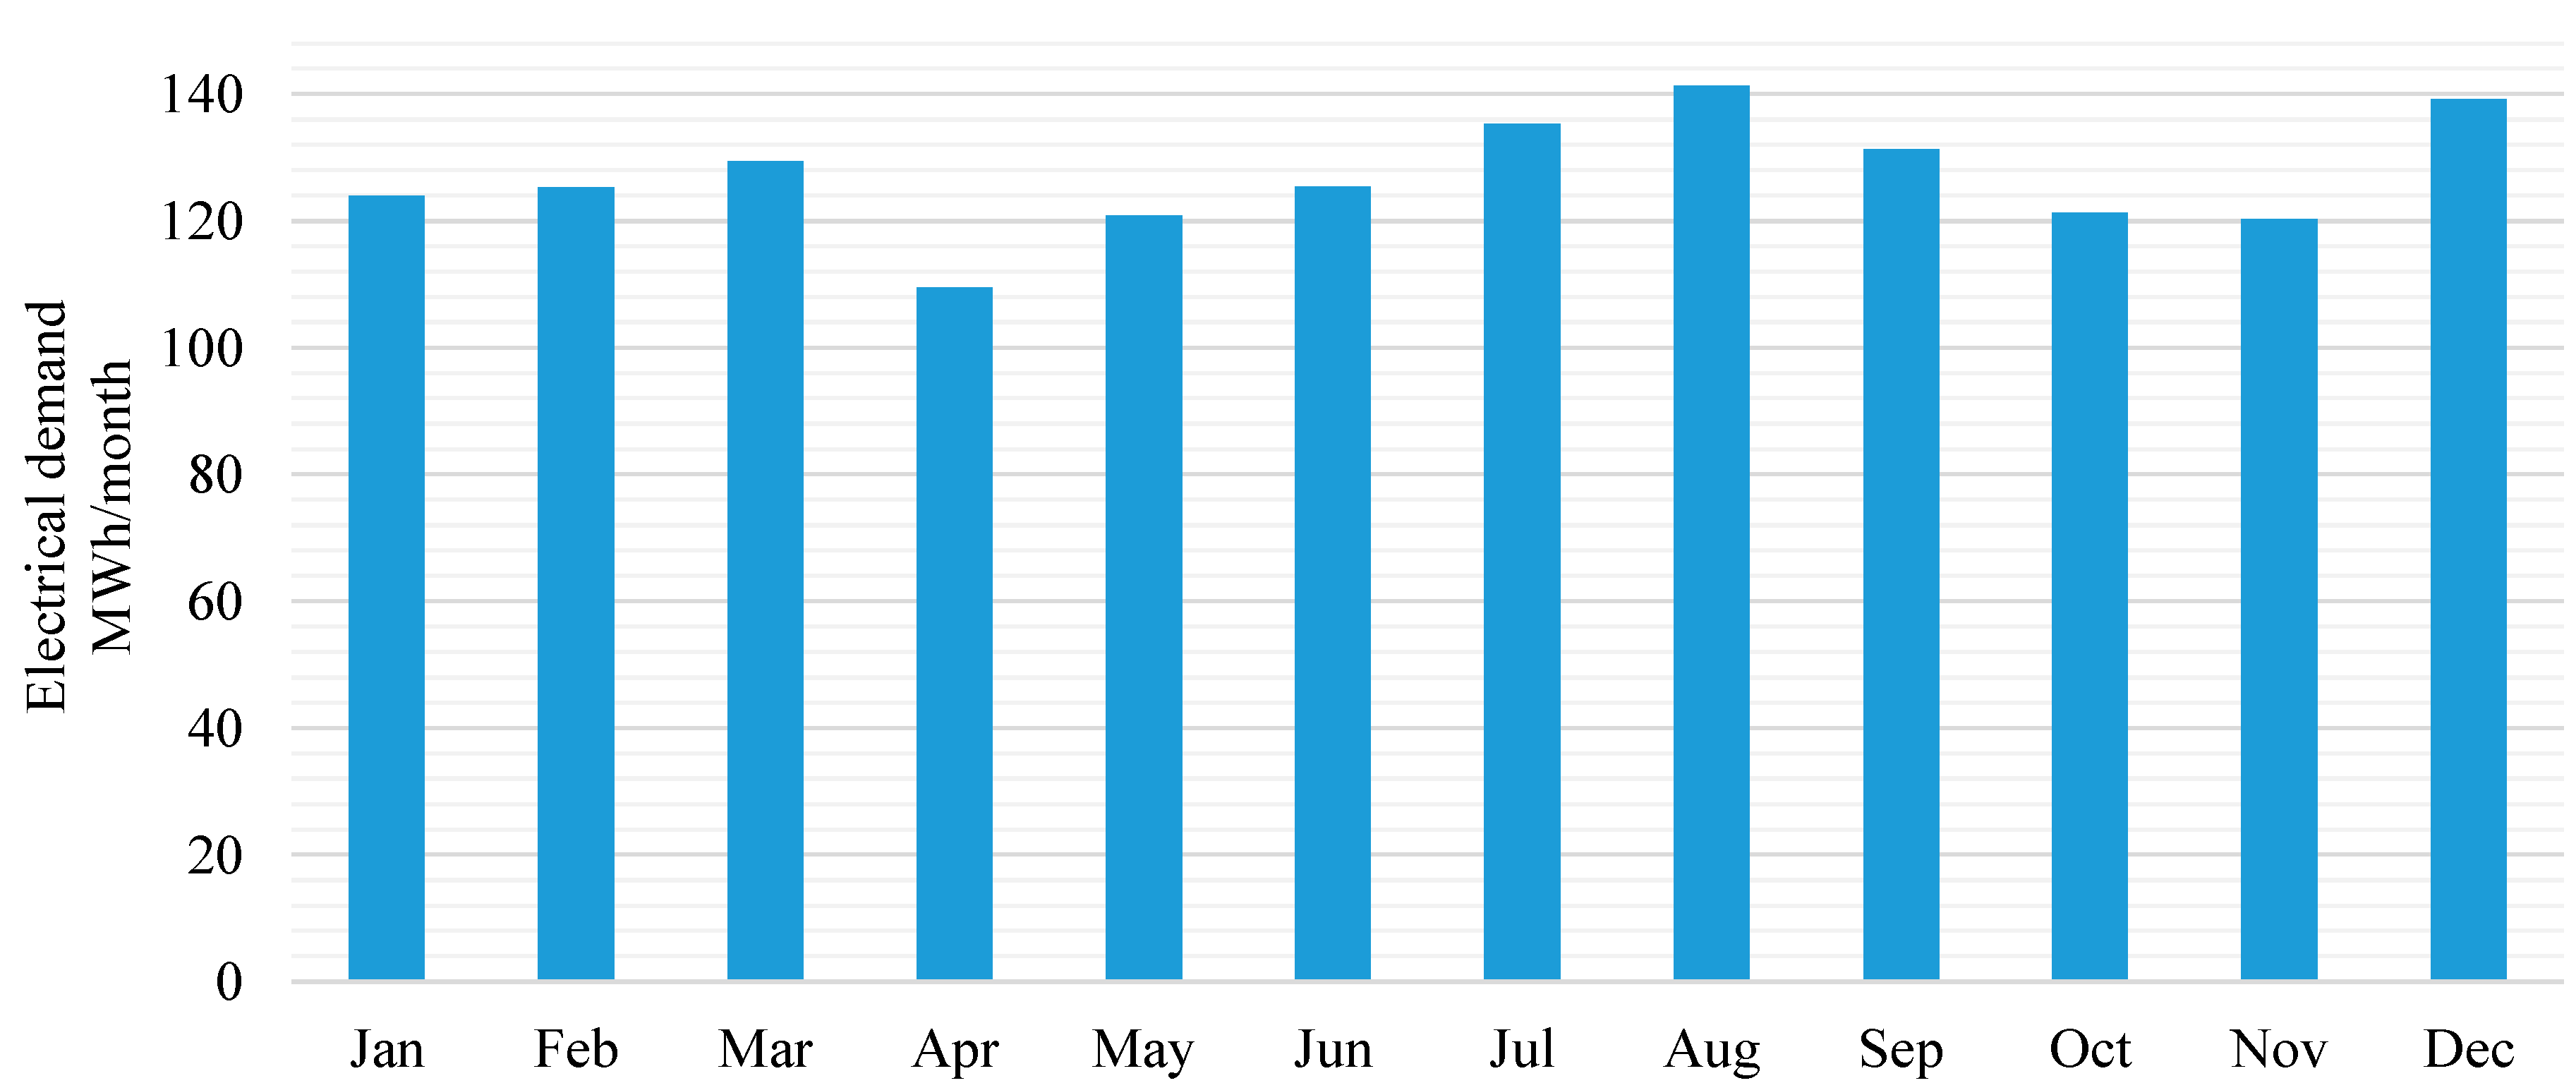
3.1. The Local Energy Demand and Waste Energy Potential

The local energy need of the district is now provided by the natural gas station. The use of gas in Genoa is closely linked to the building heating’s sector, as there is a prevalent use of gas instead of gasoline or other fossil fuels. The industrial use is rather limited since there is only small activity with small energy demands. Thus, gas volumes processed by the plant (Figure 2) have a strong seasonal variation closely related to the periods when the heating systems are turned on (according to Genoa heating regulation, from 1 November to 15 April).
The natural gas is captured from the national transport network at a pressure of 24 barg; it is then processed in order to reduce the pressure to 5 barg necessary for its distribution at the city level.
The expansion process is actually developed using throttling valves, in according with the Joule-Thompson principle, in order for this system to accomplish an isenthalpic transformation dissipating the pressure energy contained in the fluid. The expansion process would result in an excessive reduction of the temperature of the expanded gas affecting the safety of the plant due to the risk of freezing of the moving parts and to the possible formation of hydrates and ice. Thus, in the Gavette plant the gas must be suitably heated before its expansion (a process commonly known as Gas Preheating Process). With the actual throttling valves, the gas temperature drops down about 7 °C–10 °C, so needing a specific preheating heat of about 15 kJ/ Sm NG 3 .
Energy requirements, both electrical and thermal, of the other activities of the district can be observed, in order to study the trends through data coming from the various energy meters currently in use. Figure 3 shows the trend of the total daily district’s thermal demand for building’s heating and Domestic Hot Water (DHW) purposes, varying with the average environmental temperature and the heating season. Figure 4 proposes instead the values of the electric district’s demand which, on the contrary, is constant throughout the year. In order to pursue a better time granularity, a further model to simulate the demand time history could have been adopted [27], but this refinement was considered beyond the current targets.
Actually, the thermal demand is supplied by two liquid water natural gas boilers while the national grid provides electricity.
Figure 2. Monthly volumes of natural gas (NG) processed in the expansion plant.
Sustainability 07 15841 g002
Figure 3. Variation of the aggregated daily building thermal demand with the average daily temperature.
Sustainability 07 15841 g003
Figure 4. Monthly aggregated electric energy demand of the district.
Sustainability 07 15841 g004

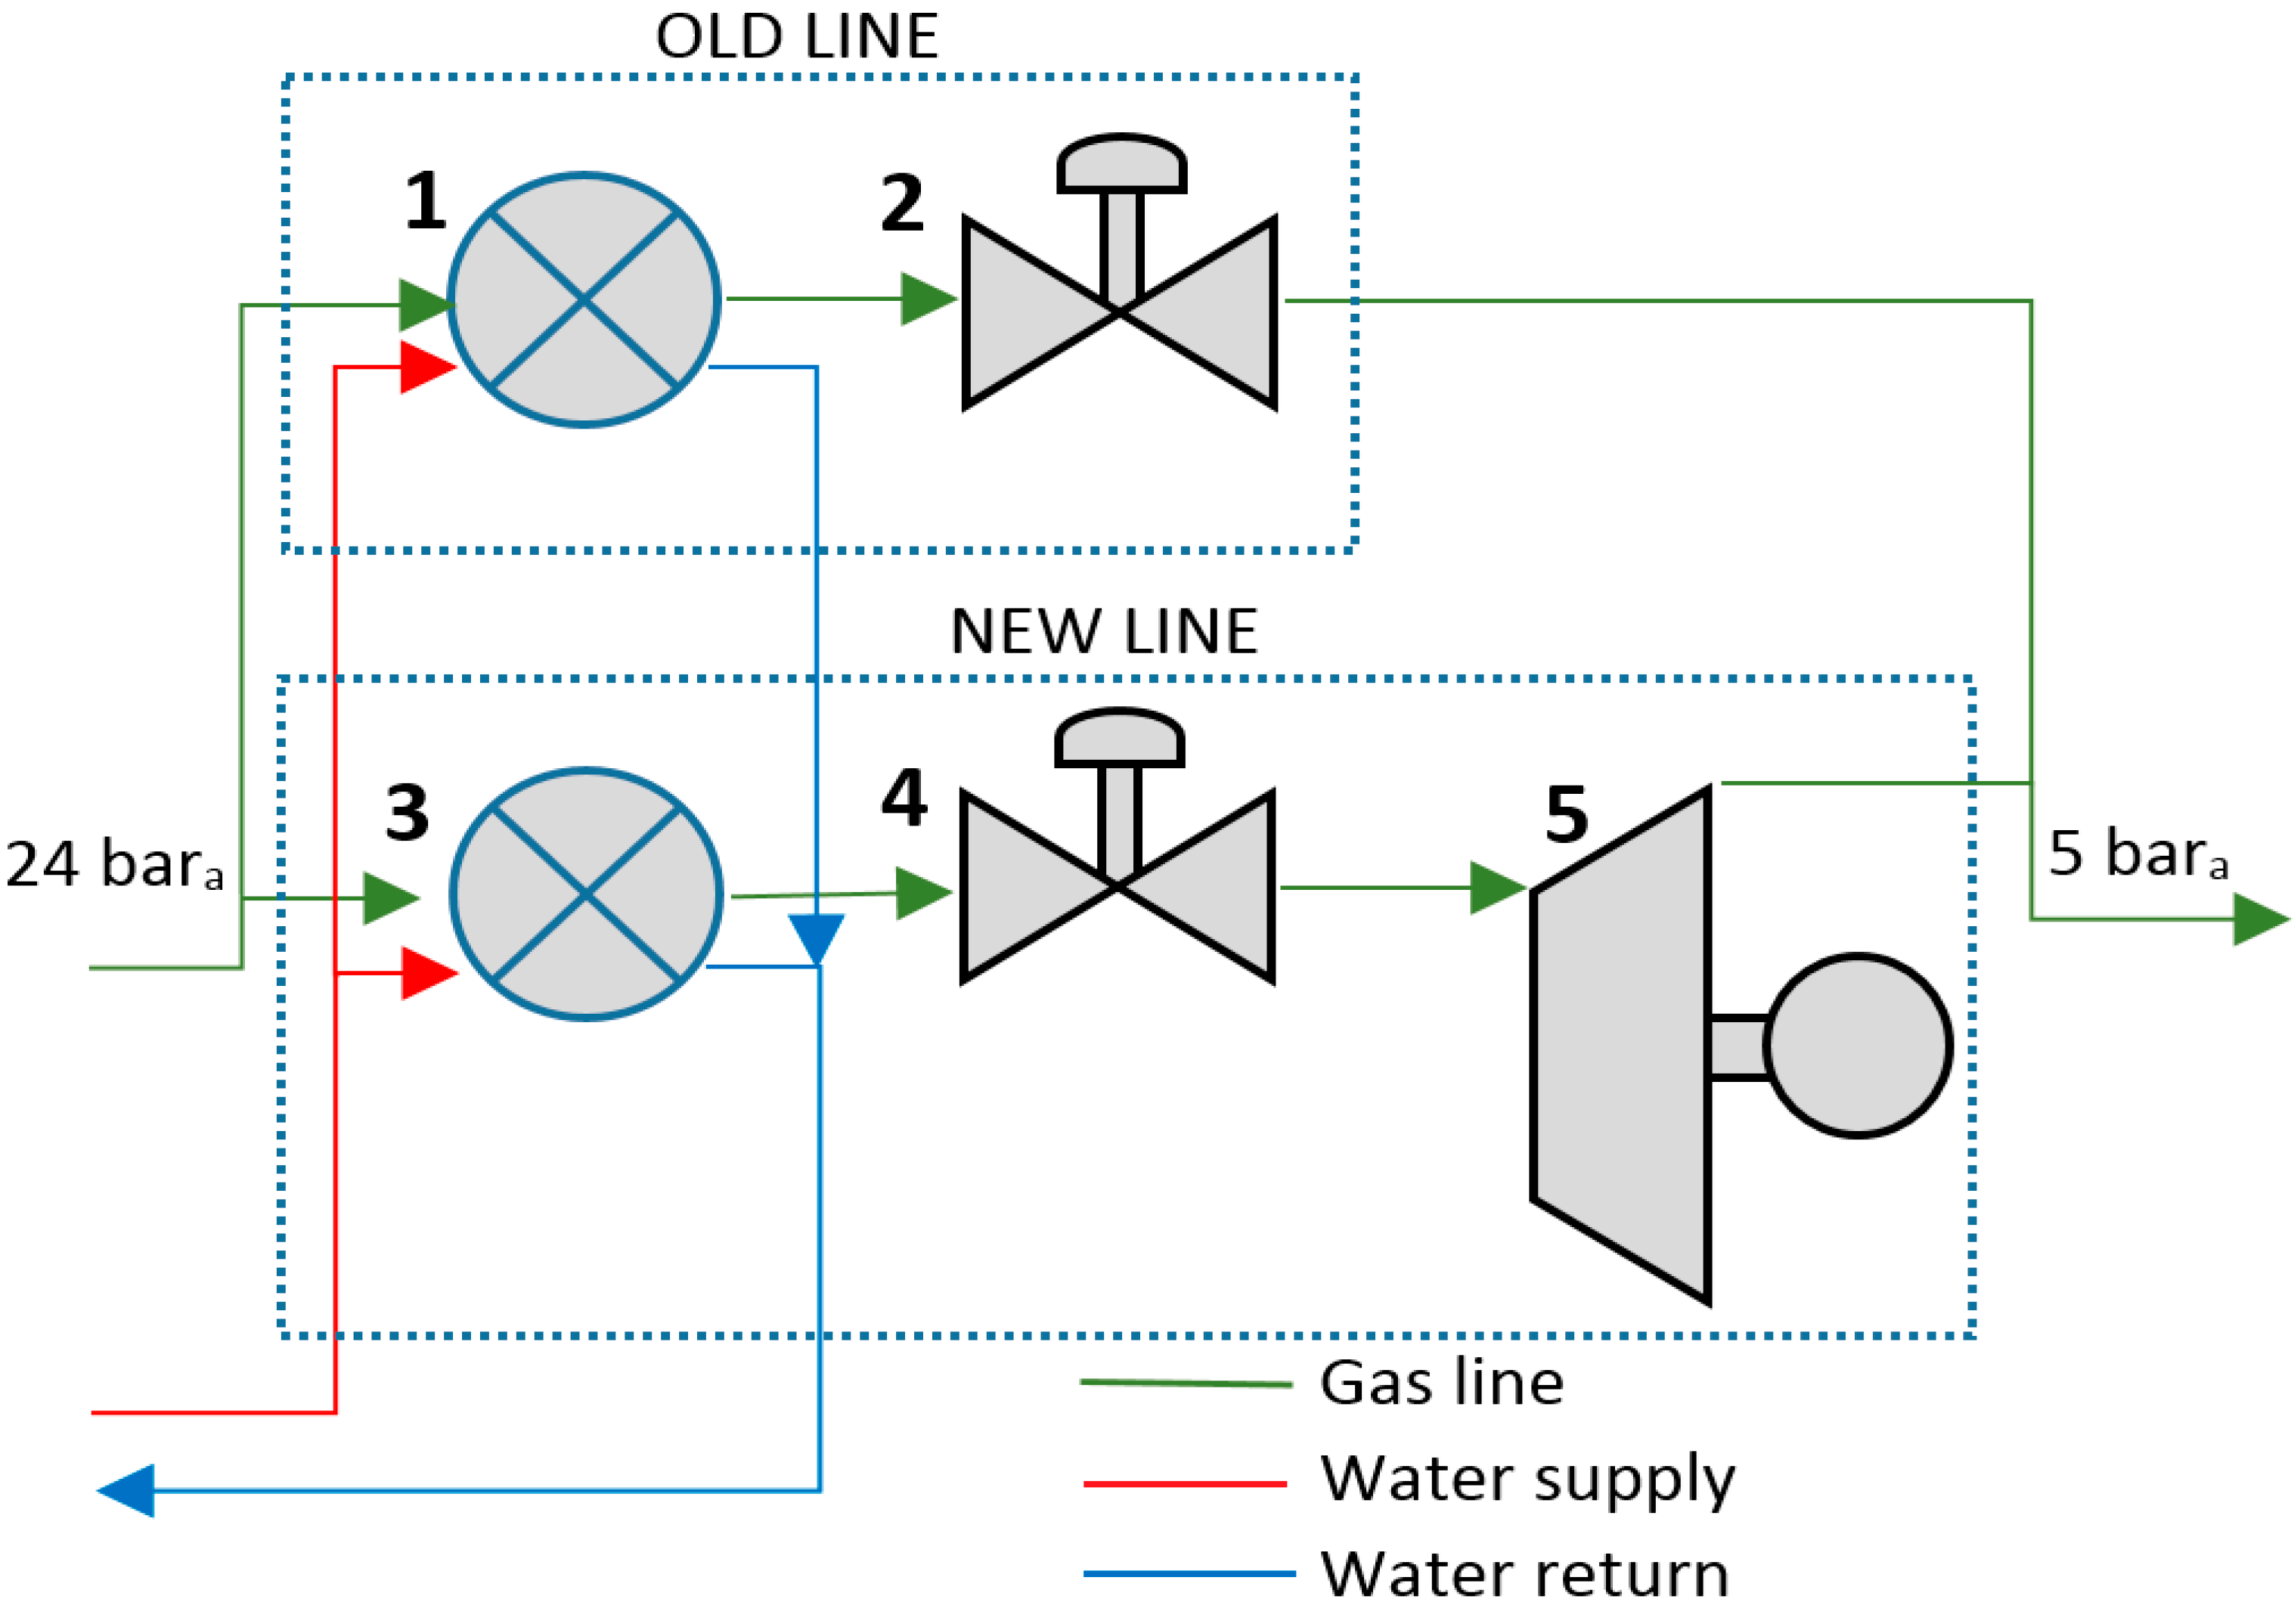
3.2. The Demonstrator Design

As abovementioned, CELSIUS provides the realization of plants to demonstrate and promote innovative technologies on renewable and waste energies.
The Genoa’s demonstrator will be built in the Gavette district and will promote improvements along the entire energy chain: from production through distribution to the final users (Figure 5).
The strength of the project is the recovery of energy from the pressure drop required for the distribution of natural gas [28,29,30]. In parallel to the current expansion valves a turboexpander will be introduced, with the aim of converting part of the mechanical energy of the gas into electricity that can be consumed by users of the district or sell in the national electric market (Figure 6).
The turbo expansion of natural gas is still rarely used in distribution systems at town levels, due to the high costs of the machines.
The technological level of this radial turbomachinery is very high. Though the temperatures involved are substantially lower than a gas turbine, many other issues are due to the type of working fluid, the natural gas. In particular, any leakage of gas must be recirculated in the distribution circuit to avoid the creation of an explosive environment.
It is worth noting that that the turboexpander must ensure the proper pressure distribution of the downstream line. The operating characteristics of the machine must therefore be adaptable to different load conditions, such as gas flow rate and inlet pressure, in order to maintain the outlet pressure in a close range of variation. The machine then adjusts the downstream pressure, keeping high conversion yields, through a stator angle control and the rotation speed. An expansion valve is often placed upstream of the turbomachine, as an additional tool to control the gas flow evolving and to reduce the pressure fluctuations. Due to the high nominal speed of rotation, it is possible to support the axis of the machine through magnetic bearings, as in the case for the Genoa demonstrator.
The correct sizing of the turboexpander is crucial for maximizing the energy recovered and minimizing the payback period. In this kind of delicate procedure, a good knowledge of the seasonal and most importantly the hourly trends of the gas flow demand are required, in addition to the steady characteristics of the plant such as operating pressures, in order to maximize the flow expanded by the turboexpansion line instead of the conventional valves line.
The characteristic curve of the selected turboexpander is standard for that category of machineries and presents the following features:
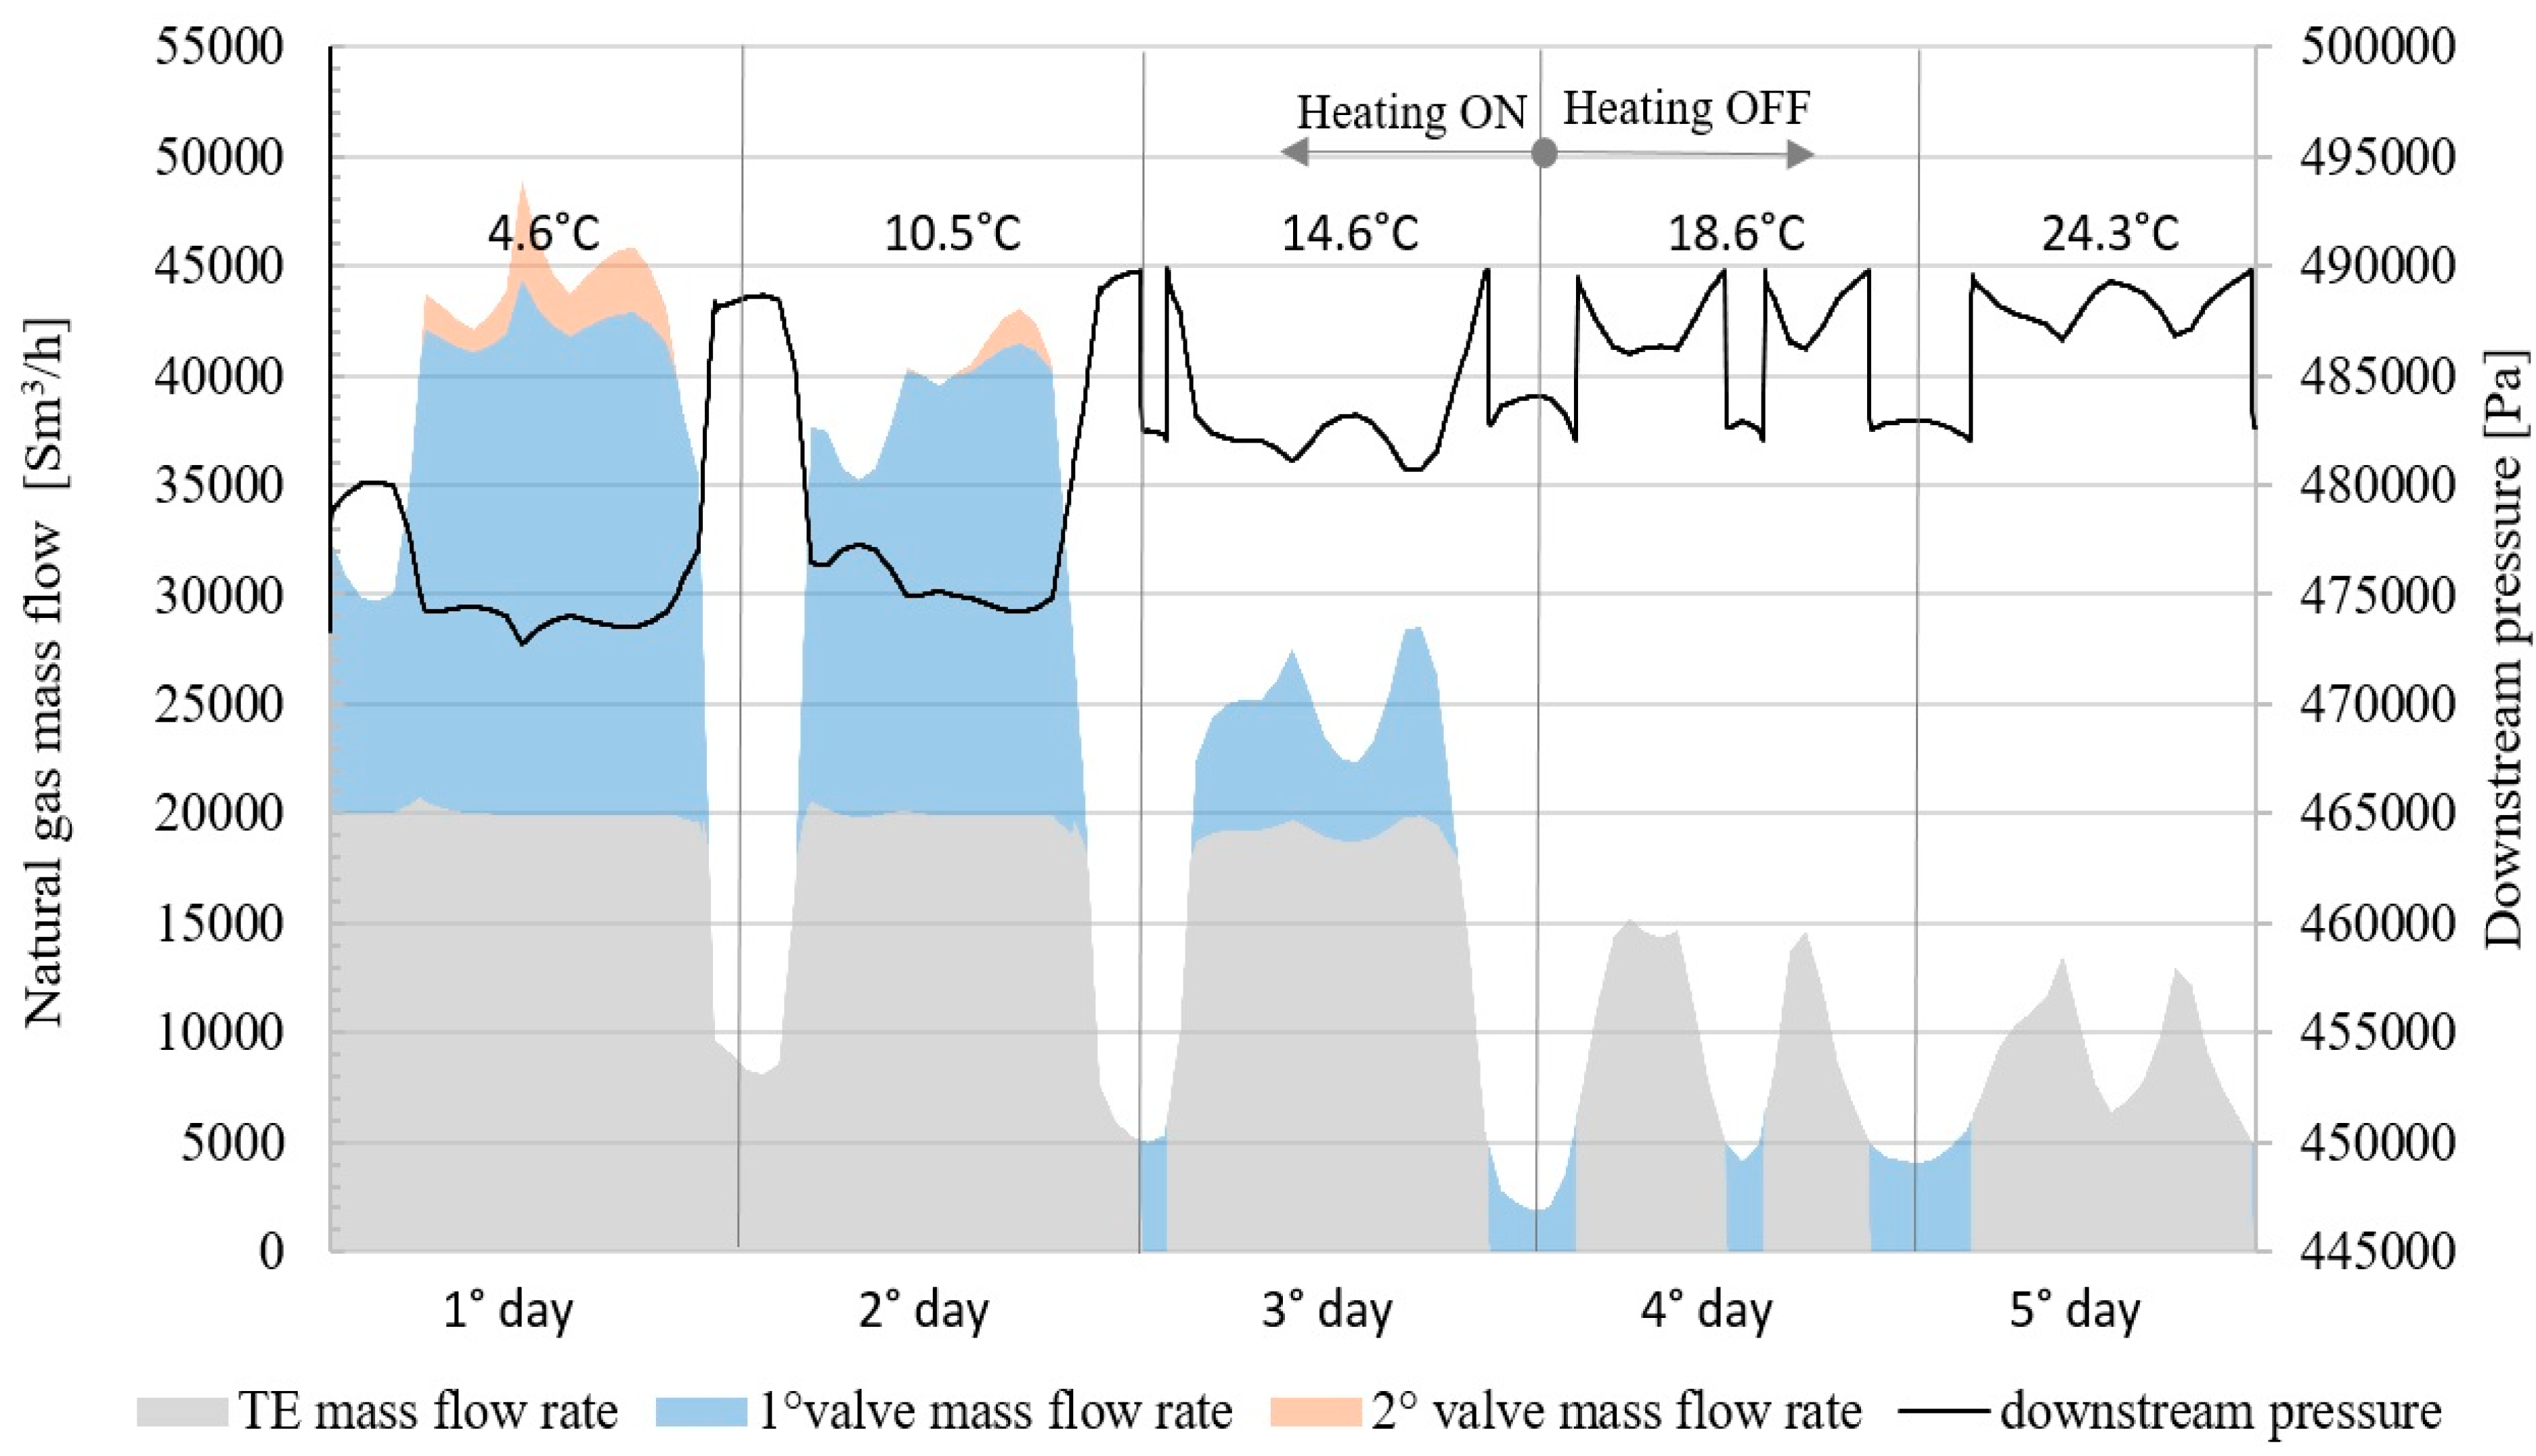
  • if the gas demand exceeds the maximum value (about 120% of the design mass flow), it means that the conventional valves line processes the surplus;
  • if the gas demand is lower than the minimum the machine stops, due to the low conversion performance, and the whole flow leads through the valves line.
Figure 5. Demonstrator’s energy flows.
Sustainability 07 15841 g005
Figure 6. Sketch of the natural gas expansion plant: (1) Throttling valves line gas preheater; (2) Throttling valve; (3) Turboexpander line preheater; (4) Flow regulation valve; (5) Turboexpander.
Sustainability 07 15841 g006
The turboexpander is capable of delivering a nominal power of 550 kWe. The design working flow rate is 22,500 Sm3/h, a value that is slightly lower than the average hourly flow rate of the system, corresponding to a minimum flow rate of about 3500 Sm3/h ensuring that the machine operates a long time even when demand is low.
Proper sizing of the unit must ensure an effective use of the machine throughout the year; a check can be carried out by verifying some natural gas line operative parameters:
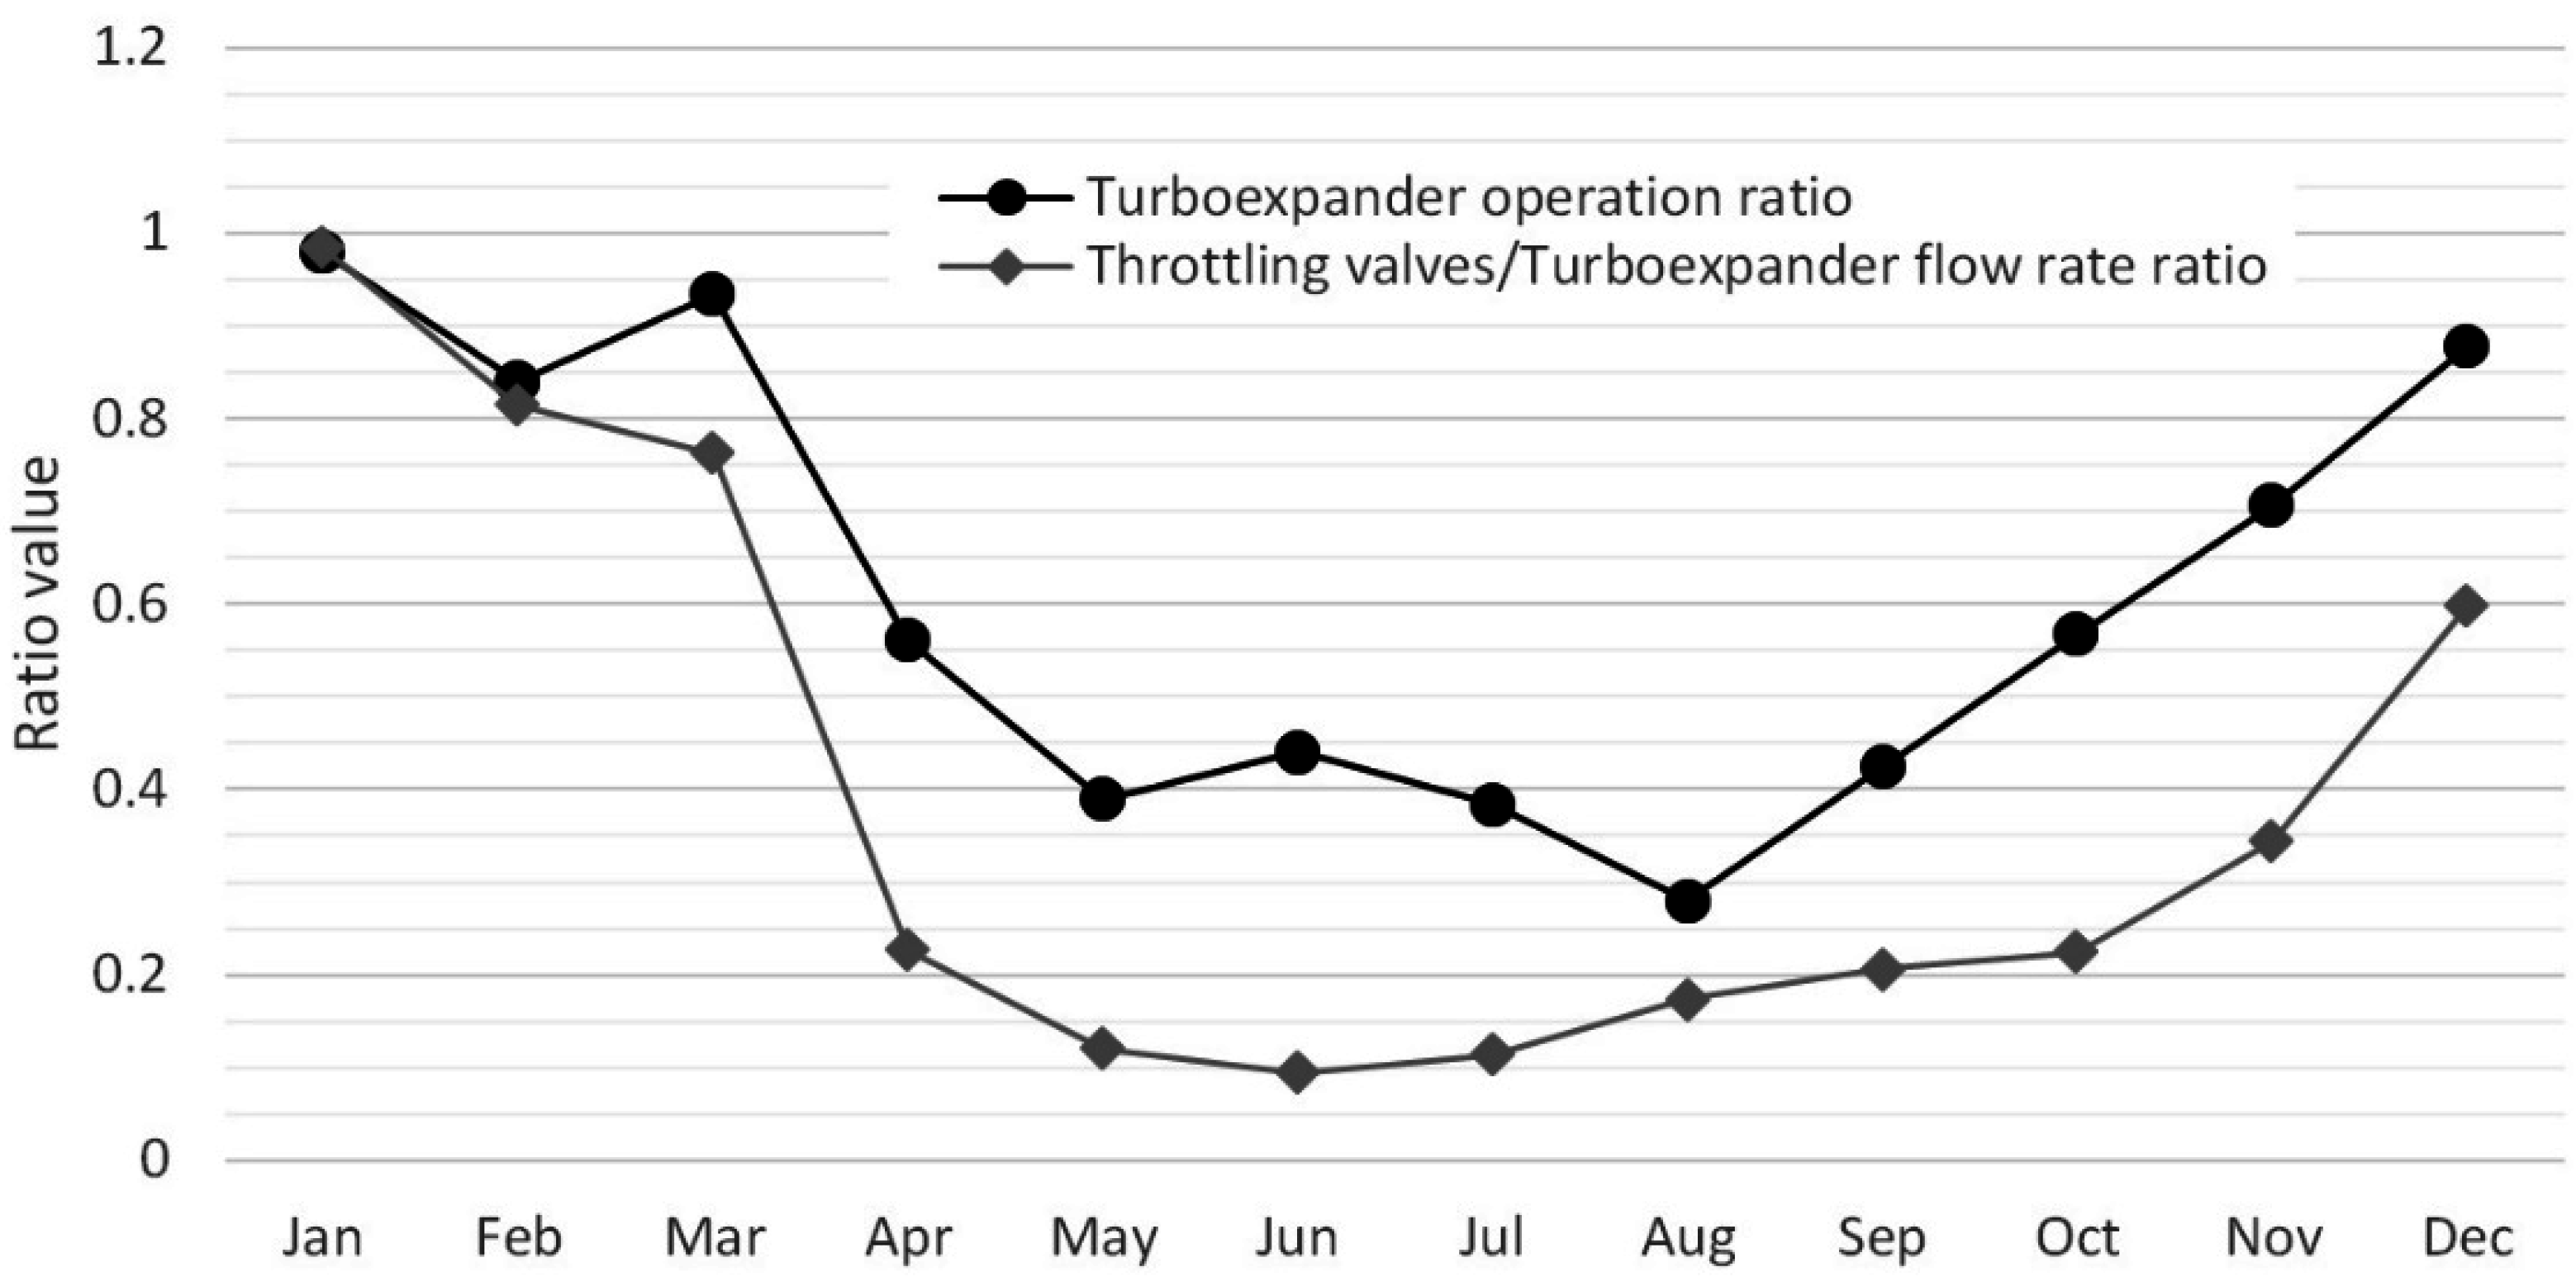
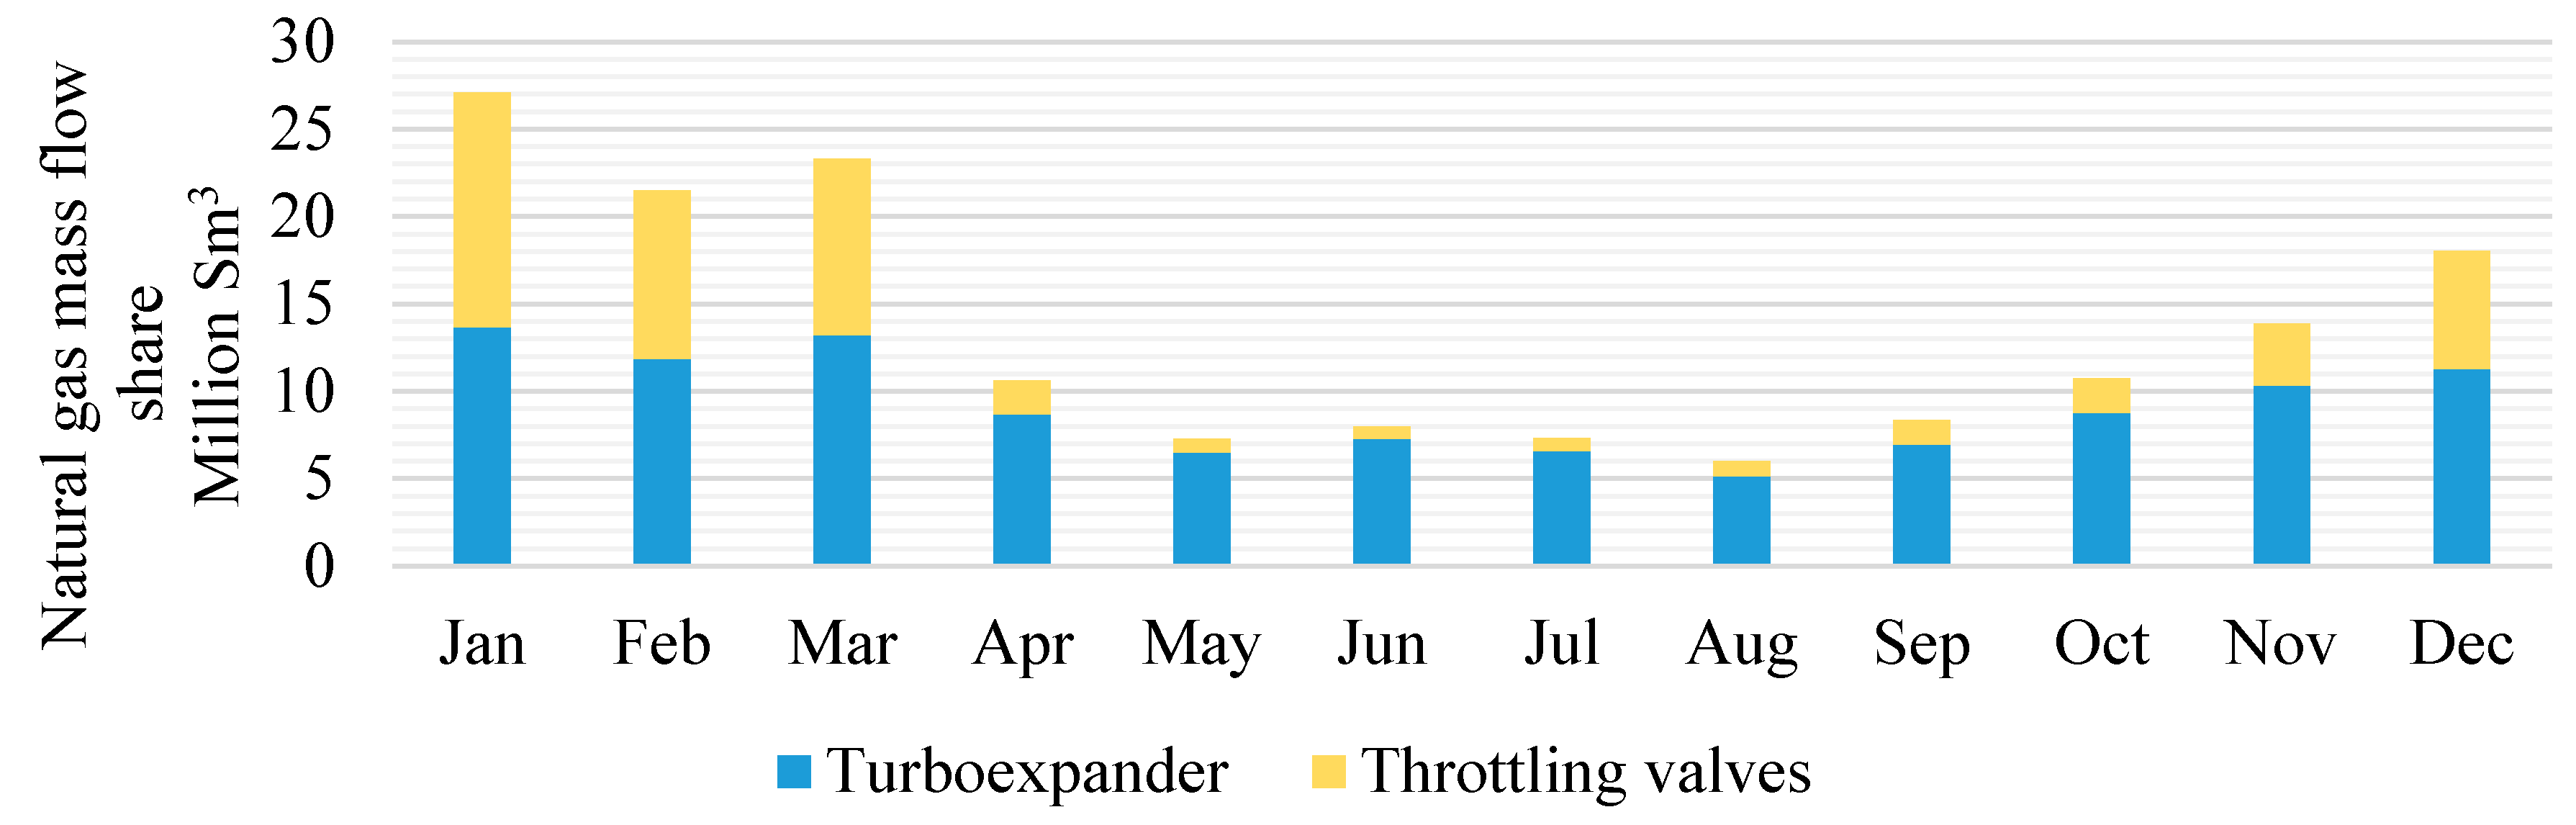
  • the turboexpander operation ratio, defined as the ratio between the monthly NG mass elaborated and the processable one in nominal conditions, which must be as close as possible to the unit in order to maximize the hours of steady state operation of the machine;
  • the throttling valves versus turboexpander flow rate ratio, defined as the ratio between the monthly mass of gas processed by the conventional gas line and the one processed by the turbomachine, which must be as low as possible, ideally zero, to minimize the unrecovered energy.
The monthly trends of the aforementioned parameters are displayed in Figure 7. Note that the coefficient of use of the turboexpander assumes values close to unity during high demand periods, when the turboexpander is able to process approximately from a half to two thirds of the entire gas volumes. On the contrary, the minimum values correspond to low demand periods, when the turboexpander operates approximately from 30%–50% of its potential whilst processing almost all the required gas.
Despite the implementation of the turboexpander, preheating of the gas is necessary whenever an expansion, through dissipative valves, occurs. In fact, the turbo expansion process can cause critical cooling of the gas, thus the fluid must be heated up to about 75 °C by introducing a heat demand, per kg of gas processed, approximately six times higher than the conventional isenthalpic expansion.
In order to improve the effectiveness of the whole process, a CHP unit is introduced, connected to the thermal network in series to the current boilers [31,32]. The thermal production plant must supply heat to different users; below the diverse heat demands and temperature requirements are reported:
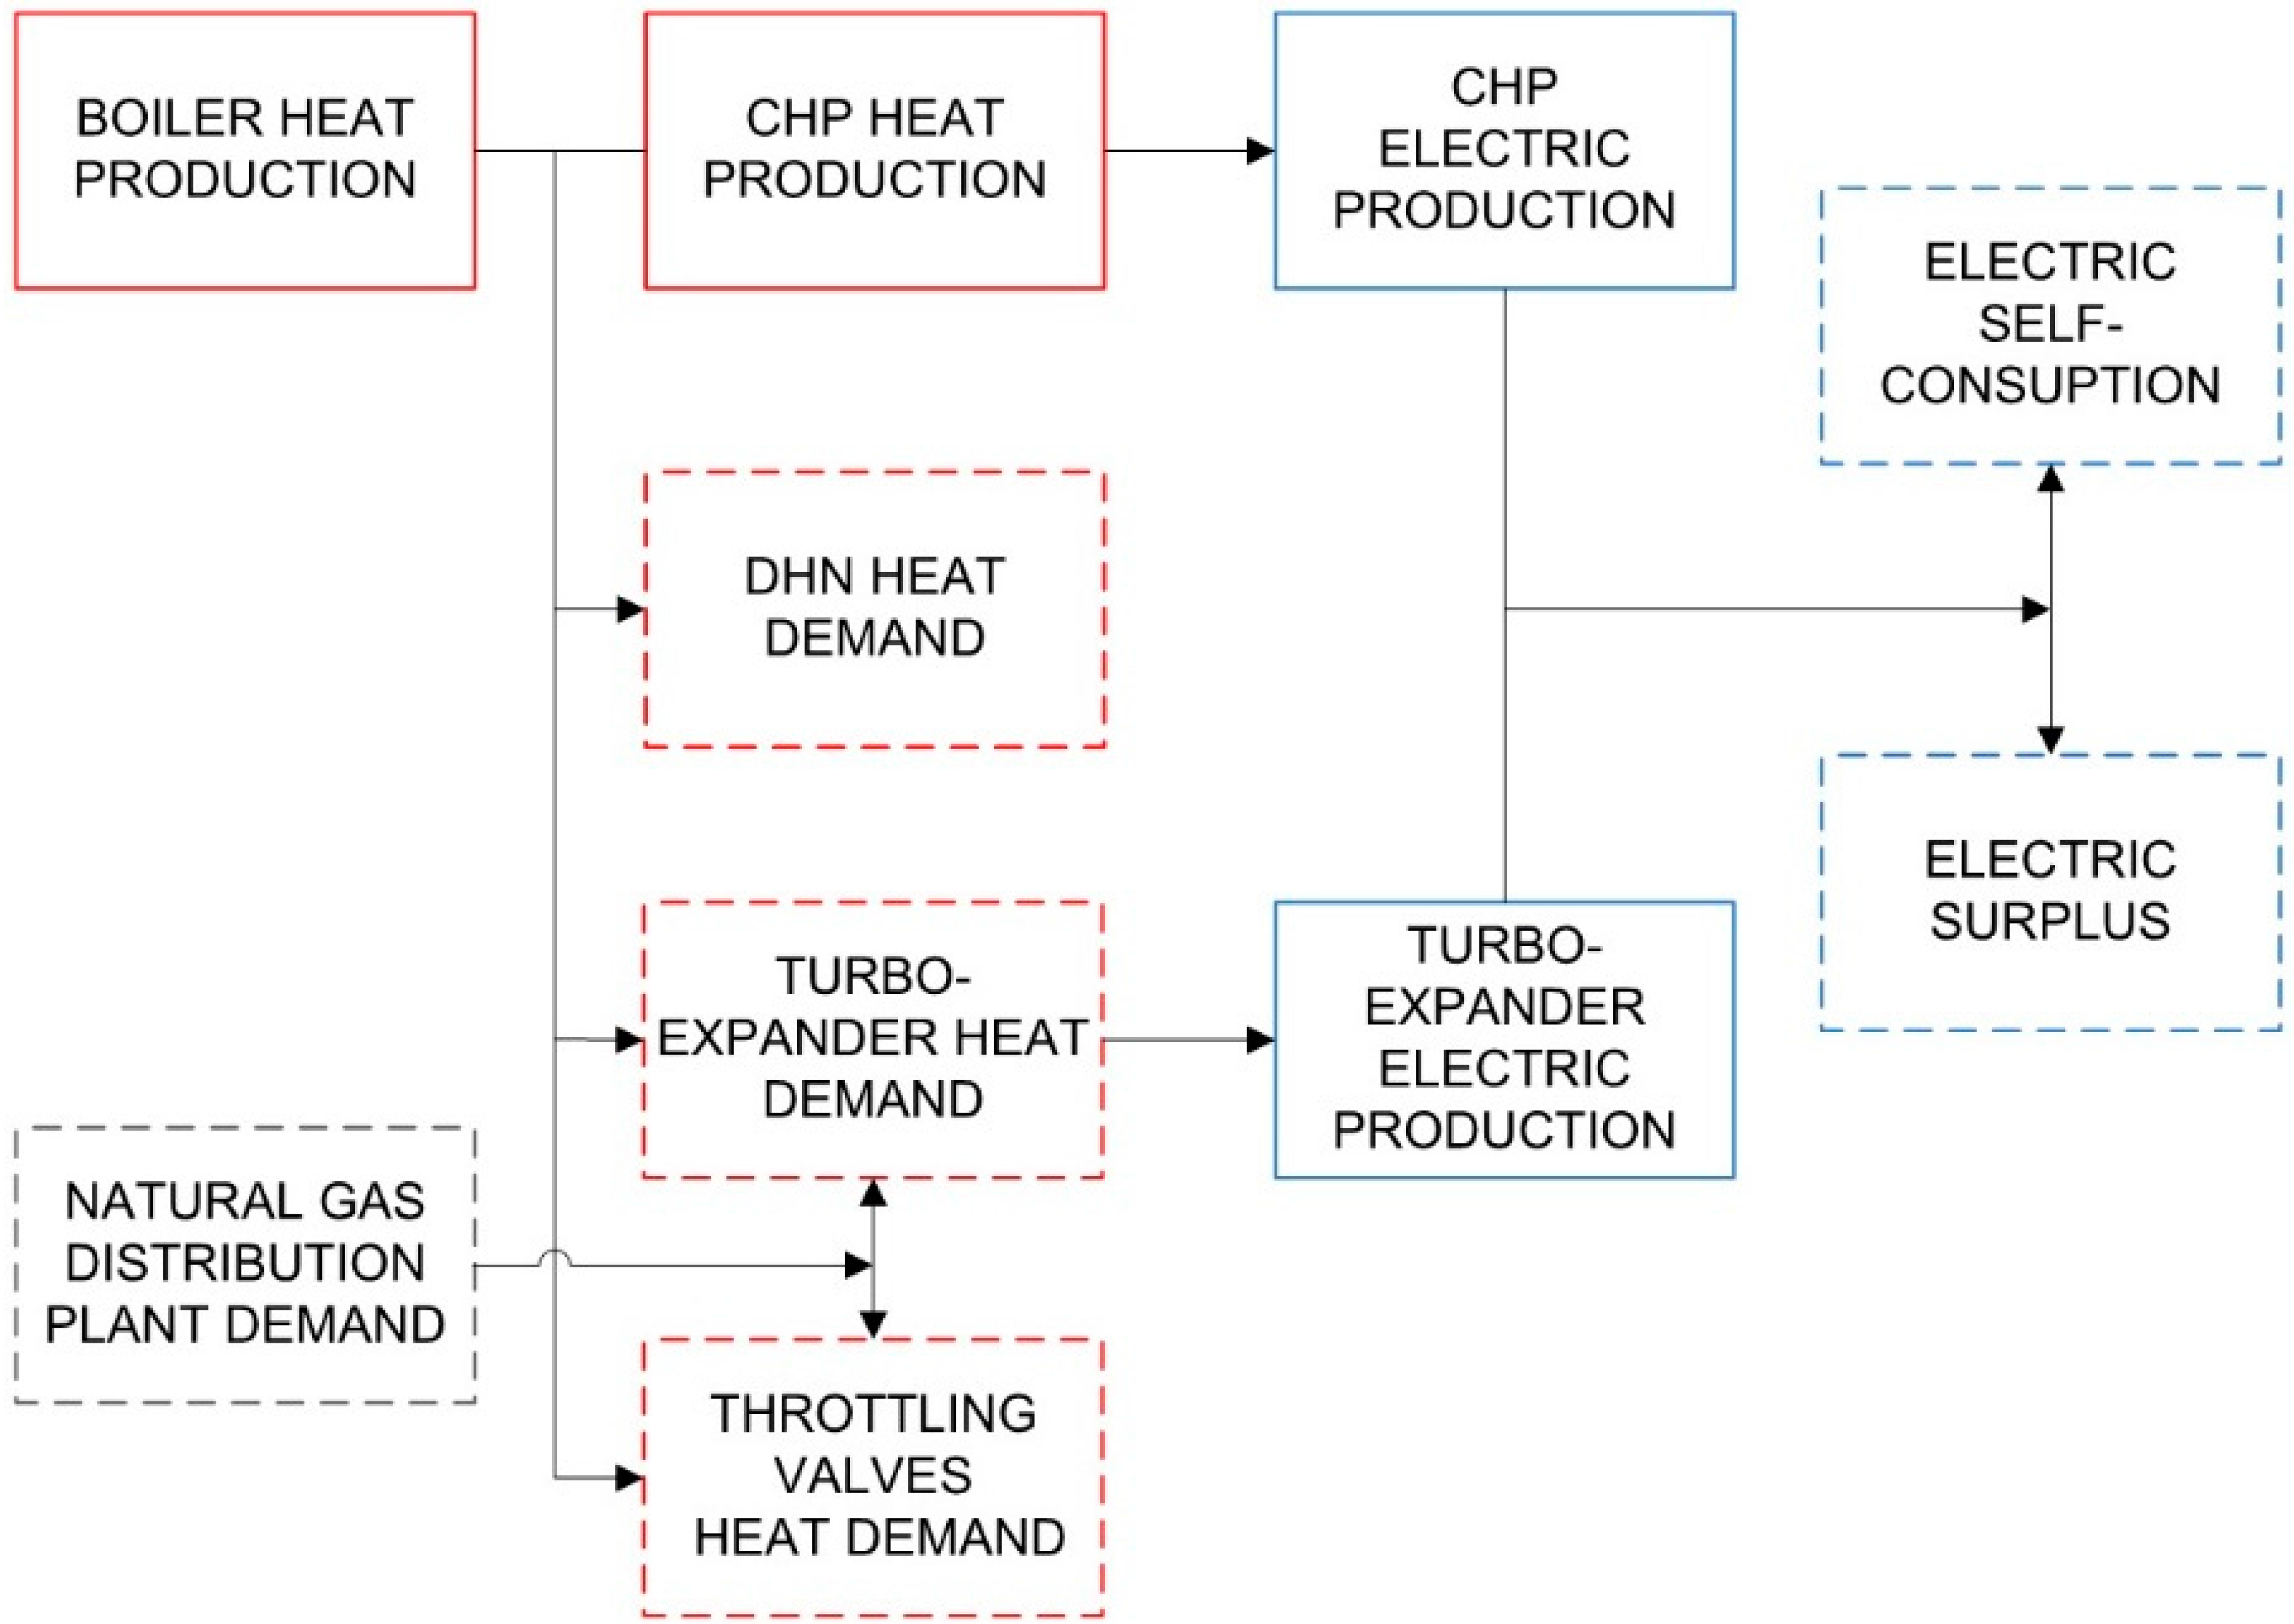
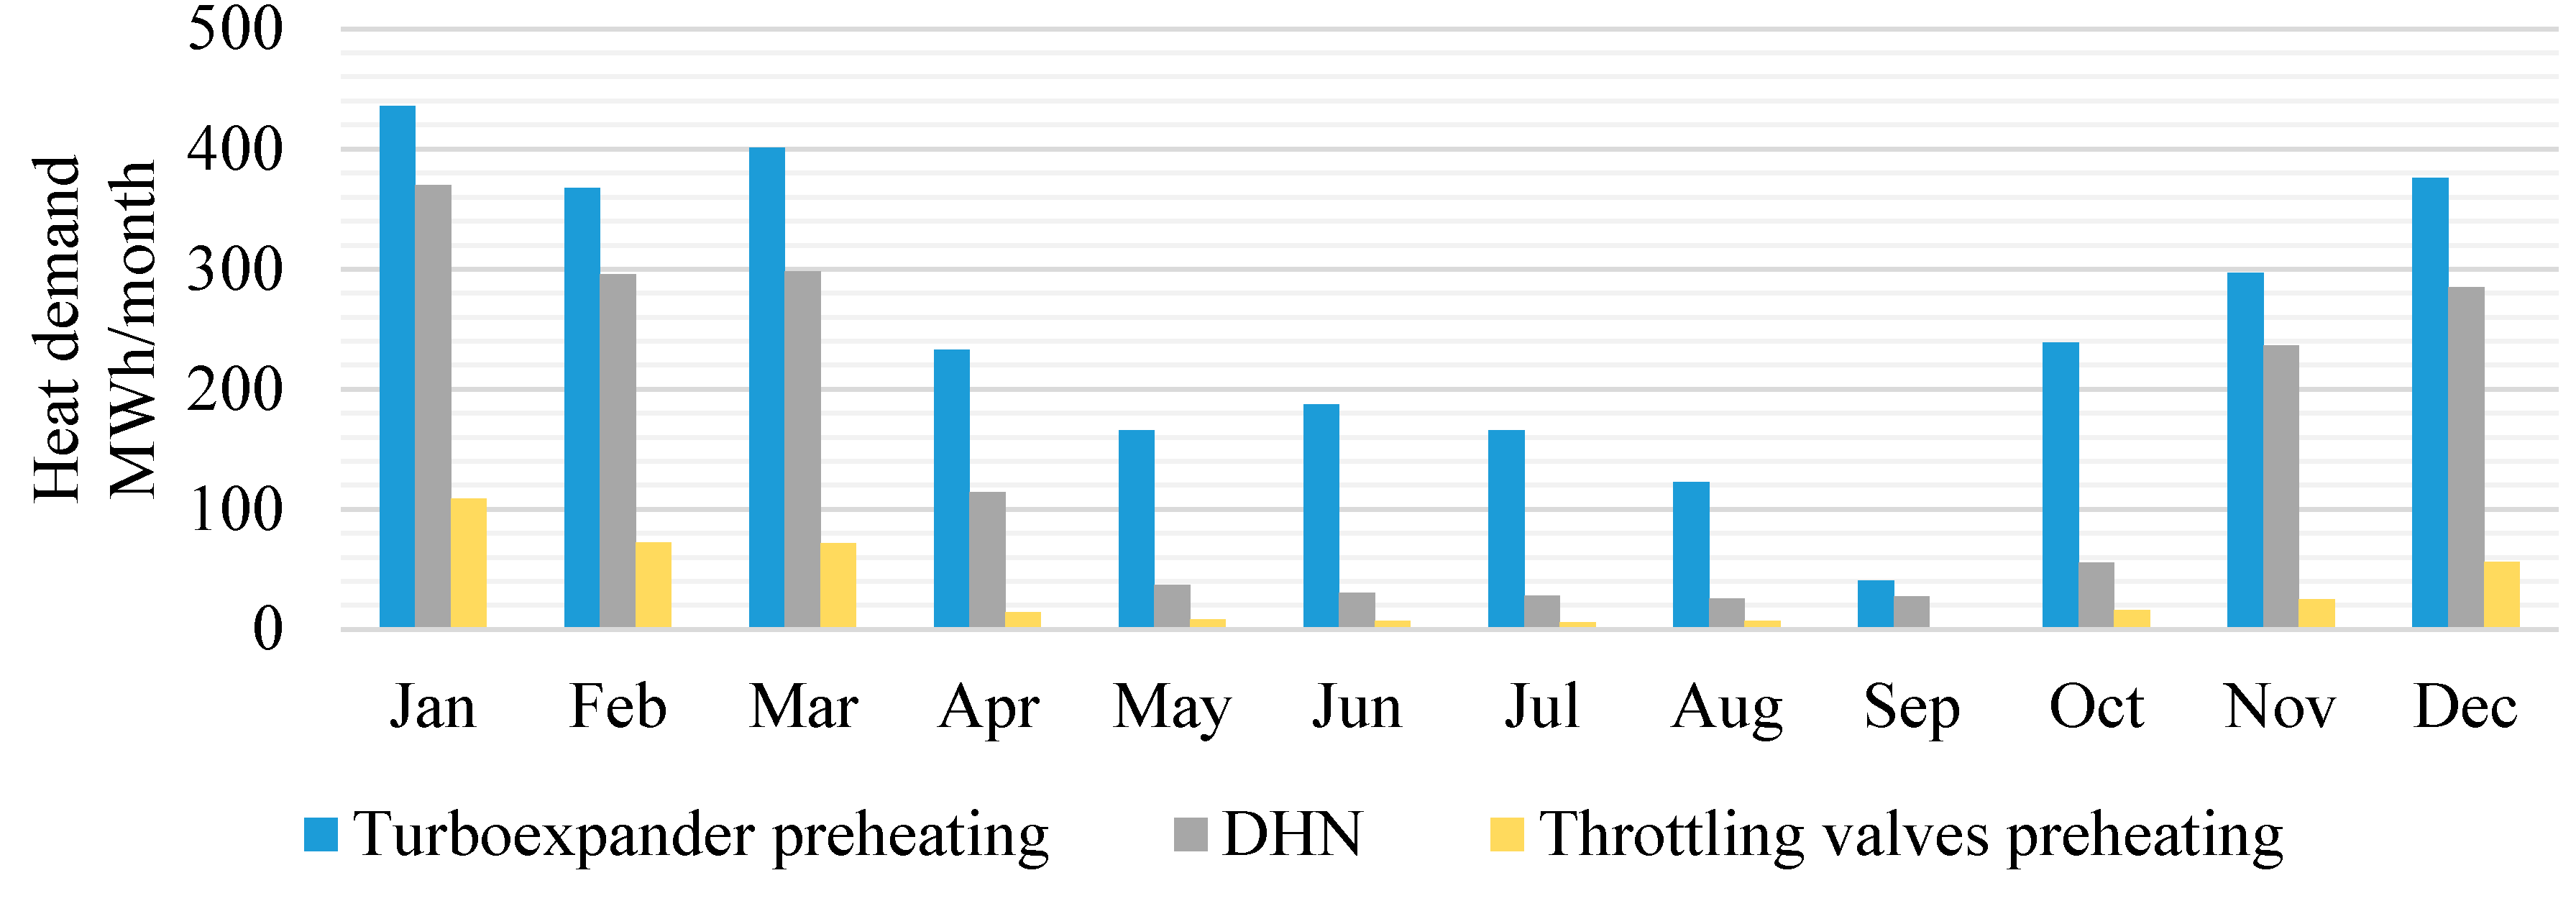
  • gas preheating for the turboexpander line, about 600 kWth at 85 °C;
  • gas preheating for the throttling valves line, about 200 kWth at a minimum temperature of 40 °C;
  • building’s district heating substations for the Fire station, offices and workshops; the thermal plant can, in the demonstrator configuration, supply only 900 kWth, where the demand peak is 1500 kWth, to the district heating network (DHN) due to the low diameter of the piping system.
The unit is sized to meet, in the steady state, the heat demand of the turboexpander line; in transient conditions the surplus heat produced by the CHP can be used by other thermal users.
The CHP chosen is an internal combustion turbocharged engine fueled with natural gas capable of delivering, in nominal conditions, 550 kWe and to recover about 630 kWth from the engine coolant, the intercooling process and the exhaust.
In analogy with the design of the turboexpander, the correct sizing of the unit can be verified by analyzing some typical operating parameters of the heat production system as:
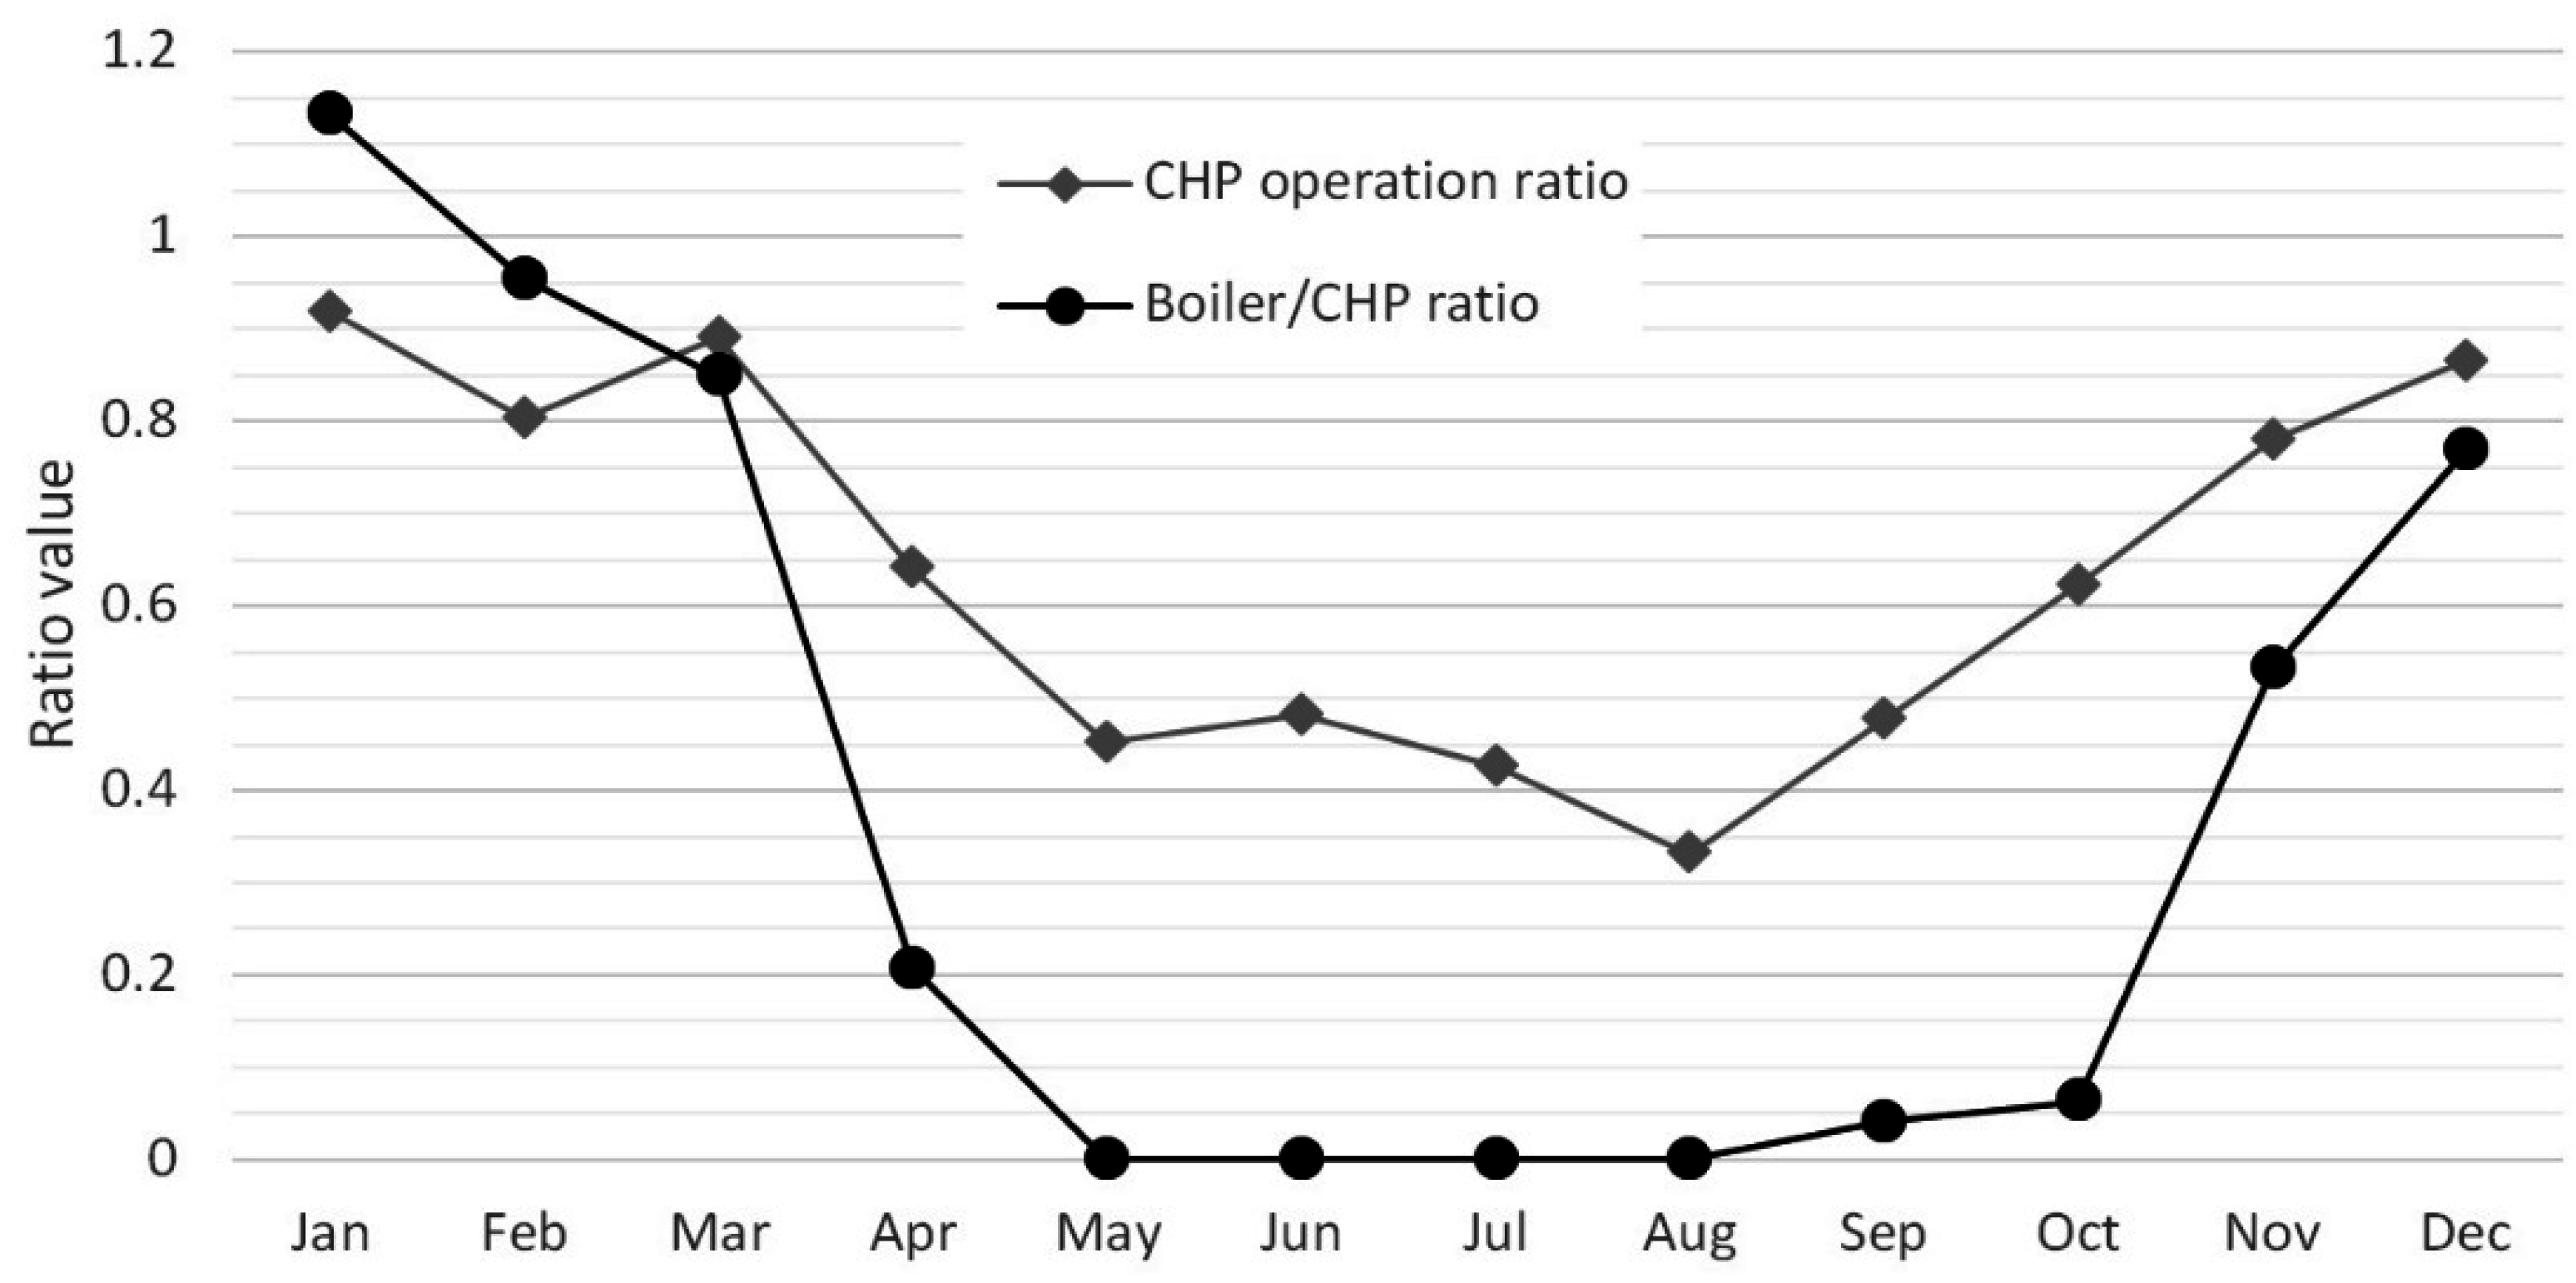
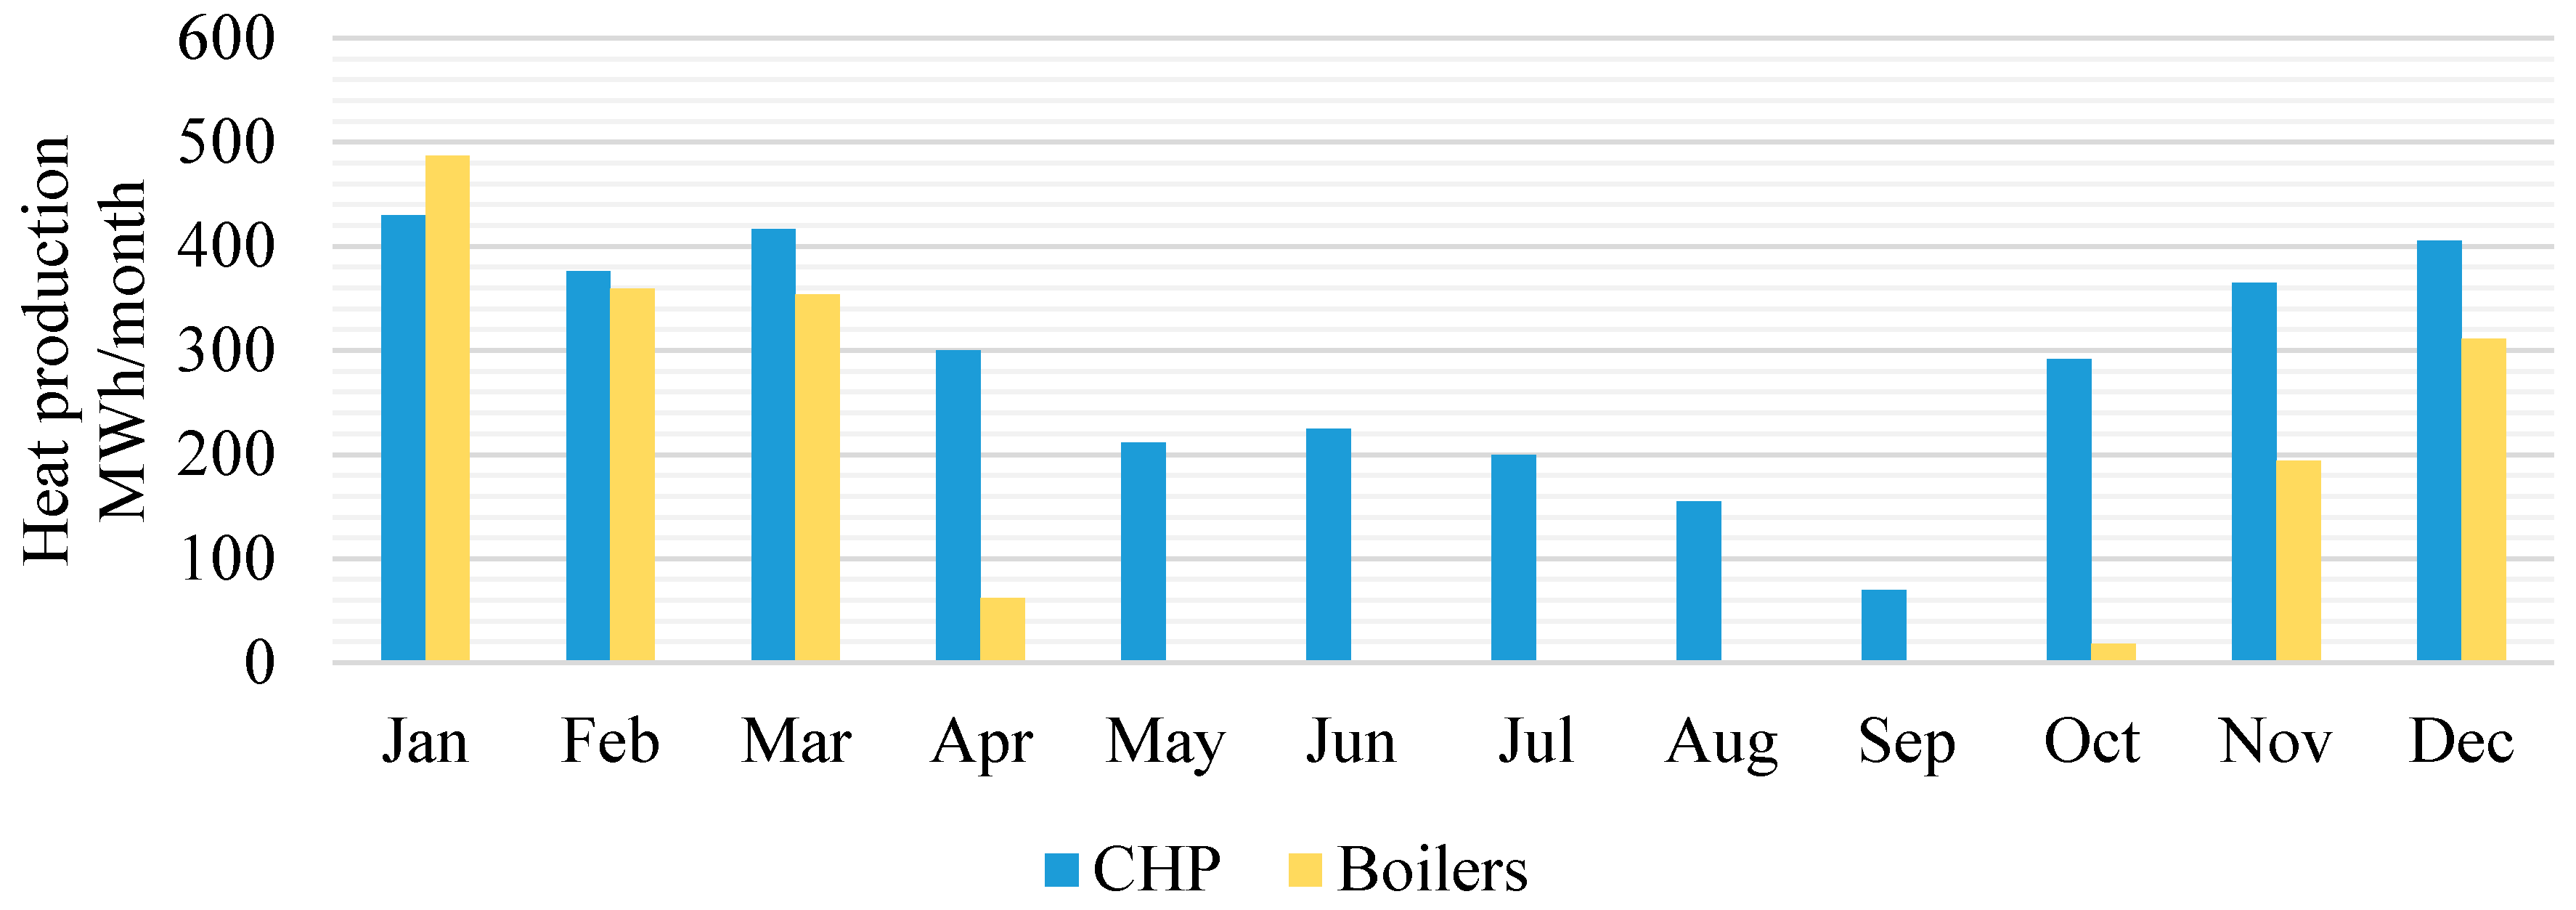
  • the CHP operation ratio, defined as the ratio of energy actually produced and that ideally producible in nominal conditions;
  • the boilers versus CHP ratio, defined as the ratio of the heat produced by boilers compared to the CHP one.
The monthly trend of these two parameters is shown in Figure 8; it is worth noting that the CHP coefficient of use reaches high values, greater than 80%, in the ranges where heat demand is high. In this condition, the machine is able to supply about half of the total load.
The CHP coefficient of use decreases down to values in a range from 40% to 55% during low load conditions, although responding to all the heat demand without any boiler’s activation.
Figure 7. Natural gas lines operational parameters.
Sustainability 07 15841 g007
Figure 8. Thermal production side operational parameters.
Sustainability 07 15841 g008

4. Energy Analysis of the Demonstrator

In order to assess the behavior and the performances of the demonstrator, a physical-mathematical model was formulated to simulate the dynamic operations of the entire district, based on Matlab-Simulink software [33]. The model is, when possible, simply implemented starting from the standard elements proposed by Matlab-Simulink for each component, associated to the appropriate mass and energy balances.
In other cases, (for example to simulate the behavior of complex machines such as the turboexpander or the CHP) to obtain more accurate and reliable models, the measured characteristic curves of the components are implemented. All components are then connected and the control system is added for the regulation parameters as, for example, the power supplied by the thermal units, the NG flow to the turboexpander and the variable speed pumps of the DHN. The model requires several input parameters: some of them are directly measured data (as for the hourly demand of natural gas and the average outside temperature) while others (such as for the thermal demand of the DHN) are derived from a post-processing of the measurements (see Section 3.2).
The model outputs can be temperature, pressure, mass flow, power, and energy with different sample times; for example, Figure 9 shows a main model output: the NG hourly flow rate share between the two parallel expansion systems for five different characteristic days. It is observed that in the days characterized by a low gas request the laminating system is activated for a limited time, during peaks, and when the flow rate is lower than the limits of the machine. Using daily average values, it is not possible to achieve this behavior which would involve in less precise results.
To discuss the energy aspects of the system a campaign of simulations was undertaken in order to characterize an entire year of operation; the model results are first processed to obtain monthly behavior, and second to obtain summary annual reports.
A description of the thermodynamic and numerical model of the CHP and of the turboexpander can be found in [34,35].
Figure 9. NG flow rate sharing between turboexpander and valves for different characteristic days.
Sustainability 07 15841 g009

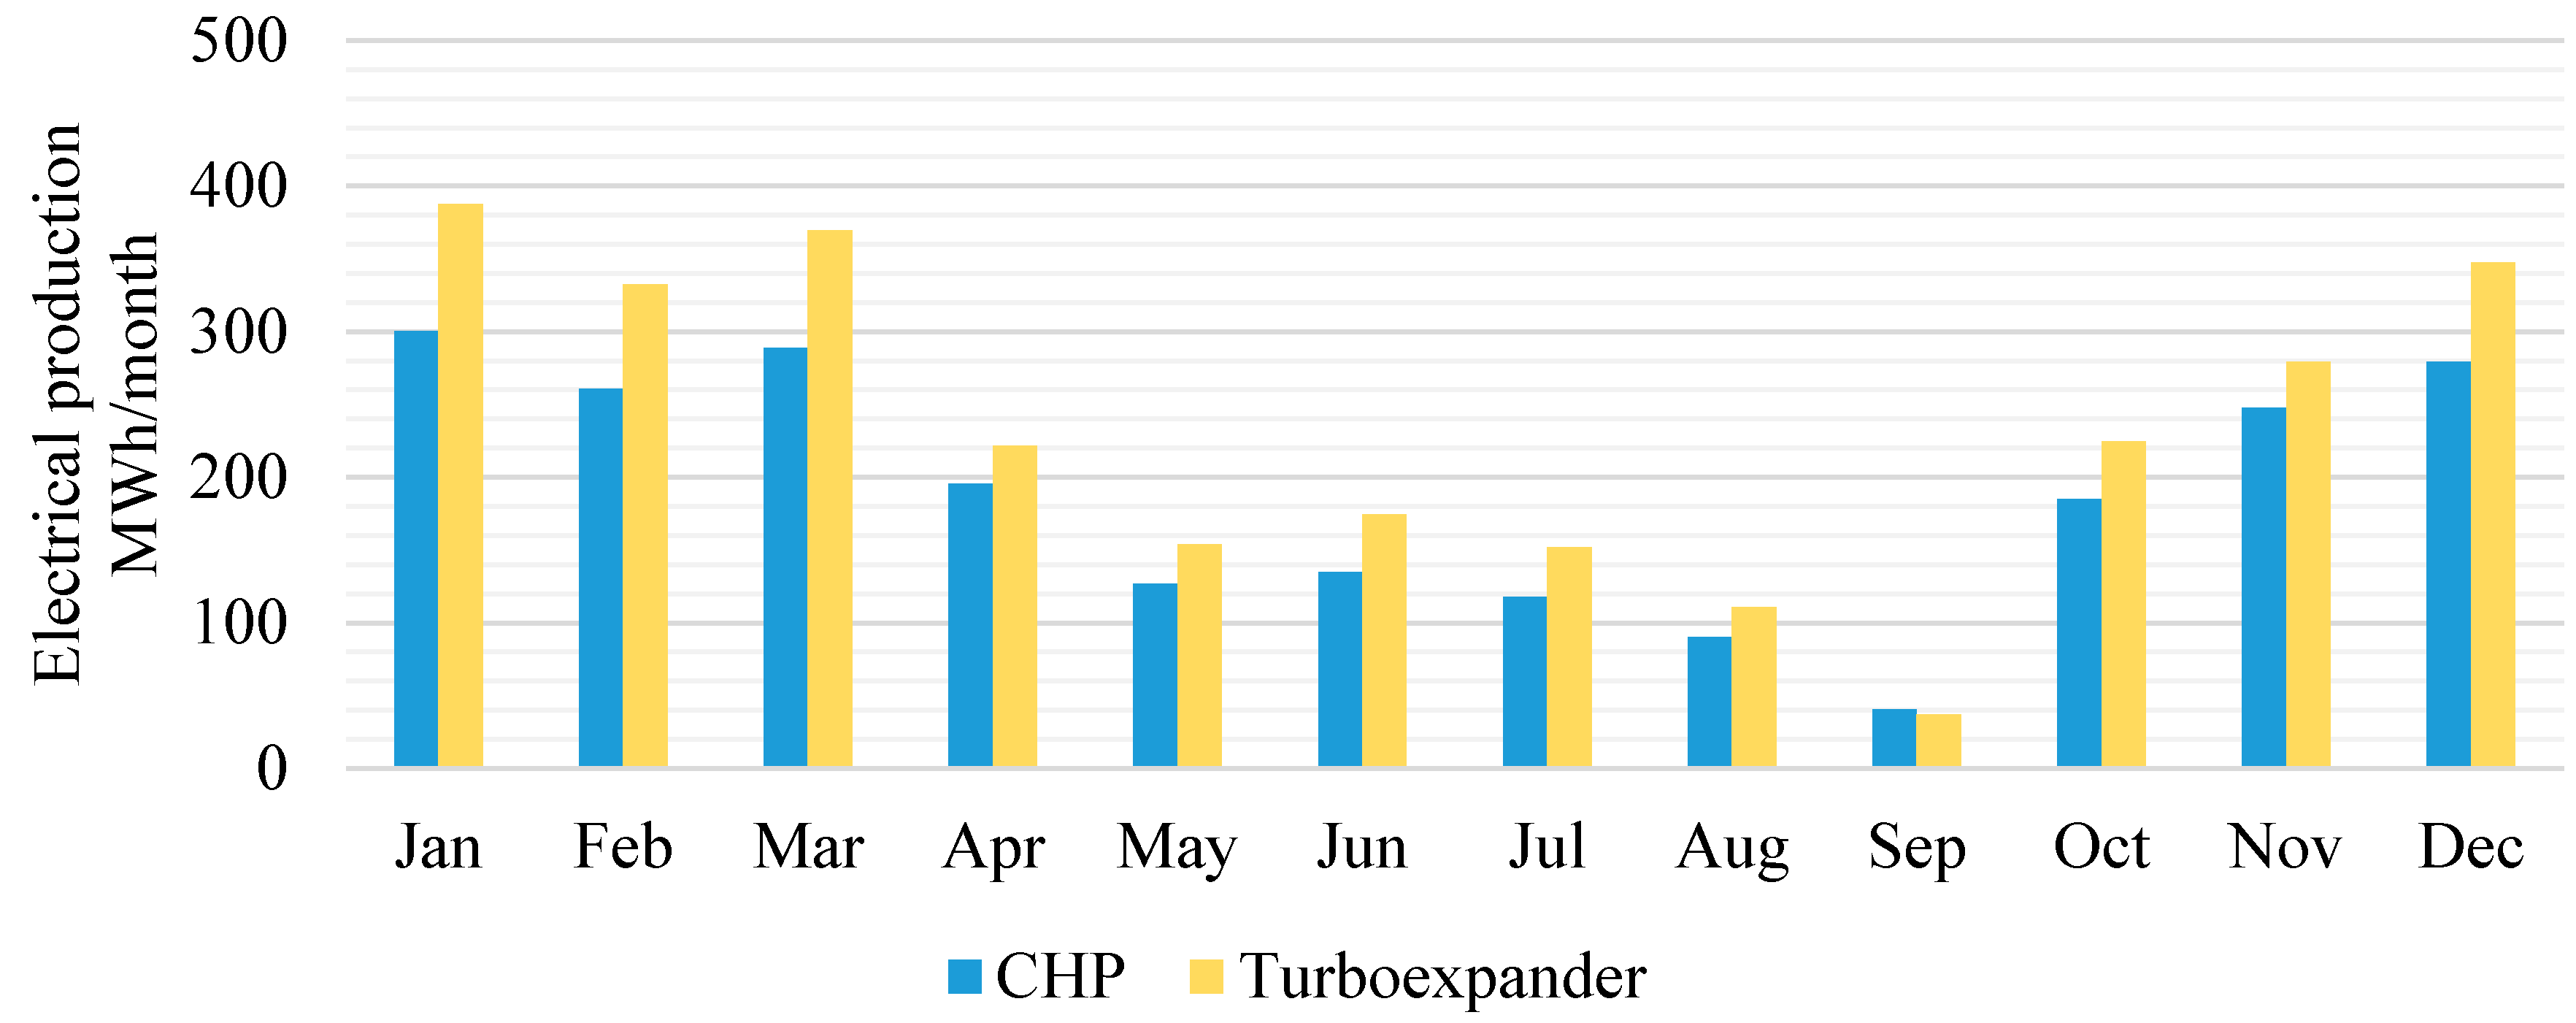
4.1. Monthly Analysis

This paragraph describes the energy aspects of the system observing the monthly trends of the main plant parameters.
The trend of the gas distribution between the turboexpander system is shown in Figure 10, where the gas pressure energy is recovered by the machine and by the throttling valves, where energy is wasted. the high seasonality of gas demand is clearly shown, with high gas demands in the heating season, when the machine collects the waste energy from about half of the monthly gas demand. During the warmer months, when the volumes of gas required are lower, the machine is able to elaborate almost all the monthly gas demand inducing a higher performance in the energy recovery.
The trends of the thermal demand of the entire plant are represented in Figure 11, formed by the heat consumption of the DHN and by the two gas preheating devices. The DHN thermal demand has a strong seasonal trend and is definitely linked to the weather conditions.
It is worth noting that, although the volume of gas drawn by the two expansion systems remains the same, they require different kinds of energies. The thermal preheating demand of the turbo-expander system is always the greater thermal load, assessing between 50% in winter and 80% in summer of the total thermal load. An overview of the thermal production system is shown in Figure 12. The CHP unit and the boilers are connected in series and the latter have the purpose of covering the peaks when the heat demand exceeds the CHP capability. It is worth noting that, thanks to the high thermal loads required by the gas preheating of the turboexpander line present also in the hottest periods, the CHP unit operates with good coefficients of use throughout the whole year.
The chart in Figure 13 shows the trends of electricity production. The electric energy produced follows a seasonal trend as well, and more than half of it is produced from the turboexpander through a recovery process, while the remaining part is still produced by the CHP with high fuel conversion performances.
Figure 10. Natural Gas flow share.
Sustainability 07 15841 g010
Figure 11. Thermal demand share.
Sustainability 07 15841 g011
Figure 12. Thermal production share.
Sustainability 07 15841 g012
Figure 13. Electrical production share.
Sustainability 07 15841 g013

4.2. Annual Analysis

This paragraph describes the energy balance of the system on a yearly basis.
Table 2 shows the energy, in GWh per year, consumed and produced, in the main processes of the plant. Table 3 shows the percentage of the ratio of energy utilization divided by energy production both for the thermal and for the electrical part.
Table 2. Yearly energy consumption and production.
Energy FlowNomenclatureGWh/year
CHP Fuel consumptionFchp6.6
CHP heat productionHchp3.5
CHP electricity productionEchp2.3
Boilers fuel consumptionFboiler1.9
Boilers heat productionHboiler1.8
Turboexpander heat consumptionHturbo3.1
Turboexpander electricity productionEturbo2.9
Throttling valves heat consumptionHvalves0.4
DHN heat consumptionHdhn1.8
District electricity consumptionEself3.7
Table 3. Yearly thermal/electrical energies sources/sinks.
SourcesSinks
Thermal Sustainability 07 15841 i001 Sustainability 07 15841 i002
Electrical Sustainability 07 15841 i003 Sustainability 07 15841 i004
The energy consumption of the whole district is about 1.8 GWh/year of heat and 1.5 GWh/year of electricity. The turboexpander is able to produce about 2.9 GWh/year of electricity whilst it need 3.1 GWh/year of heat, which roughly corresponds to 58% of the total heat demand of the district. It is worth noting that, in the turboexpander, the efficiency of conversion of heat into electricity is more than 0.90.
The CHP supplies 62% of the yearly heat demand and it represents 46% of the electrical production, with a total fuel process efficiency of about 0.86.
The two electricity production units, the CHP and the turboexpander, are largely able to meet the district’s demands as they generate a surplus of about 3.7 GWh/year.
About 38% of the heat required is provided by auxiliary boilers: it can be noticed that the boilers’ share would be reduced if a larger CHP unit had been installed. This would result in increasing the production electric energy and, thus, in decreasing the share of self-consumption (currently about 30%). This appears to be a profitable effect because, at present, in Italy, the electricity, that is sold to the national grid, is poorly remunerated and the profits (per unit of fuel burned) tend to decrease by increasing the share of energy sold.
Other important information deduced from the annual energy analysis are the fuel savings. The key point which has been considered to make a powerful comparison between different configurations of plant is the amount of fuel saved, as suggested by rules for the high-efficiency cogeneration [36]. The cogeneration system is compared with two equivalent conventional systems which produce the same amount of energy and electricity and which have the efficiency of the whole national energy production. The cogeneration system, compared with two equivalent conventional systems, produces the same amount of energy and electricity and has the efficiency of the whole national energy production.
The energy scheme of the cogeneration system flows and of the conventional ones is shown in Figure 14 and Figure 15 applied to the Gavette area.
Figure 14. Gavette’s power plant.
Sustainability 07 15841 g014
Figure 15. Equivalent conventional plants.
Sustainability 07 15841 g015
The fuel saving, F s a v i n g , can be calculate from Equation (1), where F c h p and F b o i l e r s are the estimated fuel consumption of the district’s production line, F e p and F t p are the equivalent fuel's consumption of the conventional electric and thermal Plants.
F s a v i n g = F e p + F t p ( F c h p + F b o i l e r s )
The useful effect of the demonstrator is given by the sum of the electric energy generated by the CHP, E c h p , and the turboexpander, E t u r b o , and from the net heat outgoing from the system, H o u t (Equation (2)).
The last one is the heat generated by the CHP, H c h p plus the one generated by the boilers, H b o i l e r : the heat absorbed by the turboexpander preheating system, H t u r b o , is not taken into account because it is an internal heat exchange and it is not provided to/from outside. In fact, it does not cross the boundary of the control volume.
H o u t = H c h p + H b o i l e r H t u r b o = 2.2 G W h / y e a r
The conventional equivalent plant must have the same electrical, E e p , and thermal, H t p useful effects of the cogenerative one (Equations (3) and (4)).
National law introduces average performance of generation for each type of burned fuel [37]. For the natural gas the standard electric performance, η e l , r i f , is 0.46 and the thermal, η t h , r i f , is 0.90. The equivalent standard plants fuel consumption can be than calculated by Equations (5) and (6).
E e p = E c h p + E t u r b o
H t p = H o u t
F e p = E e p η e l , r i f = 11.3 G W h / y e a r
F t h = H t p η t h , r i f = 2.4 G W h / y e a r
By means of this procedure, it has been possible to estimate by Equation (7) a Primary Energy Saving index (PES) of about 38% equal to 5.3 GWh/year of fuel energy (from Equation (1)).
P E S = 1 F c h p + F b o i l e r F e p + F t p
In terms of natural gas consumption, the upgraded plant can save more than 500,000 Sm NG 3 per year equally to more than 1000 tons of equivalent CO2 saved emission.

5. Conclusions

The EU’s plan for generating low carbon energy and mitigating climate change, calls for considerable investment to enable the rapid conversion of the EU’s existing energy plants into 21st century systems, capable of guaranteeing both energy security into the future and, in doing so, creating a more sustainable world. In order to minimize GHG emissions in urban areas a key action is the massive exploitation of the unused energy potential through the effective and efficient recovery of energy losses. Therefore, the smart integration of waste energy to raise energy efficiency and carbon savings in cities is the aim of the CELSIUS Project (Combined Efficient Large Scale Integrated Urban Systems), which is the biggest winning project within the EU call "FP7 Smart Cities & Communities 2011".
The CELSIUS demonstrator built in Genoa aims to recover waste energy by the natural gas mass flow rate, expanding from the main supply line to the city natural gas network through a turbine/generator system. Moreover, the turboexpander has been combined in a CHP plant that supplies a district heating network, in order to save energy and reduce CO2 emissions by means of smart systems integration.
By using a numerical simulator, it was possible to analyze the behaviour of the whole energy system and to predict energy flows and figures over different time scenarios. Dynamic modeling showed that the demonstrator is able to save a considerable amount of fuel and to generate profit from the sale of electricity and heat. A total amount of produced electricity of almost 5 GWh/year will be generated, with a recovery of 2.9 GWh/year from the turboexpander. The CHP plant will produce 2.3 GWh/year of electricity and 3.5 GWh/year of heat. More than 500,000 Sm3/year of Natural Gas saving, corresponding to over 1000 tons of CO2/year, is estimated with a Primary Energy Saving index up to 35% if compared with conventional separated production of heat and electricity by NG.
The goal of achieving full energy independence of the district and reduction of local emission of GHG, in accordance with the targets of the Covenant of Mayors and of the related Sustainable Energy Action Plan, is now definitely closer. Moreover, a powerful tool for the design and control of energy systems has been developed, with a flexible approach that can be adapted to the grid extension/evolution.

Acknowledgments

This work was developed in the frame of the collaborative project CELSIUS (Combined Efficient Large-Scale Integrated Urban Systems). This project received funding from the European Union’s Seventh Framework Programme for research, technological development and demonstration under grant agreement No. 314441.

Author Contributions

All the authors equally contributed to this work.

Conflicts of Interest

The authors declare no conflict of interest.

References

  1. European Commission. Analysis of Options to Move beyond 20% Greenhouse Gas Emission Reductions and Assessing the Risk of Carbon Leakage. Available online: http://eur-lex.europa.eu/legal-content/EN/NOT/?uri=CELEX:52010DC0265 (accessed on 15 December 2015).
  2. Bulkeley, H.; Betsill, M.M. Revisiting the urban politics of climate change. Environ. Polit. 2013, 22, 136–154. [Google Scholar] [CrossRef] [Green Version]
  3. Perez-Lombard, L.; Ortiz, J.; Pout, C. A review on building energy consumption information. Energy Build. 2008, 40, 394–398. [Google Scholar] [CrossRef]
  4. European Commission. GREEN PAPER. A European Strategy for Sustainable, Competitive and Secure Energy. Available online: http://eur-lex.europa.eu/legal-content/GA/NOT/?uri=celex:52006DC0105 (accessed on 15 December 2015).
  5. European Commission. An Energy Policy for Europe. Available online: http://eur-lex.europa.eu/legal-content/EN/NOT/?uri=CELEX:52007DC0001 (accessed on 15 December 2015).
  6. European Commission. Second Strategic Energy Review: An EU Energy Security and Solidarity Action Plan. Available online: http://eur-lex.europa.eu/legal-content/EN/NOT/?uri=CELEX:52008DC0781 (accessed on 15 December 2015).
  7. European Commission. Roadmap for Moving to A Low-Carbon Economy in 2050. Available online: http://eur-lex.europa.eu/legal-content/EN/NOT/?uri=CELEX:52011DC0112 (accessed on 15 December 2015).
  8. European Commission. 2030 Climate & Energy Framework. Available online: http://ec.europa.eu/clima/policies/strategies/2030/index_en.htm (accessed on 15 December 2015).
  9. Intergovernmental Panel on Climate Change. Sustainable Development and Mitigation. Available online: https://www.ipcc.ch/pdf/assessment-report/ar4/wg3/ar4-wg3-chapter12.pdf (accessed on 5 November 2015).
  10. Olmstead, S.M.; Stavins, R.N. Three key elements of a post-2012 international climate policy architecture. Rev. Environ. Econ. Policy 2012, 6, 65–85. [Google Scholar] [CrossRef]
  11. Laughlin, A.G. The Climate Emergency and the Need for Global Climate Stabilization: The Role of Energy Efficiency in Climate Policy. Ph.D. Thesis, University of Denver, Denver, CO, USA, 2014. [Google Scholar]
  12. Akashi, O.; Hanaoka, T. Technological feasibility and costs of achieving a 50% reduction of global GHG emissions by 2050: Mid-and long-term perspectives. Sustain. Sci. 2012, 7, 139–156. [Google Scholar] [CrossRef]
  13. Mallikarjun, S.; Lewis, H.F. Energy technology allocation for distributed energy resources: A strategic technology-policy framework. Energy 2014, 72, 783–799. [Google Scholar] [CrossRef]
  14. Asdrubali, F.; Baldinelli, G.; D’Alessandro, F.; Scrucca, F. Life cycle assessment of electricity production from renewable energies: Review and results harmonization. Renew. Sustain. Energy Rev. 2015, 42, 1113–1122. [Google Scholar] [CrossRef]
  15. Schenone, C.; Delponte, I.; Pittaluga, I. The preparation of the Sustainable Energy Action Plan as a city-level tool for sustainability: The case of Genoa. J. Renew. Sustain. Energy 2015, 7, 1–22. [Google Scholar] [CrossRef]
  16. Celsius Consortium. Available online: http://celsiuscity.eu/demonstrator/ (accessed on 5 November 2015).
  17. Sternlicht, B. Waste energy recovery: An excellent investment opportunity. Energy Convers. Manag. 1982, 22, 361–373. [Google Scholar] [CrossRef]
  18. Lund, H.; Möller, B.; Mathiesen, B.V.; Dyrelund, A. The role of district heating in future renewable energy systems. Energy 2010, 35, 1381–1390. [Google Scholar] [CrossRef]
  19. Davis, L.; Wyke, S.; Napier, M.C.; Nordstrom, H.; Lundemo, K. Market Roll-out Strategy, Deliverable D7.5, CELSIUS Project (EU-FP7 Research Project). Available online: http://www.celsiuscity.eu (accessed on 5 November 2015).
  20. Tillie, N.; Wyke, S. CELSIUS City Vision—2050, Deliverable D7.1, CELSIUS Project (EU-FP7 Research Project). Available online: http://www.celsiuscity.eu (accessed on 5 November 2015).
  21. Yang, Y.; Zhang, S.; Xiao, Y. Optimal design of distributed energy resource systems coupled with energy distribution networks. Energy 2015, 85, 433–448. [Google Scholar] [CrossRef]
  22. Enbridge Company. News Releases. Available online: http://www.enbridge.com/MediaCentre/News.aspx?yearTab=en2008&id=913121 (accessed on 5 November 2015).
  23. Orehounig, K.; Evins, R.; Dorer, V. Integration of decentralized energy systems in neighbourhoods using the energy hub approach. Appl. Energy 2015, 154, 277–289. [Google Scholar] [CrossRef]
  24. Allegrini, J.; Orehounig, K.; Mavromatidis, G.; Ruesch, F.; Dorer, V.; Evins, R. A review of modelling approaches and tools for the simulation of district-scale energy systems. Renew. Sustain. Energy Rev. 2015, 52, 1391–1404. [Google Scholar] [CrossRef]
  25. Kelly, S.; Pollitt, M. An assessment of the present and future opportunities for combined heat and power with district heating (CHP-DH) in the United Kingdom. Energy Policy 2010, 38, 6936–6945. [Google Scholar] [CrossRef]
  26. Mjörnell, K.; Boss, A.; Lindahl, M.; Molnar, S. A Tool to Evaluate Different Renovation Alternatives with Regard to Sustainability. Sustainability 2014, 6, 4227–4245. [Google Scholar] [CrossRef]
  27. Nannei, E.; Schenone, C. Thermal transients in buildings: Development and validation of a numerical model. Energy Build. 1998, 29, 209–215. [Google Scholar] [CrossRef]
  28. Lehman, B.; Worrell, E. Electricity production from natural gas pressure recovery using expansion turbines. In Proceedings of the 2001 ACEEE Summer Study on Energy Efficiency in Industry, Tarrytown, NY, USA, 24–27 July 2001.
  29. Neseli, M.A.; Ozgener, O.; Ozgener, L. Energy and exergy analysis of electricity generation from natural gas pressure reducing stations. Energy Convers. Manag. 2015, 93, 109–120. [Google Scholar] [CrossRef]
  30. Rahman, M.M. Power generation from pressure reduction in the natural gas supply chain in Bangladesh. J. Mech. Eng. 2010, ME 41, 89–95. [Google Scholar]
  31. Rezaie, N.Z.; Saffar-Avval, M. Feasibility Study of Turbo Expander Installation in City Gate Station. In Proceedings of the 25th International Conference on Efficiency, Cost, Optimization and Simulation of Energy Conversion Systems and Processes, Perugia, Italy, 26–29 June 2012.
  32. Kostowski, W.J.; Usón, S. Thermoeconomic assessment of a natural gas expansion system integrated with a co-generation unit. Appl. Energy 2013, 101, 58–66. [Google Scholar] [CrossRef]
  33. The MathWorks, Inc. MATLAB and Simulink; The MathWorks Inc.: Natick, MA, USA, 2014. [Google Scholar]
  34. Borelli, D.; Devia, F.; Schenone, C.; Spoladore, A. Thermodynamic simulation of a combined heat & power system. Energy Procedia 2015, 81, 506–516. [Google Scholar]
  35. Bisio, G. Thermodynamic analysis of the use of pressure exergy of natural gas. Energy 1995, 20, 161–167. [Google Scholar] [CrossRef]
  36. European Union. Directive 2004/8/EC of the European Parliament and of the Council of 11 February 2004 on the Promotion of Cogeneration Based on a Useful Heat Demand in the Internal Energy Market and Amending Directive 92/42/EEC. Available online: http://eur-lex.europa.eu/legal-content/EN/TXT/PDF/?uri=CELEX:32004L0008&from=EN (accessed on 5 November 2015).
  37. Italian Ministerial Decree of the 5 September 2011. Available online: http://www.gazzettaufficiale.it/eli/id/2011/09/19/11A12047/sg (accessed on 5 November 2015).

