1. Introduction
China’s market economy system has gradually taken shape since the introduction of reforms in the 1990s, and continues to this day. In 2013, the non-public economy accounted for more than 60% of GDP and up to 50% of all taxes collected. At the same time, market competition in China’s financial sector experienced corresponding changes, characterized by accelerated financial liberalization and rapid flow and integration of original financial resources in the market. To further adapt to financial liberalization, the Central Party Committee and the State Council made attempts to encourage pilot projects and lift restrictions on market access, paying particular attention to small- and medium-sized financial structures by encouraging the financial service system to involve small- and medium-sized financial institutions and further enhance financial support to issues of agriculture affecting farmers and small- and medium-sized enterprises (SMEs) in rural areas. Currently, China’s commercial banks are gaining momentum. Local commercial banks, joint-equity banks, rural credit cooperatives and other new types of financial institutions are booming. In the case of commercial banks, the number of commercial banks has increased from 113 in 2005 to 145 in 2013. At the same time, the net profit of urban commercial banks also increased from 0.25 billion RMB in 2007 to 1.37 billion RMB in 2012. Domestic economic conditions and policy environment are complex at the moment. In order to specify further competitive conditions of regional banking, and to facilitate orderly competition among various banks, it is of great necessity to discuss influential factors in banking competition. Domestic economic conditions and policy environment are complex at the moment. In order to specify further competitive conditions of regional banking, and to facilitate orderly competition among various banks, it is of great necessity to discuss influential factors in banking competition.
The deposit and loan of four major state-owned commercial banks in the market share gradually declined in value. In the deposit market, for example, the market share of the four major state-owned banks fell from 77.30% in 2005 to 70.21% in 2012. More and more small- and medium-sized financial institutions are being integrated into China’s financial market. As a result, there are some changes in the nature of competition between the state-owned commercial banks and small- and medium-sized financial institutions in the market now. As a whole, the competition of various financial institutions in the financial market is becoming more intense. Since China’s entry into the World Trade Organization, China’s banking industry welcomed foreign banks, and the latter contributed much diversity to China’s banking industry and stimulated the competitiveness of local commercial banks. It is no exaggeration to say that competition in the banking industry is becoming more and more fierce [
1]. Furthermore, various levels of regional economic development and national financial policy make regional banking competition distinct and a prominent feature of banking competition in China.
The emerging theory of spatial econometrics is gradually applied to research in environmental and economic fields. As finance is an important part of economics, research on financial fields can also be theoretically guided by spatial econometrics. Especially with continuously improved financial marketization, different regions are no longer isolated from each other; instead, cross-region financial bonds are gradually strengthened. According to TOBLER’s First Law of Geography, everything is related to everything else, but near things are more related than distant things, and
vice versa [
2]. Therefore, as banking competition is a significant aspect in financial fields, its condition in one region will exert great influence on other regions, which takes the form of spatial spillover effect. However, current study on financial competition at home and abroad is constricted to traditional field of measurement theory. It not only considers spatial spillover effect that possibly exists in regional banking competitions, but it also lacks deep perception and analysis of influential factors in banking competition. Given this, and based on theories of industrial economics and spatial econometrics, the paper intends to make use of provincial panel data from each and every domestic provinces in the year 2000 and 2011 to employ empirical study on spatial effect and influential factors of banking competition. On the above foundation, the paper also makes policy suggestions to improve integral banking competition.
2. Literature Review
The academic circle mooted much about the measurement index of banking competition. Scholars suggested various measurement methods from different perspectives, with four being typical. First, most scholars used banking concentration to measure the competition. The higher the concentration is, the lower the competition is and
vice versa. The specific index is H index, the value of which falls between 1/n and 1. The closer to 1/n, the lower the banking concentration is and the fiercer the competition is. The closer to 1, the higher the banking concentration is and the more monopolistic the competition is (Panzar and Rosse, 1987; Huang, 2007; Yin,
et al. 2009; Fu and Heffernan) [
3,
4,
5,
6]. Second, some scholars study the correlation between banking competition and risks based on macro variables and through conjecture variation. For example, an increase in the degree of loan concentration will increase the risk of banks(Boyd and De Nicolo, 2005) [
7].The empirical study of Boyd
et al. 2006, based on the panel data of 2700 countries from 134 countries, shows that there is a significant negative correlation between the concentration of banking and bank risk [
8]. Third, some scholars used Lerner index to measure banking competition by measuring the strength of a bank in the market, particularly by measuring the pricing ability on marginal cost. The Lerner index falls between 0 and 1, the changing of which depends on banking competition. The smaller the Lerner index is, the bigger the banking competition is, and
vice versa (Fernandez and Maudos, 2007; Carbó
et al., 2009; Yang and Zhong, 2013) [
9,
10,
11]. Fourth, some scholars followed traditional industrial economics and held that the structure of banking competition was manifested by changes in banking loans and deposits (including quantity and type). Generally speaking, the higher the total amount of deposits and loans of small- and medium-sized banks, the fiercer the banking competition and
vice versa (Besallkoand Thakor, 1992; Bernanke, Gertlerand Gilchist, 1996; Petersen and Rajan, 1995) [
12,
13,
14].
In regard to spatial dependence of banking competition, many scholars have been aware that the spatial factor has a great influence on banking competition. Results of studies globally showed that the cross-regional banking competition structure presents much diversity and various spatial correlation, in particular those that cross national boarders. Barbara Casuand Claudia Girardone (2009) adopted a structural (Absolute Concentration Rate index and Herfindahl–Hirschman index) and a non-structural index (H-statistics and Lemer index) to measure the competition pattern of the five largest European banks and found that the competition of the banking industry varied from one (banking) institution to another with notable distinct national features [
15]. Al-Muharrami and Matthews (2006) adopted the 1993–2000 panel data for member banks of Gulf Cooperation Council (GCC) and determined competition features of market structure of these banks. It was found that the banking industry of United Arab Emirates, Kingdom of Saudi Arabia and Kuwait presented a perfect competition market. In comparison, that of Qatar and Bahrain was monopolized [
16].
Yildirim and Philippatos (2007) reviewed 1993–2000 panel data of the banking industry of 14 trading economies in Central Europe and found that the banking industry of Macedonia and Slovakia Federal Republic was perfect competition, while those of other counties remained in a monopolized state [
17]. De Bandt and Davis (2000) compared small- and medium-sized banks in Germany and Italy and found that the former was highly monopolized while the latter was mixed. This indicated that the banking competition of Germany was higher than that of Italy [
18]. Bikkerand Haaf (2002) constructed a Panzar–Rosse model based on panel data of 23 countries and found that all of them had both competition and monopoly but the degree varied from country to country [
19].
From the above-mentioned research, it can be concluded that most studies of banking competition in terms of spatial factors were relevant to national differences. Few, however, took a further step to study the banking competition of different regions within one country. Traditional theories on banking competition also failed to take this factor into account, and thus could not explain the diversified phenomenon. Research results overlooking “geographical features” are not practical. Thus, this paper introduces the cutting-edge econometric analysis—a spatial econometric method to analyze the banking competition structure. Based on existing studies, it drew merits from the financial sector competition index provided by Fan and Wang (2009) and defined the concept as SCRD, It is defined as the market share of the amount of deposits owned by a type of financial institution. In this paper, it namely the proportion of deposits in a particular province’s privately owned banking institutions among all the financial institutions in that province. The value of SCRD is between 0 and 1. The bigger the value is, the fiercer the banking competition is and
vice versa [
20].
4. Spatial Correlation Analysis of Banking Competition
Based on the adjacent matrix composed of 0 and 1, data are dealt with in Geoda.
Table 1 is the
Global Moran’s I index of China’s banking competition between 2000 and 2011, where it can be seen that the indexes measuring the spatial correlation of banking competition are all positive values and significant at 10% or 5% level.
Moran’s I presents an inverse ”U” curve, initially increasing and decreasing later. It can also be seen from the table, the value of
Moran’s I in each calendar year is more than 0.12, the highest value of 0.2486 being in 2008. In particular, although
Moran’s I Index tends to come in an inverted U shape by increasing first and then decreasing, it is merely a result of dynamically changing spatial correlation in banking competition, which presents the trend of an initial reinforcement and a fade afterwards. However, given that the value of
Moran’s I index is still positive within the sample period, it shows that there indeed exists spatial correlation in banking competition in the same period. This indicates that there is a significant positive spatial correlation of China’s banking competition, and reached its peak in 2008. The banking competition is influenced by spatial correlation. In other word, the banking competition does not occur randomly but presents notable regional cluster distribution. Regions that have similar banking competition are in clusters. Therefore, when considering regional banking competition, spatial correlation is an important factor that should not be overlooked. Otherwise, the estimated value will not correspond to the actual value.
Table 1.
Moran’s I index of China’s banking competition between 2000 and 2011.
Table 1.
Moran’s I index of China’s banking competition between 2000 and 2011.
| Year | Moran’s I | E (I) | sd (I) | Z-value |
|---|
| 2000 | 0.1285 | −0.0345 | 0.1232 | 1.4685 * |
| 2001 | 0.1321 | −0.0345 | 0.1245 | 1.4862 * |
| 2002 | 0.1574 | −0.0345 | 0.1256 | 1.7351 * |
| 2003 | 0.1858 | −0.0345 | 0.1238 | 1.9776 * |
| 2004 | 0.2198 | −0.0345 | 0.1249 | 2.2465 ** |
| 2005 | 0.2327 | −0.0345 | 0.1198 | 2.3275 ** |
| 2006 | 0.2120 | −0.0345 | 0.1223 | 2.0819 ** |
| 2007 | 0.2674 | −0.0345 | 0.1241 | 2.5348 ** |
| 2008 | 0.2486 | −0.0345 | 0.1274 | 2.3910 ** |
| 2009 | 0.2467 | −0.0345 | 0.1228 | 2.3810 ** |
| 2010 | 0.1816 | −0.0345 | 0.1239 | 1.8252 ** |
| 2011 | 0.1958 | −0.0345 | 0.1284 | 1.9853 ** |
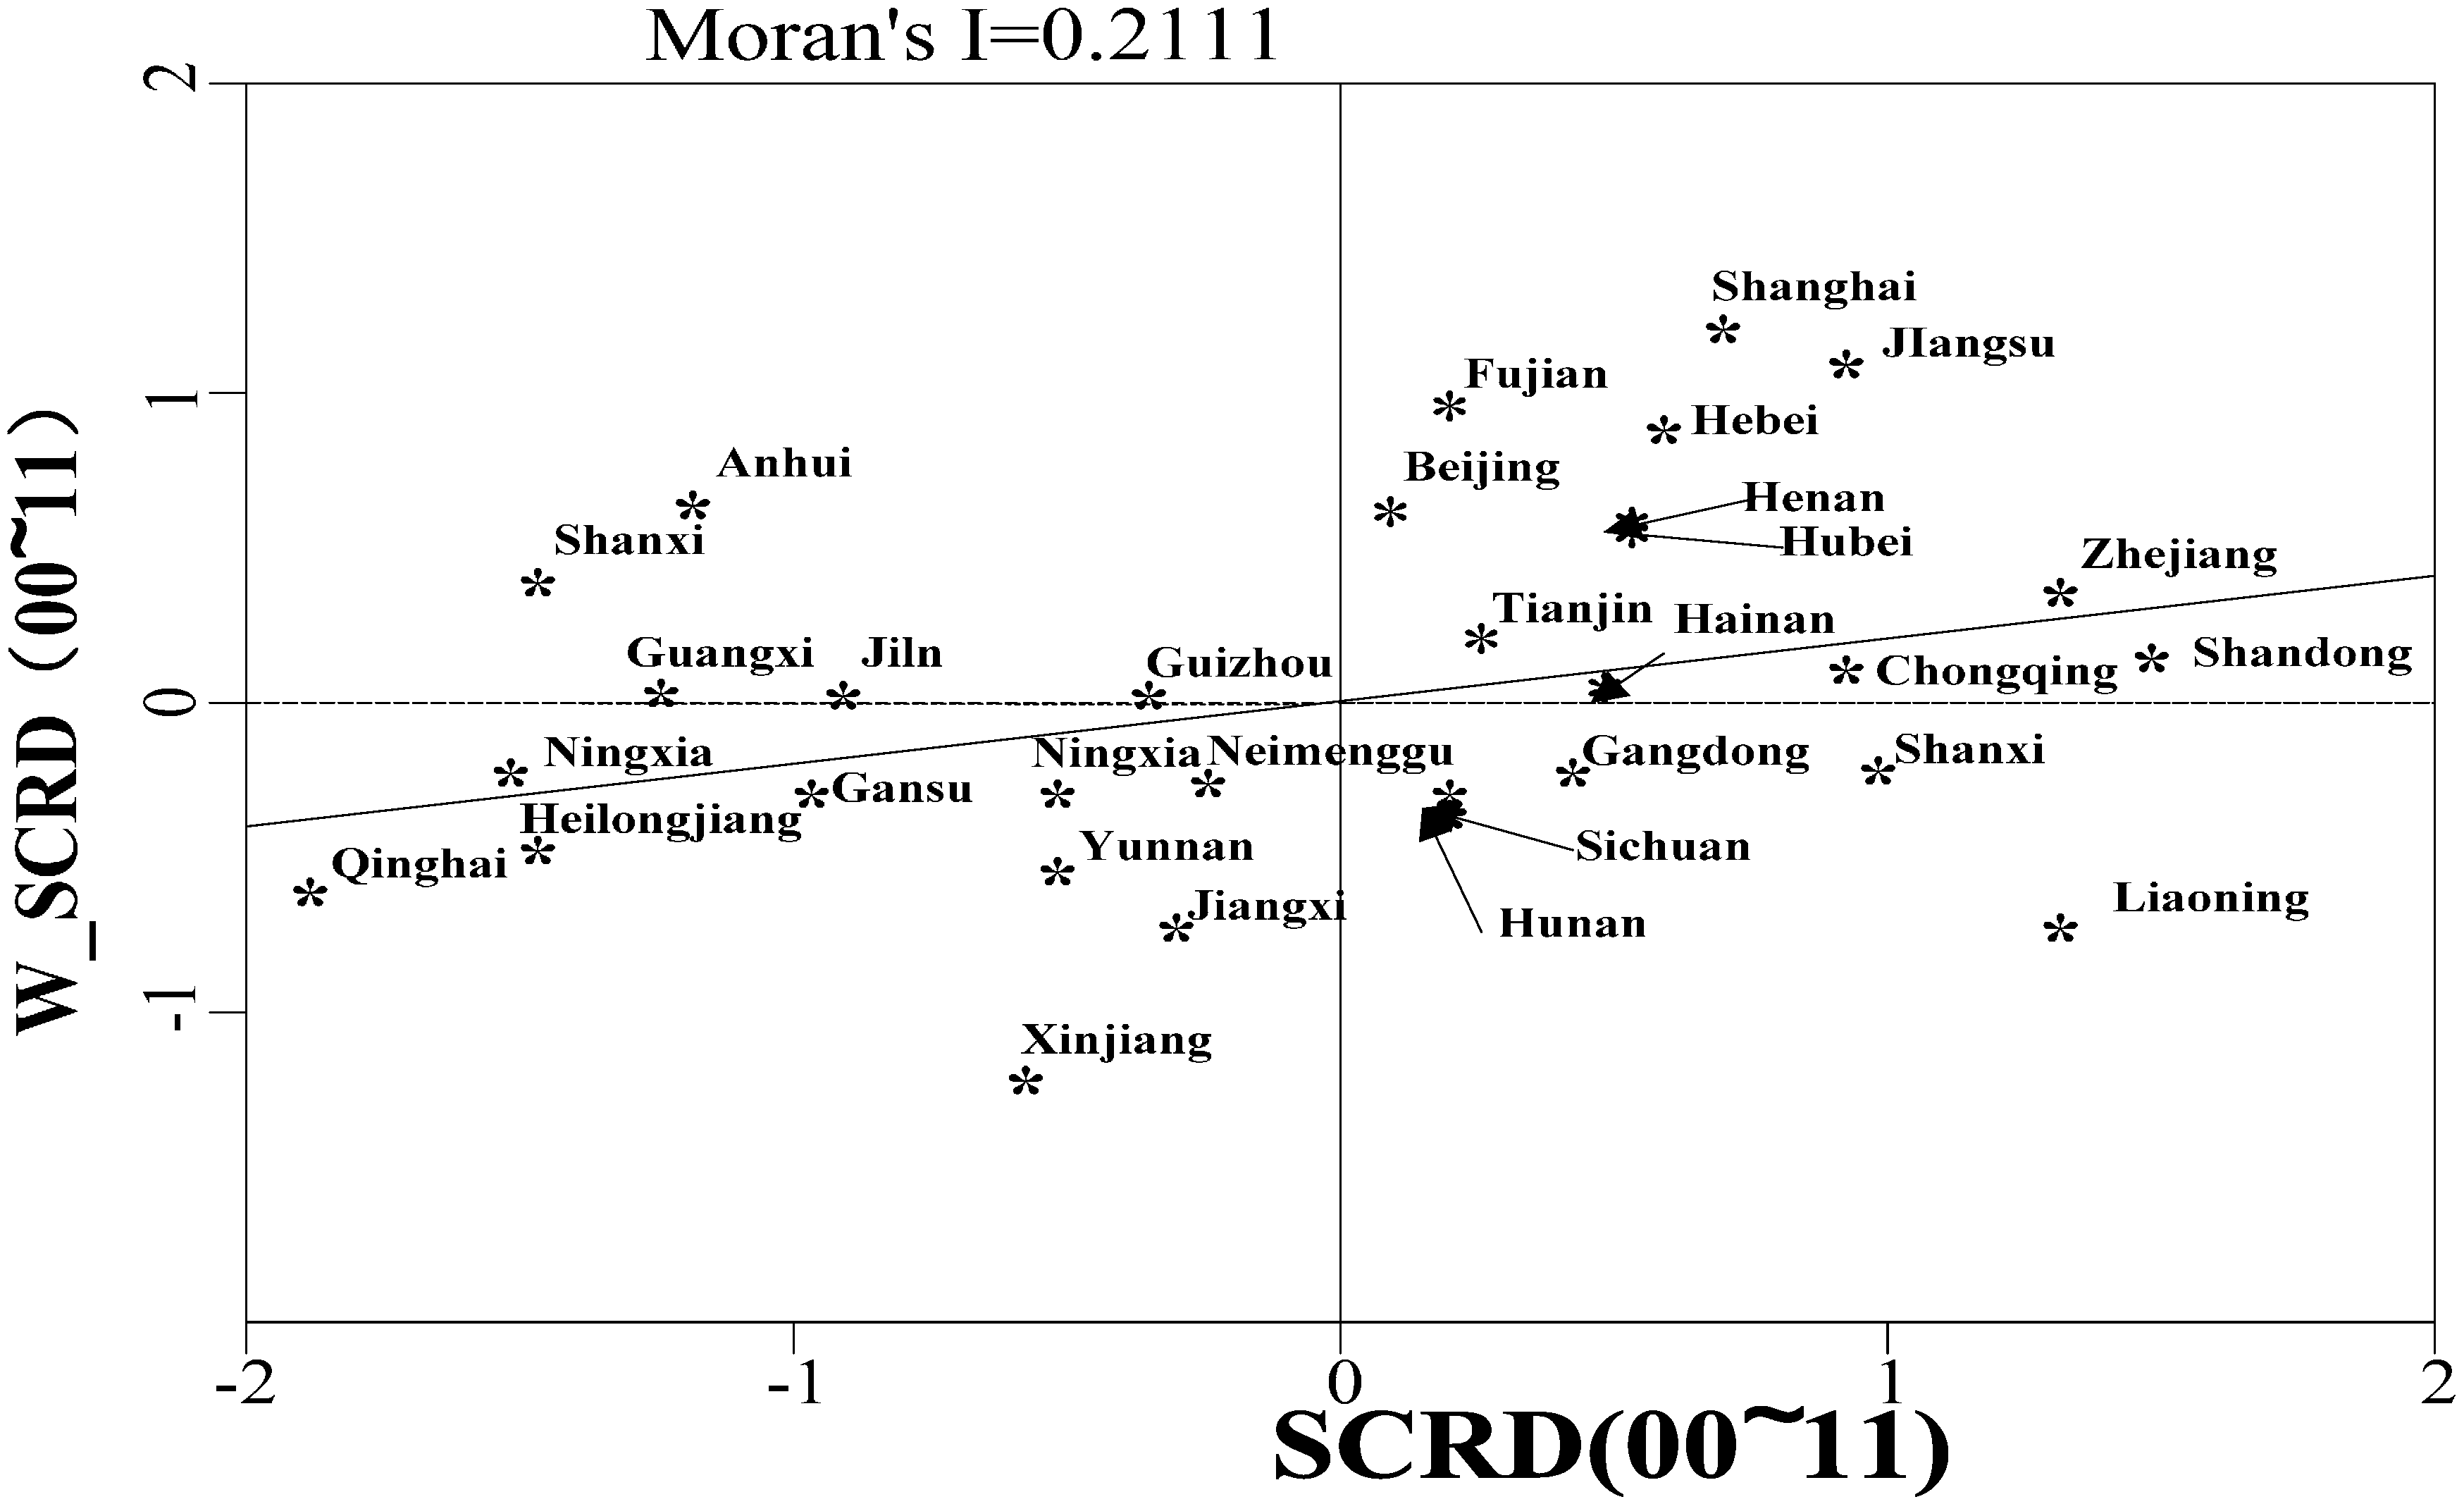
Figure 1 shows LISA map for the proportion of deposits of each province’s non-state-owned financial institutions from 2000 to 2011. It can be noticed that there is a strong spatial similarity of banking competition between neighboring provinces in China. H-H (high-high) quadrant refers to the province which has a high proportion of deposits in non-state-owned financial institutions inside that province, while having a low proportion of deposits in neighboring provinces. From the view of spatial lagging index, the spatial dependence is clearly seen. Twelve provinces accounting for 40% of total units are in H-H quadrants, including Beijing, Tianjin, Hebei, Jiangsu, Zhejiang, Shanghai, Shandong, Fujian, Hainan, Chongqing, Hubei and Hunan. L-H (low-high) quadrant refers to a province which has a low proportion of deposits in non-state-owned financial institutions inside that province, while having a high proportion of deposits in neighboring provinces. Only two provinces, Anhui and Shanxi, are in this category, accounting for 6.67%. L-L (low-low) quadrant refers to a province which has a low proportion of deposits in non-state-owned financial institutions inside that province, while also having a low proportion of deposits in neighboring provinces. Eleven provinces accounting for 36.67% of total units are in L-L quadrant, including Jilin, Heilongjiang, Jiangxi, Guizhou, Guangxi, Inner Mongolia, Gansu, Ningxia, Qinghai, Yunnan and Xinjiang. L-H (high-low) quadrant refers to a province which has a low proportion of deposits in non-state-owned financial institutions inside that province, while having a high proportion of deposits in neighboring provinces.
Figure 1.
Local scatter map for a province’s proportion of deposits in non-state-owned financial institutions from 2000 to 2011.
Figure 1.
Local scatter map for a province’s proportion of deposits in non-state-owned financial institutions from 2000 to 2011.
5. Indicators and Data Sources
There is a significant spatial correlation of regional banking competition, overall evidenced by
Moran’s I the spatial LISA map. Thus, in the econometric model, spatial correlation between variables should be taken into consideration. This paper analyzes panel data of 30 provinces. We must choose fixed effect or random effect for empirical model; the former referring to the significant influence of individual effect on the regression variable, and the latter indicating no correlation is identified between individual effect and the regression variable. According to Equations (4) and (5), the SAR (Spatial Autocorrelation) model with the spatial effect considered is expressed as:
The model is a common fixed-effect spatial model. Δ and λ are spatial autoregressive coefficients and spatial error coefficient, respectively. If δ is 0, the model becomes a Spatial Error Model (SEM). If λ is 0, the model becomes a spatial autoregressive model (SAR). αi and represent spatial fixed effect and time fixed effects, respectively. Variables in the basic econometric model are defined as the following:
Banking competition (BC):The paper cites viewpoints of banking competition from Besallkoand Thakor (1992), Bernanke, Gertlerand Gilchist (1996), and Petersen and Rajan (1995). According to these authors [
12,
13,
14], the greater share of deposits (or loans) monopolistic state-owned commercial banks own in financial markets, the more competitive the integral banking industry is, and
vice versa. Therefore, it is relatively accurate to use market shares of deposits in small- and medium-size financial institutes as an index to measure the structure of banking competition. Based on the above points of view, given that only four state-owned commercial banks have comprehensive data, this paper replaces banking competition (
BC) with dispersion of the banking industry. According to the achievement made by Fan and Wang (2009) about the financial sector competition index [
20], this paper defines banking competition structure as the proportion of deposits in a given province’s non-state-owned banking institutions compared to all financial institutions in that province overall, or SCRD. The value is between 0 and 1. The larger the value is, the fiercer the banking competition is and
vice versa. What is to be noted here is that the banking sector is more structured than the degree of competition. Deposit market share is a key indicator in measuring the competitive structure of banks overall. The deposit of small and medium banks in market share is stronger and stronger, which is a more competitive stance in the market. The whole bank competition structure is more inclined to compete rather than settle into an oligopoly.
Economic growth (GDP): This is defined with a natural logarithm by year. Many scholars are interested in the influence of the mechanism of banking competition structure on economic growth (Guzman, 2000) [
25], and few consider the other way around. Generally speaking, personal income increases with economic growth, resulting in more and higher loans and deposits, while in the financial market, many non-state-owned small- and medium-sized financial institutions would spring up, competing for loans and deposits. Coccorese (2007) also found that long-term economic growth is helpful in easing banking concentration and enhances market competition of the banking industry. Given that economic growth raises the level of banking competition, the coefficient of the variable is anticipated to be positive [
26].
Financial development scale (LAV): This is expressed by the total amount of loans and deposits in a given year of all financial institutions in a given province using a natural logarithm to show the impact of expanding the financial market on banking competition structure. As a result of expanding the financial market, more banks can be accommodated, which helps dispersion of loans in the banking industry. He and Liu (2008) also proved that the expansion of the financial market can ease banking concentration and raise banking competition, thus creating a favorable condition under which to increase the competitiveness of the banking industry [
27]. The coefficient of the variable is anticipated to be positive.
Foreign direct investment (FDI): This is expressed by the proportion of corrected FDI in a given year in a given province according to average exchange rate of USD against RMB to the nominal GDP of the same year in order to measure the impact of the “opening-up” policy and implementation on banking competition. The more foreign direct investment a region attracts, the higher the level of opening-up is and the more connected the region is to the international economy. Generally speaking, with increasing FDI, SMEs such as joint-ventures and foreign-owned enterprises will spring up. The diversity and general nature of these enterprises require accompanying financial services and functions. Compared to large banks, small- and medium-sized banks in particular are more flexible and targeted when providing credit service and, additionally, have lower fixed costs. In implementing credit services, the personal information cost and the trading cost are also low. That is to say, the credit service develops a niche market. Large banks mainly serve state-owned enterprises, while small- and medium-sized banks have SMEs as their customers. Thus, the higher the level of opening up is, the more dispersed the loan and deposit services are in the local banking industry, and the more competitive it is.
Fixed asset investment (INV): This is expressed by the ratio of annual fixed asset investment in a given province against its GDP to measure the influence of investment on banking competition. Fixed assets loanscomprise a large portion of banking loans. It provides direct financing for enterprises to meet the need of fixed asset investment, and to support social undertakings, basic industry, pillar industry and emerging industry at the provincial level. National industrial and financial policies clearly show preference for these types of loans. Generally, fixed asset investment is large, therefore it cannot be supported by small- and medium-sized financial institutions. The sum is usually provided by wealthy large-scale state-owned banks, which are averse to enhance regional banking competition. Thus, the higher the fixed asset investment is, the more monopolistic the banking industry is. The coefficient of the variable is anticipated to be negative.
Government intervention (GOV): This is expressed by the ratio of annual fiscal expenditure of a given province against local GDP to reflect the influence of local government intervention on banking competition. Policies local governments are mainly applied to state-owned commercial banks. Thus, compared to small- and medium-sized financial institutions, the four major state-owned commercial banks are more restricted. The more regional fiscal spending is, the more plans there are for regional economic development, and the more support there is of regional state-owned commercial banks for economic development. As a result, state-owned commercial banks will deepen the monopoly position. Lin and Jiang (2006) pointed out that the monopoly position China’s four major state-owned commercial banks is not a result of market competition. Rather, it is a product of the national planned economy and political intervention [
28]. Thus, the more the regional fiscal spending, the lower the banking competition, and the coefficient of the variable is anticipated to be negative.
Human capital (EDU): This is expressed by the number of higher-education enrollment per ten thousand persons of a given province using a common algorithm to measure the influence of human capital on banking competition, reflecting local human resources endowment. The financial sector is a high-end industry and seeks people with a higher education degree and talent. While state-owned commercial banks reach saturation at a certain point in terms of employment, small- and medium-sized banks are energized to create employment, and increasing regional human capital drives them more [
29]. Therefore, the higher regional human capital is, the more developed small- and medium-sized banks are and the fiercer the banking competition is. Thus, the coefficient of the variable is anticipated to be positive.
This paper selects panel data of 30 provinces in China from 2000–2011 while ensuring the data are available and the statistics are consistent. All data are sourced from the Almanac of China’s Finance, China Statistical Yearbook and local yearbooks. Due to a lack of data, Tibet was eliminated from the statistics. Due to a lack of deposit data for the four major state-owned commercial banks in some provinces (Hainan, Henan, Hunan, and Hebei) or in some years, the annual report of the four major state-owned commercial banks were consulted to fill in the gaps. For data that are nowhere to be found, interpolation is used to fill in the gaps. Deposit amounts of the four major state-owned commercial banks is subtracted from that of all financial institutions and the rest is for non-state-owned small- and medium-sized financial institutions.
6. Empirical Results and Interpretation
6.1. Metrology of Ordinary Panel Data Model and Spatial Correlation Test
Firstly, the model (Equation (6)) is subject to ordinary regression and the residual term is subject to Matlab 7.11 to check if it has spatial correlation. To make the model available,
Table 2 shows test data of the mixed panel model, the regional fixed-effect model, the spatial fixed-effect model and the two-way fixed effect model. Through comparison and analysis, we can verify the necessity of the fixed-effect model.
Table 2.
Estimation and test result of ordinary panel data model.
Table 2.
Estimation and test result of ordinary panel data model.
| Variable | Mixed | Spatial Fixed Effect | Time Fixed Effect | Two-Way Fixed Effect |
|---|
| −0.0027 (−1.1076) | −0.0012 (−0.6854) | −0.0332 ** (−2.2830) | 0.0316 *** (2.8022) |
| 0.0770 *** (11.3188) | 0.1502 *** (10.2527) | 0.1132 *** (8.2062) | 0.5031 *** (17.6156) |
| 0.3131 * (1.5815) | 0.0089 (0.0030) | 0.3215 * (−1.6148) | 0.7020 *** (2.7804) |
| 0.0820 ** (2.2546) | −0.1598 *** (−3.6710) | 0.1489 *** (3.4687) | −0.0232 (−0.5908) |
| −0.0011 (−0.0137) | −0.4606 *** (−3.7433) | 0.0031 (0.0295) | −0.1148 *** (−3.0341) |
| | 0.0033 (0.3002) | −0.0010 (−0.0646) | −0.0047 (−0.5520) | 0.0362 * (1.7485) |
| 0.5107 | 0.7225 | 0.5361 | 0.8278 |
| 405.9405 | 508.0026 | 415.5381 | 593.9021 |
| 1.8120 | 1.7188 | 1.8507 | 2.0835 |
| 3.0611 ** | 29.9644 *** | 0.0622 | 2.9074 ** |
| 0.2250 | 1.4587 | 0.0934 | 0.0277 |
| 2.9494 ** | 28.5456 *** | 0.0445 | 2.6908 ** |
| 0.1133 | 0.0399 | 0.0133 | 0.2444 |
From
Table 2, it can be seen that by comparing the four models’ judgment coefficient of level of suitability, the coefficient of the mixed panel is 0.5107, the smallest among the four. After the spatial fixed-effect is controlled, its judgment coefficient increases to 0.7225. After the spatial fixed-effect and the time fixed-effect is controlled, its judgment coefficient increases to 0.8278, the largest among the four. This indicates that the two-way fixed-effect model is more reliable than the other three. Comparing the log-likelihood function of the four models, the value of the two-way fixed effect model reaches as much as 593.9021, higher than the other three.
DW of two-way fixed-effect model is 2.0835, which is also higher than the other models. This suggests that two-way fixed effect model can more accurately explain the data; thus, it is the optimal choice as an econometric model.
The second half of
Table 2 shows the statistics of whether the residual term of the ordinary panel data model has a spatial correlation. In the two-way fixed effect model,
LM – lag of spatial lagging index is 2.9074 with
LM − err of error index at 2.6908, both of which pass the 5% significance test. It clearly indicates that the residual term of the model has a significant spatial correlation. However, in comparison,
LM – lag of the spatial lagging index requires more statistical magnitude than
LM – err of error index. Thus, the spatial autoregressive model is more suitable than the spatial error model.
6.2. Estimation Results of SAR (Spatial Autocorrelation) Model
According to abovementioned analysis, the residual term of the ordinary panel data model has a significant spatial correlation. Spatial correlation between variables has posed as ubstantial influence on the model estimation. Thus, this paper adopts a spatial econometric method to regress the two-way fixed effect model. Its estimation adopts the maximum likelihood method
ML. The estimated result of the two models
SAR and
SEM are shown in
Table 3.
Table 3.
Two-way fixed SAR (Spatial Autocorrelation) model.
Table 3.
Two-way fixed SAR (Spatial Autocorrelation) model.
| Variable | SAR | SEM |
|---|
| GDP | 0.0321 *** (2.8852) | 0.0314 *** (2.7720) |
| LAV | 0.4983 *** (17.5362) | 0.5034 *** (17.6152) |
| FDI | 0.7027 *** (2.8158) | 0.6414 *** (2.5688) |
| INV | −0.0181 (−0.4663) | −0.0188 (−0.4804) |
| GOV | −0.1127 *** (−3.0267) | −0.1117 *** (−2.9931) |
| EDU | 0.0418 ** (2.0148) | 0.0362 * (1.7705) |
| 0.1269 ** (1.9307) | |
| | 0.0939 * (1.5679) |
| 0.8291 | 0.8279 |
| Log − L | 595.1613 | 594.8543 |
From
Table 3, it can be seen that the spatial lag value of the explanatory variable
of the spatial autoregressive model (
SAR) is 0.1269, passing the 5% significance test. The explanatory variable
of the spatial error model (
SEM) is 0.0939, passing the 10% significance test. Toe indexes provide reference for spatial econometric models. In addition, the estimation coefficient of the
SAR model is positive if that of the ordinary panel data model is positive, and
vice versa. However, the T SCORE of the estimation coefficient has been improved based on the ordinary panel data model. This indicates that spatial econometric models can improve the estimation result of the ordinary panel data model. The judgment coefficient of the level of suitability of
SAR and
SEM are 0.8291 and 0.8279, respectively, both of which have increased somewhat compared to that of the ordinary panel data model. In terms of
Log − L,
Log − L of the
SAR model
Log – L is more than that of the ordinary panel data model. However, that of
SAR is more than that of
SEM. This indicates that the
SAR model can explain the data more accurately than the
SEM model. Thus, this paper uses the
SAR model to determine explanatory variables.
First, the estimation coefficient of economic growth (GDP) is positive and passes the 1% significance test. This indicates that economic growth can increase banking competition. With the expansion of economic scale, national personal income, particularly in rural areas, is also on the rise. As a result, they have more money to deposit, thus further stimulating the expansion of the banking industry. Many non-state-owned small- and medium-sized banks will spring up, which dilutes banking concentration. It is beneficial to disperse loans and deposits throughout the banking industry.
Second, under 1% level of significance, the financial development scale LAV has a positive influence on banking competition, indicating that the larger the financial development scale is, the fiercer the banking competition is. The financial development scale refers to the degree of accommodation within the banking industry. A large financial development scale means the banking industry will attract more non-state-owned commercial banks to participate in market competition. When the financial sector develops to a certain degree, in order to accommodate more banks, the market will set requirements of diversity and specialty in loan and deposit services. If so, large-scale state-owned banks cannot meet the market requirement, so relatively flexible non-state-owned small- and medium-sized banks will take the lead and increase in numbers. This will further increase banking competition.
Third, the estimation coefficient of foreign direct investment FDI is positive and passes the 1% significance test, suggesting that financial opening-up can promote banking competition.The degree of regional opening to the outside world directly determines the level of opening up the financial markets. Generally speaking, in a closed financial market, government planning is dominant while lacking market competition. However, an open financial market is always equipped with a perfect competition mechanism, and can also determine the threshold of foreign banks entering the local market. The more open, the lower the threshold to the local market and the more foreign enterprises there will be in the market. This will form a beneficial pattern of competition involving both Chinese and non-Chinese enterprises, which is conducive to banking competition.
Fourth, the estimation coefficient of fixed asset investment (INV) is negative but fails to pass the significance test. In other words, the influence of fixed asset investment on banking competition is not notable. This may be because the nature of fixed asset investment loans, as significant source of fixed asset investment, is diversifying. Since the financial reform in the 1990s, fixed asset investment loans were no longer concentrated in the four major state-owned commercial banks. Some non-state-owned banks proposed to shoulder such service, but there is no perfect market competition with regard to fixed asset investment loans. Thus, the influence of fixed asset investment on banking competition is not significant.
Fifth, the estimation coefficient of government intervention GOV is negative and passes the 1% significance test, indicating that an increase in government expenditure curbs banking competition. The more the local government spends, the more restrictions are imposed on the banking industry, especially on the state-owned commercial banks. Protectionism of the local government is prominent. Thus, policy-oriented state-owned commercial banks win opportunities of development, witnessing an increase in market share. This will break non-state-owned commercial banks and hinder banking competition.
Sixth, the estimation coefficient of human capital EDU is positive and passes the 1% significance test, suggesting that human capital is beneficial to banking competition. Human capital can enhance the quality of employees. The medium and high-end labor market is in need of people and the financial labor market in particular is an integral part of the medium and high-end labor market. In other word, human capital is the stimulus of the development of the financial sector. At present, the labor market for large-scale state-owned banks reaches saturation, making small- and medium-sized banks a source of employment. Many small- and medium-sized banks will spring up, helping to reduce banking concentration and improve banking competition.


