
Developing a Green Supplier Selection Model by Using the DANP with VIKOR


Abstract
:1. Introduction
2. Literature Review
2.1. Methods to Green Supplier Selection and Evaluation

| Method | References | |
|---|---|---|
| AHP | AHP, Fuzzy AHP, FEAHP | [5,9,11,37] |
| Integrated AHP | AHP and artificial neural network | [38] |
| AHP and genetic algorithm | [39] | |
| AHP and data envelopment analysis | [40] | |
| AHP and grey relational analysis | [41] | |
| AHP and mathematical programming | [42] | |
| AHP and fuzzy TOPSIS | [17] | |
| ANP | ANP, Fuzzy ANP | [10,22,43] |
| Integrated ANP | ANP and data envelopment analysis | [40,44] |
| ANP and rough set theory | [12] | |
| ANP and PROMETHEE | [45] | |
| ANP and VIKOR | [24] | |
2.2. Criteria for Green Supplier Selection
| Criteria | References |
|---|---|
| Environmental management systems | [6,7,11,13,37,38,39,41,46,47,48,49] |
| Quality | [11,13,39,40,46,48,49] |
| Price/cost | [13,39,47,49,50,51] |
| Service | [13,39,40,41,49,52] |
| Technology | [11,40,41,43] |
| Green design | [6,7,11,48,53,54] |
| Green image | [6,7,11,47,48] |
| Environmental performance | [37,54,55,56] |
| Environmental Competences | [6,7,46,47] |
| Green collaboration with suppliers | [5,10,56] |
| Dimension | Criteria | Description |
|---|---|---|
| Environmental | Environmental Permits and Reporting | All required environmental permits (e.g., discharge monitoring), approvals and registrations are to be obtained, maintained and kept current and their operational and reporting requirements are to be followed |
| Pollution Prevention and Resource Reduction | Waste of all types, including water and energy, are to be reduced or eliminated at the source or by practices such as modifying production, maintenance and facility processes, materials substitution, conservation, recycling and re-using materials. | |
| Hazardous Substances | Chemicals and other materials posing a hazard if released to the environment are to be identified and managed to ensure their safe handling, movement, storage, use, recycling or reuse and disposal. | |
| Wastewater and Solid Waste | Wastewater and solid waste generated from operations, industrial processes and sanitation facilities are to be characterized, monitored, controlled and treated as required prior to discharge or disposal. | |
| Air Emissions | Air emissions of volatile organic chemicals, aerosols, corrosives, particulates, ozone depleting chemicals and combustion by-products generated from operations are to be characterized, monitored, controlled and treated as required prior to discharge. | |
| Product Content Restrictions | Participants are to adhere to all applicable laws, regulations and customer requirements regarding prohibition or restriction of specific substances, including labeling for recycling and disposal. | |
| Management systems | Company Commitment | A corporate social and environmental responsibility policy statements affirming Participant’s commitment to compliance and continual improvement, endorsed by executive management. |
| Management Accountability and Responsibility | The Participant clearly identifies company representative[s] responsible for ensuring implementation of the management systems and associated programs. Senior management reviews the status of the management system on a regular basis. | |
| Legal and Customer Requirements | A process to identify, monitor and understand applicable laws, regulations and customer requirements, including the requirements of this Code. | |
| Risk Assessment and Risk Management | A process to identify the environmental, health and safety3 and labor practice and ethics risks associated with Participant’s operations. Determination of the relative significance for each risk and implementation of appropriate procedural and physical controls to control the identified risks and ensure regulatory compliance | |
| Improvement Objectives | Written performance objectives, targets and implementation plans to improve the Participant’s social and environmental performance, including a periodic assessment of Participant’s performance in achieving those objectives. | |
| Training | Programs for training managers and workers to implement Participant’s policies, procedures and improvement objectives and to meet applicable legal and regulatory requirements. | |
| Communication | A process for communicating clear and accurate information about Participant’s policies, practices, expectations and performance to workers, suppliers and customers. | |
| Worker Feedback and Participation | Ongoing processes to assess employees’ understanding of and obtain feedback on practices and conditions covered by this Code and to foster continuous improvement. | |
| Audits and Assessments | Periodic self-evaluations to ensure conformity to legal and regulatory requirements, the content of the Code and customer contractual requirements related to social and environmental responsibility. | |
| Documentation and Records | Creation and maintenance of documents and records to ensure regulatory compliance and conformity to company requirements along with appropriate confidentiality to protect privacy. |
3. Methodology
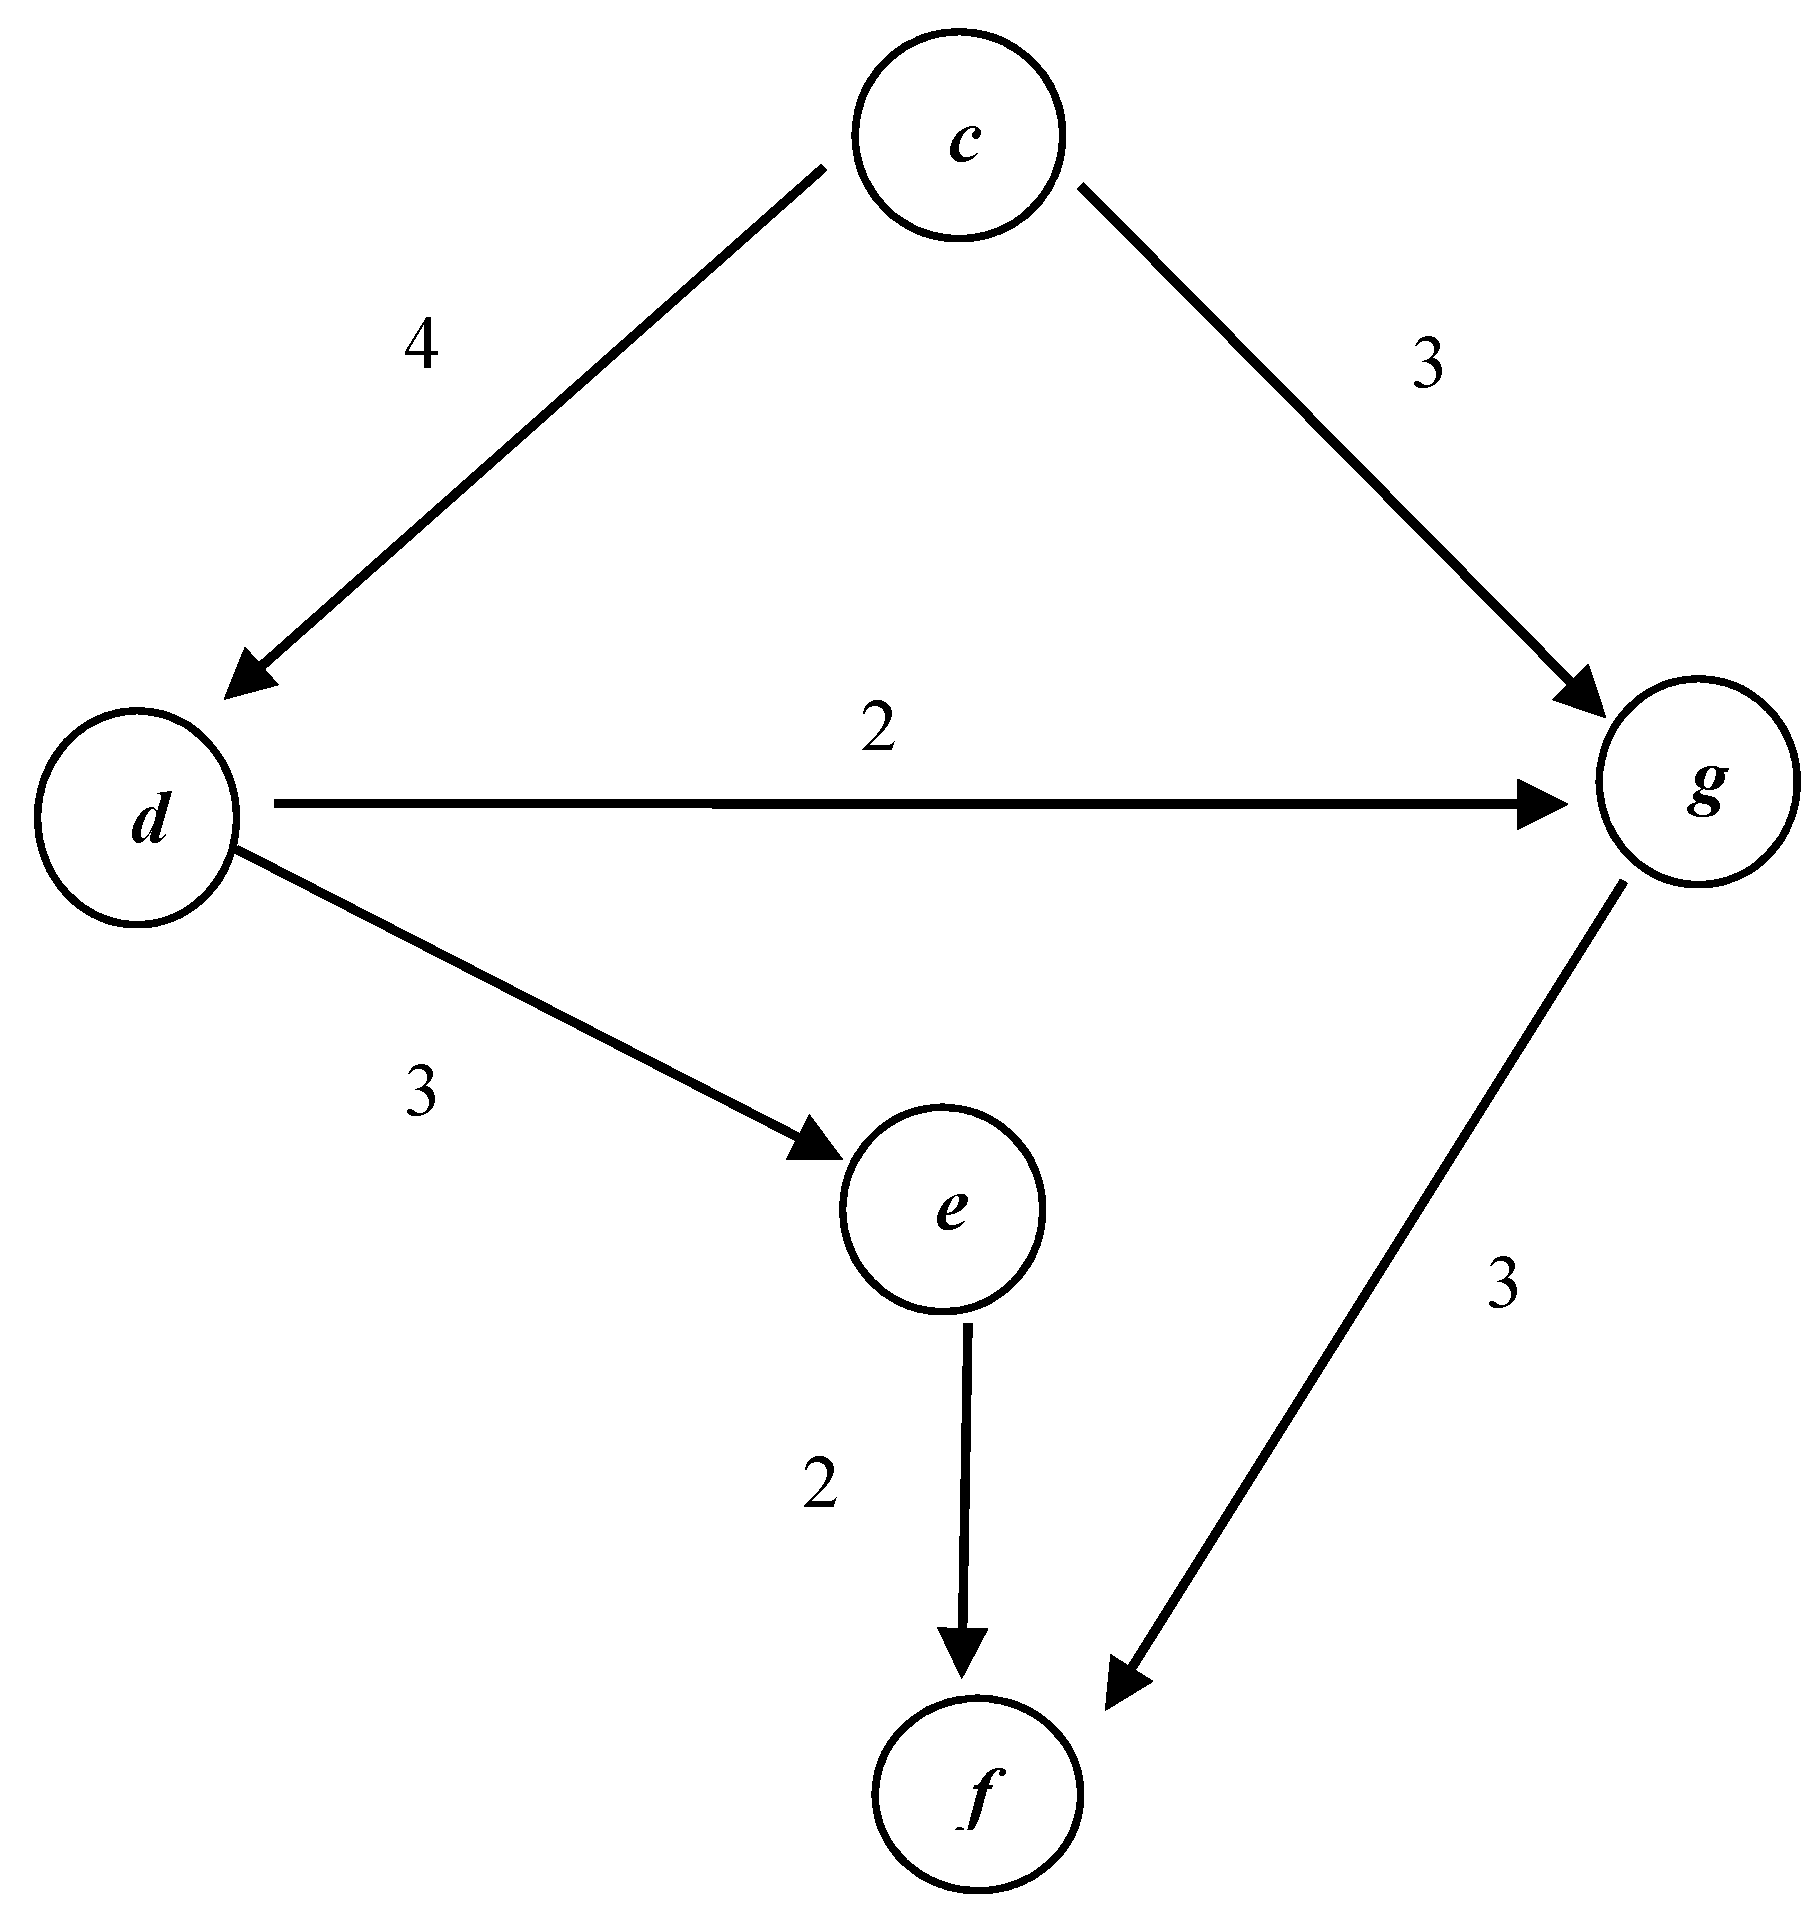
3.1. Building a Network Relation Map Using the DEMATEL

3.2. Combining the DEMATEL and ANP to Calculate the Evaluation Weights by NRM


3.3. Ranking the Alternatives Using the VIKOR Method
4. Case Study of an Electronics Company
4.1. Identifying Consistent Evaluation Criteria
| Dimension | Criteria |
|---|---|
| Environment (D1) | Environmental permits and reporting (C1) |
| Pollution prevention and resource reduction (C2) | |
| Hazardous substances (C3) | |
| Wastewater and solid waste (C4) | |
| Air emissions (C5) | |
| Product content restrictions (C6) | |
| Management system (D2) | Company commitment (C7) |
| Management accountability and responsibility (C8) | |
| Legal and customer requirements (C9) | |
| Risk assessment and risk management (C10) | |
| Performance objectives with implementation plan and measures (C11) | |
| Training (C12) | |
| Communication (C13) | |
| Worker feedback and participation (C14) | |
| Audits and assessments (C15) | |
| Corrective action process (C16) | |
| Documentation and records (C17) |
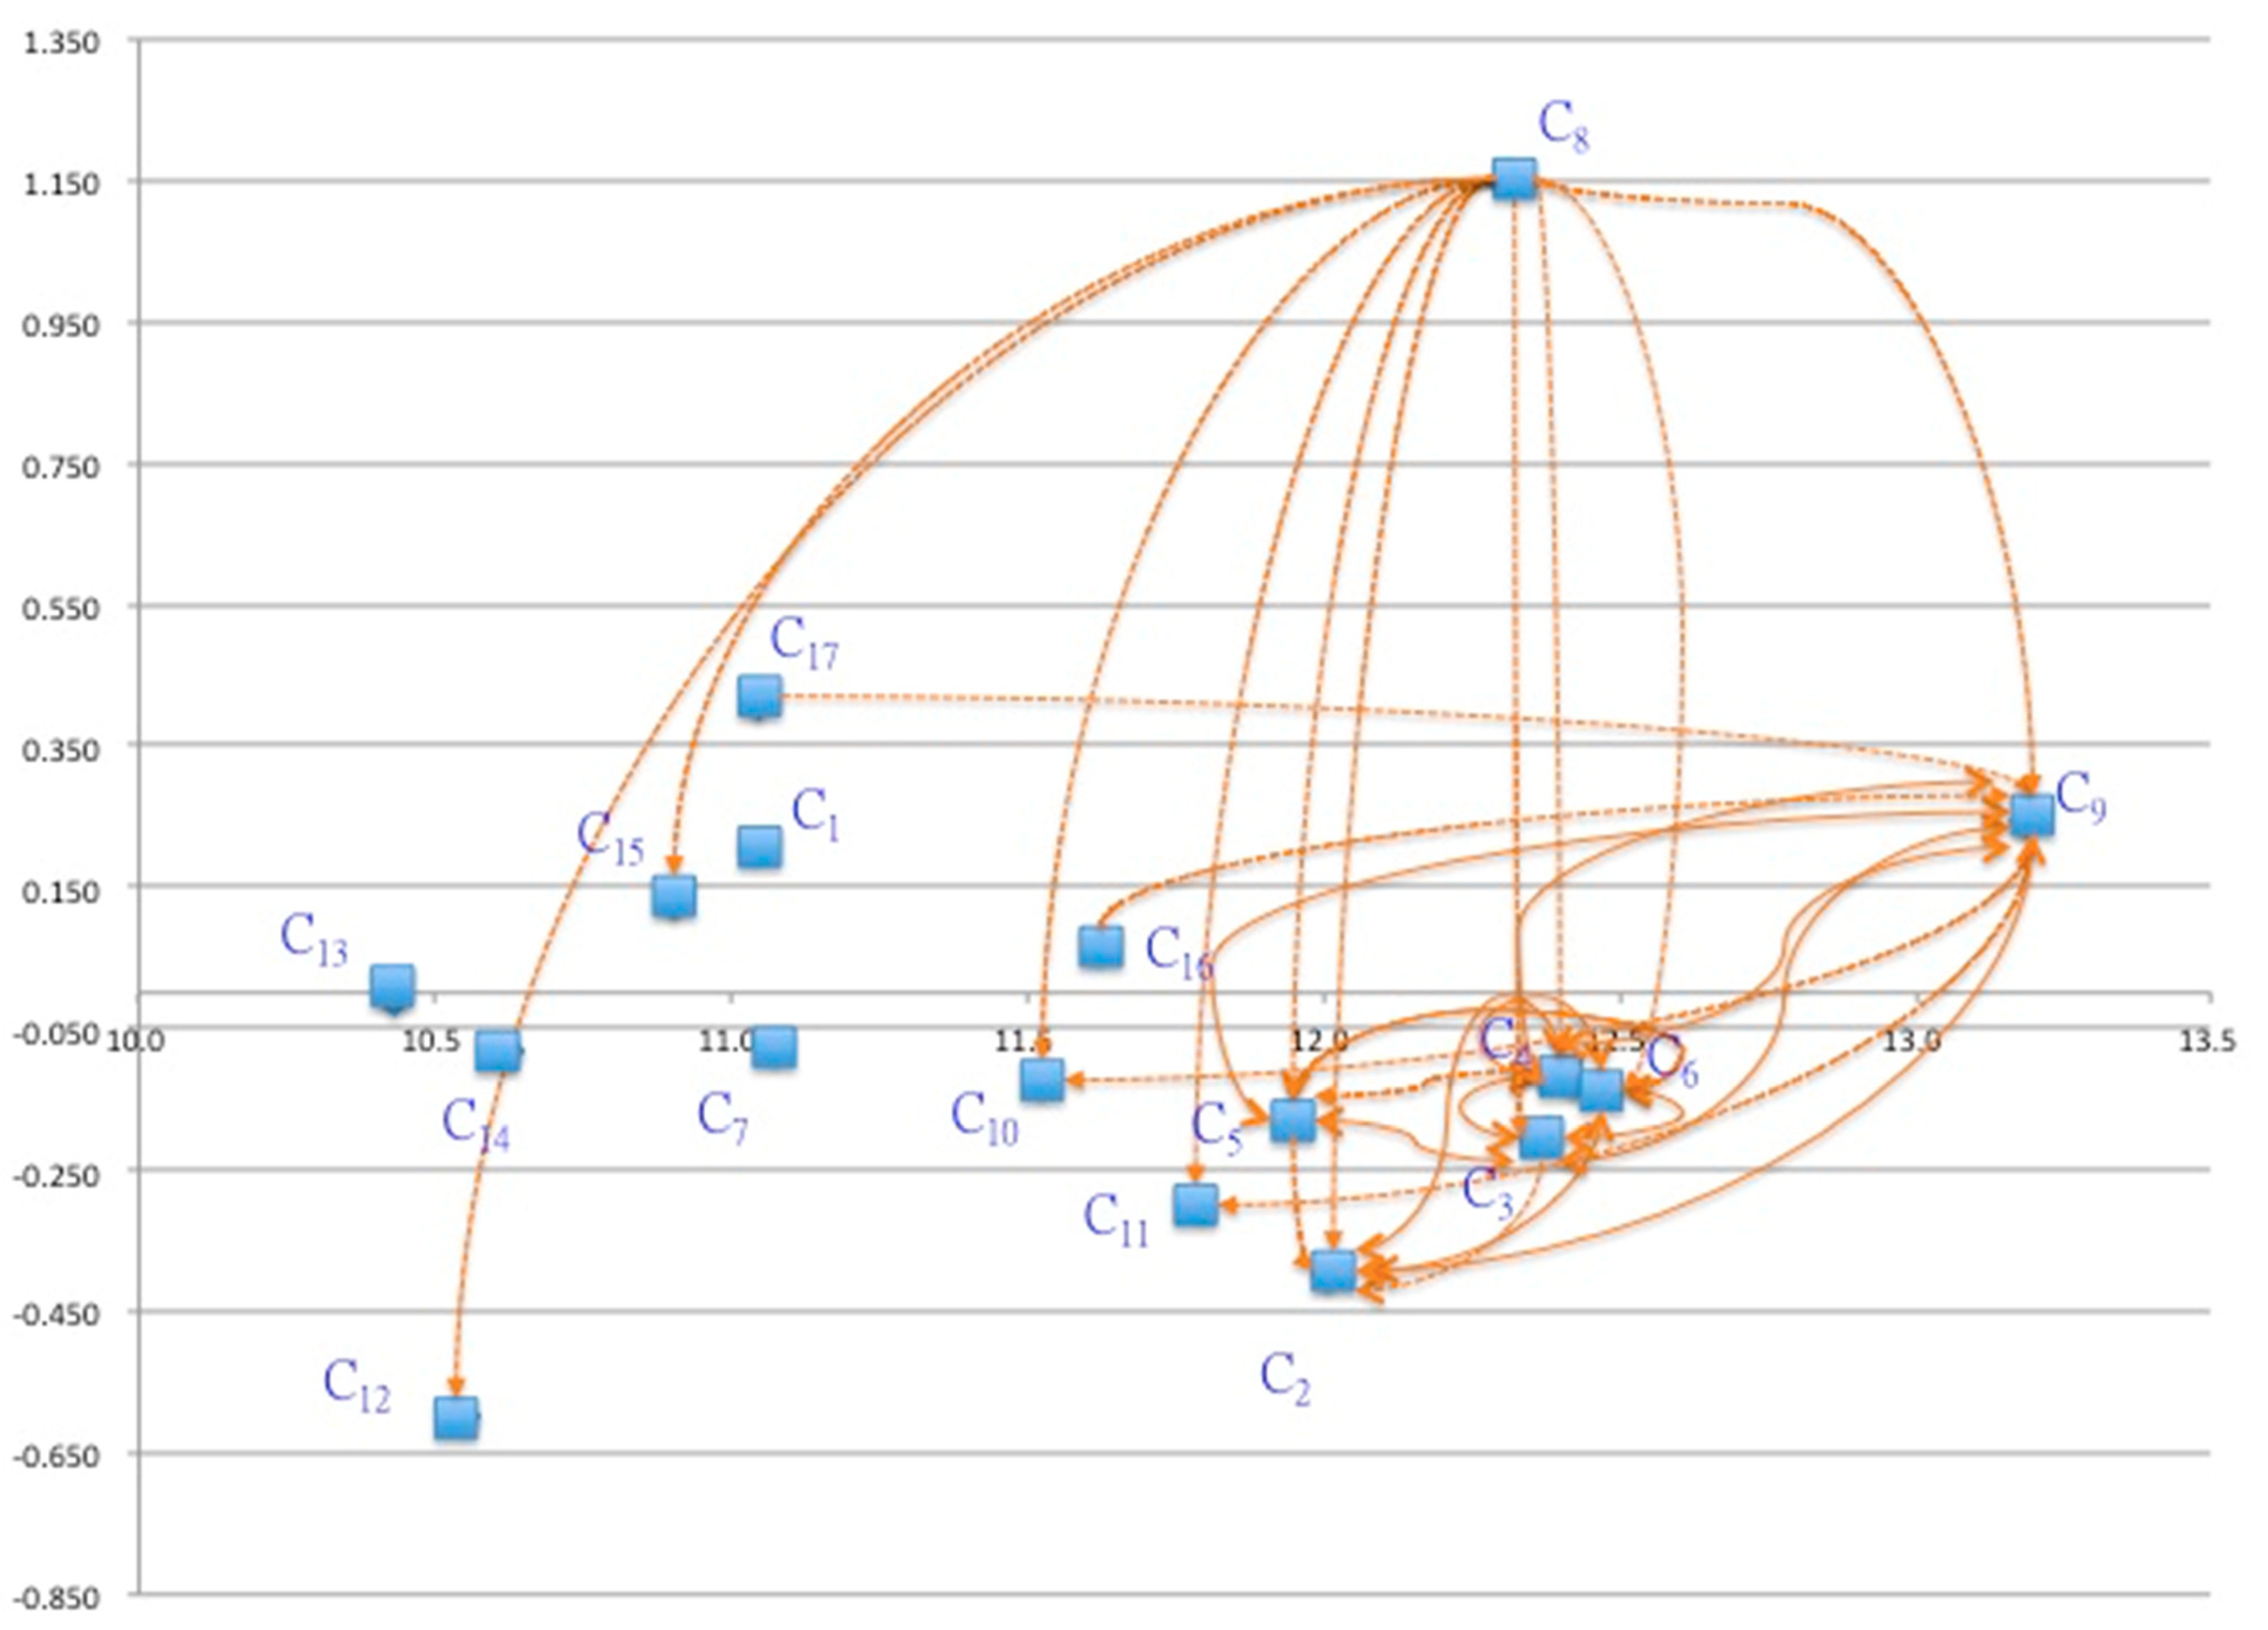
4.2. Determining the Relationships between Criteria by DEMATEL

| C1 | C2 | C3 | C4 | C5 | C6 | C7 | C8 | C9 | C10 | C11 | C12 | C13 | C14 | C15 | C16 | C17 | |
|---|---|---|---|---|---|---|---|---|---|---|---|---|---|---|---|---|---|
| C1 | 0.000 | 3.200 | 3.400 | 3.400 | 3.400 | 2.800 | 2.200 | 2.400 | 3.200 | 2.600 | 3.200 | 3.000 | 1.800 | 1.600 | 2.200 | 2.800 | 2.600 |
| C2 | 3.200 | 0.000 | 3.400 | 3.400 | 3.400 | 3.400 | 2.800 | 2.400 | 3.000 | 2.800 | 2.600 | 2.800 | 2.400 | 2.400 | 2.200 | 2.800 | 2.400 |
| C3 | 3.200 | 4.000 | 0.000 | 3.800 | 3.400 | 3.600 | 2.800 | 2.600 | 3.600 | 3.200 | 2.600 | 2.600 | 2.000 | 2.400 | 2.400 | 2.800 | 2.600 |
| C4 | 3.200 | 3.800 | 4.000 | 0.000 | 3.200 | 3.400 | 2.800 | 2.600 | 3.600 | 2.400 | 3.000 | 3.000 | 2.400 | 2.600 | 2.400 | 3.200 | 2.600 |
| C5 | 3.200 | 3.800 | 3.800 | 3.000 | 0.000 | 3.400 | 2.600 | 2.200 | 3.600 | 3.000 | 2.800 | 2.600 | 1.800 | 2.800 | 2.400 | 2.800 | 2.200 |
| C6 | 2.800 | 3.400 | 3.400 | 3.400 | 3.200 | 0.000 | 3.000 | 2.800 | 3.600 | 3.000 | 3.000 | 2.800 | 2.200 | 3.000 | 3.200 | 3.000 | 2.600 |
| C7 | 2.400 | 2.800 | 2.600 | 2.400 | 2.400 | 2.800 | 0.000 | 3.000 | 2.800 | 2.800 | 3.000 | 2.800 | 2.600 | 2.600 | 2.800 | 2.600 | 2.600 |
| C8 | 2.800 | 3.000 | 3.200 | 3.400 | 3.200 | 3.400 | 3.400 | 0.000 | 3.400 | 3.000 | 3.800 | 3.600 | 3.600 | 3.600 | 3.600 | 3.200 | 3.200 |
| C9 | 3.200 | 3.600 | 3.800 | 3.600 | 3.800 | 3.600 | 3.000 | 3.000 | 0.000 | 3.600 | 3.000 | 2.800 | 3.200 | 2.600 | 3.400 | 3.400 | 3.400 |
| C10 | 2.600 | 3.000 | 3.200 | 2.800 | 2.800 | 3.200 | 2.400 | 2.200 | 3.000 | 0.000 | 3.200 | 2.400 | 2.600 | 2.600 | 2.800 | 3.000 | 2.800 |
| C11 | 2.400 | 3.200 | 2.800 | 3.000 | 2.600 | 3.200 | 3.000 | 3.000 | 2.800 | 2.800 | 0.000 | 2.800 | 2.800 | 2.600 | 2.600 | 2.800 | 2.600 |
| C12 | 2.400 | 2.400 | 2.600 | 2.800 | 2.600 | 2.600 | 2.400 | 2.800 | 2.600 | 2.400 | 2.600 | 0.000 | 2.600 | 1.800 | 2.000 | 2.000 | 2.000 |
| C13 | 2.000 | 2.000 | 2.000 | 2.200 | 2.000 | 2.400 | 2.800 | 3.200 | 3.200 | 3.000 | 3.000 | 2.800 | 0.000 | 2.800 | 2.600 | 2.400 | 2.200 |
| C14 | 2.000 | 2.600 | 2.200 | 2.600 | 2.600 | 2.400 | 3.000 | 3.400 | 2.800 | 2.600 | 3.000 | 2.000 | 3.200 | 0.000 | 2.200 | 2.400 | 2.000 |
| C15 | 2.200 | 2.600 | 2.800 | 3.000 | 2.800 | 3.000 | 2.600 | 2.600 | 3.200 | 2.800 | 3.200 | 2.400 | 2.600 | 2.600 | 0.000 | 2.400 | 2.200 |
| C16 | 2.000 | 2.800 | 2.600 | 3.200 | 3.000 | 3.000 | 2.200 | 2.800 | 3.200 | 2.800 | 3.000 | 2.800 | 2.800 | 3.200 | 3.000 | 0.000 | 3.400 |
| C17 | 2.400 | 2.200 | 3.400 | 3.200 | 3.000 | 3.200 | 2.600 | 2.800 | 3.400 | 2.800 | 2.600 | 2.400 | 2.200 | 2.600 | 2.200 | 3.600 | 0.000 |
| C1 | C2 | C3 | C4 | C5 | C6 | C7 | C8 | C9 | C10 | C11 | C12 | C13 | C14 | C15 | C16 | C17 | |
|---|---|---|---|---|---|---|---|---|---|---|---|---|---|---|---|---|---|
| C1 | 0.000 | 0.060 | 0.064 | 0.064 | 0.064 | 0.052 | 0.041 | 0.045 | 0.060 | 0.049 | 0.060 | 0.056 | 0.034 | 0.030 | 0.041 | 0.052 | 0.049 |
| C2 | 0.060 | 0.000 | 0.064 | 0.064 | 0.064 | 0.064 | 0.052 | 0.045 | 0.056 | 0.052 | 0.049 | 0.052 | 0.045 | 0.045 | 0.041 | 0.052 | 0.045 |
| C3 | 0.060 | 0.075 | 0.000 | 0.071 | 0.064 | 0.067 | 0.052 | 0.049 | 0.067 | 0.060 | 0.049 | 0.049 | 0.037 | 0.045 | 0.045 | 0.052 | 0.049 |
| C4 | 0.060 | 0.071 | 0.075 | 0.000 | 0.060 | 0.064 | 0.052 | 0.049 | 0.067 | 0.045 | 0.056 | 0.056 | 0.045 | 0.049 | 0.045 | 0.060 | 0.049 |
| C5 | 0.060 | 0.071 | 0.071 | 0.056 | 0.000 | 0.064 | 0.049 | 0.041 | 0.067 | 0.056 | 0.052 | 0.049 | 0.034 | 0.052 | 0.045 | 0.052 | 0.041 |
| C6 | 0.052 | 0.064 | 0.064 | 0.064 | 0.060 | 0.000 | 0.056 | 0.052 | 0.067 | 0.056 | 0.056 | 0.052 | 0.041 | 0.056 | 0.060 | 0.056 | 0.049 |
| C7 | 0.045 | 0.052 | 0.049 | 0.045 | 0.045 | 0.052 | 0.000 | 0.056 | 0.052 | 0.052 | 0.056 | 0.052 | 0.049 | 0.049 | 0.052 | 0.049 | 0.049 |
| C8 | 0.052 | 0.056 | 0.060 | 0.064 | 0.060 | 0.064 | 0.064 | 0.000 | 0.064 | 0.056 | 0.071 | 0.067 | 0.067 | 0.067 | 0.067 | 0.060 | 0.060 |
| C9 | 0.060 | 0.067 | 0.071 | 0.067 | 0.071 | 0.067 | 0.056 | 0.056 | 0.000 | 0.067 | 0.056 | 0.052 | 0.060 | 0.049 | 0.064 | 0.064 | 0.064 |
| C10 | 0.049 | 0.056 | 0.060 | 0.052 | 0.052 | 0.060 | 0.045 | 0.041 | 0.056 | 0.000 | 0.060 | 0.045 | 0.049 | 0.049 | 0.052 | 0.056 | 0.052 |
| C11 | 0.045 | 0.060 | 0.052 | 0.056 | 0.049 | 0.060 | 0.056 | 0.056 | 0.052 | 0.052 | 0.000 | 0.052 | 0.052 | 0.049 | 0.049 | 0.052 | 0.049 |
| C12 | 0.045 | 0.045 | 0.049 | 0.052 | 0.049 | 0.049 | 0.045 | 0.052 | 0.049 | 0.045 | 0.049 | 0.000 | 0.049 | 0.034 | 0.037 | 0.037 | 0.037 |
| C13 | 0.037 | 0.037 | 0.037 | 0.041 | 0.037 | 0.045 | 0.052 | 0.060 | 0.060 | 0.056 | 0.056 | 0.052 | 0.000 | 0.052 | 0.049 | 0.045 | 0.041 |
| C14 | 0.037 | 0.049 | 0.041 | 0.049 | 0.049 | 0.045 | 0.056 | 0.064 | 0.052 | 0.049 | 0.056 | 0.037 | 0.060 | 0.000 | 0.041 | 0.045 | 0.037 |
| C15 | 0.041 | 0.049 | 0.052 | 0.056 | 0.052 | 0.056 | 0.049 | 0.049 | 0.060 | 0.052 | 0.060 | 0.045 | 0.049 | 0.049 | 0.000 | 0.045 | 0.041 |
| C16 | 0.037 | 0.052 | 0.049 | 0.060 | 0.056 | 0.056 | 0.041 | 0.052 | 0.060 | 0.052 | 0.056 | 0.052 | 0.052 | 0.060 | 0.056 | 0.000 | 0.064 |
| C17 | 0.045 | 0.041 | 0.064 | 0.060 | 0.056 | 0.060 | 0.049 | 0.052 | 0.064 | 0.052 | 0.049 | 0.045 | 0.041 | 0.049 | 0.041 | 0.067 | 0.000 |
| C1 | C2 | C3 | C4 | C5 | C6 | C7 | C8 | C9 | C10 | C11 | C12 | C13 | C14 | C15 | C16 | C17 | |
|---|---|---|---|---|---|---|---|---|---|---|---|---|---|---|---|---|---|
| C1 | 0.267 | 0.362 | 0.369 | 0.368 | 0.358 | 0.360 | 0.313 | 0.316 | 0.374 | 0.332 | 0.353 | 0.327 | 0.288 | 0.292 | 0.304 | 0.334 | 0.308 |
| C2 | 0.331 | 0.315 | 0.379 | 0.378 | 0.367 | 0.379 | 0.332 | 0.325 | 0.381 | 0.345 | 0.352 | 0.332 | 0.307 | 0.314 | 0.312 | 0.343 | 0.312 |
| C3 | 0.345 | 0.401 | 0.335 | 0.400 | 0.383 | 0.399 | 0.346 | 0.342 | 0.407 | 0.366 | 0.367 | 0.343 | 0.313 | 0.327 | 0.329 | 0.357 | 0.329 |
| C4 | 0.348 | 0.400 | 0.408 | 0.337 | 0.382 | 0.398 | 0.349 | 0.346 | 0.411 | 0.356 | 0.377 | 0.352 | 0.323 | 0.333 | 0.332 | 0.367 | 0.332 |
| C5 | 0.335 | 0.386 | 0.390 | 0.376 | 0.312 | 0.384 | 0.333 | 0.326 | 0.396 | 0.352 | 0.360 | 0.333 | 0.300 | 0.324 | 0.320 | 0.347 | 0.313 |
| C6 | 0.342 | 0.394 | 0.399 | 0.398 | 0.383 | 0.339 | 0.353 | 0.350 | 0.412 | 0.367 | 0.378 | 0.350 | 0.320 | 0.341 | 0.346 | 0.364 | 0.333 |
| C7 | 0.303 | 0.347 | 0.348 | 0.344 | 0.334 | 0.352 | 0.268 | 0.321 | 0.360 | 0.329 | 0.343 | 0.317 | 0.297 | 0.303 | 0.308 | 0.324 | 0.302 |
| C8 | 0.368 | 0.417 | 0.425 | 0.428 | 0.412 | 0.430 | 0.388 | 0.328 | 0.440 | 0.395 | 0.422 | 0.391 | 0.370 | 0.378 | 0.380 | 0.396 | 0.369 |
| C9 | 0.374 | 0.427 | 0.435 | 0.431 | 0.422 | 0.433 | 0.380 | 0.380 | 0.379 | 0.404 | 0.407 | 0.376 | 0.362 | 0.360 | 0.375 | 0.399 | 0.371 |
| C10 | 0.316 | 0.362 | 0.369 | 0.362 | 0.351 | 0.370 | 0.320 | 0.317 | 0.375 | 0.290 | 0.357 | 0.320 | 0.306 | 0.312 | 0.318 | 0.341 | 0.314 |
| C11 | 0.315 | 0.368 | 0.365 | 0.368 | 0.350 | 0.372 | 0.333 | 0.333 | 0.374 | 0.342 | 0.303 | 0.329 | 0.312 | 0.315 | 0.317 | 0.340 | 0.313 |
| C12 | 0.278 | 0.313 | 0.320 | 0.322 | 0.310 | 0.320 | 0.285 | 0.292 | 0.327 | 0.296 | 0.309 | 0.242 | 0.273 | 0.265 | 0.270 | 0.287 | 0.267 |
| C13 | 0.282 | 0.318 | 0.321 | 0.324 | 0.311 | 0.329 | 0.303 | 0.310 | 0.350 | 0.318 | 0.328 | 0.303 | 0.238 | 0.293 | 0.292 | 0.306 | 0.281 |
| C14 | 0.285 | 0.331 | 0.328 | 0.334 | 0.325 | 0.333 | 0.310 | 0.317 | 0.347 | 0.314 | 0.331 | 0.293 | 0.297 | 0.247 | 0.288 | 0.309 | 0.281 |
| C15 | 0.300 | 0.345 | 0.352 | 0.355 | 0.341 | 0.356 | 0.315 | 0.315 | 0.368 | 0.330 | 0.347 | 0.311 | 0.298 | 0.304 | 0.259 | 0.321 | 0.295 |
| C16 | 0.312 | 0.366 | 0.367 | 0.376 | 0.362 | 0.374 | 0.324 | 0.334 | 0.386 | 0.347 | 0.361 | 0.334 | 0.316 | 0.330 | 0.328 | 0.295 | 0.331 |
| C17 | 0.314 | 0.350 | 0.374 | 0.370 | 0.356 | 0.372 | 0.325 | 0.328 | 0.384 | 0.341 | 0.348 | 0.322 | 0.300 | 0.314 | 0.309 | 0.352 | 0.266 |
| Dimension | Criteria | ri | ci | ri + ci | Rank | ri − ci | Rank |
|---|---|---|---|---|---|---|---|
| Environment (D1) | Environmental permits and reporting (C1) | 5.624 | 5.414 | 11.039 | 13 | 0.210 | 4 |
| Pollution prevention and resource reduction (C2) | 5.804 | 6.203 | 12.006 | 6 | −0.399 | 16 | |
| Hazardous substances (C3) | 6.089 | 6.285 | 12.374 | 4 | −0.196 | 14 | |
| Wastewater and solid waste (C4) | 6.149 | 6.272 | 12.422 | 3 | −0.123 | 10 | |
| Air emissions (C5) | 5.887 | 6.059 | 11.946 | 7 | −0.173 | 13 | |
| Product content restrictions (C6) | 6.170 | 6.300 | 12.470 | 2 | −0.131 | 12 | |
| Management system (D2) | Company commitment (C7) | 5.499 | 5.576 | 11.075 | 11 | −0.077 | 8 |
| Management accountability and responsibility (C8) | 6.737 | 5.580 | 12.317 | 5 | 1.157 | 1 | |
| Legal and customer requirements (C9) | 6.715 | 6.472 | 13.187 | 1 | 0.243 | 3 | |
| Risk assessment and risk management (C10) | 5.699 | 5.823 | 11.522 | 10 | −0.125 | 11 | |
| Performance objectives with implementation plan and measures (C11) | 5.747 | 6.042 | 11.789 | 8 | −0.296 | 15 | |
| Training (C12) | 4.977 | 5.574 | 10.551 | 16 | −0.598 | 17 | |
| Communication (C13) | 5.209 | 5.219 | 10.428 | 17 | −0.010 | 7 | |
| Worker feedback and participation (C14) | 5.268 | 5.353 | 10.621 | 15 | −0.085 | 9 | |
| Audits and assessments (C15) | 5.513 | 5.387 | 10.900 | 14 | 0.127 | 5 | |
| Corrective action process (C16) | 5.843 | 5.779 | 11.622 | 9 | 0.064 | 6 | |
| Documentation and records (C17) | 5.727 | 5.317 | 11.044 | 12 | 0.410 | 2 |
4.3. Finding the Influential Weight of Criteria Using the DANP
| C1 | C2 | C3 | C4 | C5 | C6 | C7 | C8 | C9 | C10 | C11 | C12 | C13 | C14 | C15 | C16 | C17 | |
|---|---|---|---|---|---|---|---|---|---|---|---|---|---|---|---|---|---|
| C1 | 0.267 | 0.362 | 0.369 | 0.368 | 0.358 | 0.360 | 2.084 | 0.313 | 0.316 | 0.374 | 0.332 | 0.353 | 0.327 | 0.288 | 0.292 | 0.304 | 0.334 |
| C2 | 0.331 | 0.315 | 0.379 | 0.378 | 0.367 | 0.379 | 2.149 | 0.332 | 0.325 | 0.381 | 0.345 | 0.352 | 0.332 | 0.307 | 0.314 | 0.312 | 0.343 |
| C3 | 0.345 | 0.401 | 0.335 | 0.400 | 0.383 | 0.399 | 2.262 | 0.346 | 0.342 | 0.407 | 0.366 | 0.367 | 0.343 | 0.313 | 0.327 | 0.329 | 0.357 |
| C4 | 0.348 | 0.400 | 0.408 | 0.337 | 0.382 | 0.398 | 2.273 | 0.349 | 0.346 | 0.411 | 0.356 | 0.377 | 0.352 | 0.323 | 0.333 | 0.332 | 0.367 |
| C5 | 0.335 | 0.386 | 0.390 | 0.376 | 0.312 | 0.384 | 2.184 | 0.333 | 0.326 | 0.396 | 0.352 | 0.360 | 0.333 | 0.300 | 0.324 | 0.320 | 0.347 |
| C6 | 0.342 | 0.394 | 0.399 | 0.398 | 0.383 | 0.339 | 2.255 | 0.353 | 0.350 | 0.412 | 0.367 | 0.378 | 0.350 | 0.320 | 0.341 | 0.346 | 0.364 |
| C7 | 0.303 | 0.347 | 0.348 | 0.344 | 0.334 | 0.352 | 2.027 | 0.268 | 0.321 | 0.360 | 0.329 | 0.343 | 0.317 | 0.297 | 0.303 | 0.308 | 0.324 |
| C8 | 0.368 | 0.417 | 0.425 | 0.428 | 0.412 | 0.430 | 2.481 | 0.388 | 0.328 | 0.440 | 0.395 | 0.422 | 0.391 | 0.370 | 0.378 | 0.380 | 0.396 |
| C9 | 0.374 | 0.427 | 0.435 | 0.431 | 0.422 | 0.433 | 2.522 | 0.380 | 0.380 | 0.379 | 0.404 | 0.407 | 0.376 | 0.362 | 0.360 | 0.375 | 0.399 |
| C10 | 0.316 | 0.362 | 0.369 | 0.362 | 0.351 | 0.370 | 2.130 | 0.320 | 0.317 | 0.375 | 0.290 | 0.357 | 0.320 | 0.306 | 0.312 | 0.318 | 0.341 |
| C11 | 0.315 | 0.368 | 0.365 | 0.368 | 0.350 | 0.372 | 2.137 | 0.333 | 0.333 | 0.374 | 0.342 | 0.303 | 0.329 | 0.312 | 0.315 | 0.317 | 0.340 |
| C12 | 0.278 | 0.313 | 0.320 | 0.322 | 0.310 | 0.320 | 1.863 | 0.285 | 0.292 | 0.327 | 0.296 | 0.309 | 0.242 | 0.273 | 0.265 | 0.270 | 0.287 |
| C13 | 0.282 | 0.318 | 0.321 | 0.324 | 0.311 | 0.329 | 1.886 | 0.303 | 0.310 | 0.350 | 0.318 | 0.328 | 0.303 | 0.238 | 0.293 | 0.292 | 0.306 |
| C14 | 0.285 | 0.331 | 0.328 | 0.334 | 0.325 | 0.333 | 1.936 | 0.310 | 0.317 | 0.347 | 0.314 | 0.331 | 0.293 | 0.297 | 0.247 | 0.288 | 0.309 |
| C15 | 0.300 | 0.345 | 0.352 | 0.355 | 0.341 | 0.356 | 2.050 | 0.315 | 0.315 | 0.368 | 0.330 | 0.347 | 0.311 | 0.298 | 0.304 | 0.259 | 0.321 |
| C16 | 0.312 | 0.366 | 0.367 | 0.376 | 0.362 | 0.374 | 2.158 | 0.324 | 0.334 | 0.386 | 0.347 | 0.361 | 0.334 | 0.316 | 0.330 | 0.328 | 0.295 |
| C17 | 0.314 | 0.350 | 0.374 | 0.370 | 0.356 | 0.372 | 2.137 | 0.325 | 0.328 | 0.384 | 0.341 | 0.348 | 0.322 | 0.300 | 0.314 | 0.309 | 0.352 |
| C1 | C2 | C3 | C4 | C5 | C6 | C7 | C8 | C9 | C10 | C11 | C12 | C13 | C14 | C15 | C16 | C17 | |
|---|---|---|---|---|---|---|---|---|---|---|---|---|---|---|---|---|---|
| C1 | 0.047 | 0.057 | 0.057 | 0.057 | 0.057 | 0.055 | 0.055 | 0.055 | 0.056 | 0.055 | 0.055 | 0.056 | 0.054 | 0.054 | 0.054 | 0.053 | 0.055 |
| C2 | 0.064 | 0.054 | 0.066 | 0.065 | 0.066 | 0.064 | 0.063 | 0.062 | 0.064 | 0.064 | 0.064 | 0.063 | 0.061 | 0.063 | 0.063 | 0.063 | 0.061 |
| C3 | 0.066 | 0.065 | 0.055 | 0.066 | 0.066 | 0.065 | 0.063 | 0.063 | 0.065 | 0.065 | 0.063 | 0.064 | 0.062 | 0.062 | 0.064 | 0.063 | 0.065 |
| C4 | 0.065 | 0.065 | 0.066 | 0.055 | 0.064 | 0.064 | 0.063 | 0.064 | 0.064 | 0.064 | 0.064 | 0.065 | 0.062 | 0.063 | 0.064 | 0.064 | 0.065 |
| C5 | 0.064 | 0.063 | 0.063 | 0.062 | 0.053 | 0.062 | 0.061 | 0.061 | 0.063 | 0.062 | 0.061 | 0.062 | 0.060 | 0.062 | 0.062 | 0.062 | 0.062 |
| C6 | 0.064 | 0.065 | 0.065 | 0.065 | 0.065 | 0.055 | 0.064 | 0.064 | 0.064 | 0.065 | 0.065 | 0.064 | 0.063 | 0.063 | 0.065 | 0.064 | 0.065 |
| C7 | 0.056 | 0.057 | 0.057 | 0.057 | 0.057 | 0.057 | 0.049 | 0.058 | 0.057 | 0.056 | 0.058 | 0.057 | 0.058 | 0.059 | 0.057 | 0.055 | 0.057 |
| C8 | 0.056 | 0.056 | 0.056 | 0.056 | 0.055 | 0.057 | 0.058 | 0.049 | 0.057 | 0.056 | 0.058 | 0.059 | 0.060 | 0.060 | 0.057 | 0.057 | 0.057 |
| C9 | 0.067 | 0.066 | 0.067 | 0.067 | 0.067 | 0.067 | 0.065 | 0.065 | 0.057 | 0.066 | 0.065 | 0.066 | 0.067 | 0.066 | 0.067 | 0.066 | 0.067 |
| C10 | 0.059 | 0.059 | 0.060 | 0.058 | 0.060 | 0.059 | 0.060 | 0.059 | 0.060 | 0.051 | 0.059 | 0.059 | 0.061 | 0.060 | 0.060 | 0.059 | 0.060 |
| C11 | 0.063 | 0.061 | 0.060 | 0.061 | 0.061 | 0.061 | 0.062 | 0.063 | 0.061 | 0.063 | 0.053 | 0.062 | 0.063 | 0.063 | 0.063 | 0.062 | 0.061 |
| C12 | 0.058 | 0.057 | 0.056 | 0.057 | 0.056 | 0.057 | 0.058 | 0.058 | 0.056 | 0.056 | 0.057 | 0.049 | 0.058 | 0.056 | 0.056 | 0.057 | 0.056 |
| C13 | 0.051 | 0.053 | 0.051 | 0.052 | 0.051 | 0.052 | 0.054 | 0.055 | 0.054 | 0.054 | 0.054 | 0.055 | 0.046 | 0.056 | 0.054 | 0.054 | 0.052 |
| C14 | 0.052 | 0.054 | 0.054 | 0.054 | 0.055 | 0.055 | 0.055 | 0.056 | 0.054 | 0.055 | 0.055 | 0.053 | 0.056 | 0.047 | 0.055 | 0.056 | 0.055 |
| C15 | 0.054 | 0.054 | 0.054 | 0.054 | 0.054 | 0.056 | 0.056 | 0.056 | 0.056 | 0.056 | 0.055 | 0.054 | 0.056 | 0.055 | 0.047 | 0.056 | 0.054 |
| C16 | 0.059 | 0.059 | 0.059 | 0.060 | 0.059 | 0.059 | 0.059 | 0.059 | 0.059 | 0.060 | 0.059 | 0.058 | 0.059 | 0.059 | 0.058 | 0.050 | 0.062 |
| C17 | 0.055 | 0.054 | 0.054 | 0.054 | 0.053 | 0.054 | 0.055 | 0.055 | 0.055 | 0.055 | 0.054 | 0.054 | 0.054 | 0.053 | 0.054 | 0.057 | 0.046 |
| C1 | C2 | C3 | C4 | C5 | C6 | C7 | C8 | C9 | C10 | C11 | C12 | C13 | C14 | C15 | C16 | C17 | |
|---|---|---|---|---|---|---|---|---|---|---|---|---|---|---|---|---|---|
| C1 | 0.055 | 0.055 | 0.055 | 0.055 | 0.055 | 0.055 | 0.055 | 0.055 | 0.055 | 0.055 | 0.055 | 0.055 | 0.055 | 0.055 | 0.055 | 0.055 | 0.055 |
| C2 | 0.063 | 0.063 | 0.063 | 0.063 | 0.063 | 0.063 | 0.063 | 0.063 | 0.063 | 0.063 | 0.063 | 0.063 | 0.063 | 0.063 | 0.063 | 0.063 | 0.063 |
| C3 | 0.064 | 0.064 | 0.064 | 0.064 | 0.064 | 0.064 | 0.064 | 0.064 | 0.064 | 0.064 | 0.064 | 0.064 | 0.064 | 0.064 | 0.064 | 0.064 | 0.064 |
| C4 | 0.064 | 0.064 | 0.064 | 0.064 | 0.064 | 0.064 | 0.064 | 0.064 | 0.064 | 0.064 | 0.064 | 0.064 | 0.064 | 0.064 | 0.064 | 0.064 | 0.064 |
| C5 | 0.061 | 0.061 | 0.061 | 0.061 | 0.061 | 0.061 | 0.061 | 0.061 | 0.061 | 0.061 | 0.061 | 0.061 | 0.061 | 0.061 | 0.061 | 0.061 | 0.061 |
| C6 | 0.064 | 0.064 | 0.064 | 0.064 | 0.064 | 0.064 | 0.064 | 0.064 | 0.064 | 0.064 | 0.064 | 0.064 | 0.064 | 0.064 | 0.064 | 0.064 | 0.064 |
| C7 | 0.057 | 0.057 | 0.057 | 0.057 | 0.057 | 0.057 | 0.057 | 0.057 | 0.057 | 0.057 | 0.057 | 0.057 | 0.057 | 0.057 | 0.057 | 0.057 | 0.057 |
| C8 | 0.057 | 0.057 | 0.057 | 0.057 | 0.057 | 0.057 | 0.057 | 0.057 | 0.057 | 0.057 | 0.057 | 0.057 | 0.057 | 0.057 | 0.057 | 0.057 | 0.057 |
| C9 | 0.066 | 0.066 | 0.066 | 0.066 | 0.066 | 0.066 | 0.066 | 0.066 | 0.066 | 0.066 | 0.066 | 0.066 | 0.066 | 0.066 | 0.066 | 0.066 | 0.066 |
| C10 | 0.059 | 0.059 | 0.059 | 0.059 | 0.059 | 0.059 | 0.059 | 0.059 | 0.059 | 0.059 | 0.059 | 0.059 | 0.059 | 0.059 | 0.059 | 0.059 | 0.059 |
| C11 | 0.061 | 0.061 | 0.061 | 0.061 | 0.061 | 0.061 | 0.061 | 0.061 | 0.061 | 0.061 | 0.061 | 0.061 | 0.061 | 0.061 | 0.061 | 0.061 | 0.061 |
| C12 | 0.056 | 0.056 | 0.056 | 0.056 | 0.056 | 0.056 | 0.056 | 0.056 | 0.056 | 0.056 | 0.056 | 0.056 | 0.056 | 0.056 | 0.056 | 0.056 | 0.056 |
| C13 | 0.053 | 0.053 | 0.053 | 0.053 | 0.053 | 0.053 | 0.053 | 0.053 | 0.053 | 0.053 | 0.053 | 0.053 | 0.053 | 0.053 | 0.053 | 0.053 | 0.053 |
| C14 | 0.054 | 0.054 | 0.054 | 0.054 | 0.054 | 0.054 | 0.054 | 0.054 | 0.054 | 0.054 | 0.054 | 0.054 | 0.054 | 0.054 | 0.054 | 0.054 | 0.054 |
| C15 | 0.055 | 0.055 | 0.055 | 0.055 | 0.055 | 0.055 | 0.055 | 0.055 | 0.055 | 0.055 | 0.055 | 0.055 | 0.055 | 0.055 | 0.055 | 0.055 | 0.055 |
| C16 | 0.059 | 0.059 | 0.059 | 0.059 | 0.059 | 0.059 | 0.059 | 0.059 | 0.059 | 0.059 | 0.059 | 0.059 | 0.059 | 0.059 | 0.059 | 0.059 | 0.059 |
| C17 | 0.054 | 0.054 | 0.054 | 0.054 | 0.054 | 0.054 | 0.054 | 0.054 | 0.054 | 0.054 | 0.054 | 0.054 | 0.054 | 0.054 | 0.054 | 0.054 | 0.054 |
| Dimension and Criteria | Local Weights | Global Weights | Rank |
|---|---|---|---|
| D1 | 0.395 | 2 | |
| C1 | 0.055 | 0.148524 | 6 |
| C2 | 0.063 | 0.170006 | 4 |
| C3 | 0.064 | 0.172141 | 1 |
| C4 | 0.064 | 0.171497 | 3 |
| C5 | 0.061 | 0.165730 | 5 |
| C6 | 0.064 | 0.172103 | 2 |
| D2 | 0.605 | 1 | |
| C7 | 0.057 | 0.089744 | 12 |
| C8 | 0.057 | 0.090071 | 11 |
| C9 | 0.066 | 0.104083 | 7 |
| C10 | 0.059 | 0.093706 | 9 |
| C11 | 0.061 | 0.097216 | 8 |
| C12 | 0.056 | 0.089565 | 13 |
| C13 | 0.053 | 0.084159 | 17 |
| C14 | 0.054 | 0.086153 | 15 |
| C15 | 0.055 | 0.086726 | 14 |
| C16 | 0.059 | 0.092954 | 10 |
| C17 | 0.054 | 0.085624 | 16 |
4.4. Evaluating the Green Performance of Suppliers Using VIKOR
| Dimension | Criteria | Supplier 1 | Supplier 2 | Supplier 3 | Supplier 4 | Supplier 5 |
|---|---|---|---|---|---|---|
| D1 | C1 | 0.00000 | 0.05865 | 0.00000 | 0.00000 | 0.05865 |
| C2 | 0.00000 | 0.06713 | 0.00000 | 0.03357 | 0.03357 | |
| C3 | 0.00000 | 0.06797 | 0.00000 | 0.03399 | 0.06797 | |
| C4 | 0.00000 | 0.06772 | 0.00000 | 0.00000 | 0.06772 | |
| C5 | 0.00000 | 0.06544 | 0.00000 | 0.00000 | 0.06544 | |
| C6 | 0.00000 | 0.06796 | 0.00000 | 0.00000 | 0.06796 | |
| D2 | C7 | 0.00000 | 0.05431 | 0.00000 | 0.02715 | 0.05431 |
| C8 | 0.00000 | 0.05450 | 0.00000 | 0.02725 | 0.05450 | |
| C9 | 0.00000 | 0.06298 | 0.00000 | 0.03149 | 0.06298 | |
| C10 | 0.02932 | 0.05670 | 0.00000 | 0.02835 | 0.05670 | |
| C11 | 0.00000 | 0.05883 | 0.00000 | 0.02941 | 0.05883 | |
| C12 | 0.00000 | 0.05420 | 0.00000 | 0.02710 | 0.05420 | |
| C13 | 0.00000 | 0.05093 | 0.00000 | 0.02546 | 0.05093 | |
| C14 | 0.00000 | 0.05213 | 0.00000 | 0.02607 | 0.05213 | |
| C15 | 0.00000 | 0.05248 | 0.00000 | 0.02624 | 0.05248 | |
| C16 | 0.00000 | 0.05625 | 0.00000 | 0.02812 | 0.05625 | |
| C17 | 0.00000 | 0.05181 | 0.00000 | 0.02591 | 0.05181 | |
| Sj | 0.02932 (2) | 1.00000(5) | 0.00000(1) | 0.37012 (3) | 0.96643 (4) | |
| Rj | 0.02932 (2) | 0.06797(5) | 0.00000(1) | 0.03399 (3) | 0.06797 (4) | |
| Qj | 0.230362 (2) | 1.00000(5) | 0.00000(1) | 0.435058 (3) | 0.983217 (4) | |
5. Discussion
6. Conclusions and Future Research
Author Contributions
Conflicts of Interest
References
- Sheu, J.B.; Chou, Y.H.; Hu, C.C. An integrated logistics operational model for green-supply chain Management. Transp. Res. Part E Logist. Transp. Rev. 2005, 41, 287–313. [Google Scholar] [CrossRef]
- Rao, P. Greening the supply chain: A new initiative in south East Asia. Int. J. Oper. Prod. Manag. 2002, 22, 632–655. [Google Scholar] [CrossRef]
- Lamming, R.; Hampson, J. The environment as a supply chain management issue. Br. J. Manag. 1996, 7 (Suppl. S1), S45–S62. [Google Scholar] [CrossRef]
- Zhu, Q.; Geng, Y. Integrating environmental issues into supplier selection and management: A study of large and medium-sized state-owned enterprises in China. Greener Manag. Int. 2001, 35, 27–40. [Google Scholar]
- Handfield, R.; Walton, S.V.; Sroufe, R.; Melnyk, S.A. Applying environmental criteria to supplier assessment: A study in the application of the analytical hierarchy process. Eur. J. Oper. Res. 2002, 141, 70–87. [Google Scholar] [CrossRef]
- Humphreys, P.; Wong, R.; Chan, F. Integrating environmental criteria into the supplier selection process. J. Mater. Process. Technol. 2003, 138, 349–356. [Google Scholar] [CrossRef]
- Humphreys, P.K.; McIvor, R.; Chan, F.T.S. Using case-based reasoning to evaluate supplier environmental management performance. Expert Syst. Appl. 2003, 25, 141–153. [Google Scholar] [CrossRef]
- Rao, P. The greening of suppliers-in the South East Asian context. J. Clean Prod. 2005, 13, 935–945. [Google Scholar] [CrossRef]
- Lu, L.Y.Y.; Wu, C.H.; Kuo, T.C. Environmental principles applicable to green supplier evaluation by using multi-objective decision analysis. Int. J. Prod. Res. 2007, 45, 4317–4331. [Google Scholar] [CrossRef]
- Hsu, C.W.; Hu, A.H. Applying hazardous substance management to supplier selection using analytic network process. J. Clean Prod. 2009, 17, 255–264. [Google Scholar] [CrossRef]
- Lee, A.H.; Kang, H.Y.; Hsu, C.F.; Hung, H.C. A green supplier selection model for high-tech industry. Expert Syst. Appl. 2009, 36, 7917–7927. [Google Scholar] [CrossRef]
- Bai, C.; Sarkis, J. Green supplier development: Analytical evaluation using rough set theory. J. Clean Prod. 2010, 8, 1200–1210. [Google Scholar] [CrossRef]
- Kuo, R.J.; Wang, Y.C.; Tien, F.C. Integration of artificial neural network and MADA methods for green supplier selection. J. Clean Prod. 2010, 18, 1161–1170. [Google Scholar] [CrossRef]
- Büyüközkan, G. An integrated fuzzy multi-criteria group decision-making approach for green supplier evaluation. Int. J. Prod. Res. 2012, 50, 2892–2909. [Google Scholar] [CrossRef]
- Hsu, C.W.; Kuo, T.C.; Chen, S.H.; Hu, A.H. Using DEMATEL to develop a carbon management model of supplier selection in green supply chain management. J. Clean Prod. 2013, 56, 164–172. [Google Scholar] [CrossRef]
- Shen, L.; Olfat, L.; Govindan, K.; Khodaverdi, R.; Diabat, A. A fuzzy multi criteria approach for evaluating green supplier’s performance in green supply chain with linguistic preferences. Resour. Conserv. Recycl. 2013, 74, 170–179. [Google Scholar] [CrossRef]
- Kannan, D.; Khodaverdi, R.; Olfat, L.; Jafarian, A.; Diabat, A. Integrated fuzzy multi criteria decision making method and multi-objective programming approach for supplier selection and order allocation in a green supply chain. J. Clean Prod. 2013, 47, 355–367. [Google Scholar] [CrossRef]
- Genovese, A.; Lenny Koh, S.C.; Bruno, G.; Esposito, E. Greener supplier selection: State of the art and some empirical evidence. Int. J. Prod. Res. 2013, 51, 2868–2886. [Google Scholar] [CrossRef]
- Huang, S.; Keskar, H. Comprehensive and configurable metrics for supplier selection. Int. J. Prod. Econ. 2007, 105, 510–523. [Google Scholar] [CrossRef]
- Liao, Z.; Rittscher, J. A multi-objective supplier selection model under stochastic demand conditions. Int. J. Prod. Econ. 2007, 105, 150–159. [Google Scholar] [CrossRef]
- Gencer, C.; Gürpinar, D. Analytic network process in supplier selection: A case study in an electronic firm. Appl. Math. Model. 2007, 31, 2475–2486. [Google Scholar] [CrossRef]
- Zhu, Q.; Dou, Y.; Sarkis, Y. A portfolio-based analysis for green supplier management using the analytical network process. Supply Chain Manag. 2010, 15, 306–319. [Google Scholar] [CrossRef]
- Pang, B.; Bai, S. An integrated Fuzzy synthetic evaluation approach for supplier selection based on analytic network process. J. Intell. Manuf. 2013, 24, 163–174. [Google Scholar] [CrossRef]
- Hsu, C.W.; Kuo, R.J.; Chiou, C.Y. A multi-criteria decision making approach for evaluating carbon performance of suppliers in the electronics industry. Int. J. Environ. Sci. Technol. 2014, 11, 775–784. [Google Scholar] [CrossRef]
- Ou Yang, Y.P.; Shieh, H.M.; Tzeng, G.H. A novel hybrid MCDM model combined with DEMATEL and ANP with applications. Int. J. Oper. Res. 2008, 5, 160–168. [Google Scholar]
- Chen, L.Y.; Wang, T.C. Optimizing partners’ choice in IS/IT outsourcing projects: The strategic decision of fuzzy VIKOR. Int. J. Prod. Econ. 2009, 120, 233–242. [Google Scholar] [CrossRef]
- Liou, J.J.H.; Chuang, Y.T. Developing a hybrid multi-criteria model for selection of outsourcing providers. Expert Syst. Appl. 2010, 37, 3755–3761. [Google Scholar] [CrossRef]
- Hsu, C.H.; Wang, F.K.; Tzeng, G.H. The best vendor selection for conducting the recycling material based on a hybrid MCDM model combining DANP with VIKOR. Resour. Conserv. Recycl. 2012, 66, 95–111. [Google Scholar] [CrossRef]
- Opricovic, S.; Tzeng, G.H. Extended VIKOR method in comparison with outranking methods. Eur. J. Oper. Res. 2007, 178, 514–529. [Google Scholar] [CrossRef]
- Chiu, W.Y.; Tzeng, G.H.; Li, H.L. A new hybrid MCDM model combining DANP with VIKOR to improve e-store business. Knowl. Based Syst. 2013, 37, 48–61. [Google Scholar] [CrossRef]
- Liu, C.H.; Tzeng, G.H.; Lee, M.H. Improving tourism policy implementation—The use of Hybrid MCDM Models. Tour. Manag. 2012, 33, 413–426. [Google Scholar] [CrossRef]
- Shen, K.Y.; Yan, M.R.; Tzeng, G.H. Combining VIKOR-DANP model for glamor stock selection and stock performance improvement. Knowl. Based Syst. 2014, 58, 86–97. [Google Scholar] [CrossRef]
- Lu, M.T.; Lin, S.W.; Tzeng, G.H. Improving RFID adoption in Taiwan’s healthcare industry based on a DEMATEL technique with a hybrid MCDM model. Decis. Support Syst. 2013, 56, 259–269. [Google Scholar] [CrossRef]
- Wang, Y.L.; Tzeng, G.H. Brand marketing for creating brand value based on a MCDM Model combining DEMATEL with ANP and VIKOR Methods. Expert Syst. Appl. 2012, 39, 5600–5615. [Google Scholar] [CrossRef]
- Ho, W.; Xu, X.; Dey, P.K. Multi-criteria decision making approaches for supplier evaluation and selection: A literature review. Eur. J. Oper. Res. 2010, 202, 16–24. [Google Scholar] [CrossRef]
- Govindan, K.; Rajendran, S.; Sarkis, J.; Murugesan, P. Multi criteria decision making approaches for green supplier evaluation and selection: A literature review. J. Clean Prod. 2013, in press. [Google Scholar]
- Chiou, C.Y.; Hsu, C.W.; Hwang, W.Y. Comparative investigation on green supplier selection of the American, Japanese and Taiwanese electronics industry in China. In Proceedings of the IEEE International Conference on IE&EM, Singapore, Singapore, 8–11 December 2008; pp. 1909–1914.
- Thongchattu, C.; Siripokapirom, S. Green supplier selection consensus by neural network. In Proceedings of the IEEE International Conference on ICMEE, Kyoto, Japan, 1–3 August 2010; pp. 313–316.
- Yan, G. Research on green suppliers’ evaluation based on AHP & Genetic Algorithm. In Proceedings of the IEEE International Conference on SPS, Singapore, Singapore, 15–17 May 2009; pp. 615–619.
- Wen, U.P.; Chi, J.M. Developing green supplier selection procedure: A DEA approach. In Proceedings of the IEEE International Conference on IE&EM, Xiamen, China, 29–31 October 2010; pp. 79–74.
- Li, X.; Zhao, C. Selection of suppliers of vehicle components based on green supply chain. In Proceedings of the IEEE International Conference on IE&EM, Beijing, China, 21–23 October 2009; pp. 1588–1591.
- Shaw, K.; Shankar, R.; Yadav, S.S.; Thakur, L.S. Supplier selection using Fuzzy AHP and Fuzzy multi-objective linear programming for developing low carbon supply chain. Expert Syst. Appl. 2012, 39, 8182–8192. [Google Scholar] [CrossRef]
- Büyüközkan, G.; Çifçi, G. A novel fuzzy multi-criteria decision framework for sustainable supplier selection with incomplete information. Comput. Ind. 2011, 62, 164–174. [Google Scholar] [CrossRef]
- Kuo, R.J.; Lin, Y.J. Supplier selection using analytic network process and data envelopment analysis. Int. J. Prod. Res. 2012, 50, 2852–2863. [Google Scholar] [CrossRef]
- Tuzkaya, G.; Ozgen, A.; Ozgen, D.; Tuzkaya, U.R. Environmental performance evaluation of Suppliers: A hybrid fuzzy multi-criteria decision approach. Int. J. Environ. Sci. Technol. 2009, 6, 477–490. [Google Scholar] [CrossRef]
- Chen, C.C.; Tseng, M.L.; Lin, Y.H.; Lin, Z.S. Implementation of green supply chain management in uncertainty. In Proceedings of the IEEE International Conference on IEEM, Macao, China, 7–10 December 2010; pp. 260–264.
- Grisi, R.M.; Guerra, L.; Naviglio, G. Supplier performance evaluation for green supply chain management. In Business Performance Measurement and Management; Springer: Berlin, Germany, 2010; pp. 149–163. [Google Scholar]
- Humphreys, P.; McCloskey, A.; McIvor, R.; Maguire, L.; Glackin, C. Employing dynamic fuzzy membership functions to assess environmental performance in the supplier selection process. Int. J. Prod. Res. 2006, 44, 2379–2419. [Google Scholar] [CrossRef]
- Zhang, H.C.; Li, J.; Merchant, M.E. Using fuzzy multi-agent decision-making in environmentally conscious supplier management. CIRP Ann. Manuf. Technol. 2003, 52, 385–388. [Google Scholar] [CrossRef]
- Yang, Y.; Wu, L. Extension method for green supplier selection. In Proceedings of the IEEE International Conference on WiCom, Dalian, China, 12–14 October 2008; pp. 1–4.
- Yeh, W.C.; Chuang, M.C. Using multi-objective genetic algorithm for partner selection in green supply chain problems. Expert Syst. Appl. 2011, 38, 4244–4253. [Google Scholar] [CrossRef]
- Bala, A.; Paco Muñoz, P.; Rieradevall, J.; Ysern, P. Experiences with greening suppliers. The Universitat Autònoma de Barcelona. J. Clean Prod. 2008, 16, 1610–1619. [Google Scholar] [CrossRef]
- Awasthi, A.; Chauhan, S.S.; Goyal, S.K. A fuzzy multicriteria approach for evaluating environmental performance of suppliers. Int. J. Prod. Econ. 2010, 126, 370–378. [Google Scholar] [CrossRef]
- Chiou, T.Y.; Chan, H.K.; Lettice, F.; Chung, S.H. The influence of greening the suppliers and green innovation on environmental performance and competitive advantage in Taiwan. Transp. Res. Part E Logist. Transp. Rev. 2011, 47, 822–836. [Google Scholar] [CrossRef]
- Feyziog̃lu, O.; Büyüközkan, G. Evaluation of green suppliers considering decision criteria dependencies. In Multiple Criteria Decision Making for Sustainable Energy and Transportation Systems; Springer: Berlin, Germany, 2010; pp. 145–154. [Google Scholar]
- Large, R.O.; Thomsen, C.G. Drivers of green supply management performance: Evidence from Germany. J. Purch. Supply Manag. 2011, 17, 176–184. [Google Scholar] [CrossRef]
- Krueger, D.A. The ethics of global supply chains in China—Convergences of east and west. J. Bus. Ethics 2008, 79, 113–120. [Google Scholar] [CrossRef]
- Electronic Industry Citizenship Coalition. Electronic Industry Citizenship Coalition® Code of Conduct Version 4.0; Electronic Industry Citizenship Coalition: Alexandria, VA, USA, 2012. [Google Scholar]
- Hewlett-Packard Company (HP). HP 2012 Global Citizenship Summary Report. Available online: http://h20195.www2.hp.com/V2/GetPDF.aspx/c03742928.pdf (accessed on 3 February 2015).
- Chiu, Y.J.; Chen, H.C.; Tzeng, G.H.; Shyu, J.Z. Marketing strategy based on customer behavior for the LCD-TV. Int. J. Manag. Decis. Mak. 2006, 7, 143–165. [Google Scholar]
- Rahman, S.; Subramanian, N. Factors for implementing end-of-life computer recycling Operations in reverse supply chains. Int. J. Prod. Econ. 2012, 140, 239–248. [Google Scholar] [CrossRef]
- Wu, W.W.; Lan, L.W.; Lee, Y.T. Exploring decisive factors affecting an organization’s SaaS adoption: A case study. Int. J. Inf. Manag. 2011, 31, 556–563. [Google Scholar] [CrossRef]
- Hsu, Y.L.; Li, W.C.; Chen, K.W. Structuring critical success factors of airline safety management system using a Hybrid Model. Transp. Res. Part E Logist. Transp. Rev. 2010, 46, 222–235. [Google Scholar] [CrossRef]
- Chen, F.H.; Hsu, T.S.; Tzeng, G.H. A balanced scorecard approach to establish a performance evaluation and relationship model for hot spring hotels based on a hybrid MCDM model Combining DEMATEL and ANP. Int. J. Hosp. Manag. 2011, 30, 908–932. [Google Scholar] [CrossRef]
- Gabus, A.; Fontela, E. World Problems, an Invitation to Further thought within the Framework of DEMATEL; Batelle Geneva Research Center: Geneva, Switzerland, 1972. [Google Scholar]
- Lin, C.W.; Chen, S.H.; Tzeng, G.H. Constructing a cognition map of alternative fuel vehicles using the DEMATEL method. J. Multi Criteria Decis. Anal. 2009, 16, 5–19. [Google Scholar] [CrossRef]
- Liou, J.J.H.; Tzeng, G.H.; Chang, H.C. Airline safety measurement using a Novel Hybrid Model. J. Air Transp. Manag. 2007, 13, 243–249. [Google Scholar] [CrossRef]
- Tzeng, G.H.; Chiang, C.H.; Li, C.W. Evaluating intertwined effects in e-learning programs: A Novel Hybrid MCDM Model based on factor analysis and DEMATEL. Expert Syst. Appl. 2007, 32, 1028–1044. [Google Scholar] [CrossRef]
- Yang, J.L.; Tzeng, G.H. An integrated MCDM technique combined with DEMATEL for A Novel cluster-weighted with ANP Method. Expert Syst. Appl. 2011, 38, 1417–1424. [Google Scholar] [CrossRef]
- Huang, J.J.; Tzeng, G.H.; Ong, C.S. Multidimensional data in multidimensional scaling using the analytic network process. Pattern Recognit. Lett. 2005, 26, 755–767. [Google Scholar] [CrossRef]
- Hung, Y.H.; Huang, T.L.; Hsieh, J.C.; Tsuei, H.J.; Cheng, C.C.; Tzeng, G.H. Online reputation management for improving marketing by using a Hybrid MCDM model. Knowl. Based Syst. 2012, 35, 87–93. [Google Scholar] [CrossRef]
- Tsai, W.H.; Chou, W.C.; Lai, C.W. An effective evaluation model and improvement analysis for national park websites: A case study of Taiwan. Tourism Manag. 2010, 31, 936–952. [Google Scholar] [CrossRef]
- Opricovic, S. Multicriteria Optimization of Civil Engineering Systems; Faculty of Civil Engineering: Belgrade, Serbia, 1998. [Google Scholar]
- Opricovic, S.; Tzeng, G.H. Compromise solution by MCDM methods: A comparative analysis of VIKOR and TOPSIS. Eur. J. Oper. Res. 2004, 156, 445–455. [Google Scholar] [CrossRef]
- Tzeng, G.H.; Teng, M.H.; Chen, J.J.; Opricovic, S. Multicriteria selection for a restaurant Location in Taipei. Int. J. Hosp. Manag. 2002, 21, 171–187. [Google Scholar] [CrossRef]
- Morose, G.; Shina, S.; Farrell, R. Supply chain collaboration to achieve toxics use reduction. J. Clean Prod. 2011, 19, 397–407. [Google Scholar] [CrossRef]
- Oehmen, J.; de Nardo, M.; Schönsleben, P.; Boutellier, R. Supplier code of conduct-state-of-the-art and customisation in the electronics industry. Prod. Plan. Control 2010, 21, 664–679. [Google Scholar] [CrossRef]
- Ekener-Petersen, E.; Finnveden, G. Potential hotspots identified by social LCA-part 1: A case study of a laptop computer. Int. J. Life Cycle Assess. 2013, 18, 127–143. [Google Scholar] [CrossRef]
- Krause, D.R.; Ellram, L.M. Success factors in supplier development. Int. J. Phys. Distrib. Logist. Manag. 1997, 27, 39–52. [Google Scholar] [CrossRef]
- Govindan, K.; Kannan, D.; Haq, A.N. Analyzing supplier development criteria for an automobile industry. Ind. Manag. Data Syst. 2010, 110, 43–62. [Google Scholar] [CrossRef]
- Li, W.; Humphreys, P.K.; Yeung, A.C.; Cheng, T.C.E. The impact of supplier development on buyer competitive advantage: A path analytic model. Int. J. Prod. Econ. 2012, 135, 353–366. [Google Scholar] [CrossRef]
- Modi, S.B.; Mabert, V.A. Supplier development: Improving supplier performance through knowledge transfer. J. Oper. Manag. 2007, 25, 42–64. [Google Scholar] [CrossRef]
- Dou, Y.; Zhu, Q.; Sarkis, J. Evaluating green supplier development programs with a grey-analytical network process-based methodology. Eur. J. Oper. Res. 2014, 233, 420–431. [Google Scholar] [CrossRef]
- Fu, X.; Zhu, Q.; Sarkis, J. Evaluating green supplier development programs at a telecommunications systems provider. Int. J. Prod. Econ. 2012, 38, 13505–13517. [Google Scholar]
- Tate, W.L.; Ellram, L.M.; Dooley, K.J. Environmental purchasing and supplier management (EPSM): Theory and practice. J. Purch. Supply Manag. 2012, 18, 173–188. [Google Scholar] [CrossRef]
© 2015 by the authors; licensee MDPI, Basel, Switzerland. This article is an open access article distributed under the terms and conditions of the Creative Commons Attribution license (http://creativecommons.org/licenses/by/4.0/).
Share and Cite
Kuo, T.C.; Hsu, C.-W.; Li, J.-Y. Developing a Green Supplier Selection Model by Using the DANP with VIKOR. Sustainability 2015, 7, 1661-1689. https://0-doi-org.brum.beds.ac.uk/10.3390/su7021661
Kuo TC, Hsu C-W, Li J-Y. Developing a Green Supplier Selection Model by Using the DANP with VIKOR. Sustainability. 2015; 7(2):1661-1689. https://0-doi-org.brum.beds.ac.uk/10.3390/su7021661
Chicago/Turabian StyleKuo, Tsai Chi, Chia-Wei Hsu, and Jie-Ying Li. 2015. "Developing a Green Supplier Selection Model by Using the DANP with VIKOR" Sustainability 7, no. 2: 1661-1689. https://0-doi-org.brum.beds.ac.uk/10.3390/su7021661