Article

A Stepwise, Participatory Approach to Design and Implement Community Based Adaptation to Drought in the Peruvian Andes

by
Ralph Lasage
1,*,
Sanne Muis
1,
Carolina S. E. Sardella
2,
Michiel A. Van Drunen
3,
Peter H. Verburg
1 and
Jeroen C. J. H. Aerts
1
1
Institute for Environmental Studies, VU University Amsterdam, De Boelelaan 1085, 1081 HV Amsterdam, The Netherlands
2
Parsons Brinckerhoff, Level 27, 680 George Street, Sydney NSW 2001, Australia
3
Amsterdam University College, Science Park 113, 1098 XG Amsterdam, The Netherlands
*
Author to whom correspondence should be addressed.
Sustainability 2015, 7(2), 1742-1773; https://0-doi-org.brum.beds.ac.uk/10.3390/su7021742
Submission received: 14 August 2014 / Accepted: 30 January 2015 / Published: 10 February 2015
(This article belongs to the Section Environmental Sustainability and Applications)

Abstract

:
The livelihoods of people in the Andes are expected to be affected by climate change due to their dependence on glacier water. The observed decrease in glacier volume over the last few decades is likely to accelerate during the current century, which will affect water availability in the region. This paper presents an approach for participatory development of community-based adaptation measures to cope with the projected impacts of climate change. It combines in an innovative manner participatory design with physical measurements, modeling and a vulnerability analysis. Vulnerability to drought is made operational for households in a catchment of the Ocoña River basin in Peru. On the basis of a household survey (n = 94) we explore how a vulnerability index (risk divided by response efficacy) can be used to assess the distribution of vulnerability over households, and how socio-economic factors determine this vulnerability. Water entitlement, area of irrigated land, income and education are all significantly correlated with vulnerability to drought. The research showed that the main source of spring water is local rainwater, and that water use efficiency is low. The selected adaptation measures aimed to increase water availability close to farmland, and increase water use efficiency of farmers and households.

1. Introduction

Water is an important resource for producing food in the Peruvian Andes, and 80% of the inhabitants are dependent on agriculture as their main source of income [1]. Rainfall is insufficient in many agricultural areas, and extensive systems are in place to relocate water from streams to irrigated fields [2]. These systems have often been in place for a long time, and the first terraces in the Andes date back to between 500 and 1000 AD [3]. The management of irrigation systems is regulated by policies and extensive water rights, but faces several challenges [4], since the water availability in the Andes region is expected to decrease as a result of climate change [5]. Records for the last 50 years of the Peruvian Andean glaciers show that there is a general trend of glacier retreat caused by increasing temperatures. Climate change and glacier retreat are expected to have an impact on both the natural and the socio-economic systems [6]. The dependence on water resources is shown by the reduction of highland agricultural production by 60%–70% during the drought of 1982 [2]. At the same time, water management systems on the local scale are often poorly designed and managed [7]. Climate change will, therefore, put pressure on communities that are dependent on water for their livelihoods.
The concept of vulnerability is widely used to characterize and understand the implications of climate change at the community level [8,9,10]. The recent IPCC Fifth Assessment report uses an adjusted definition of vulnerability as the propensity or predisposition to be adversely affected, which covers a variety of concepts and elements including sensitivity or susceptibility to harm, and lack of capacity to cope and adapt [11]. Understanding the determinants and variation in vulnerability helps to identify and prioritize adaptive measures to reduce impacts from, for example, climate change and other development issues [12,13]. Over the years, multiple authors have contributed to the development of methods for assessing vulnerability (e.g., [8,14,15,16,17]). Most climate related vulnerability studies in developing countries deal with the national scale, or consist of international comparisons across countries (e.g., [18,19]). Due to the lack of attention to the local context, such large-scale studies often do not address the link between physical information about the water system and socio-economic field data for the communities and households considered [20].
We study the perceived vulnerability to droughts in a catchment in the Peruvian Andes, South America. We make perceived vulnerability operational by combining the households’ perception of their sensitivity and exposure to droughts with their perception of the effectiveness of proposed adaptation measures for their household, which is also known as response efficacy [21,22]. This response efficacy helps to determine the possibilities that the households see to reduce their vulnerability, without limiting themselves to options that are currently feasible for them (for instance due to limited financial resources, or knowledge). The data for this analysis are gathered via a household survey. We explore the correlation of the perceived vulnerability with several socio-economic characteristics of the household (e.g., income, education, age, access to water, etc.). The socio-economic characteristics are used as independent variables to gain insight into the factors that explain the perceived vulnerability to droughts of the households in this area. This is different from other studies, which use these socio-economic characteristics as determinants of adaptive capacity (e.g., [23,24]). We use response efficacy instead of adaptive capacity in calculating the perceived vulnerability. Our approach to vulnerability is less data demanding, and if proven to be useful, it might help to simplify vulnerability assessments. The insights from the vulnerability analysis together with results from hydrological research are then used to develop adaptation measures to reduce the vulnerability to drought.
In Peru, the government and NGOs are working with water users, local management systems, and public entities to promote adaptation strategies in the water sector. However, to be effective, these programmes and measures must be recognized and accepted by the people using and managing the water. Participatory approaches are increasingly seen as key to developing and implementing such measures, as they capture and include the knowledge and priorities of the community, and lead to more sustained, and better accepted, decisions [15,25,26,27,28,29]. A body of literature is available on participatory approaches in environmental decision making, natural resource management and water management (e.g., [27,28]), and on the learning effects of involved stakeholders [30,31]. However, little has been published on the experience of using participatory approaches for developing climate adaptation measures, and how communities can implement these measures [27,32].
The goal of this study is to apply and evaluate a stepwise participatory method to develop and implement community-based adaptation measures based on an analysis of the vulnerability of communities in the Peruvian Andes to climate change.
The study was conducted in the Chorunga catchment, which is part of the Ocoña River basin, located in the Southern part of Peru. This area is representative of the environmental and socio-economic conditions of farming communities across the Andes.

2. Data and Methods

2.1. Study Area

The Chorunga catchment is part of the Ocoña River basin, which is located in the Southern part of the Peruvian Andes (Figure 1). The catchment is located in the eastern part of the Ocoña basin, and covers 1100 km2, with an elevation ranging from 500 m to over 6300 m. Many of the circa 3000 people in the Chorunga catchment live in farming villages located in a zone between 3000 and 3500 m, where irrigated agriculture is the main activity. The prevailing climate at these altitudes is a semi-arid mountain climate, with mean annual temperatures varying between the 9 °C and 14 °C and a yearly precipitation that varies between 124 mm and 305 mm [33]. The area is characterized by extensive terraces dating from pre-Inca times [34]. The irrigation systems capture water from a source, that being a spring or a river, and lead it downhill through canals and dividers to a reservoir. This reservoir is filled during the night and part of the day, and at a set moment the stored water is released. From the reservoir, smaller canals lead the water to the different irrigated parcels.
The irrigation systems are managed and maintained by Water Users Associations, the official water governing bodies at the local level, based on local traditions. For instance the water is allocated to users according to a water share unit called a “riego”. One riego equals a certain percentage of the water that is stored in the reservoir on the day that a user has the right to receive the irrigation water. The exact volume of a riego depends on the available water volume in the reservoir on that specific day, and therefore varies between the seasons and between reservoirs. During the wet season, the reservoir is completely filled and a riego is more water than at the end of the dry season when the reservoir is only partly filled. The time between the irrigation days (turns), as registered at the Water Commission, varies between 28 and 85 days, which is too long for most users [35]. The water rights have been inherited from generation to generation since the mid-19th century. In some cases, this has led to an unequal distribution of water within the communities, with a few large users, and many small users.
Figure 1. Location of the Chorunga study area in the Ocoña River basin. The inset maps show the location of the study area in Peru. Stars indicate interview locations; triangles indicate water sample locations; and polygons indicate the locations where dams were constructed.
Sustainability 07 01742 g001
The study area is a poor rural area, where around 68% of the population live in poverty, compared with 14% for the whole of Peru [1]. The high poverty rates are comparable to other Andean regions within Peru [1] and in, for example, Bolivia [36]. The average age of the population is 40 years, which is similar to that of the Province of Condesuyos of which it is a part [37]. Livestock is an important source of income. Consequently, many of the farmers cultivate cattle fodder, such as alfalfa, barley, and oats. Crops cultivated for human consumption include potatoes, maize, wheat and broad beans. Some farmers cultivate products exclusively produced for export, such as kiwicha, quinoa and maize morado [38]. However, most farmers produce for subsistence only. The growing season is from August to May and is divided into two parts. During September and October meltwater from a relatively small arm of the Coropuna glacier is the most important source of irrigation water. The second part of the growing season is from January–March, coinciding with the rainy season, and precipitation is used as an additional source of water besides irrigation.
Between 1975 and 2004, the Coropuna glacier, which has a maximum altitude of 6377 m, lost 37% of its total volume and retreated by 243 m [39]. It was estimated that the mean loss of surface area of the glacier between 1955 and 2003 was 1.4 km2 per year [40]. Glacier retreat has accelerated since the 1970s, and is expected to continue in the coming decades, eventually leading to the disappearance of the glacier [41]. Due to the melting of the glacier water, availability could increase in the short term [42]. The rising temperatures also affect precipitation, and, in the future climate, a larger part will be in the form of rain instead of snow. On the longer term, these changes are expected to lead to decreased water availability during the growing season compared with current circumstances.

2.2. Overview of Approach

The stepwise participatory approach (Figure 2) builds on the poverty reduction and climate risk studies under The Netherlands Climate Assistance Programme [43], the policy guidance on Integrating Climate Change Adaptation into Development-Cooperation, developed by the OECD Development Assistance Committee [44]. The main steps of this approach are comparable to those used by, for example, the UNFCCC [45] and others [12,15,46]. It structures the activities to gather relevant data on the social-ecological system through physical measurements, modeling, and a vulnerability analysis, eventually to participatory design adaptation measures [47].
Figure 2. Overview of the approach to participatory development of adaptation measures.
Sustainability 07 01742 g002
Within this approach, the local community has a central position, and interactions with the communities are important for the different steps of the approach. Interaction involves both using the knowledge and preferences of the local community, and making information and knowledge available to the various communities, hence, raising their awareness on water management and climate change adaptation.
Step 1 is to identify the perception of problems and objectives of possible adaptation measures in the case study area. We started with a stakeholder inventory, by the risk mapping of geographical and water issues, group meetings, in-depth interviews, field visits, and reviewing available reports. These activities led to the identification of existing issues related to climate variability and water management, external pressures on the area due to climate change, population growth, economic growth, and changes in land use and the political and institutional context, including an overview of stakeholders and including their objectives and wishes for the area. The outcomes of this step are a series of visions for water management, a long list of adaptation options and priorities, and the identification of the questions on which further research is needed.
Step 2 is a vulnerability analysis based on a household survey. To answer questions identified in Step 1, the impact of climate change on the hydrological system is assessed using a hydrological model which applies downscaled climate change scenarios to make a physical assessment of the potential climate change impacts on water availability. During this modeling phase, regular interaction with the main stakeholders took place to exchange information and insights. This interaction ensured that outputs were comprehensible and usable for the local stakeholders, and that local knowledge and experience was included in the research.
During the Step 3 adaptation measures are further developed, using both the modeling and survey results. Several group meetings were organized with farmers, water managers, policy makers and other decision makers to raise awareness on the topic and to explore potential adaptation measures. Jointly, the project team and representatives of local stakeholders updated the long-list of adaptation measures.
These measures are appraised in Step 4 using expert knowledge of the local community (e.g., farmers), the local NGO, and international researchers. Modeling tools are used in this phase to make ex-ante assessments. After the appraisal, in Step 5, several adaptation measures are selected from the long list, using, for example, consultation tables [48]. These are local meetings where stakeholders share their opinions on a wide variety of topics, and come to an agreement. These are established fora to decide in which projects public money should be invested in a district. The selection of measures is made on the basis of feasibility, costs, and expectation of their success to reduce vulnerability to droughts.
The selected measures are implemented during Step 6, and the effects are monitored in Step 7, mostly in a qualitative way. The effect of the measures and gained knowledge is then fed back to the stakeholders to see if improvements need to be made. During the whole process regular communication and dialogue takes place with policy makers and decision makers on different levels.

2.3. Hydrological Analysis and Modeling

Following discussions with stakeholders in Step 1, one of the main requests was to produce information on the projected impacts of climate change. Furthermore, it was not known if the springs are fed by infiltrating rainwater or fed by the glacier via deeper groundwater. If the latter is the case, the water availability will be negatively affected by glacier retreat [5,41].
For assessing current water availability and the impacts of climate change projections on runoff, the hydrological model STREAM was applied. This model has been previously used in several studies on hydrology and climate change [49,50,51]. The STREAM model is a grid-based water balance model that calculates runoff on the basis of precipitation and temperature data and several land surface characteristics [52,53]. For each cell, the water balance is calculated using a direct runoff, soil water and groundwater component, based on a number of parameters. Climate change projections were obtained from ECHAM5 Global Circulation Model simulations. This model was selected on the basis of a previous performance assessment [54]. The climate model applied the A1B, A2, and B1 greenhouse gas scenarios for the period 2000–2100 [55]. The global data from the ECHAM model is available at a resolution of 1.875 × 1.875 degrees (112.5 arc minutes). These resolutions are rather coarse for use in regional impact assessment studies. Hence, the data were downscaled to a higher spatial resolution of 10 × 10 arc minutes (approximately 18.5 × 18.7 km), using statistical methods that transform the data in such a way that it matches the main statistical properties of modeled and observed climate data sets [56,57]. See [51] for an elaborate description of the STREAM model and of the method used for statistical downscaling of climate change projections.
Hydro-chemical analysis was used to determine the likely source of spring water (between 3000 and 4000 m). Two different methods were used: Electronic Conductivity (EC) and isotope analysis. At 109 locations within the wider region around the catchment (44 samples in the Chorunga catchment), the EC value of water was measured using a handheld electro-conductivity meter. Measuring the EC, which is an indicator of the amount of dissolved ions in solution, is relatively simple. High EC values indicate interaction with geology, evaporative processes, influence of human activities and/or a combination of these. EC values of surface water in the catchment were mapped by plotting the observed EC values.
The ratios between 18O/16O and 2H/1H of surface water are indicative of the elevation at which the precipitation occurred and how much evaporation has taken place after the rain event. Isotopically enriched rain (i.e., formed by the heavier isotopes 18O and 2H) forms and falls first, a phenomenon known as rainout effect. Similarly, precipitation gets depleted in heavier isotopes with increasing altitude, a phenomenon known as the altitude effect [58,59]. The ratio between 18O and 16O and 2H and 1H of a sample can be compared with the seawater standard, which represents the average ratios between the heavy and light isotopes in seawater. The difference between the samples is expressed as d18O and d2H, in terms of the per mille deviation from the ocean standard. Delta values are calculated by subtracting the ocean standard from the sample ratio, dividing it by the ocean standard, and multiplying by one thousand. The d18O and d2H value are used to derive the elevation at which the rainfall occurred, where the values become more negative with increasing height. The relationship between d18O and d2H in precipitation is expressed by the Local Meteoric Water Line (LMWL). Deviations from the LMWL indicate that precipitation water has been affected by various processes (e.g., evaporation and condensation), and indicate if the d18O is a suitable measure for determining the elevation at which the precipitation occurred. Throughout the area, 55 samples were taken: close to the glacier, from streams on the bofedales, which are the highland wetlands, from the springs in the Chorunga catchment, and from the Chorunga and Ocoña Rivers.

2.4. Vulnerability Assessment

The most important expected impact of climate change in the case-study area is a reduction in water availability. Therefore, we define vulnerability to climate change in this area as the degree to which households perceive they would be affected by decreased water availability in relation to their capacity to take measures to alleviate this water shortage.
We use the concepts of exposure, sensitivity, and response efficacy to operationalize vulnerability (e.g., [8,10,12,14,15,16,17]). Exposure is the frequency of drought periods; sensitivity is the perceived effect of a drought on people’s livelihoods at the household level; and response efficacy (RE) is defined as the perceived effectiveness of adaption measures that the household may take in response to more frequent drought/reduced water availability [22]. It is measured by the extent to which the respondents indicate certain adaptation strategies to be important to them. We use the RE to determine the possibilities that the households see to reduce their vulnerability, without limiting themselves to options that are currently feasible for them (for instance due to limited financial resources, or knowledge). It also allows us to assess the relationship of vulnerability with the socio-economic characteristics of the household at a later stage in the research, as explained at the end of this section. The three concepts have been combined into a straightforward vulnerability index without assigning different weights to the factors, as follows:
V =   ( E   × S ) R E ¯
where: V is vulnerability; risk is defined as the multiplication of E (exposure) by S (sensitivity), which are both valued in the survey with discrete numbers (1, 2, 3; see Table 1), indicating low, medium or high exposure/sensitivity and they are both normalized between 0 and 1. RE equals the average score of the effectiveness of the adaptation measures as indicated by the household. These scores are valued as discrete numbers (1, 2, 3, 4, 5; see Table 1) for indicating the perceived effectiveness of the adaptation measures. Table A1 shows the questionnaire and the extensive list of measures considered.
Table 1. Questions on which the vulnerability index is based. From left to right: vulnerability components, questions, and scores.
QuestionScore
Exposure (E)How often do you face droughts?123
InfrequentNeutralVery Frequent
Sensitivity (S)What is the impact of drought on your livelihood?123
No influenceNeutralLarge influence
REHow effective do you consider the chosen adaptation measures? 12345
Not effectiveNeutralVery effective
Following Equation 1, the vulnerability of households ranges from 0.02–1 on an ordinal scale. Their vulnerability is high if the exposure and sensitivity are high and the RE is low, and vice versa. Most vulnerable are those households which perceive they are strongly affected by the impacts of droughts and indicate that the adaptation measures are not so effective for them. The vulnerability index assumes that both the risk and the RE are proportional, and are equally weighted.
Data collection for the vulnerability assessment took place during a household survey in June–July 2009. In total, 94 farmers in the Chorunga catchment were interviewed face-to-face using a questionnaire. The households were selected by stratified sampling per town. The questionnaire covered the following topics: the socio-economic characteristics of the household; agriculture; water use; climatic factors; sensitivity to hazards; and possible adaptive measures. Three of these questions form the basis for the vulnerability index (see Table 1); the others are used to explore which household characteristics determine the vulnerability. The question on the RE is a follow up on the question which asks the respondents to indicate which adaptation measures they consider implementing themselves.
In addition to the household survey, all Water Association presidents of the study area were interviewed on order to gain more insight into the functioning of the villages’ irrigation systems, and several meetings and interviews were held with other experts in the region, working at government offices, NGOs, and universities. These interviews were used to validate the results of the survey, and to acquire extra information on the governance of water resources. The local Water Association provided information on the amount of water entitled to a family, which was used to establish the respondent’s water user size.
The survey results at household level were analyzed by calculating the Spearman rank correlation coefficients between the vulnerability index and a number of potentially explanatory factors of this index. This analysis for nonparametric data was chosen because the vulnerability index and most of the potential determining factors are measured on an ordinal scale. For the analysis, the answers of the respondents were ranked. The explanatory factors are the following: age, area of irrigated land, education, economic situation, income, irrigation frequency, number of cows, water entitlement (in hours per year), and water entitlement (in riego per year). We then explored the possible causal relation between the vulnerability index and the factors that were significantly correlated to it. These analyses were performed for all the households and for a subsample of agricultural households, as we expect the second group of households to be more dependent on water for their livelihoods.

2.5. Development and Evaluation of Adaptation Measures

A long-list of possible adaptation measures was developed by Peruvian stakeholders and experts of the project team (Step 3 in Figure 2). The stakeholders involved were inhabitants/farmers, farming organizations, Water Associations represented by the chair, Irrigation Commissions, informal miners, mayors of the different towns, ATDR (the government organization for technical support in water management), ANA (the local water administrative agency), the Ministry of Environment, and AEDES (the local NGO).
The climate projections were presented in simple graphs and fact sheets to the communities [60]. They were used to support discussions with the stakeholders, which aimed to raise awareness of the potential impacts of climate change and of the possibilities to develop adaptation measures. During these meetings, different forms of suitable participatory approaches were used [61]. Several meetings were held where experts came to the study area to present and discuss the results with the stakeholders. On the basis of the climate projections and information on the investment costs of the adaptation measures, the final selection of adaptation measures was made by the local communities and other stakeholders. The information on climate projections and adaptation costs was also used at ‘consultation tables’, which are official stakeholder meetings in the district to discuss water issues with upstream and downstream users [48]. Apart from local communities, the stakeholders involved included ATDR, ANA, the Ministry of Environment, and AEDES.

3. Results and Discussion

3.1. Hydrologic System and Projected Impacts of Climate Change

The climate projections using ECHAM5 data show that the temperature at the Coropuna glacier will rise between 1.9 and 2.6 °C when comparing 2050 with the temperatures of 1990 [41,62]. The climate change projections also indicate that the amount of snow and rain will change, and that many glaciers will completely disappear in the coming 20–50 years [63,64].
As a result of climate change, a larger proportion of precipitation will be in the form of rain, and a smaller part will fall as snow. This will lead to a shift in the timing of when the water will become available in the basin. The effects of climate change on rainfall are significant, and a 27% reduction of precipitation is projected for 2050, during the rainy season. For the larger Ocoña basin, the annual discharge is projected to decrease to 367 m3/s towards 2050, which is 
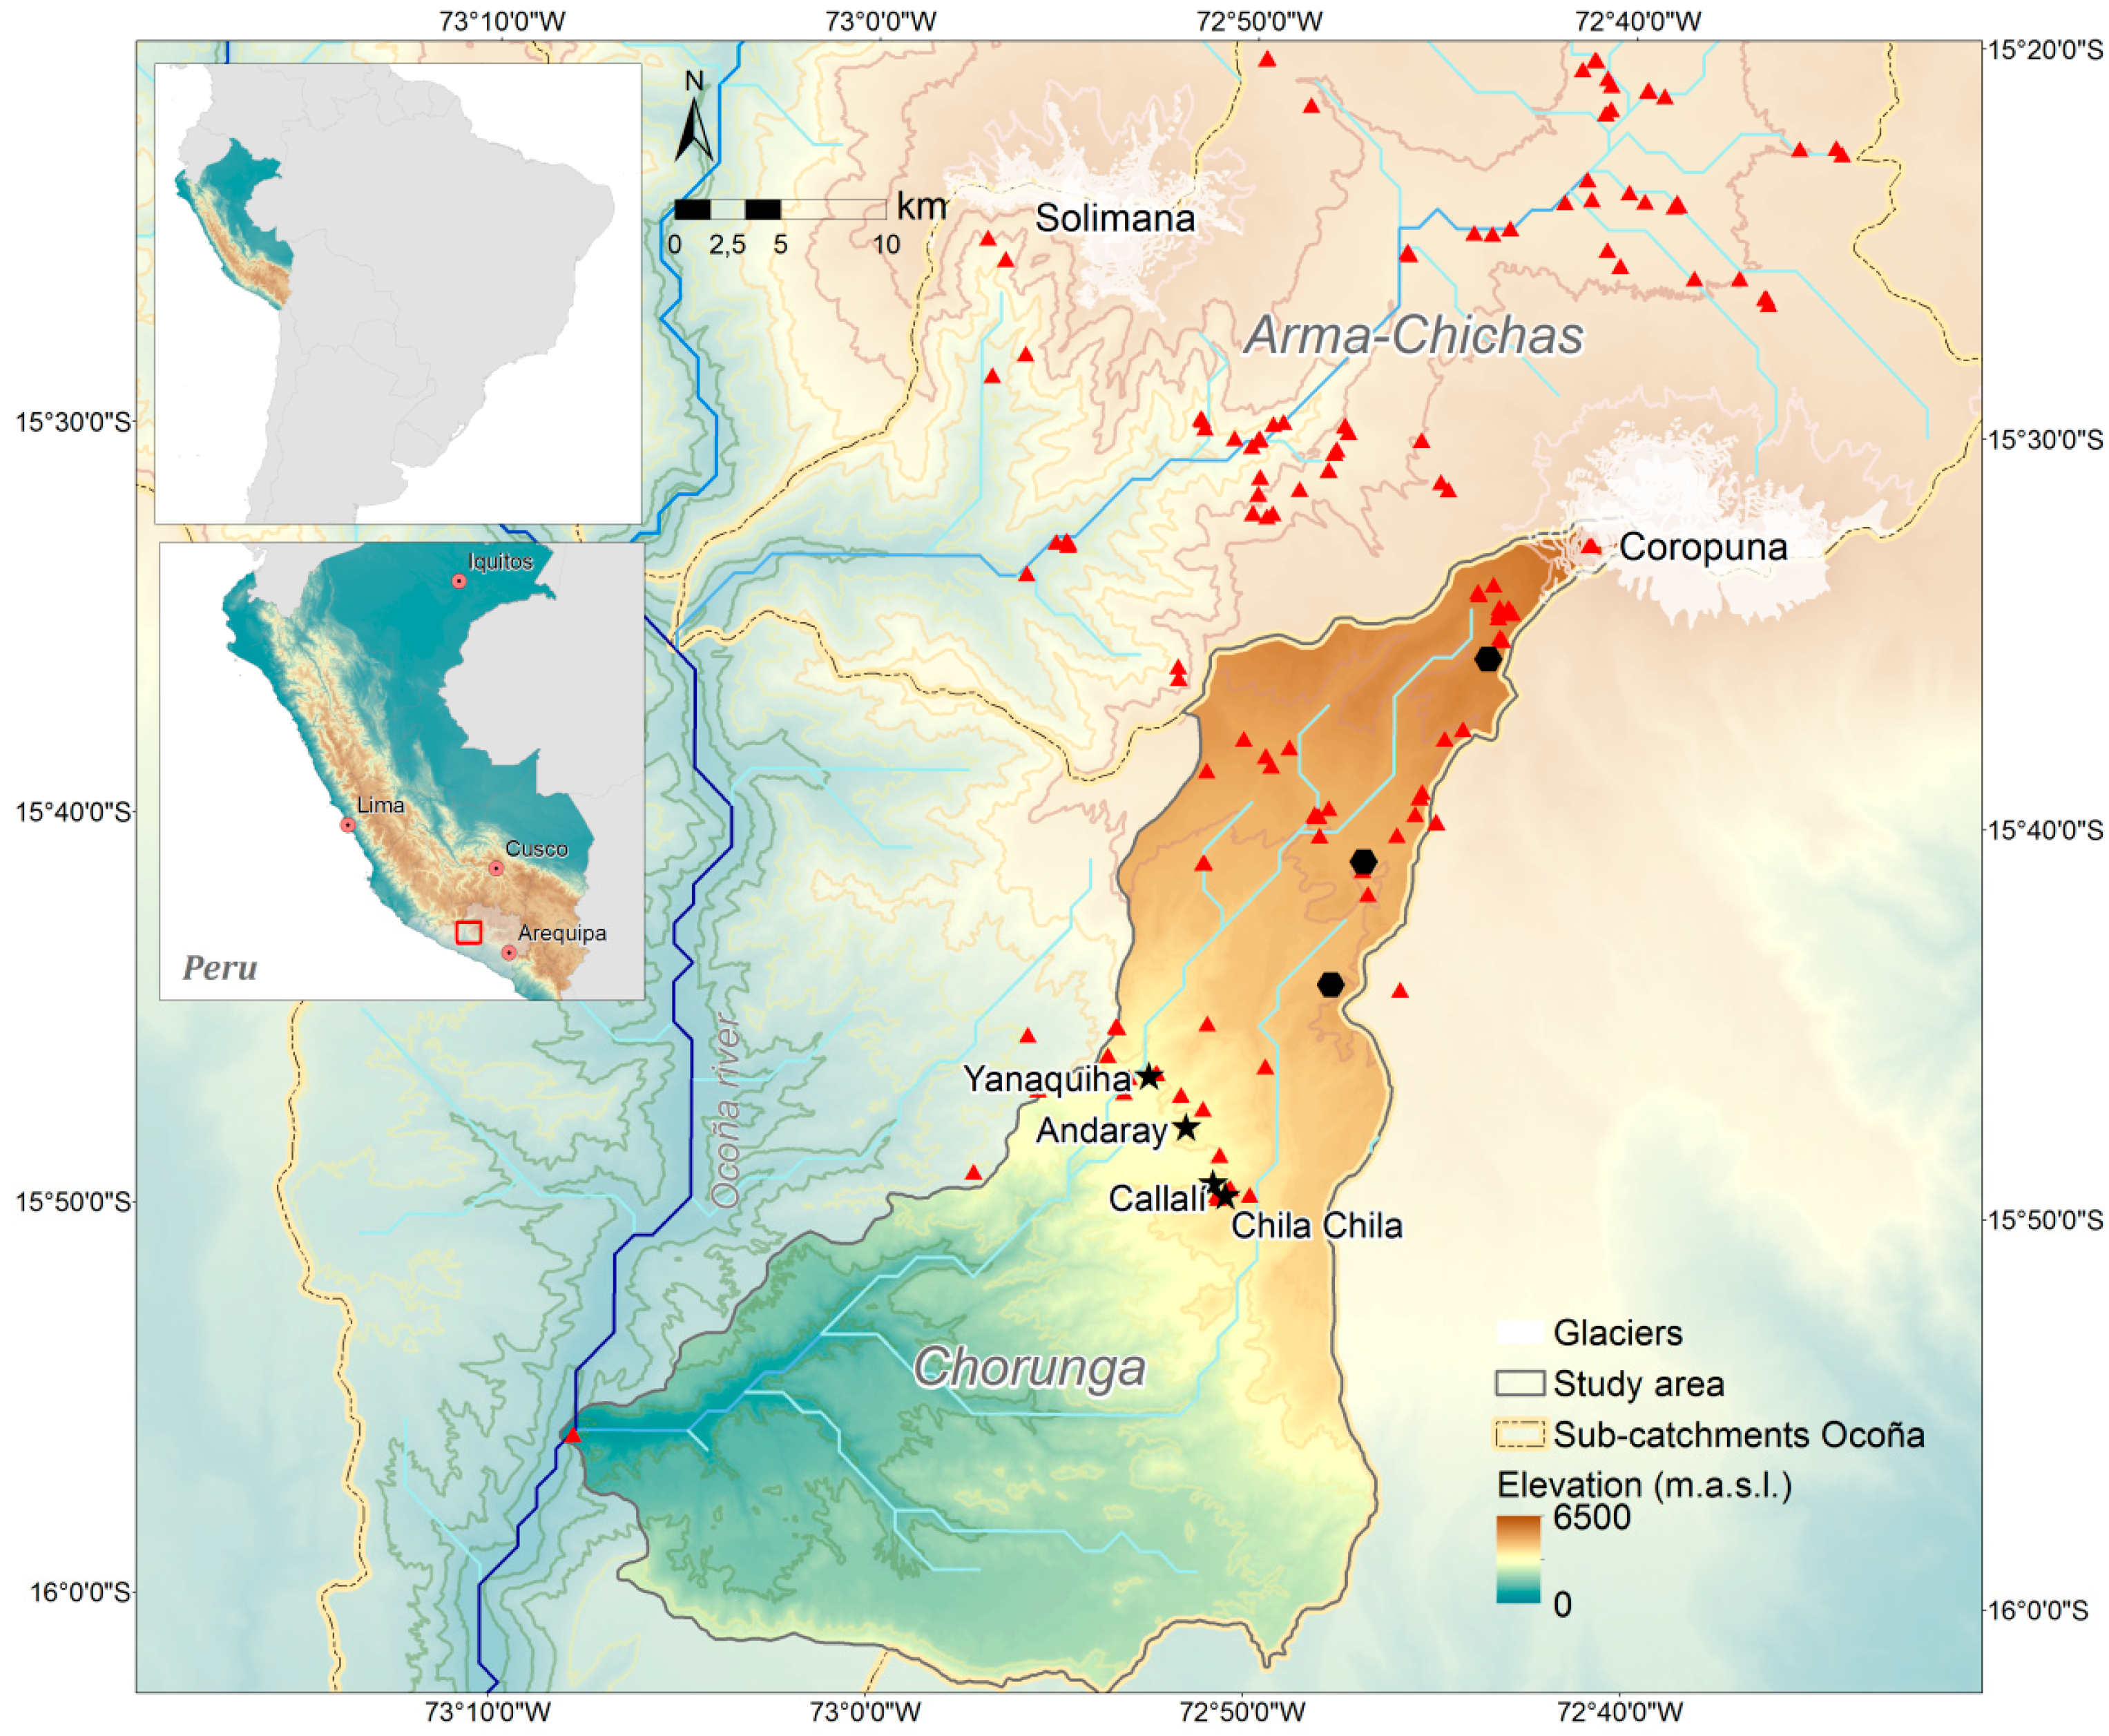
circa 31% of the current discharge. For the Chichas catchment (Figure 3), which is also part of the Ocoña basin and is located next to the Chorunga catchment, the average annual discharge is projected to decrease by circa 50% to 4.2 m3/s by 2050. During the rainy season the discharge will reduce from 19.7–0.0 m3/s, and during the dry season from 4.5–2.2 m3/s. The increase in discharge due to additional meltwater from the glacier is not visible in the results, possibly because the effect of reduced precipitation is larger than the increase of meltwater.
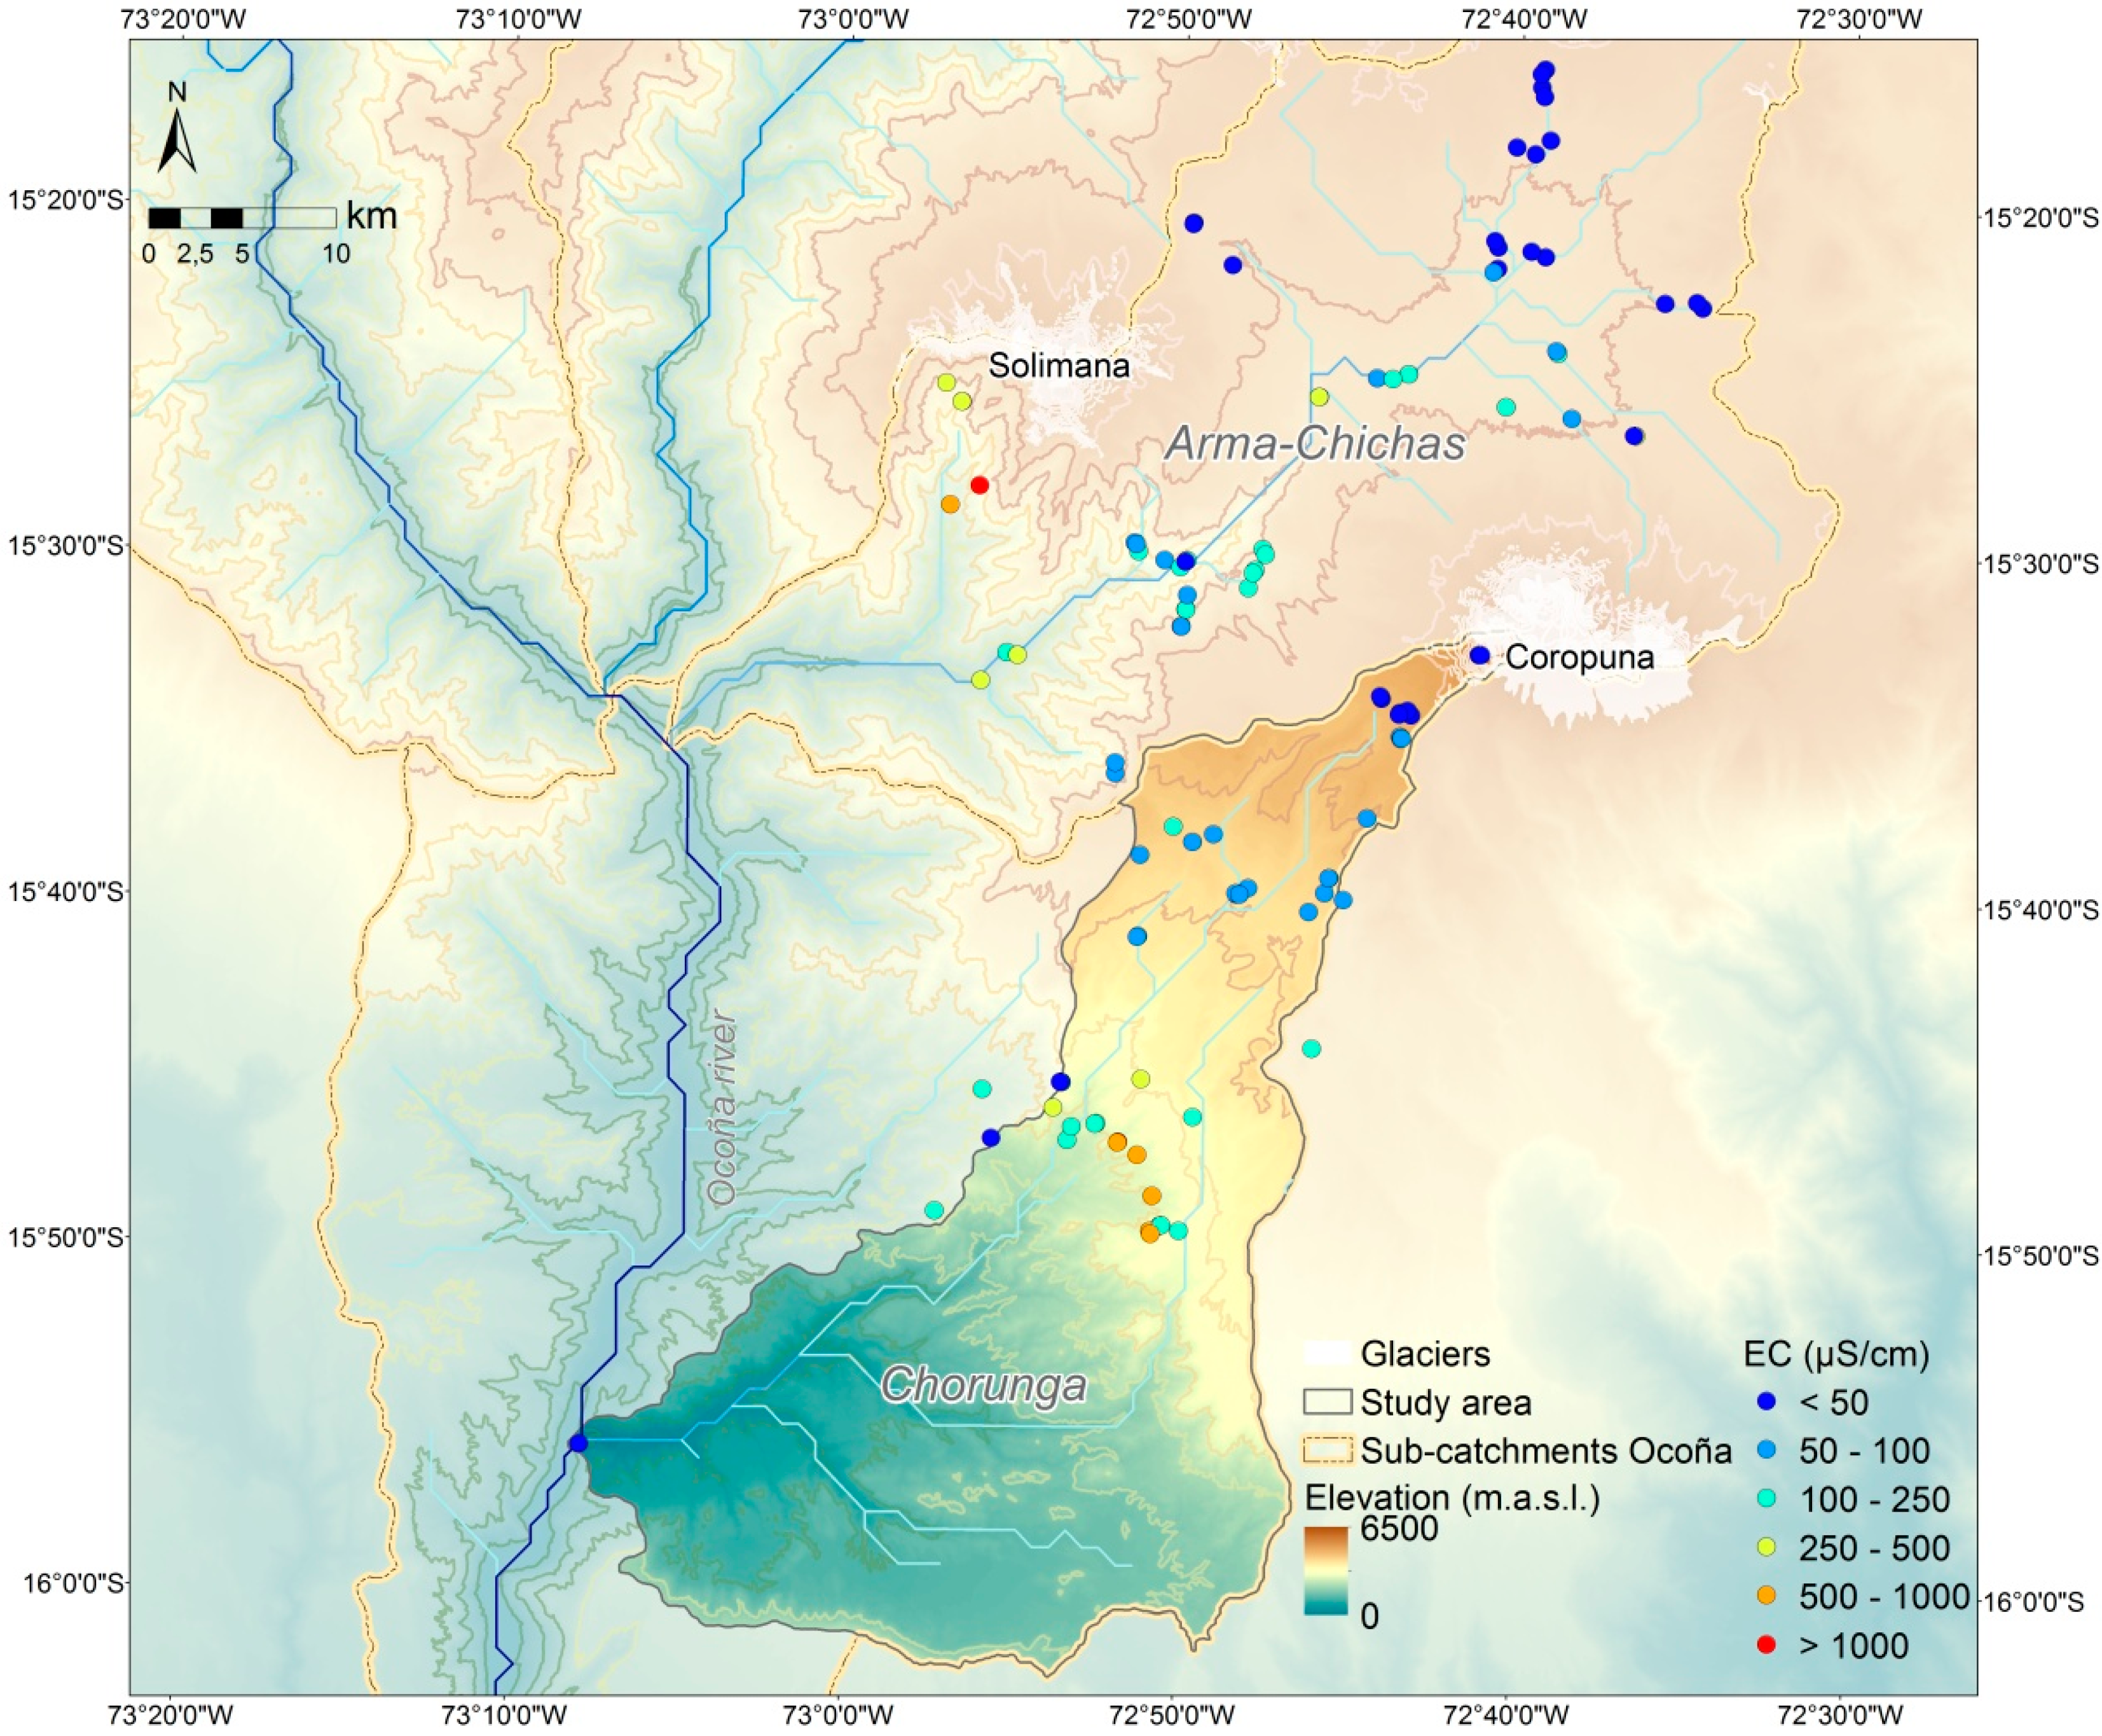
Figure 3. Map showing the electric conductivity (EC) of water at sample locations in the Chorunga and Chichas catchments.
Sustainability 07 01742 g003
Figure 3 shows the EC values measured in the field in the Chorunga and neighbouring Chichas catchments. Near the glaciers Coropuna and Firura, EC values are below 100 μS/cm, which is very low. Moving to lower elevations in the South of the Chorunga catchment, EC values increase, indicating interactions of surface water with rocks, human influence on surface water (agriculture and cattle herding), and evaporation. The location and influence of agriculture is clearly visible in the sharp increase of surface water EC values. On the irrigated terraces of Chorunga catchment, and further downstream, the EC values of surface water are generally above 500 μS/cm, and at some locations even above 1000 μS/cm. The low EC values of spring water throughout the study zone indicate a short travel time and little influence of human activities. This makes it likely that the water originates from shallow groundwater fed by glacial meltwater or rain.
The isotope analysis data shows that the ratio between d18O and 2H of the water samples fit the LMWL, indicating that evaporation was not an important factor in influencing the d18O value at most sample locations. Only lakes and some of the creeks have been subject to substantial evaporation. Most springs do not show signs of evaporation. This suggests that the difference in d18O signature reflects the altitude at which precipitation occurred, rather than the influence of evaporation.
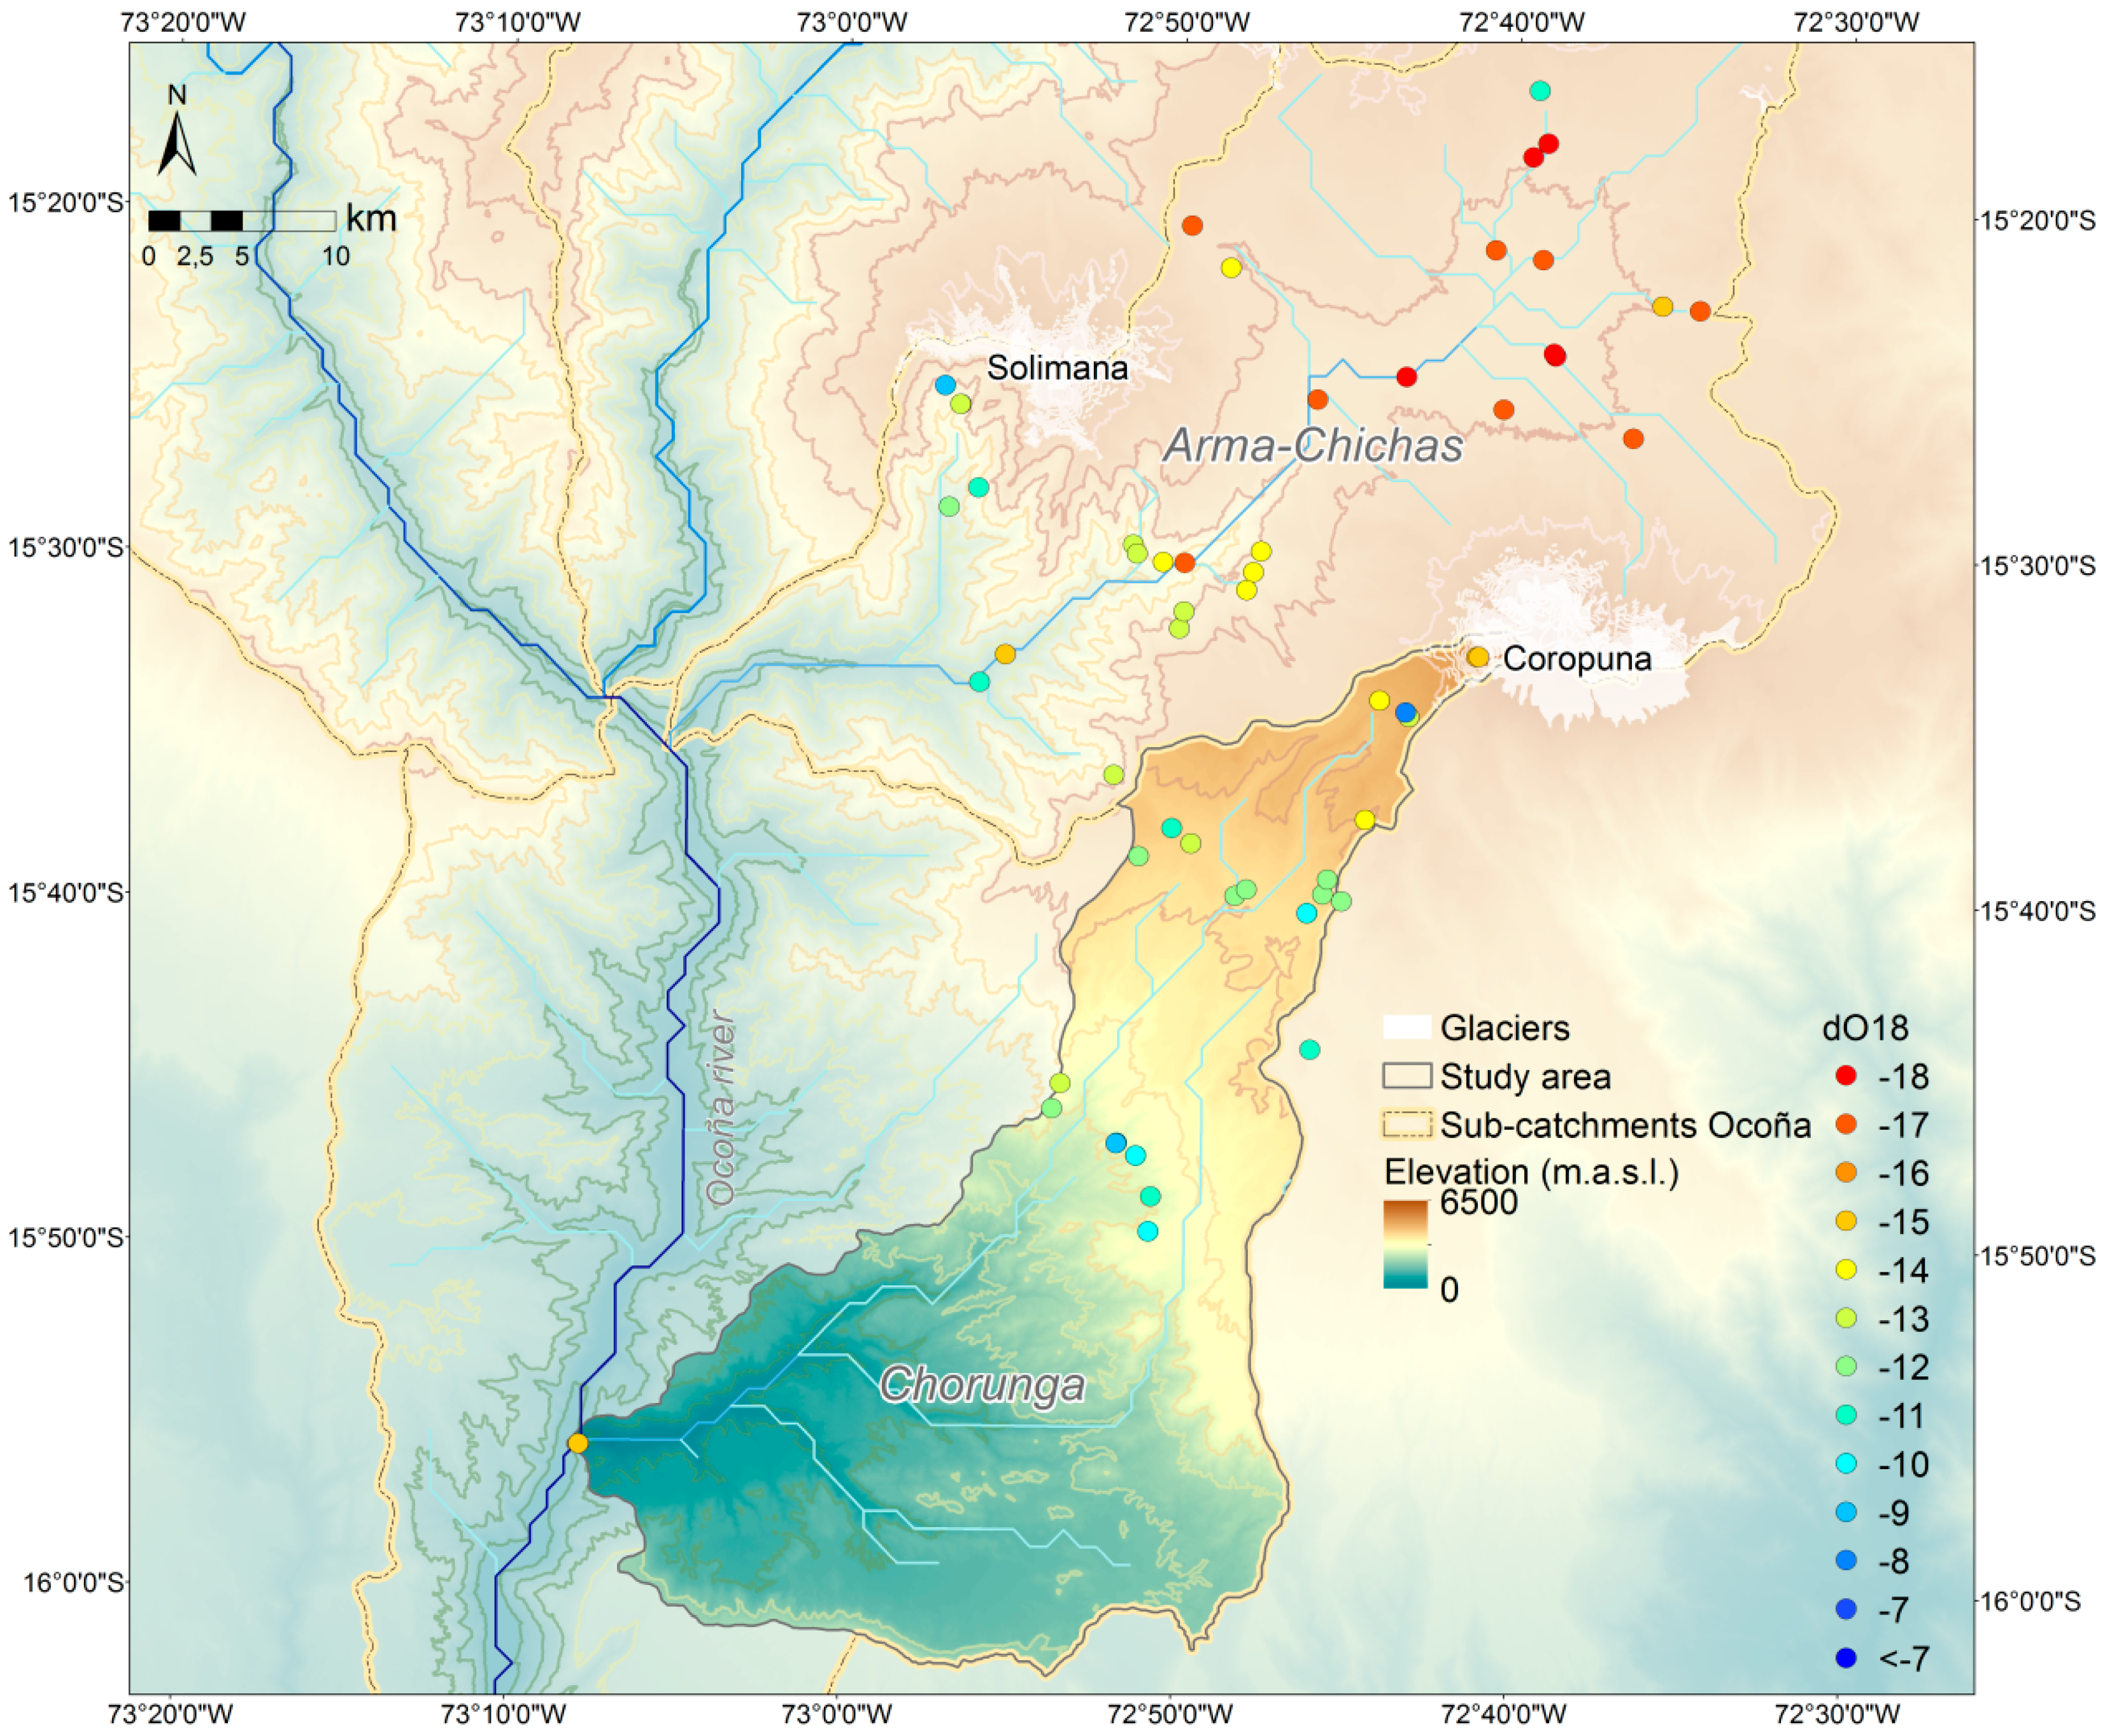
The d18O of the water in springs is less negative than the d18O of water close to the glacier (Figure 4). This indicates the water in the springs is comparable to rainwater at the same elevation. The isotopic composition of rivers shows that they mainly consist of water originating from higher elevations of the catchment, as they have a lower d18O than precipitation at the elevation of the sample locations. In conclusion, the hydro-chemical analysis demonstrates that rainfall is the main source of water in the springs and excludes meltwater as a major source. Hence, in the Chorunga catchment the effect of glacier melting on spring water availability is expected to be limited, as this study has established that the water from the springs is predominantly originating from rainfall in the catchment. This is in contrast with water in other parts of the Ocoña basin, like the Chichas River and the Ocoña River, which are much more dependent on water from the glacier. This is indicated by the more negative d18O values of the samples taken in these rivers (Figure 4). Other studies in the Andes also indicate glaciers as the main source of water for rivers [62].
Figure 4. Map showing the isotopic composition (d18O) of water at sample locations in the Chorunga and Chichas catchments.
Sustainability 07 01742 g004

3.2. Household Vulnerability

The general characteristics of the 94 households interviewed are summarized in Table A2 of the supplementary material. The average age of the interviewed subjects was 57 years and this is higher than the average age of adults in the area which is 40 years [37]. Their income was circa 175 Euros/month (660 soles/month). The results are shown for a group consisting of all respondents (n = 94), and for a second group consisting of households that are primarily dependent on agriculture for their livelihood (n = 73). The second group is included in the analysis to account for the dependency on water for their livelihood, and see if this influences vulnerability. The households excluded in the second group are primarily dependent on other sources of income (e.g., pension, government job, etc.).
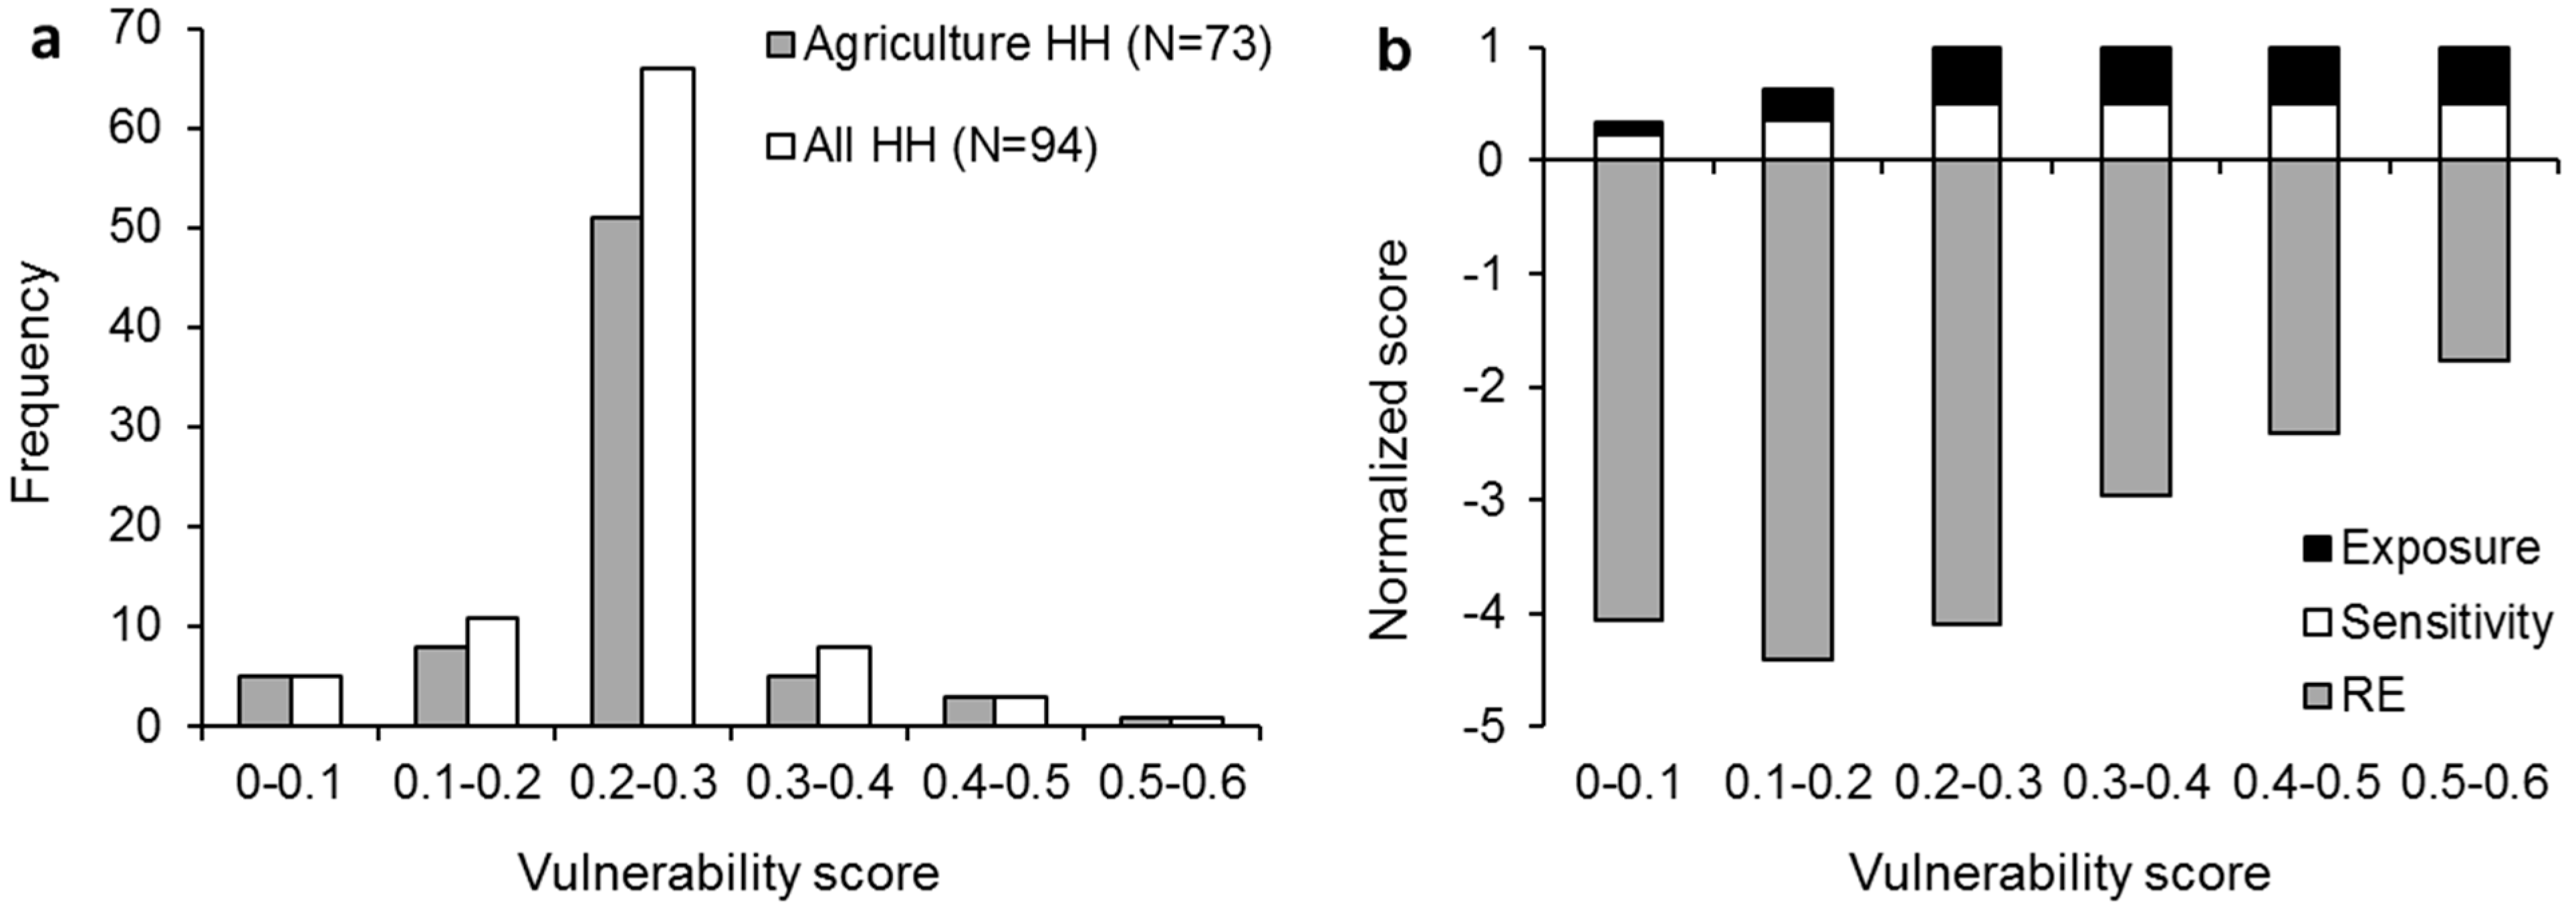
For the interviewed households the index of vulnerability to drought varies between 0.07 and 0.57. A score of 1 indicates that a household is very vulnerable, and a score of 0 indicates that the household is totally not vulnerable. Figure 5a shows the frequency distribution of the scores for the agricultural households and all the households. The majority of households score between 0.20 and 0.30. The agricultural households have a larger variance than the non-agricultural households, which range between 0.10 and 0.40. Variations between households are caused by differences in perceived exposure, sensitivity and effectiveness of adaptation measures. Households with lower scores perceive themselves to be less exposed and less sensitive to droughts compared with households with higher scores, and a low vulnerability can also be the result of a higher RE. Figure 5b shows for the agricultural households the average normalized values of the three components of the vulnerability index: exposure, sensitivity and response efficacy (see Section 2.4) The figure shows that households with a vulnerability score up to 0.3 have on average a high RE. Households with a vulnerability score of more than 0.2 have the maximum value of 1 for risk (combination of exposure and sensitivity).
Figure 5. (a) Frequency distribution of households based on their vulnerability; (b) average normalized score for the vulnerability classes for agricultural households.
Sustainability 07 01742 g005
By conducting a Spearman rank correlation analysis, we assessed which factors are significantly correlated to the vulnerability index. The resulting coefficients of the analysis of the relationship between socio-economic factors and the vulnerability index are shown in Table 2. At a significance level of p = 0.01, with a two-tailed test, the following factors are significantly negatively correlated for both groups: water entitlement (in hours per year), area of irrigated land, income, and education. Other factors such as water entitlement (in riego per year), age, number of cows, economic situation, and irrigation frequency, were not significantly correlated with household vulnerability. It is interesting that entitlement to water reported by each households shows significant correlation with vulnerability, whereas information on the entitlement to water as provided by the Water Association in riego/year is not significantly correlated with vulnerability. This might be because the volume of water represented by one riego varies between the reservoirs that are used by the households in this survey. Furthermore, this volume cannot be compared between the households. The number of hours a household receives water is comparable between the households. Another reason could be that households themselves are better aware of their water entitlement than the Water Association.
For all factors, the correlation coefficient increases when comparing the results of all the households with the results of agricultural households. This indicates that the agricultural households have a stronger dependency on water and related factors for their livelihoods. Water entitlement in h/year shows the strongest correlation of −0.52 for agricultural households and −0.39 when considering all the households. Thus the vulnerability of the household is negatively correlated to water entitlement. It indicates that households with a larger entitlement are less vulnerable to droughts. This might imply that households with a small entitlement do not have enough water during a drought, whereas households with a greater entitlement still have sufficient water to sustain their agricultural production. The sensitivity of households to droughts has a significant correlation of 0.35 with the factor water entitlement, which supports this argument. This correlation between vulnerability and entitlement or access to water is comparable to earlier studies [36,65,66]. The socio-economic factors also are significantly correlated to each other (Table A3 of the supplementary material), so we cannot determine which factor is explanatory for vulnerability on the statistical analysis alone. For the four factors, we assess to which component of vulnerability they significantly correlate (Table 2) and explore the possible causal relationship behind the correlation.
Table 2. Spearman rank correlations for the socio-economic factors that are significantly correlated to vulnerability (HH = households).
Socio-Economic Factors
Water Entitlement (h/year)Area Irrigated landIncomeEducation
All households
Vulnerability−0.39 **−0.33 **−0.28 **−0.27 **
Sample size85889393
Exposure (N = 88)0.080.090.21 *0.24 *
Sensitivity (N = 88)0.35 **0.29 **0.36 **0.32 **
RE (N = 88)−0.030.21 *0.32 **0.29 **
Agricultural households
Vulnerability −0.52 **−0.40 **−0.37 **−0.32 **
Sample size65687373
* =significant at p = 0.05 level; ** = significant at p = 0.01 level.
The results show that households with a larger area of irrigated land are less vulnerable. The respective significant correlations for this factor with sensitivity and the RE are 0.29 and 0.21. This implies that households with a small area of irrigated land are more sensitive to drought than households with a larger area of irrigated land, and perceive the adaptation measures less effective for their household.
For the factor income, all three components of the vulnerability index are significantly correlated with the following coefficients: exposure 0.21, sensitivity 0.36, and RE 0.32. These results indicate that households with a lower income are more exposed to droughts, more sensitive, and less willing to adapt compared with households with higher incomes. This implies that people with higher incomes value the adaptation measures as more important than people with lower incomes.
The factor education is significantly correlated with the three components of the vulnerability index. The coefficients are: exposure 0.24, sensitivity 0.32, and RE 0.29. Higher education appears to make people less sensitive to drought, and makes them value adaptation measures as more important than do people with lower education.
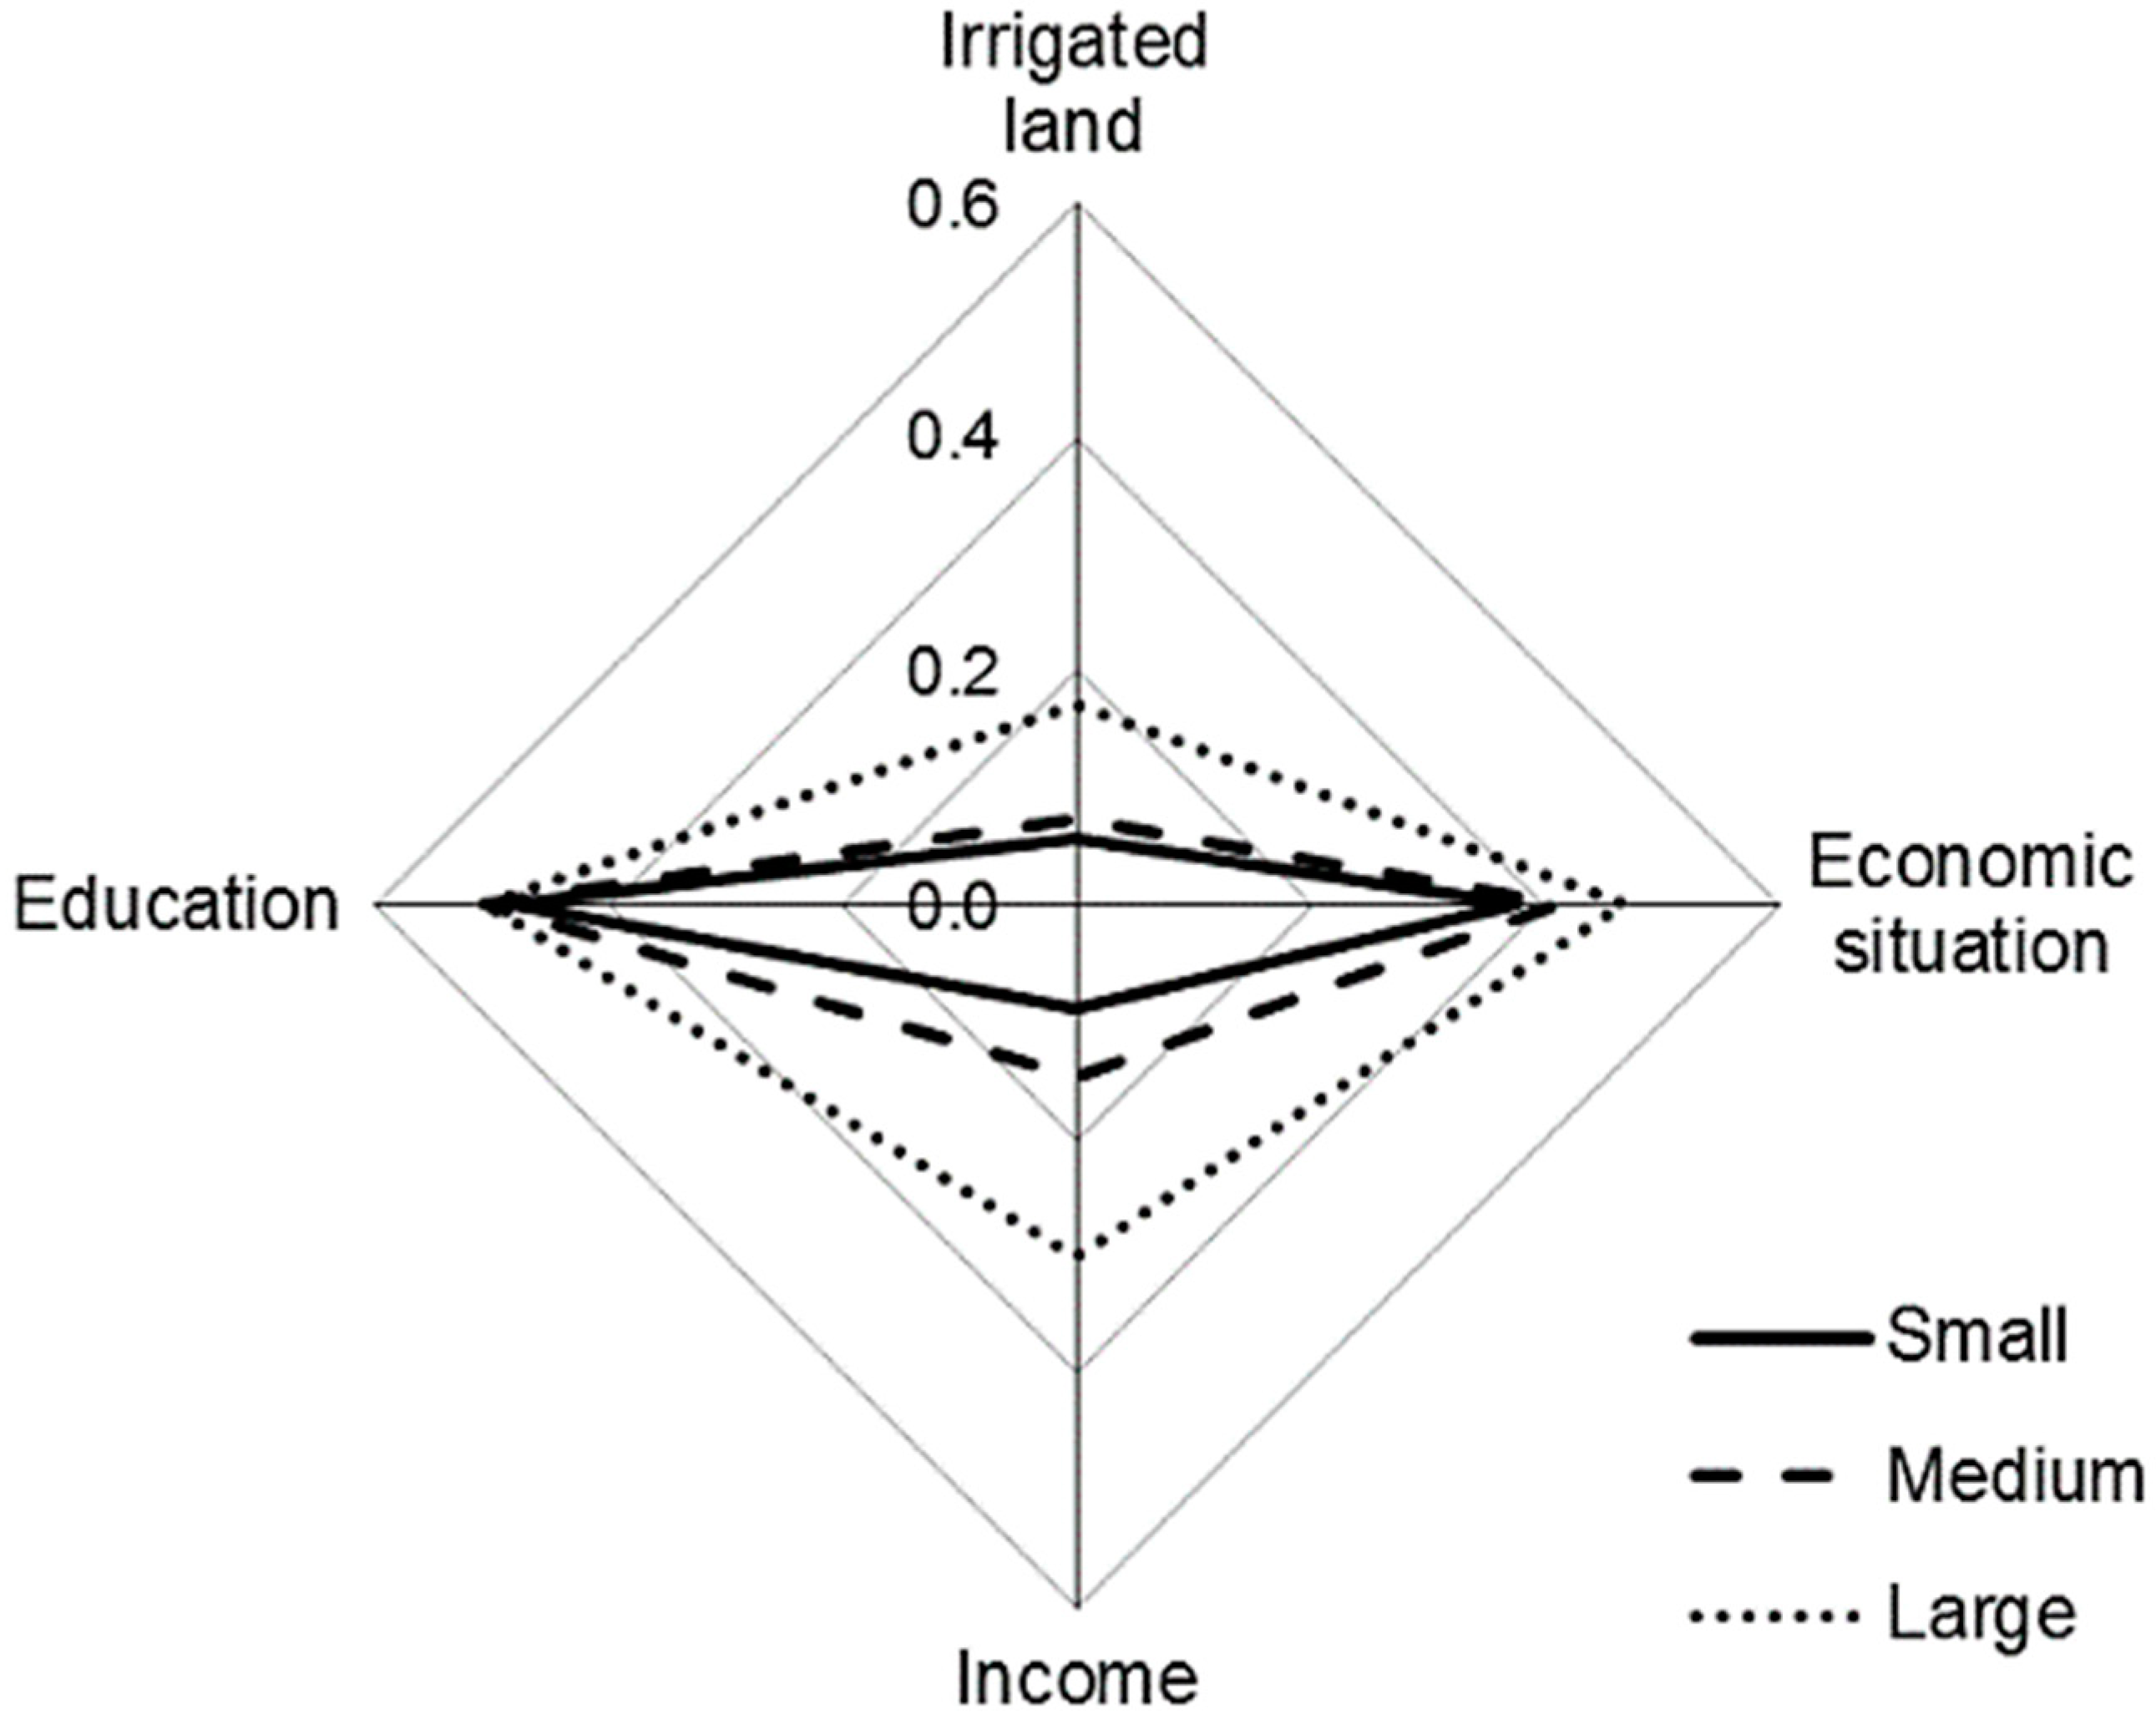
Subsequently, we explored the causality of the significant correlations between the socio-economic factors. The household water quantity entitlement determines the total amount of irrigation water a household gets. It is very difficult for farmers to buy water rights in the area, since almost no household offers them for sale. In addition, the majority of households cannot afford to buy water because they lack financial resources. Hence, the availability of irrigation water per household is regarded as fixed over time. Therefore, other factors such as the area irrigated land and the economic situation depend on the household water rights. We assessed whether the results of the survey on these factors are in line with the household water quantity entitlement. These are classified in three groups: small users (<3 h); medium users (3–25 h); and large users (<25 h). Figure 6 shows how the socio-economic factors vary between the groups. Per factor, the relative value is given as the fraction of the maximum value that is possible for the factor. The figure shows the critical role of water entitlement for the socio-economic conditions.
Figure 6. Household water quantity entitlement (h/year) as a determinant for the socio-economic conditions of agricultural households (factors are normalized).
Sustainability 07 01742 g006
The economic situation describes the affluence of a household. Respondents were asked to score their economic situation on a scale ranging from 1 “there is sometimes not enough food” to 5 “have a/can afford a car and own/can afford a good hous” (see question 2B in Supplementary material Table A1). The average economic situation of households increases with increasing water entitlement. Respondents were asked to score their economic situation on scale ranging from 0–5. Large users give an average value of 2.3 for their economic situation, which means that these users, on average, do not have problems with food, clothing and health care. The small users have an average value of 1.9, indicating that they usually do not have many problems with food and clothing, but that they cannot afford health care costs. The average income shows the same pattern as economic situation: income increases with increasing water entitlement, and the income of the large users is 3.4 times as high as that of the small users.
The average area of irrigated land increases with the increasing water entitlement of the household: from 4.6 ha of irrigated land for small water users to 13.7 ha for large users. Thus, the amount of water appears to determine the area of irrigated land for a household, which in turn influences the production. Figure 6 also shows that large users have, on average, a higher education than the medium and small users.

3.3. Adaptation Measures

The results of the vulnerability analysis show that vulnerability is strongly linked to the household water availability. The results from the hydrological model assessment of climate change impacts show that eventually less water will become available, as the glacier will disappear, precipitation will reduce, and temperatures will rise, which will lead to an increase in evaporation. As the springs in the Chorunga catchment are mainly fed by local precipitation they are affected by the change in rainfall and the increase in evaporation. Hence, taking into account the current dependence on water and the impacts of projected climate change, most adaptation measures that were selected for implementation from the initial long list of measures aimed to increase total water availability for the users and to improve water-use efficiency. Table 3 shows the selected adaptation measures for implementation in pilot projects [67,68].
Table 3. Selected adaptation measures and their effects, with the aim to increase total water availability for the users and to improve water use efficiency.
MeasureDescriptionEffect of implementation
Surface storage damsConstruction of four surface-storage dams in the Chorunga catchment (see Figure 2). These dams have capacities between 110,000–220,000 m3 and are designed to store (rain)water during the wet season, to be used during the dry season. The idea for building reservoirs was new in the area and was developed after a project meeting where this measure was presented by an Ethiopia team that was familiar with this type of measures.The first two dams were designed and constructed by the local NGO as pilot schemes. Two additional dams were financed by the municipalities, and the local NGO contributed its knowledge for the design and construction. The evaluation shows an additional 5 hectares of land can be irrigated using these dams. Two pilot dams were filled with water during the rainy season, and they contained water far into the dry season [69].
Efficient water use on fieldsIntroduction of low-cost gravity drip irrigation systems for more efficient use of water on the fields. Farmers have water-use rights which are fixed. They expressed their wishes to be able to produce more crops with the same amount of water. The investment costs for locally produced drip irrigation systems are US$ 1750 per hectare, half of which was covered by the farmer. This price excludes labor costs, which was supplied by the local communities.The short evaluation by Van Steenbergen [69] after the end of the project shows that the yield of vegetables and alfalfa as fodder on the pilot plots was doubled to tripled; water needs were halved; and time spent on irrigation was reduced by 75% [69].
Change irrigation frequencyChange in the frequency of irrigation (from 60–20 days) at two Irrigation Commissions, consisting of farmers and water users of the area, and by reorganizing the traditional systems of water distribution by to make the circle shorter so that farmers have more frequent access to water, in order to reduce the need to borrow water and enhance the water-use efficiency in the fields. The local water administrative agency of ANA joined this activity, promoting exchange of knowledge.The effect of this measure has not been evaluated as it was implemented at the end of the project.
Protection upstream forestsProtection of the “Polylepis” forests, and the project invested in fencing. These forests are threatened by overexploitation for charcoal production. Some areas have been assigned the status of private conservation areas, where the forest can only be used by the communities living nearby. Secondly, forests and their roots can enhance the infiltration of surface water to groundwater, which can be used at a later time.Implemented, but the effect is not assessed in this research.
Introduction new cropsIntroduction of a water efficient “tara” crop, which produces seeds that are sold on the market (e.g., for cosmetics, paints, shoe polish), and after 4 years they are large enough to serve as wind shields for avocado trees. These avocados are commercial crops, which increase the return on agriculture. Seedlings were grown in a tree nursery and then distributed over the communities when they were big enough. This tree nursery was quickly used again to start growing the seedlings of other trees too.The pilot scheme with Tara was implemented with a local school and served as a project with educational, reforestation, and commercial aspects. Besides these trees, several farmers started growing other crops after introducing efficient irrigation techniques, as they could irrigate a larger area. These crops are garlic, maize, and tomatoes, and were sold at the local markets.
Water harvestingImproved access to drinking water via two roof-water harvesting systems. These structures reduce walking distances to drinking water for families, and increase the useable water in the catchment.Implemented, but the effect is not assessed in this research.

4. Overall Discussion and Conclusions

This paper has described the implementation of a stepwise approach to adaptation, including: stakeholder participation; measurements of environmental conditions; and modeling. Here, we discuss the findings on climate change impacts, the vulnerability analysis, and the step-wise participatory approach. We end by discussing the policy implications of the findings.

4.1. Climate Change

The modeling activities showed that under climate change the glacier volume decreases and eventually disappears and that river discharge reduces. However, through hydro-chemical analysis of surface water, a better understanding of the hydrological system was achieved, showing that a decrease in meltwater is not the most important factor that influences the amount of irrigation water available in the study area. It appeared that the springs in the Chorunga catchment are mainly dependent on rainwater, and not on meltwater from the glacier. However, as a result of climate change, precipitation is projected to decrease by 27% in 2050, and temperatures are projected to increases leading to increased potential evaporation. These changes are expected to negatively affect water availability during the growing season, and to increase the exposure of the communities to water shortages. The discharge in a comparable catchment is projected to decrease by almost 50% towards 2050 [70], and for the Ocoña River as a whole the projected decrease is circa 31%. The latter result is comparable to the results of the analysis of other river basins in the Andes [42,62]. The larger decrease simulated at the catchment scale might be related to the scale of the modeling. At smaller scales, the impacts for specific areas can be more extreme, while, on the basin scale, these effects might be diluted due to the averaging out the input of multiple catchments. The trends in reduced water availability and associated negative impacts on the communities are already observed in other parts of the Andes [36].

4.2. Use of the Vulnerability Concept

Even though research shows that it is difficult to quantify vulnerability [10,71,72], we applied an approach to quantitatively assess vulnerability in order to support the process of community-based adaptation. In addition to existing theoretical approaches, this bottom-up approach provides a methodology for determining the vulnerability of households. We found that vulnerability ranges from 0.07–0.57 on an ordinal scale from 0–1. The largest group of households scores in the range 0.20–0.30, indicating that the households do not perceive themselves as very vulnerable. Interestingly, all households with a vulnerability of above 0.2 have the maximum score on risk, which indicates that they perceive themselves to be very exposed and very sensitive to risk. However, most of the respondents consider the identified adaptation measures as very effective (RE) and strongly reduce their vulnerability. The households in the study area are generally seen as the more vulnerable communities in the country [73]. This does, however, not directly follow from the index used in this paper. The RE might lead to an underestimation of the vulnerability, as the households might not have the means to implement the adaptation measures (economic, social, institutional, technological) (e.g., [23,74]), or do not perceive their household to be able to implement the indicated adaptive measures themselves [21,22,75]. This shows a limitation of our method, which uses data from a survey that was designed to identify adaptation measures that were considered to be effective by households. Therefore the RE is high for many respondents and hence perceived vulnerability relative low. In future research it is, therefore, advisable to gather additional data on whether the households consider themselves able to implement the measures that they consider to be effective, and if they intend to take the measures [76]. However, the method reveals relevant differences between households in the same region, and is useful as a tool to explore relative differences within the community.
The survey results also reveal information on the characteristics of household vulnerability to drought. The factors significantly correlated with vulnerability are: water entitlement in h/year; area of irrigated land; income; and education. Households with the smallest water entitlement appear most vulnerable, due to their relatively high sensitivity to droughts. The other factors, which are area of irrigated land and income, are strongly related to the water entitlements. Hence, the amount of water is the key determining factor. This is in line with other studies on factors influencing vulnerability [36,65,66]. The factors income, area of irrigated land and education are also significantly related to the households’ RE. When focusing solely on the households for which agriculture is the main economic activity, the correlations between the factors and vulnerability are even stronger. This indicates that there is a relationship between the households’ vulnerability and if they have a water-dependent livelihood.
The vulnerability index developed in this study proved to be appropriate for communicating about vulnerability to climate change and its correlating factors with different stakeholders. The outcomes of the RE assessment are relevant for policy making, since they are an indication of the factors on which policy could focus to reduce the vulnerability to drought. Furthermore, a vulnerability index can be applied to monitor the effectiveness of the (adaptation) measures for the households by repeating the survey some years after the implementation of the measures. After implementation the sensitivity to drought of households that have taken adaptation measures should have reduced.

4.3. Stepwise Approach

Mansuri and Rao [26] argue, on the basis of a review of the World Bank project portfolio, that community-based and participatory projects are best undertaken in a context-specific manner, with a long time horizon, and careful and well-designed monitoring and evaluation systems. We followed this suggestion and included communities in each step of the decision-making process, supported by stakeholders, ranging from NGOs and government organizations to experts and knowledge institutes. The six steps of the participatory approach helped to structure the process of developing and implementing adaptation measures, and its interaction with stakeholders throughout the process is comparable to the study of Huggel [73], which has been published recently. Several of the measures were implemented, and were partly funded by the municipality and/or by the participants. This indicates that the measures were accepted by the local communities, and supports the premise that participation leads to more sustained and better accepted decisions [15,25,26,27,28,77]. Additionally, this joint funding might help to increase the community’s adaptive capacity, as argued by Murtinho et al. [78]. They found that, if external support is contributing to the internal efforts and resources of the community, this strengthens their adaptive capacity. However, if external support is unsolicited, the opposite might be the outcome. As a result of the stepwise approach different adaptation measures were selected for implementation than would have been selected if a top-down approach had been followed. At the start of the project, the main problem of the area seemed to be the melting of the glacier, which would affect water availability. Due to better insights into the water system and the impacts of climate change, the main problem appeared to be efficient water use, and storing water in the area where it is used, instead of creating storage at high altitudes close to the glacier. The selected adaptation measures in our study are comparable to those described in [36] for a similar catchment in Bolivia, and to those identified in [78] for 111 rural communities in the Columbian Andes, which also used a stakeholder approach in their studies. These measures are in line with adaptation options as reported in, for example, the National Adaptation Plan of Action, and the Second National Communication on adaptation of Peru [79]. However, in our studies the suitability of the measures have been evaluated using different methods, which is not the case for many of the measures reported in NAPAs. As our study area is representative for other Andean farmer communities, the results are also relevant for policymakers and practitioners in other parts of the Andean region.
After the implementation of the measures, there was no possibility to thoroughly evaluate the effects of the different measures on the households. A short evaluation was carried out by the funding agency, which indicated that most of the measures were having positive impacts on the users [67], and that the approach was suitable for projects in these kinds of areas. However, to be able to learn about the effectiveness of the approach, these types of projects should include an evaluation of the measures several years after implementation in terms of their project design and project funding. This evaluation should include an assessment of the distribution of benefits within the community, as a risk associated with these projects is that only people with better access to power are reached, and the most vulnerable households are marginalized [26].
By combining physical-hydrological and socio-economic information the approach improves the access to information and knowledge networks. According to [73,80] this is lacking in most parts of the global South, especially at the community level. Hence, making information available can empower people to help reduce their vulnerability [47].

4.4. Policy Implications

From the onset of the project both the local and provincial governments were actively involved. They were informed on developments and insight that evolved within the consortium, in order to ensure that they would support the proposed measures. The local dialogues consisted of engagement with the municipalities to discuss the inclusion of different measures in local development budgets. Furthermore, the activities of the project were integrated in the local Water Platform, which brings together all the different parties concerned with the management of water resources in the area. We also linked the project to the process of developing a river basin management plan, especially using the outcomes of consultation tables on upstream and downstream issues and on the results of downscaling climate change scenarios. Also the ex-ante assessments of the different adaptation measures were shared, as these are important when considering upscaling and replication of the developed measures [81,82,83,84].
Using the results of the project, the regional government of Arequipa declared the necessity to create a Consejos de Cuencas Regionales, or River Basin Management Committee, for the Ocoña basin. In December 2011 this activity resulted in a meeting with the main stakeholder groups (mayors, and representatives of mining and agricultural groups) to establish a joint management plan, which should feed into the basin plan at a later stage.
The stepwise approach proved to be suitable to structure the process of developing and implementing adaptation measures jointly with a wide range of stakeholders in a rural area in Peru. It enabled the inclusion of information ranging from the local to the global scale and led to the joint implementation of several community-based measures.

Acknowledgments

This paper is the result of research carried out in the context of the ADAPTS project (2007–2012), funded by the Dutch Ministry of International Cooperation (contract 14376/DMW0106407). The authors would like to thank AEDES for their support during the research in the field and Acacia Water and Both ENDS for their constructive discussions and making data available. We also want to thank two anonymous reviewers.
We acknowledge the international modeling groups for providing their data for analysis, the Program for Climate Model Diagnosis and Intercomparison (PCMDI) for collecting and archiving the model data, the JSC/CLIVAR Working Group on Coupled Modeling (WGCM) and their Coupled Model Intercomparison Project (CMIP) and Climate Simulation Panel for organizing the model data analysis activity, and the IPCC WG1 TSU for technical support. This work, including access to the data and technical assistance, is provided by the Model and Data Group (M&D) at the Max-Planck-Institute for Meteorology, with funding from the Federal Ministry for Education and Research and by the German Climate Computing Centre (DKRZ).

Author Contributions

Ralph Lasage is the lead author and together with Jeroen Aerts he designed the research. Sanne Muis and Carolina Sardella conducted the household survey and the analysis of the data was carried out by Sanne Muis, Carolina Sardella, Michiel van Drunen and Ralph Lasage. All of the named authors were involved in the writing of the paper. All authors read and approved the final manuscript.

Appendix A

Table A1. Questionnaire.
General household information
Village:Household name:
Household Nr.:Spoken to:
Riegos:GPS point:
GPS coordinates:

A1. Household

a. What is the composition of the family (sex and age)? And what is the educational level of the adults?
Education level adults: 99 = Unknown / 0 = None / 1 = Elementary (incomplete) / 2 = Elementary / 3 = Highschool (incomplete) / 4 = Highschool / 5 = Superior
b-1. Did family members migrate out of the region in the past five years? No / Yes
b-2. If yes, can you give the reason? 99 = unknown / 0 = none / 1 = labor /2 = family / 3 = education / 4 = health / 5 = lack of water

A2. Economic Situation

a-1. What is your main livelihood activity? 99 = unknown / 0 = not working / 1 = agriculture / 2 = livestock breeding and animal products / 3 = private business / 4 = pension or social assistance / 5 = house holding / 6 = paid labor government / 7 = paid labor private sector / 8 = other
a-2. Do you have other sources of income besides your main livelihood activity? If yes, could you describe which and how they generate income during the year? 99 = unknown / 0 = not working / 1 = agriculture / 2 = livestock breeding and animal products / 3 = private business / 4 = pension or social assistance / 5 = house holding / 6 = paid labor government / 7 = paid labor private sector / 8 = other
b. How do you assess the economic situation of your household?
CodeValueAnswer
0 Do not know
1--There is sometimes not enough food available
2-No severe problems with food and clothes
3+/-Enough money for food, clothes, health care
4+Enough money for some luxurious objects like motorbikes
5++Good, have a/can afford a car and own/can afford a good house
c-1. What do you earn with these sources of income a month (in /s)?
c-2. Has your income changed in the past years and can you give a reason for this change?
Increased / Decreased / Stayed the same
Reason: 99 = unknown / 0 = none / 1 = water-related farming practice / 2 = land quality / 3 = market demand / 4 = inadequate water / 5 = more water / 6 = better community organization / 7 = mining companies / 8 = migration / 9 = family support / 10 = diseases/plagues / 11 = inflation /12 = other
d. Do you have monetary savings (in /s)? yes / no
e. What would you sell if you have a lack of money? 99 = unknown / 0 = none / 1 = land / 2 = animals / 3 = house / 4 = harvest / 5 = labor / 6 = water

A3. Agriculture and Livestock Breeding

a. How much land do you…? (topos)
TotalIrrigatedNon-irrigated
Own
Rent
b. What crops/trees do you grow on your farm?
CropsToposProductionOwn consumptionCommercialPrice per…
Maize
Potatoes
Alfalfa
Beans
Quínoa
Barley
Wheat
Fruit treesNo. of treesProductionOwn consumptionCommercialPrice per…
c. Which methods do you use to improve the land productivity? Soqas and heras / Sucros (contour bands) / Chemical fertilizer / Natural fertilizers
d. Do you own livestock? How many per species, and for own consumption / sale, and price per animal
e-1. Does the harvest fail every once and a while? If yes, once in the how many years? What is the reason for the failure? 99 = unknown / 0 = no / 1 = yes, frost / 2 = yes, plagues / 3 = yes, floods / 4 = yes, inadequate water /
5 = yes, lack of support 6 = reason unknown
e-2. What would you do if this happens (sell property, migrate, lend from neighbor, etc.)? 99 = unknown / 0 = nothing / 1 = adjustment in crops / 2 = invest in water / 3 = social network / 4 = invest in land quality / 5 = change growing season / 6 = invest in pesticides
f-1. If you would have a lot of money, how would you invest this to overcome years with bad harvests? 99 = unknown / 0 = nothing / 1 = invest in crops / 2 = invest in water quantity / 3 = invest in irrigation quality / 4 = invest in land quality / 5 = invest in land quantity / 5 = bank / 6 = technical support / 7 = invest in education / 8 = technical solution (green house)
f-2. What would you do if you had more water available? 99 = unknown / 0 = nothing / 1 = produce more crops / 2 = produce more alfalfa / 3 = invest in livestock / 4 = invest in land quantity / 5 = invest in reservoirs / 6 = invest in irrigation techniques

A4. Water

a-1. How much water do you use? For domestic / irrigation / Livestock / other
a-2. Is there a change compared to 5 years ago and can you indicate a reason for this change?
Change: 99 = unknown / 0 = stayed the same / 1 = increased / 2 = decreased
Reason: 99 = unknown / 0 = don't know / 1 = more efficient / 2 = less water available / 3 = more heat / 4 = others
a-3. In which period would you like to receive more water?
Jan.Feb.MarchApr.MayJuneJulyAug.Sept.Oct.Nov.Dec.
b. Does your family pay for the use of domestic water and the use of irrigation water?
c-1. How often do you irrigate your crops?
c-2. Do you agree with the distribution of water in your water board?
c-3. How often would you like to receive irrigation water for your crops?

A5. Climate Change

a-1. Do you think the following factor has changed compared to 10 years ago?
Before (10 years ago)PresentSameDon’t know
When did it start? When did it finish? When does it start? When does it finish?
Rainfall
a-2. Do you think the following factors have changed compared to 10 years ago?
IncreasedDecreasedSameDon’t know
Rainfall intensity
Heat
Frost
b. How frequent did the following threats occurred in the last 10 years?
ImpactsDo not knowNot frequent Neutral Very frequent
Droughts
Floods
Erosion
Freezing of crops
Diseases (humans)
Plagues (animal, plants)
Earthquakes

A6. Sensitivity

a. Do you think will have the most negative influence on your livelihood?
ImpactsDo not knowNo influenceNeutralLarge influence
Droughts
Floods
Erosion
Freezing of crops
Diseases (humans)
Plagues (animal, plants)
Earthquakes
Disappearing of glaciers
b-1. Taken into account the impact discussed before, how vulnerable do you consider your livelihood to climate related impacts compared to your neighbors? I have an average vulnerability / I have a higher than average vulnerability / I have a lower than average vulnerability
b-2. Taken into account the impact discussed before, how vulnerable do you consider your livelihood to climate related impacts compared to other communities? I have an average vulnerability / I have a higher than average vulnerability / I have a lower than average vulnerability
b-3. Did you ever experience a seasonal drought since you live here?

A7. Willingness to adapt

a-1. How will you react to more frequent droughts/ less water available during growing season in order to prevent failure of your harvest? 99 = unknown / 0 = do nothing / 1 = cultivate less / 2 = change crops / 3 = less livestock / 4 = increase reservoir capacity / 5 = improve irrigation / 6 = organize better / 7 = migrate/other job / 8 = invest in water / 9 = buy water /10 = other
a-2. What should/could the community do to react to more frequent droughts? 99 = unknown / 0 = do nothing / 1 = organize better / 2 = help government / 3 = technical support / 4 = dams/reservoirs / 5 = share harvest / 6 = migrate / 7 = improve irrigation system / 8 = stimulate new employment / 9 = adapt crops
b-1. How will you react to more intense rainfall during growing season? 99 = unknown / 0 = do nothing / 1 = discharge channels / 2 = plant crops / 3 = sell harvest / 4 = migrate / 5 = decrease frequency riegos
b-2. What should/could the community do to react to more intense rainfall? 99 = unknown / 0 = do nothing / 1 = organize better / 2 = dams/reservoirs / 3 = plant / 4 = discharge channels / 5 = technique / 6 = other
c. Can you rank the priorities of the following measures / strategies for you and for the community to react to more droughts?
Fill in: I = individual C = communityNot EffectiveNeutralVery EffectiveDon’t know
---+/-+++
Do nothing
Change crops
Change planting dates
Change livestock
Conserve upstream vegetation
Conserve wetlands
Increase reservoir capacity
Improve water distribution
Improve agricultural practices in the community
Mobilize the community to act together
Change profession
Take a second job
Migration
Micro credit
d. Can you rank the adaptive measure under minor CC (10% less water during growing season) and major CC (once in the years no water during growing season). 1 Improve irrigation channels / 2 Increase storage of reservoir / 3 Increase storage upstream / 4 Drip irrigation / 5 Roof water harvesting / 6 Change water distribution system, every 15 days / 7 Get different job / 8 Emigrate
e-1. Who do you think is responsible to arrange adaptive measures to climate related hazards? 99 = unknown / 0 = don’t know / 1 = government / 2 = community / 3 = NGO’s / 4 = foreigners / 5 = water board
e-2. What does the government do, does it help, nothing, opposes? 99 = unknown / 0 = do nothing / 1 = help / 2 = oppose
e-3. What do you expect from the government? 99 = unknown / 0 = do nothing / 1 = help / 2 = improve access to microcredits / 3 = technical help / 4 = invest in dams/reservoirs and new water sources / 5 = improve irrigation system
Table A2. General characteristics of interviewed households.
MeanSD
Average age interviewed (years)6015.9
Average age husband/wife (years)5715.3
Average number of children part of household1.411.39
0–4 years (%)4
5–15 years (%)33
>15 years (%)63
Average educational level a2.71.4
Economic situation:
Farming as primary activity (%)44
Average economic situation b2.00.77
Average income (soles/month)660801
Households with monetary savings (%)0.1
Agriculture and water:
Average water entitlement (h/year)3674
Average irrigated land (ha)5.12.3
a = Scale 1–5, 0 = no education, 1 = incomplete primary education, 2 = primary education, 3 = incomplete secondary education, 4 = secondary education, 5 = higher education; b = Scale 1–5, 1 = sometime s no food, 5 = big house, car.
Table A3. Spearman correlation socio-economic factors. Spearman correlations for the determining factors.
Water Entitlement (h/year)Area irrigated LandIncomeEducation
Water entitlement (h/year)n.a.0.386 **0.374 **0.119
Area irrigated land0.386 **n.a.0.543 **0.350 **
Income0.374 **0.543 **n.a.0.551 **
Education0.1190.350 **0.551 **n.a.
* Correlation is significant at the p = 0.05 level (2-tailed); ** Correlation is significant at the p = 0.01 level (2-tailed).

Conflicts of Interest

The authors declare no conflict of interest.

References

  1. Instituto Nacional de Estadística e Informática (INEI). The 2007 National Census: XI of Population and VI of Houses; Institute of National Statistics and Information: Lima, Peru, 2007. [Google Scholar]
  2. Winterhalder, B. The ecological basis of water management in the Central Andes: Rainfall and temperature in southern Peru. In Irrigation at High Altitudes: The Social Organization of Water Control Systems in the Andes; Mitchell, W.P., Guillet, D., Eds.; American Anthropological Association: Washington, DC, USA, 1993; Chapter 2; pp. 21–67. [Google Scholar]
  3. Branch, N.P.; Kemp, R.A.; Silva, B.; Meddens, F.M.; Williams, A.; Kendall, A.; Vivanco Pomacanchari, C. Testing the sustainability and sensitivity to climatic change of terrace agricultural systems in the Peruvian Andes: A pilot study. J. Archaeol. Sci. 2007, 34, 1–9. [Google Scholar] [CrossRef]
  4. Ertsen, M.W. Structuring properties of irrigation systems: Understanding relations between humans and hydraulics through modelling. Water Hist. 2010, 2, 165–183. [Google Scholar] [CrossRef]
  5. Vuille, M.; Francou, B.; Wagnon, P.; Juen, I.; Kaser, G.; Mark, B.G.; Bradley, R.S. Climate change and tropical Andean glaciers: Past, present and future. Earth Sci. Rev. 2008, 89, 79–96. [Google Scholar] [CrossRef]
  6. Kundzewicz, W.Z.; Budhakooncharoen, S.; Bronstert, A.; Hoff, H.; Lettenmaier, D.; Menzel, L.; Schulze, R. Coping with variability and change: Floods and droughts. Nat. Resour. Forum 2002, 26, 263–274. [Google Scholar] [CrossRef]
  7. Guevera-Gil, A. Water rights and conflicts in an inter-Andean watershed: The Achamayo river valley, Junin, Peru. In Out of the Mainstream: Water Rights, Politics and Identity; Boelens, R., Getches, D., Guevara-Gil, A., Eds.; Earthscan: London, UK, 2010; pp. 183–196. [Google Scholar]
  8. Adger, W.N. Vulnerability. Glob. Environ. Chang. 2006, 16, 268–281. [Google Scholar] [CrossRef]
  9. Füssel, H.-M.; Klein, R.J.T. Climate change vulnerability assessments: An evolution of conceptual thinking. Clim. Chang. 2006, 75, 301–329. [Google Scholar] [CrossRef]
  10. Hinkel, J. Measuring vulnerability and adaptive capacity: Towards a clarification of the policy-science interface. Glob. Environ. Chang. 2011, 21, 198–208. [Google Scholar] [CrossRef]
  11. IPCC. Summary for policymakers. In Climate Change 2014: Impacts, Adaptation, and Vulnerability. Part A: Global and Sectoral Aspects. Contribution of Working Group II to the Fifth Assessment Report of the Intergovernmental Panel on Climate Change; Field, C.B., Barros, V.R., Dokken, D.J., Mach, K.J., Mastrandrea, M.D., Bilir, T.E., Chatterjee, M., Ebi, K.L., Estrada, Y.O., Genova, R.C., et al., Eds.; Cambridge University Press: Cambridge, UK; New York, NY, USA, 2014; pp. 1–32. [Google Scholar]
  12. Smit, B.; Wandel, J. Adaptation, adaptive capacity and vulnerability. Glob. Environ. Chang. 2006, 16, 282–292. [Google Scholar] [CrossRef]
  13. Le Blanc, D. Climate change and sustainable developement revisited: Implementation challenges. Nat. Resour. Forum 2009, 33, 259–261. [Google Scholar] [CrossRef]
  14. Metzger, M.J.; Leemans, R.; Schroter, D. A multidisciplinary multi-scale framework for assessing vulnerabilities to global change. Int. J. Appl. Earth Obs. Geoinf. 2005, 7, 253–267. [Google Scholar] [CrossRef]
  15. Schröter, D.; Polinsky, C.; Patt, A.G. Assessing vulnerabilities to the effects of global change: An eight step approach. Mitig. Adapt. Strateg. Glob. Chang. 2005, 10, 573–596. [Google Scholar] [CrossRef]
  16. Füssel, H.-M. Vulnerability: A generally applicable conceptual framework for climate change research. Glob. Environ. Chang. 2007, 17, 155–167. [Google Scholar] [CrossRef]
  17. Patt, A.G.; Schröter, D.; Klein, R.J.T.; de la Vega-Leinert, A.C. Assessing Vulnerability to Global Environmental Change—Making Research Useful for Adaptation Decision Making Policy; Earthscan: London, UK, 2009; p. 288. [Google Scholar]
  18. Brooks, N.; Adger, W.N.; Kelly, P.M. The determinants of vulnerability and adaptive capacity at the national level and the implications for adaptation. Glob. Environ. Chang. 2005, 15, 151–163. [Google Scholar] [CrossRef]
  19. Mertz, O.; Halsnæs, K.; Olesen, J.E.; Rasmussen, K. Adaptation to Climate Change in Developing Countries. Environ. Manag. 2009, 43, 743–752. [Google Scholar] [CrossRef]
  20. Preston, B.L.; Yuen, E.J.; Westaway, R.M. Putting vulnerability to climate change on the map: A review of approaches, benefits, and risks. Sustain. Sci. 2011, 6, 177–202. [Google Scholar] [CrossRef]
  21. Grothmann, T.; Patt, A. Adaptive capacity and human cognition: The process of individual adaptation to climate change. Glob. Environ. Chang.-Hum. Policy Dimens. 2005, 15, 199–213. [Google Scholar] [CrossRef]
  22. Bubeck, P. Private Flood Mitigation Measures in a Changing Risk Environment. Ph.D. Thesis, Vrije Universiteit, Amsterdam, The Netherlands, 2013; p. 157. [Google Scholar]
  23. Smit, B.; Pilifosova, O. From adaptation to adaptive capacity and vulnerability reduction. In Climate Change, Adaptive Capacity and Development; Smith, J.B., Klein, R.J.T., Huq, S., Eds.; Imperial College Press: London, UK, 2003; pp. 9–28. [Google Scholar]
  24. O’Brien, K.; Leichenko, R.; Kelkar, U.; Venema, H.; Aandahl, G.; Tompkins, H.; Javed, A.; Bhadwal, S.; Barg, S.; Nygaard, L.; et al. Mapping vulnerability to multiple stressors: Climate change and globalization in India. Glob. Environ. Chang. 2004, 14, 303–313. [Google Scholar] [CrossRef]
  25. Turner, B.L.; Kasperson, R.E.; Matson, P.; McCarthy, J.J.; Corell, R.W.; Christensen, L.; Eckley, N.; Kasperson, J.X.; Luers, A.; Martello, M.L.; et al. A framework for vulnerability analysis in sustainability science. Proc. Natl. Acad. Sci. USA 2003, 100, 8074–8079. [Google Scholar] [CrossRef] [PubMed]
  26. Mansuri, G.; Rao, V. Community-based and -driven development: A critical review. World Bank Res. Obs. 2004, 19, 1–39. [Google Scholar] [CrossRef]
  27. Newig, J.; Fritsch, O. Environmental Policy and Governance. Environ. Policy Gov. 2009, 19, 197–214. [Google Scholar] [CrossRef]
  28. Von Korf, Y.; Daniell, K.A.; Moellenkamp, S.; Bots, P.; Bijlsma, R.M. Implementing Participatory Water Management: Recent Advances in Theory, Practice, and Evaluation. Ecol. Soc. 2012, 17. Article 30. [Google Scholar] [Green Version]
  29. Simane, B.; Zaitchik, B.F. The Sustainability of Community-Based Adaptation Projects in the Blue Nile Highlands of Ethiopia. Sustainability 2014, 6, 4308–4325. [Google Scholar] [CrossRef]
  30. Muro, M.; Jeffrey, P. Time to Talk? How the Structure of Dialog Processes Shapes Stakeholder Learning in Participatory Water Resources Management. Ecol. Soc. 2012, 17. Article 3. [Google Scholar] [Green Version]
  31. Bunders, J.F.G.; Broerse, J.E.W.; Keil, F.; Pohl, C.; Scholz, R.W.; Zweekhorst, M.B.M. A Transdisciplinary Approach to Complex Societal Issues; Springer-Verlag: Berlin, Germany, 2010; Chapter 11; pp. 125–152. [Google Scholar]
  32. Van Aalst, M.K.; Cannon, T.; Burton, I. Community level adaptation to climate change: The potential role of participatory community risk assessment. Glob. Environ. Chang. 2008, 18, 165–179. [Google Scholar]
  33. IRH (Intendencia de Recursos hídricos); INRENA (del Instituto Nacional de Recursos Naturales. and Administración Técnica). Inventario de Fuentes de Agua Superficial; Evaluación de los Recursos Hídricos de la Cuenca del Río Ocoña: Ocoña, Peru, 2007. [Google Scholar]
  34. Guevara, J.; Quispe, T.; Jaime, D. Riego Parcelario y Ahorro de Agua; AEDES: Arequipa, Peru, 2008; p. 22. [Google Scholar]
  35. Muis, S.; Sardella, C.S.E. Assessment of Perceived Vulnerability to Water Shortages in the Ocoña River Basin, Peru—Determinants on Community and Household Level. Bachelor’s Thesis, VU University, Amsterdam, The Netherlands, 2009; p. 86. [Google Scholar]
  36. McDowell, J.Z.; Hess, J. Accessing adaptation: Multiple stressors on livelihoods in the Bolivian highlands under a changing climate. Glob. Environ. Chang. 2012, 22, 342–352. [Google Scholar] [CrossRef]
  37. Censos Nacionales. Summary and statistical report of the 2007 population and housing census—Censos nacionales 2007. Available online: http://censos.inei.gob.pe/cpv2007/tabulados/# (accessed on 25 July 2014).
  38. MDA (Municipalidad Distrital de Andaray). Plan Estrategico de Desarrollo del Distrito de Andaray 2005–2010; MDA: Andaray, Peru, 2005. [Google Scholar]
  39. AEDES. Análisis Multitemporal del Retroceso Glaciar del Nevado Coropuna—Mediante Imágenes de Satélite Landsat; AEDES: Arequipa, Peru, 2010; p. 21. [Google Scholar]
  40. Silverio, W.; Jaquet, J.M. Multi-temporal and multi-source cartography of the glacial cover of Nevado Coropuna (Arequipa, Peru) between 1955 and 2003. Int. J. Remote Sens. 2012, 33, 5876–5888. [Google Scholar] [CrossRef]
  41. Magrin, G.; Marengo, J. Impacts, Adaptation, and Vulnerability. In The Fifth Assessment Report of the Intergovernmental Panel on Climate Change; Cambridge University Press: Cambridge, UK, 2014; p. 102. [Google Scholar]
  42. Mark, B.G.; Bury, J.; Kenzie, J.M.; French, A.; Baraer, M. Climate Change and Tropical Andean Glacier Recession: Evaluating Hydrologic Changes and Livelihood Vulnerability in the Cordillera Blanca, Peru. Ann. Assoc. Am. Geogr. 2010, 100, 794–805. [Google Scholar] [CrossRef]
  43. NCAP (The Netherlands climate assistance program). Poverty Reduction at Risk: Managing the Impacts of Climate Change on Poverty Alleviation Activities; Report Series NCAP; ETC: Leusden, The Netherlands, 2007; p. 30. [Google Scholar]
  44. OECD. Policy Guidance on Integrating Climate Change Adaptation into Development Co-Operation; OECD: Paris, France, 2009; p. 193. [Google Scholar]
  45. GEF. In Operational Guidelines on Ecosystem Based Approaches to Adaptation; Global Environment Facility report GEF/LDCF.SCCF.13/Inf.06; GEF Publisher: Washington, DC, USA, 2013; p. 5.
  46. Barreteau, O.; Bots, P.W.G.; Daniell, K.A. A framework for clarifying “participation” in participatory research to prevent its rejection for the wrong reasons. Ecol. Soc. 2010, 15. Article 1. [Google Scholar]
  47. Cosens, B.; Gunderson, L.; Allen, C.; Benson, M.H. Identifying Legal, Ecological and Governance Obstacles, and Opportunities for Adapting to Climate Change. Sustainability 2014, 6, 2338–2356. [Google Scholar] [CrossRef]
  48. Douma, A.; Hirsch, D.; Kinney, K.; Lasage, R. Equity matters: Introducing the capabilities approach in adaptation to climate change in Ghana and Peru. In Adaptation to Climate Change through Water Resources Management: Capacity, Equity, and Sustainability; Stucker, D., Lopes, E., Eds.; Earthscan Publishers: Abingdon, UK, 2014; Chapter 12; pp. 243–263. [Google Scholar]
  49. Aerts, J.C.J.H.; Renssen, H.; Ward, P.; de Moel, H.; Odada, E.; Goose, H. Sensitivity of Global River discharges to Long Term Climate Change and Future Climate Variability. Geophys. Res. Lett. 2006, 33. Article L19401. [Google Scholar] [CrossRef]
  50. Bouwer, L.M.; Aerts, J.C.J.H.; Droogers, P.; Dolman, A.J. Detecting the long-term impacts from climate variability and increasing water consumption on run-off in the Krishna river basin (India). Hydrol. Earth Syst. Sci. 2006, 3, 1249–1280. [Google Scholar] [CrossRef]
  51. Lasage, R.; Aerts, J.C.J.H.; Verburg, P.H.; Alemu, S.S. Assessing the role of sand dams in water demand and water supply under climate change in Ethiopia. Mitig. Adapt. Strateg. Glob. Chang. 2013. [Google Scholar] [CrossRef]
  52. Van Deursen, W.P.A.; Kwadijk, J.C.J. The Impacts of Climate Change on the Water Balance of the Ganges_Brahmaputra and Yangtze Basin. Resour. Anal. 1994, 46, 94–160. [Google Scholar]
  53. Aerts, J.C.J.H.; Kriek, M.; Schepel, M. STREAM (Spatial Tools for River Basins and Environment and Analysis of Management Options): ‘Set up requirements’. Phys. Chem. Earth. B Hydrol. Oceans. Atmos. 1999, 24, 591–595. [Google Scholar] [CrossRef]
  54. Cai, X.; Wang, D.; Zhu, T.; Ringler, C. Assessing the regional variability of GCM simulations. Geophys. Res. Lett. 2009, 36. Article L02706. [Google Scholar] [CrossRef]
  55. IPCC SRES; Swart, R. (Eds.) Special Report on Emissions Scenarios: A special report of Working Group III of the Intergovernmental Panel on Climate Change; Cambridge University Press: Cambridge, UK, 2000.
  56. Bouwer, L.M.; Aerts, J.C.J.H.; Coterlet, G.M.; van de Giesen, N.; van de Gieske, A.; Mannaerts, C. Evaluating downscaling methods for preparing Global Circulation Model (GCM) data for hydrological impact modelling. In Climate Change in Contrasting River Basins Adaptation Strategies for Water, Food and Environment; Aerts, J.C.J.H., Droogers, P., Eds.; CABI Publishing: Wallingford, UK, 2004; Chapter 2; pp. 25–47. [Google Scholar]
  57. Wilby, R.L.; Wigley, T.M.L. Downscaling general circulation model output: A review of methods and limitations. Prog. Phys. Geogr. 1997, 21, 530–584. [Google Scholar] [CrossRef]
  58. Vogel, J.C.; Lerman, J.C.; Mook, W.G. Natural isotopes in surface and ground-water from Argentina. Hydrol. Sei. Bull. 1975, 25, 23–36. [Google Scholar]
  59. Araguas-Araguas, L.; Froehlich, K.; Rozanski, K. Deuterium and oxygen-18 isotope composition of precipitation and atmospheric moisture. Hydrol. Process. 2000, 14, 1341–1355. [Google Scholar] [CrossRef]
  60. Suarez, P.; Ribot, J.; Patt, A.G. Climate information, equity and vulnerability reduction. In Distributional Impacts of Climate Change and Disasters: Concepts and Cases; Ruth, M., Ibarraran, M.E., Eds.; Edward Elger: Cheltenham, UK, 2009. [Google Scholar]
  61. Chambers, R. The origins and practice of participatory rural appraisal. World Dev. 1994, 22, 953–969. [Google Scholar] [CrossRef]
  62. Bradley, R.S.; Vuille, M.; Diaz, H.F.; Vergara, W. Threats to Water Supplies in the Tropical Andes. Science 2006, 312, 1755–1756. [Google Scholar] [CrossRef] [PubMed]
  63. Chevallier, P.; Pouyaud, B.; Suarez, W.; Condom, T. Climate change threats to environment in the tropical Andes: Glaciers and water resources. Reg. Environ. Chang. 2011, 11 (Suppl 1), 179–187. [Google Scholar] [CrossRef]
  64. Juen, I.; Kaser, G.; Georges, C. Modelling observed and future runoff from a glacierized tropical catchment Cordillera Blanca, Perú. Glob. Planet. Chang. 2007, 59, 37–48. [Google Scholar] [CrossRef]
  65. Eakin, H. Institutional change, climate risk, and rural vulnerability: Cases from Central Mexico. World Dev. 2005, 33, 1923–1938. [Google Scholar] [CrossRef]
  66. Reid, P.; Vogel, C. Living and responding to multiple stressors in South Africa—Glimpses from KwaZulu-Natal. Glob. Environ. Chang. 2006, 16, 195–206. [Google Scholar] [CrossRef]
  67. Lasage, R.; de Vries, A.C.; Douma, A.; Hirsch, D. Final Financial and Narrative Report ADAPTS Project 2007–2011; Report R12-04; IVM, Vrije Universiteit Amsterdam: Amsterdam, The Netherlands, 2012; p. 67. [Google Scholar]
  68. Quispe, T.; Kraft, K.; Franck, A.; Tolk, L.; Lasage, R. The ADAPTS Programme in Peru, Synthesis Report; R12–04; Institute for Environmental Studies IVM: Amsterdam, The Netherlands, 2012; p. 15. [Google Scholar]
  69. Van Steenbergen, F. Evaluation Report ADAPTS; Meta Meta: Den Bosch, The Netherlands, 2012. [Google Scholar]
  70. Lasage, R.; Ward, P.J.; Belinfante, T.; Singh, M.; de Moel, H. Impact of Climate Change on Modelled Runoff of the Ocoña River in Peru; Institute for Environmental Studies research report R-11/09; IVM: Amsterdam, The Netherlands, 2011; p. 29. [Google Scholar]
  71. Kelly, P.M.; Adger, W.N. Theory and practice in assessing vulnerability to climate change and facilitating adaptation. Clim. Chang. 2000, 47, 325–352. [Google Scholar] [CrossRef]
  72. Yohe, G.; Tol, R.S.J. Indicators for social and economic coping capacity moving toward a working definition of adaptive capacity. Glob. Environ. Chang. 2002, 12, 25–40. [Google Scholar] [CrossRef]
  73. Huggel, C.; Scheel, M.; Albrecht, F.; Andres, N.; Calanca, P.; Jurt, C.; Khabarov, N.; Mira-Salama, D.; Rohrer, M.; Salzmann, N.; et al. A framework for the science contribution in climate adaptation: Experiences from science-policy processes in the Andes. Environ. Sci. Policy 2015, 47, 80–94. [Google Scholar] [CrossRef]
  74. Adger, W.N.; Agrawala, S.; Mirza, M.M.Q.; Conde, C.; O’Brien, K.; Pulhin, J.; Pulwarty, R.; Smit, B.; Takahashi, K. Assessment of adaptation practices, options, constraints and capacity. In Climate Change 2007: Impacts, Adaptation and Vulnerability. Contribution of Working Group II to the Fourth Assessment Report of the Intergovernmental Panel on Climate Change; Parry, M.L., Canziani, O.F., Palutikof, J.P., van der Linden, P.J., Hanson, C.E., Eds.; Cambridge University Press: Cambridge, UK, 2007; pp. 717–743. [Google Scholar]
  75. Hutton, D.; Hague, C.E. Patterns of Coping and Adaptation among Erosion-Induced Displacees in Bangladesh: Implications for Hazard Analysis and Mitigation. Nat. Hazards 2003, 29, 405–421. [Google Scholar] [CrossRef]
  76. Bubeck, P.; Botzen, W.J.W.; Suu, L.T.T.; Aerts, J.C.J.H. Do flood risk perceptions provide useful insights for flood risk management? Findings from central Vietnam. J. Flood Risk Manag. 2012, 5, 295–302. [Google Scholar] [CrossRef]
  77. Munang, R.; Nkem, J.N. Using Small-Scale Adaptation Actions to Address the Food Crisis in the Horn of Africa: Going beyond Food Aid and Cash Transfers. Sustainability 2011, 3, 1510–1516. [Google Scholar] [CrossRef]
  78. Murtinho, F.; Eakin, H.; Lopez-Carr, D.; Hayes, T.M. Does External Funding Help Adaptation? Evidence from Community-Based Water Management in the Colombian Andes. Environ. Manag. 2013, 52, 1103–1114. [Google Scholar] [CrossRef]
  79. Ministerio del Ambiente, El Peru y el cambio climatico. Segunda comunicacion naciocal del Peru ante la convencion marco de las naciones unidas sobre cambio climatico 2010. Available online: http://sinia.minam.gob.pe/index.php?idElementoinformacion=245 (accessed on 28 December 2014).
  80. Tsakert, P.; Dietrich, K.A. Anticipatory Learning for Climate Change Adaptation and Resilience. Ecol. Soc. 2010, 15. Article 11. [Google Scholar]
  81. Rockström, J.; Barron, J.; Fox, P. Rainwater management for increased productivity among small-holder farmers in drought prone environments. Phys. Chem. Earth 2002, 27, 949–959. [Google Scholar] [CrossRef]
  82. Savenije, H.H.G.; van der Zaag, P. Integrated water resources management: Concepts and issues. Phys. Chem. Earth 2008, 33, 290–297. [Google Scholar] [CrossRef]
  83. Fernald, A.; Tidwell, V.; Rivera, J.; Rodríguez, S.; Guldan, S.; Steele, C.; Ochoa, C.; Hurd, B.; Ortiz, M.; Boykin, K.; et al. Modeling Sustainability of Water, Environment, Livelihood, and Culture in Traditional Irrigation Communities and Their Linked Watersheds. Sustainability 2012, 4, 2998–3022. [Google Scholar] [CrossRef]
  84. Glendenning, C.J.; van Ogtrop, F.F.; Mishra, A.K.; Vervoort, R.W. Balancing watershed and local scale impacts of rain water harvesting in India—A review. Agric. Water Manag. 2012, 107, 1–13. [Google Scholar] [CrossRef]

