1. Introduction
With the increase in global emissions of carbon dioxide, the greenhouse effect is considered to be an increasingly serious problem with significant effects on the human living environment. Although environmental issues have become a widespread concern in recent years, the question of how to slow global warming remains. To reduce the production of greenhouse gas (GHG), multiple agreements have been signed, including the Kyoto Protocol [
1] and the Copenhagen Accord [
2]. In addition, the GHG produced by the air transport industry accounts for approximately 3% of the world’s carbon emissions [
3]. There are studies on voluntary carbon emissions reductions from an economic approach, such as the empirical literature on impure public goods [
4].
In the study of Simone
et al. [
5], aviation is responsible for 3% of global fossil fuel consumption and 12% of transportation-related carbon emissions. Although aviation is not one of the major drivers of global warming, the significant growth suggests it could be a major factor over the next decades [
6,
7]. Therefore, reducing carbon emissions related to aviation is a necessary task despite its currently relatively small contribution to total carbon emissions [
8]. As such, during the annual meeting of the International Air Transport Association (IATA) held in Kuala Lumpur in June 2009, the IATA agreed to reach “carbon-neutral growth” in 2020, on behalf of the global aviation industry, and to reduce carbon emissions by 50%.
To respond to the concerns over the environmental impacts of aviation, the International Air Transport Association (IATA) in 2009 aimed at achieving stable carbon emissions from 2020 onwards despite further growth in air traffic, by a combination of different methods such as fleet renewal, operational and infrastructure measures, retrofits, offset mechanisms and the use of alternative fuels [
9]. In recent years, several studies have found that improved aircraft technology and highly efficient allocation can reduce an aircraft’s carbon dioxide emissions. In addition, changing the attitude of airline passengers toward carbon emissions during travel and expanding advocacy and public education about the understanding of carbon emissions can facilitate the implementation of low-carbon policies [
10,
11].
The overall global trend reveals that many European Union member states have adopted a tax policy that raises the ticket price to force airline passengers to pay an additional sum of money to compensate for the carbon emissions generated by air travel. This tax covers the external costs, such as air pollution, energy security and climate change caused by GHG emissions and is expected to reduce the load on the environment and help achieve the sustainable growth of the air transport industry.
A similar policy, known as the voluntary carbon offset (VCO), has been presented to the aviation industry and at the airports of a number of countries in Europe and the Americas. Primarily, this policy enables passengers to use a website to calculate the carbon emissions generated by their journey, and the passengers can then use methods, such as personal payment or bonus point redemption, to compensate for (“offset”) the economic costs of carbon-dioxide emissions or to donate to tree-planting programs or other environmental projects implemented by relevant agencies [
12,
13]. In addition, informing passengers regarding corporate social responsibility (CSR) by implementing this policy and the benefits of this policy for the passenger can enhance the willingness to participate in the policy [
7,
14,
15]. Other research on the carbon offset includes using the theory of planned behaviour or the model of goal-directed behaviour (MGB) to investigate the factors influencing on the intention to participate in carbon-offset schemes [
13,
15,
16,
17].
As indicated above, the amount of money that airline passengers pay as a carbon offset is primarily determined by the airlines based on the relevant flight data. That is, the amounts are often determined by the decision-making of the supplier, and little has been done to investigate the price that the airline passengers are willing to pay for the carbon offset. Only a few studies have applied the contingent valuation (CV) method to investigate the price that air passengers are willing to pay for carbon-offset. For examples, MacKerron [
7] and Brouwer
et al. [
18] applied a binary probabilistic model to estimate the price that air passengers are willing to pay for the carbon offset. Lu and Shon [
19], on the other hand, used interval regression model to only estimate the determinants of willingness to pay (WTP) but not the amount of WTP.
Stated preference methods are a useful way to understand the preferences of individuals by observing their choices in hypothetical scenarios presented in a survey (
i.e., the observed choices are contingent on the scenarios provided). In particular, CV is used to represent the process of using stated preference data for valuation purposes. There are many ways in which to elicit preference information in a CV study, with discrete choice experiments (DCEs) the most common (Readers interested in more materials on CV and DCE can refer to Carson and Czajkowski [
20]). Despite DCE having been widely applied in the transportation field, yet, CV can be justified in certain circumstances that have to do with the study population.
Because carbon-offset is not supported by all airline passengers, there will be situations where the price that many respondents are willing to pay is zero (the previously mentioned studies did not consider this issue). If the WTP of many respondents is zero, bias will result in the WTP estimated using econometric models (standard discrete choice model). Various approaches to dealing with zero bids have been used in the CV literature. One option is to simply remove these observations from the sample [
21,
22]; however, such a complete removal may not be appropriate when mean bids are calculated [
23]. Vaughan
et al. [
24] also noted that the statistical estimation would result in a negative estimator in the field of zero bids, while Calia and Strazzera [
25] observed that the exclusion of zero bids might induce sample selection bias. In addition, the first paper to have criticized the papers for their failure to examine zero willingness to pay responses and to conduct an appropriate control exercise is Diederich and Goeschl [
26].
Another approach explicitly allows for a point mass at zero, which is the truncation at zero of the WTP distribution. In this stream, Kriström [
27] proposed a framework based on the Spike model, which takes into account that the WTP of many respondents is zero. Thus, the WTP derived after model estimation more realistically reflects the WTP when the data contain many zeros, e.g., above 10% of the total sample [
28,
29,
30,
31,
32,
33]. Therefore, the Spike model provides a more realistic depiction than other models.
Given the dearth of the utilisation of this approach in the literature, this study used the CV method to assess non-market value to survey the WTP of economy class airline passengers and prepared an econometric model suitable for the price measured in this study (The WTP of air passengers for other classes and flight routes can be estimated by using the same approach adopted in the paper. It is only a matter of data collection. Further research can be done by comparing WTPs among different groups).
In addition, only the flight route Taiwan to Hong Kong was considered in this study (The study looks at a single flight connection, which limits the generalizability of its data, readers interpret the results extended beyond the specific route shall be cautious). Spike model, which can better reflect the actual circumstances, was applied to process the WTP of airline passengers for the carbon offset. This study will help the airline industry obtain a better understanding of the potential populations that will accept this policy, develop the necessary marketing strategy to target these populations and achieve a competitive edge in operation. The study also provides references for the air transport industry in promoting the carbon-offset pricing mechanism.
2. Model Framework
When a high percentage of the sample observational values of consumer spending is zero, the sample is obviously not conforming to a normal distribution. In this case, if we continue to use the regression model to analyse the sample data, it will inevitably lead to bias of standard errors in the estimated results. In addition, estimated WTP will be negative in an unbounded linear WTP model, when a large proportion of respondents say no to the lowest bid amount or state a zero WTP. Therefore, focusing on a processing method for samples with many zero values, Kriström [
27] proposed the Spike model to solve the problems caused by zero WTP in the sample data.
According to the random utility theory and assuming that the utility
U includes the observable utility
and the unobservable random error
, the utility function is represented by Equation (1):
where
represents the indirect utility function of the amount of money for the carbon offset paid by airline passengers,
y represents the income level of airline passengers,
represents the socioeconomic variables of airline passengers,
represents the related variables that affect the participation of economy class air passengers in the carbon-offset policy, and
ε is the random item of the utility function and has an independent and identical distribution (iid). When airline passengers are willing to pay the bid amount (
) to offset the carbon emissions, the new utility
is the utility function when the airline passengers pay the offset for carbon emissions and is higher than the original utility (
). Therefore, the utility function can be rewritten as Equation (2):
and are independently and identically distributed with a zero mean. Thus, the probability function for the economy class air passengers’ willingness to pay the scenario price () can be derived from Equation (2) to Equation (3).
Because WTP represents the maximum amount that the economy class air passengers pay, when the scenario provides a price lower than the WTP (), the economy class air passengers always pay the price. represents the cumulative distribution function and is shown in Equation (4).
p belongs to (0, 1), and is a continuous increasing function if and .
The expected amount of the WTP for carbon offsets
from airline passengers can be expressed as follows:
Therefore, the parameter estimation of the Spike model is calculated using maximum likelihood estimation (MLE), as shown in Equation (6).
where
indicates whether there is a value range of the airline passenger’s
WTP (
WTP>0).
W indicates the response of whether the airline passenger pays the last bid price
A, that is, whether
WTP is greater than
A.
and
W are defined in Equations (7) and (8), respectively.
Without a loss of generality, we assume that the utility function is linear and consider only the effect of income y. For simplicity, we derive the WTP with the income variable only. It is straightforward to derive the WTP with other variables included, such as Q and X. However, these two types of variable must be specified as alternative specific variables instead of generic variables for estimation purposes.
Thus, the difference between the utilities of the new state and the current state can therefore be expressed as follows:
We then assume that
has the form of a logistical function, which means that
can be shown as follows:
Equation (4) can be further expressed as follows:
where
α is the marginal utility of improving environmental conditions after adopting the VCO policy and
β is the marginal utility of paying the amount of money for the VCO. We can derive the expected
WTP as follows:
The Spike value can be defined as in the following equation by setting .
3. Data Analysis
3.1. Description of Survey Data
This study primarily focused on the WTP of economy class airline passengers for the airline carbon-offset policy. A total of 505 questionnaires was distributed at Taiwan’s international airport from 1 July to 31 August 2011. All of the questionnaires were recovered, and after screening, there was a total of 477 valid questionnaires. The study subjects primarily consisted of airline passengers boarding economy class.
The first part of the questionnaire included socioeconomic variables and included 11 items, such as gender, age, educational level, monthly personal income, average annual number of flights, the main reason for air travel, the name of the airline company, and whether the passengers are members of an airline frequent flyer program and the flight class. Because the carbon-offset policy has not been formally implemented in Taiwan, few airline passengers are well informed regarding this policy. For the respondents to fully understand this policy—to investigate the level of understanding of the passengers regarding the carbon-offset policy and their willingness to participate in it and to enhance the accuracy rate in answering the subsequent questions—we provided in the second part of the questionnaire an example using the Hong Kong–Taiwan flight described on the Cathay Pacific website. This example informed the respondents of the distance and the duration of the trip and explained how much an individual needs to donate to offset the carbon emissions generated by the one-way journey. The questionnaire’s third part addressed the WTP for the airline carbon-offset policy. In our study, this part investigated the validity of the WTP of the respondents and used the triple-bound inquiry to sharpen the interval boundaries received in the single bounded format and, hence, increase statistical efficiency (Possible strategic incentive effects in stated preferences when using donation public goods, while important, are not investigated in this study. Interested readers can refer to Carson [
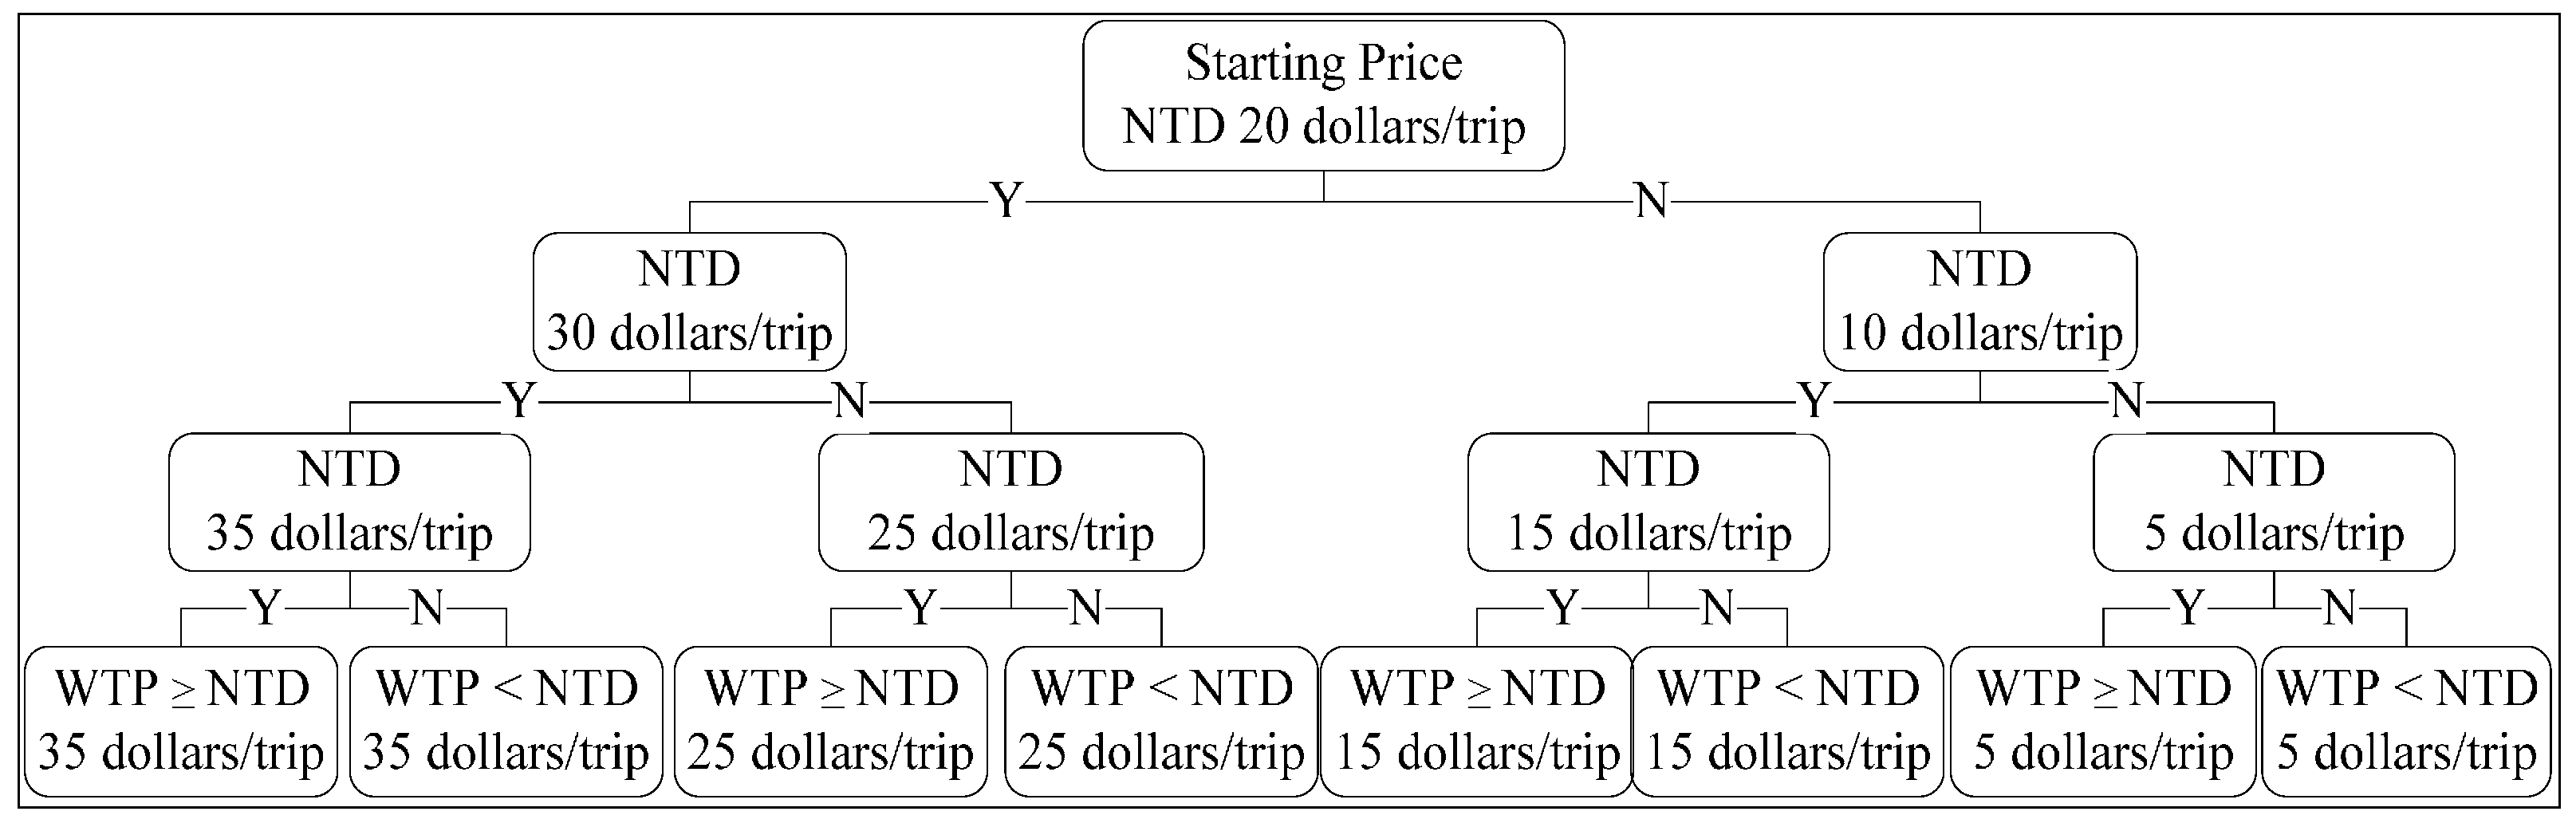
34]). The respondents were asked to respond in accordance with the triple-bound price scenarios, and in the end, the questionnaire included the price for seven scenarios, and two prices provided by the respondents elicited by an open format after three subsequent YES or NO responses (
Figure 1). The starting value of NT$ 20 (US $1 = NT $30) was set according to the amount of money that passengers of economy class travelling from Taiwan to Hong Kong (the total distance was 829 kilometres, and the flight time was 90 min) would have to donate to offset the journey’s carbon emissions, and 50% of this value was used as the increment or decrement of the set WTP.
Figure 1.
WTP of airline passengers for carbon offset under triple-bound price scenarios. Note: NTD = New Taiwan dollar.
Figure 1.
WTP of airline passengers for carbon offset under triple-bound price scenarios. Note: NTD = New Taiwan dollar.
3.2. Statistical Analysis
The results of the data analysis of the WTP of economy class air passengers for carbon offsets are shown in
Table 1. Because the carbon-offset policy has not been widely implemented globally and many passengers have not actually participated in the policy, we predicted that there would be many zero WTPs in the survey. Therefore, the table divided the samples into two categories, one including a WTP equal to 0 and another excluding a WTP equal to 0. To reflect the carbon-offset more acceptable to all passengers, the WTP including 0 is more preferred to the one excluding 0. That is the reason that we adopted the Spike model which can capture the effects of zero WTP. The
p-value in the left column is used for testing whether there are significant differences in WTP between WTP including 0 and WTP excluding 0.
Table 1.
Analysis of the WTP of economy class air passengers for carbon offsets.
Table 1.
Analysis of the WTP of economy class air passengers for carbon offsets.
| Variables | WTP including 0
No. of observations = 477 | WTP excluding 0
No. of observations = 380 |
|---|
| Sample size | % | WTP | Sample size | % | WTP |
|---|
Gender
P value = 0.556
DF = 1 | Female | 310 | 65 | 42.5 | 260 | 68.4 | 50.7 |
| Male | 167 | 35 | 35.8 | 120 | 31.6 | 49.8 |
Age *
P value = 0.037
DF = 3 | 30 or younger | 163 | 34.2 | 39.6 | 144 | 37.9 | 44.9 |
| 31–40 | 92 | 19.3 | 26.7 | 65 | 17.1 | 37.8 |
| 41–60 | 202 | 42.3 | 47.2 | 152 | 40.0 | 62.7 |
| 61 or more | 20 | 4.2 | 35.3 | 19 | 5.0 | 37.1 |
Educational level *
P value = 0.003
DF = 2 | High school or below | 116 | 24.3 | 34.7 | 81 | 21.3 | 49.7 |
| College degree | 270 | 56.6 | 36.4 | 229 | 60.3 | 42.9 |
| Master’s degree or above | 91 | 19.1 | 58.2 | 70 | 18.4 | 75.7 |
Average monthly personal income *
P value = 0.000
DF = 4 | Less than NT$ 30K | 172 | 36.1 | 42.9 | 150 | 39.5 | 49.2 |
| NT$30K to NT$50K | 137 | 28.7 | 29.5 | 108 | 28.4 | 37.5 |
| NT$50K to NT$70K | 108 | 22.6 | 37.3 | 72 | 18.9 | 55.9 |
| NT$70K to NT$90K | 38 | 8.0 | 78.7 | 35 | 9.2 | 85.4 |
| NT$90K to NT$110K | 22 | 4.6 | 32.5 | 15 | 3.9 | 47.7 |
Average annual number of flights *
P value = 0.000
DF = 2 | 1–3 | 385 | 80.7 | 33.4 | 296 | 77.9 | 43.4 |
| 3–6 | 42 | 8.8 | 59.2 | 38 | 10 | 65.4 |
| 7 or more | 50 | 10.5 | 77.6 | 46 | 12.1 | 83.2 |
Purpose of flight *
P value = 0.000
DF = 3 | Business | 42 | 8.8 | 32.2 | 29 | 7.6 | 46.6 |
| Tourism | 345 | 72.3 | 33.9 | 266 | 70 | 44.0 |
| Visiting friends and family | 61 | 12.8 | 83.8 | 59 | 15.5 | 86.6 |
| Other | 29 | 6.1 | 34.1 | 26 | 6.8 | 38.1 |
Member of airline frequent flyer program
P value = 0.625
DF = 1 | Yes | 38 | 8 | 33.2 | 30 | 7.9 | 42 |
| No | 439 | 92 | 40.8 | 350 | 92.1 | 51.1 |
It can be observed from the table that the overall samples were mostly female (65.0%), who had a relatively high WTP for carbon offsets. Further analysis found that there were no significant differences between the two sexes in average WTP. Most of the passengers were within the 41–50 year age group, followed by 21–30 years, accounting for 37.1% and 28.7% of all passengers, respectively. Our analysis revealed that passengers of different age groups differed significantly in average WTP, with more than 51 years old the highest (WTP = NT $56.0). Overall, the WTP of the samples including 0 was between NT $26.7 and NT $56.0, and that of the samples excluding 0 was between NT $37.8 and NT $61.5. However, we did not observe a trend for the WTP to increase with age, and we only determined that the WTP of passengers older than 41 years was higher than that of passengers less than 40 years. The majority of the passengers had college-level educations (56.6% of all passengers). The analysis results indicated that there were significant differences in different educational levels of air passengers paid average price of carbon offsets, the average WTP increasing with a higher education level. For passengers with a master’s degree or higher, samples that included a WTP of 0 had an average WTP of NT $58.2, whereas samples that excluded 0 had a WTP as high as NT $75.7. The largest share of the passengers had an average income of NT$40,001–NT $60,000 (31.4% of all passengers). There were significant differences in the average WTP between different income levels, and passengers with incomes over NT $60,001 had the highest WTP of NT $73.9.
Most of the passengers had an average annual number of flights of one to two flights, and this group accounted for 80.7% of all passengers. This group had the lowest WTP regardless of whether the WTP contained 0. However, according to the results showed that different average number of flights, there are significant differences in WTP. As the annual flight number increased, the WTP also increased. When the annual number of flights was seven or more, the WTP including 0 was NT $77.6 and NT $83.2 when excluding 0. The purpose of the journey was primarily tourism, accounting for 72.3%. Passengers with different trip purposes also had significantly different WTP. Those visiting friends and relatives were willing to pay the maximum amount of the carbon offset (NT $83.8). It was not surprising that the business travelers had the lowest WTP (including 0). This could due to the fact that most of business travelers cannot claim carbon contributions. The result may suggest a possible way to raise the WTP of this group by reimbursing the expense by their companies. In addition, 92.0% of the surveyed airline passengers were not airline frequent flyers, and most of the members of airline frequent flyer programs were China Airlines (CI) members. The variables with statistically significant results in this part of the analysis were further verified in the subsequent model.
Table 2 shows the proportions of responses to bids or stated open ended WTPs for the carbon offset for different airline passengers. According to this study’s design, the starting amount of money was NT $20.
Figure 1 shows that based on the study’s WTP scenarios, the final WTP could be the amounts set in the scenarios, such as NT $5, NT $10, NT $15, NT $20, NT $25, NT $30 and NT $35, and the rest of the amounts could be the WTPs provided by the respondents from an open ended format.
The table shows that 29.6% of airline passengers were unwilling to pay more than NT $20 for the carbon offset. Of these passengers, 20.5% were unwilling to pay for any carbon emissions offset (WTP = 0), accounting for the highest proportion of all WTPs for the carbon offset. In addition, 70.4% of the passengers were willing to pay more than NT $20 for the carbon offset, and the passengers who were willing to pay NT $100 accounted for the highest percentage of this group of passengers (17.2%), followed by passengers willing to pay NT $50 (14.7%) and passengers willing to pay NT $30 (10.5%). This result indicates that for airline passengers who initially refused to pay the starting amount, most were unwilling to pay for any carbon offset, and for passengers who paid the starting amount, the largest share was willing to pay more than NT $35 (40.6%).
Table 2.
WTPs for carbon offset paid by different airline passengers.
Table 2.
WTPs for carbon offset paid by different airline passengers.
| Carbon-offset WTP | Frequency | % | Carbon-offset WTP | Frequency | % |
|---|
| 0 * | 97 | 20.5 | 45 * | 2 | 0.4 |
| 5 | 19 | 4.0 | 50 * | 70 | 14.7 |
| 10 | 7 | 1.5 | 55 * | 1 | 0.2 |
| 15 | 17 | 3.6 | 70 * | 1 | 0.2 |
| 20 | 47 | 9.9 | 80 * | 1 | 0.2 |
| 25 | 45 | 9.4 | 100 * | 82 | 17.2 |
| 30 | 50 | 10.5 | 150 * | 1 | 0.2 |
| 35 | 32 | 6.7 | 300 * | 2 | 0.4 |
| 40 * | 2 | 0.4 | | | |
5. Conclusions and Recommendations
Through the donation method used in the actual implementation of the carbon-offset policy, this study informed the economy class airline passengers regarding the carbon emissions generated by their trip and investigated the WTP model of airline passengers for the carbon-offset based on the amount of money that the respondents were willing to donate for the carbon-offset. The data analysis showed that economy class airline passengers with a WTP of 0 accounted for 20.5% of all passengers. Therefore, this study first used the Spike model to estimate the WTP of economy class airline passengers for the carbon-offset policy to avoid the bias caused by excessive numbers of 0. In addition, when the donation amount of the Taiwan-Hong Kong flight from the airline company was used as the starting bid in the contextual assumptions, 70.4% of the airline passengers were willing to pay more than NT $20 to offset the carbon emissions generated during the journey.
The model estimation results suggest that compared with the model that considers scenario prices alone, taking into account the socioeconomic conditions and behavioural intention of airline passengers can result in a more representative WTP for the carbon-offset. The average WTP was NT $39.05, which is higher than the standard carbon-offset donation amount for economy class passengers calculated by airlines (The value higher than that which the airlines have reported may be related to the fact that the questionnaire only asked people how much they would be willing to pay whereas the airlines were asking for the donation). The main variables of the socioeconomic conditions that affect the WTP of airline passengers are the average monthly personal income and the number of flights.
The main variable of behavioural intention is “willing to participate in the carbon-offset policy after understanding its purpose and content”, which suggests that airline companies should make efforts to explain and promote the carbon-offset policy. The results support the findings of Lu and Shon [
19], Mair [
36] and Carrus
et al. [
35] in the following aspects. First, airlines companies can highlight that protecting the environment is everyone’s obligation through media and promotion tools. Second, airlines can enhance the passenger’s willingness to participate in carbon-offset policy by conveying positive messages that individuals can improve the environment. Third, the passengers’ perceptions of the effectiveness of the carbon-offset policy and the awareness of their duty towards the environment determine their WTP.
In addition, Mair [
36] also mentioned the pros and cons of recognising the carbon-offset policy as a viable tool for offsetting carbon emissions and mitigating climate change. Suggestions for how this may be achieved include making the purchase of carbon-offset mandatory, building in the price of the offset in the price of the ticket, or making the airlines themselves responsible, rather than allowing them to pass the costs of emission reduction on to their consumers.
Because of factors such as time and personnel, this study did not conduct a questionnaire survey among foreign airline travellers. We recommend that future studies could expand the study’s scope by conducting a questionnaire survey among airline passengers on flights outside Asia. This approach could provide airline companies that implement the carbon-offset more information on the attitude of foreign travellers towards this policy. In addition, future studies can design scenarios based on the carbon-offset policies for different flight classes and different routes, making the study more in line with the actual level of willingness to pay of the carbon-offset policy among airline passengers in each flight class and to assess the impact of price changes and payment methods on the carbon-offset policy. It shall also be noted that the spike model used in this study implicitly assumes that the truncation at zero does not miss instances of negative WTP among the population. However, some airline passengers may have a negative WTP for emission offsets. Finally, the administration of the survey-based data collection may encounter one of the following issues: selection bias (or non-response bias), social desirability bias, and common methods bias. An experimental setting might be an alternative way to survey-based data collection [
26,
37].


