1. Introduction
Forest and other ecosystems provide many goods and services to support human life on Earth. These goods and services, such as food, round wood, firewood, water, fresh air, fossil fuels, shelter, climate regulation, flood protection, disease control, waste treatment, soil formation, nutrient cycling, soil and water conservation, can be defined as the benefits that human beings obtain from ecosystems [
1]. Various studies have clarified the ecosystem service concept [
2,
3,
4,
5,
6].
The definition of ecosystem services is essential to highlight and guide tradeoffs in natural resource management and policy decisions, and it might draw a framework for the influence on human welfare in order to avoid both over- and under-estimations for valuation studies [
5]. Ecosystem services can be classified as intermediate ecosystem services and final ecosystem services [
4]. Final ecosystem services have direct benefits for human well-being, while intermediate services, such as carbon sequestration, are not consumed directly [
6].
The level of impact ecosystem services have on human wellbeing is still being discussed, as well as its measurability by consistent scientific tools and methodologies [
4].
Ecosystems have economic value not only for their environmental goods directly consumed and traded in the market, such as food and timber, but also due to their functions, such as flood control, soil formation, carbon sequestration, water provisioning and other services, which directly and indirectly provide for human wellbeing [
2,
3].
Forests in rural, as well as urban areas provide significant ecosystem services, such as offsetting carbon emissions [
7], removing air pollutants, reducing noise, regulating the microclimate [
8], recreation and amenity [
9]. Forests also contribute to improving environmental quality, quality of life and sustainable urban development [
10,
11,
12,
13,
14].
Forest ecosystems where carbon is sequestrated are the most important natural carbon sinks among terrestrial ecosystems. In recent years, negotiations on forests have been focusing on the numerous benefits that they provide for the environment and community in the context of climate change. Therefore, the importance of the forestry sector has gradually increased, particularly in climate change negotiations.
The total economic value (TEV) of forest resources consists of active use values (direct use and indirect use) and passive use or non-use values (option, heritage and existence). The carbon sequestration service of forest resources is an indirect use value. However, during the last few decades, carbon has received a direct use value, because of the transactions in emission trading systems or carbon markets. In Turkey, due to the non-existence of an emission trading system, carbon still has an indirect use value. In other words, carbon sequestration, which is a non-market forest service, displays public property characteristics in Turkey.
Economics can help with designing environmental policies by eliciting public preferences. The purposes of economic valuation studies for environmental goods and services are to measure the change in the individual’s or community’s welfare and to identify the economic value of these goods and services [
15,
16,
17]. Economic valuation studies can also be used for direct comparison between alternative land use options, facilitate cost/benefit analyses [
18,
19], multipurpose functional resource management, identification of economic problems of forest enterprises, determination of economic success, selection of investment projects and designation of the sale prices of goods and services [
15,
20,
21,
22].
Methods for the valuation of ecosystem services vary depending on the nature of the service [
23,
24]. The contingent valuation method (CVM), which captures the value of ecosystem entities narrowly and anthropocentrically [
25], is a valuation method developed by economists for the estimation of non-market environmental goods and services [
23,
24]. The CVM was first used in 1947 by S. V. Ciriacy Wantrup in a study conducted for preventing soil erosion [
26,
27,
28,
29]. However, the first CVM with a questionnaire was used by R. K. Davis in 1963 for the estimation of the recreational value of the Maine Forest [
29,
30,
31].
CVM can be used for the estimation of individuals’ willingness to pay (WTP) or willingness to accept (WTA) based on the positive or negative changes in environmental resources. With the hypothetical scenario, changes in social welfare and in environmental resources can be estimated according to public preferences [
15,
26,
27,
31,
32,
33,
34,
35,
36,
37,
38,
39,
40].
There are many studies conducted for the estimation of WTP for greenhouse gas mitigation, carbon sequestration and avoidance of the climate change impacts. A considerable part of these studies focused on people’s WTP for CO
2 mitigation, such as air travelers’ WTP for CO
2 mitigation [
41], or their voluntary carbon offsets in an aviation context [
42], or urban households’ WTP for CO
2 emission reductions in Turkey [
43] and in China [
44] and air travelers’ WTP for a carbon travel tax to offset carbon emissions from flying [
45].
Considering Turkey, the carbon sequestration service of forests has never been studied with CVM. This study was conducted for the purpose of filling this knowledge gap. WTP and TEV of the public were estimated for a new forest to sequester carbon. In addition, respondents’ remarks on forests, active and non-use values of forests, climate change and carbon sequestration were assessed. Data for analyses were collected by the CVM questionnaire. WTP and TEV were estimated by using correlation analysis and multi linear regression analysis.
2. Material and Methods
2.1. Material
The material of the study was composed of the data obtained via the implementation of the CVM questionnaire form.
Turkey has 81 cities, and the questionnaire form was distributed to all cities. Addresses of households were selected randomly. There was no feedback from 35 cities; therefore, the questionnaire form was only applied in 46 cities around Turkey (
Table 1) on 591 randomly selected people by using a simple random sampling method. In the implementation phase, different questionnaire techniques, including face-to-face interviews and the e-mail method, were used. All questionnaire forms were pooled, and during the preliminary evaluation phase, 67 questionnaires were excluded, due to absence of data and non-answered questions. Analyses were conducted on the remaining 524 questionnaires. The effectiveness rate of the questionnaire was 88.66%.
Table 1.
Distribution of questionnaire form to the cities in Turkey.
Table 1.
Distribution of questionnaire form to the cities in Turkey.
| No. | Name of the City | Number of Questionnaires | % |
|---|
| 1 | İstanbul | 135 | 25.76 |
| 2 | Ankara | 60 | 11.45 |
| 3 | İzmir | 37 | 7.06 |
| 4 | Isparta | 19 | 3.63 |
| 5 | Bolu | 2 | 0.38 |
| 6 | Kastamonu | 3 | 0.57 |
| 7 | Eskişehir | 7 | 1.34 |
| 8 | Mersin | 14 | 2.67 |
| 9 | Elazığ | 5 | 0.95 |
| 10 | Siirt | 5 | 0.95 |
| 11 | Antalya | 24 | 4.58 |
| 12 | Muğla | 15 | 2.86 |
| 13 | Çanakkale | 12 | 2.29 |
| 14 | Aydın | 6 | 1.15 |
| 15 | Manisa | 21 | 4.01 |
| 16 | Giresun | 7 | 1.34 |
| 17 | Ağrı | 4 | 0.76 |
| 18 | Trabzon | 5 | 0.95 |
| 19 | Sivas | 4 | 0.76 |
| 20 | Kırşehir | 4 | 0.76 |
| 21 | Balıkesir | 9 | 1.72 |
| 22 | Bingöl | 4 | 0.76 |
| 23 | Batman | 5 | 0.95 |
| 24 | Kahramanmaraş | 8 | 1.53 |
| 25 | Kırıkkale | 6 | 1.15 |
| 26 | Afyonkarahisar | 11 | 2.10 |
| 27 | Mardin | 9 | 1.72 |
| 28 | Burdur | 3 | 0.57 |
| 29 | Erzurum | 5 | 0.95 |
| 30 | Sakarya | 6 | 1.15 |
| 31 | Van | 6 | 1.15 |
| 32 | Sinop | 1 | 0.19 |
| 33 | Artvin | 1 | 0.19 |
| 34 | Karabük | 2 | 0.38 |
| 35 | Tunceli | 1 | 0.19 |
| 36 | Yozgat | 8 | 1.53 |
| 37 | Çorum | 7 | 1.34 |
| 38 | Aksaray | 4 | 0.76 |
| 39 | Niğde | 3 | 0.57 |
| 40 | Kayseri | 12 | 2.29 |
| 41 | Zonguldak | 5 | 0.95 |
| 42 | Düzce | 2 | 0.38 |
| 43 | Kütahya | 6 | 1.15 |
| 44 | Uşak | 2 | 0.38 |
| 45 | Denizli | 6 | 1.15 |
| 46 | Osmaniye | 3 | 0.57 |
| Total | | 524 | 100 |
The questionnaire form was composed of 3 sections and 33 questions in total. The first section included questions to determine the perspectives, priorities and value judgments of the community towards environmental problems, utilization forms of forest resources, climate change and the active and passive use values of forest resources. In the second section, the scenario was introduced and the valuation question was presented. The questions related to socioeconomic and demographic information about the respondents were presented in the last section.
In addition to the questions, the current state of forests and carbon stock changes was given in a table for Ankara, Kırıkkale and Kırşehir. A scenario was presented for forest area and carbon stock changes after the establishment of a new forest, as well. In the end, respondents had a chance to compare a business as usual scenario and the proposed scenario. Furthermore, the questionnaire form was visually supported with photographs, which described the current situation of land and the expected changes after afforestation, in order to ensure a better perception of the study to enhance the credibility of the scenario.
In contingent valuation studies, the scenario defines basic proposed activities to be implemented. The scenario in this study was “Forest resources provide goods and services for the benefit of the community. Carbon sequestration, climate regulation and reduced air pollution are some of these services. Forests sequester carbon via photosynthesis and play an important role in the fight against climate change. In order to minimize the negative impacts of climate change, to reduce air pollution and to increase the amount of carbon sequestered, it is planned to establish a new forest in a non-forested public property land in Ankara, Kırıkkale and Kırşehir. The area of this forest will be 100,000 hectares. The forest will sequester 325,000 tons of carbon (CO2 equivalent) annually. However, financial resources are required for the establishment of the forest. It is the aim to collect contributions via donations for the purpose of meeting the required financial resources”.
After the explanation of the scenario, a referendum-type question was asked of the respondents as proposed in the National Oceanic and Atmospheric Administration (NOAA) Panel [
46]. The question was “Would you provide a financial contribution for the new forest via donation?”
The questionnaire was continued with respondents who answered “yes” to this question. Respondents who said “no” or “I don’t know/I have no idea” were asked to explain the reason why under a separate question. This question sorted out zero and protest answers.
The contingent valuation question was asked of the respondents who would provide financial contribution for the establishment of new forest. The question was “What is the maximum annual per capita amount that you would like to pay for the new forest? When you make the payment, do not forget your income status and that you will not be able to use this money for different purposes”. After the contingent valuation question, respondents were encouraged to make a choice among the proposed values on the payment card. Prices on the payment card were $5, $10, $15, $20, $25, $37.5, $50, $75, $125, $250. Prices were determined by an open-ended question, which was asked of respondents in a pilot questionnaire implementation.
Hicks’ WTP measure was used as a consumer surplus measure. The “donation” method, based on voluntariness, was used as an instrument of payment in the questionnaire.
The final questionnaire was conducted between 23 July 2013 and 4 October 2013. The e-mail method was applied in 138 questionnaires, while face-to-face interviews were applied in the remaining 453 questionnaires. The rate of response via e-mail was 16.727%.
The questionnaire revealed various demographic and socioeconomic characteristics of the sample community, such as age, education, occupation, income and size of household. Information was also obtained with regard to their sensitivity and perspective towards the environment, use of forest ecosystems and climate change.
The data and information obtained via the questionnaire forms were digitized by using SPSS 15.0 for the purpose of establishing the database and conducting analyses.
2.2. Methods
2.2.1. Contingent Valuation Method
Some people are ready to pay various prices for the protection and improvement of environmental resources and their inheritance by future generations [
47]. People also attach economic value to the non-market environmental goods and services. Although these economic values do not emerge through the direct use of goods or services in market mechanisms, they can be used instead of the market prices [
30,
48].
The total economic value of a good or service is equivalent to the total WTP of an individual who uses the referred good or service. WTP may depend on various factors, such as the respondent’s gender [
49], age [
50], education level [
51], economic status [
52] and other socioeconomic and demographic characteristics.
Meanwhile, the consumer/equivalent surplus, corresponding to the maximum WTP for non-market goods, refers to the difference between the total WTP and the price generated in the market [
48].
Although the contingent valuation study has no standard approach for the preparatory process [
53], CVM practices may be conducted in the following phases [
15]:
Identification of the valuation problem,
Determination of the questionnaire application technique,
Calculation of the sample size,
Preparation of the hypothetical scenario,
Preparation of the questionnaire form,
Conducting of the pilot questionnaire,
Conducting of the final questionnaire,
Analysis of the data,
Conducting of the analyses on the reliability and validity of results,
Evaluation of the results in the decision-making process.
The benefit obtained from the utilization of the resource can be formulated as shown in Equation (1).
Here, F refers to the benefit obtained from the use of the environmental resource, p
y refers to the vector of prices for all private goods y, G refers to income, q
x refers to an indicator for the quantity of the public good x and INF refers to the knowledge of the consumer on nonmarket goods or services [
54,
55].
Meanwhile, the expenditure function required for ensuring a certain level of benefit from the use of a resource can be expressed as shown in Equation (2).
The WTP for the changes that may occur in the conditions of a non-market good or service (
and
) can be calculated upon taking the difference in the minimum expenditures before and after the change. With respect to the improvement or deterioration that may occur in the conditions of a non-market good or service, the WTP required for the benefits arising from the improvement or to avoid the damages due to the deterioration, that is the equivalent surplus, may be expressed with Equation (3).
Here, ES refers to consumer/equivalent surplus and F
1 refers to the reference utility level [
54,
55]. The equivalent surplus refers to the WTP of an individual who benefits from the improvement that may occur in the conditions of a non-market good or service or preventing deterioration [
55].
In many contingent valuation studies, the TEV of a non-market good or service may be determined with the total WTP [
35] or with the sum of each consumer/equivalent surplus (ES) and is expressed by the Equation (4).
2.2.2. Correlation Analysis
Correlation analysis is a statistical method used for measuring the linear relationship between two or more variables. Furthermore, the relationship level and its direction can be identified by correlation analysis. The purpose of the correlation analysis is to determine the direction changes of the dependent variable when the independent variable changes. Both variables must be continuous and show a normal distribution to make a parametric correlation analysis. The Pearson correlation coefficient (r) has a value between −1 and 1, shows whether there is a linear relationship between variables or not and shows the relationship level and its direction (Equation (5)) [
56,
57].
Here, r
xy defines the Pearson correlation coefficient; x and y define the variables.
A correlation coefficient of 1 indicates that two variables are perfectly related in a positive linear sense; a correlation coefficient of −1 indicates that two variables are perfectly related in a negative linear sense; and a correlation coefficient of 0 indicates that there is no linear relationship between the two variables [
56]. The coefficient of determination (R
2), the square of r, defines the percentage of how X independent variable determines Y dependent variable in the regression model [
57].
2.2.3. Multiple Linear Regression Analysis
Regression analysis identifies the mathematical relationship between a dependent variable and one or more independent variables. A model of the relationship is hypothesized, and estimates of the parameter values are used to develop an estimated regression equation [
57,
58].
In this study, the regression model of independent variables that affect the WTP of respondents was defined with multiple linear regression models. The multi-linear regression model equation is given in Equation (6).
Here, Y defines the dependent variable; X
1, X
2 and X
3 define independent variables; a, b, c, d define constants [
58].
The estimation of the TEV of the new forest was multiplied by the WTP of respondents and the number of houses (Equation (7)) [
48].
Here, TEV defines the total economic value, WTP defines the willingness to pay or the consumer/equivalent surplus and ΣHS defines the number of houses.
3. Results and Discussion
3.2. Results Related to the Sensitivity and Awareness of Respondents Regarding Environmental Problems
The sensitivity and awareness of the respondents regarding problems, such as climate change, deforestation and environmental pollution,
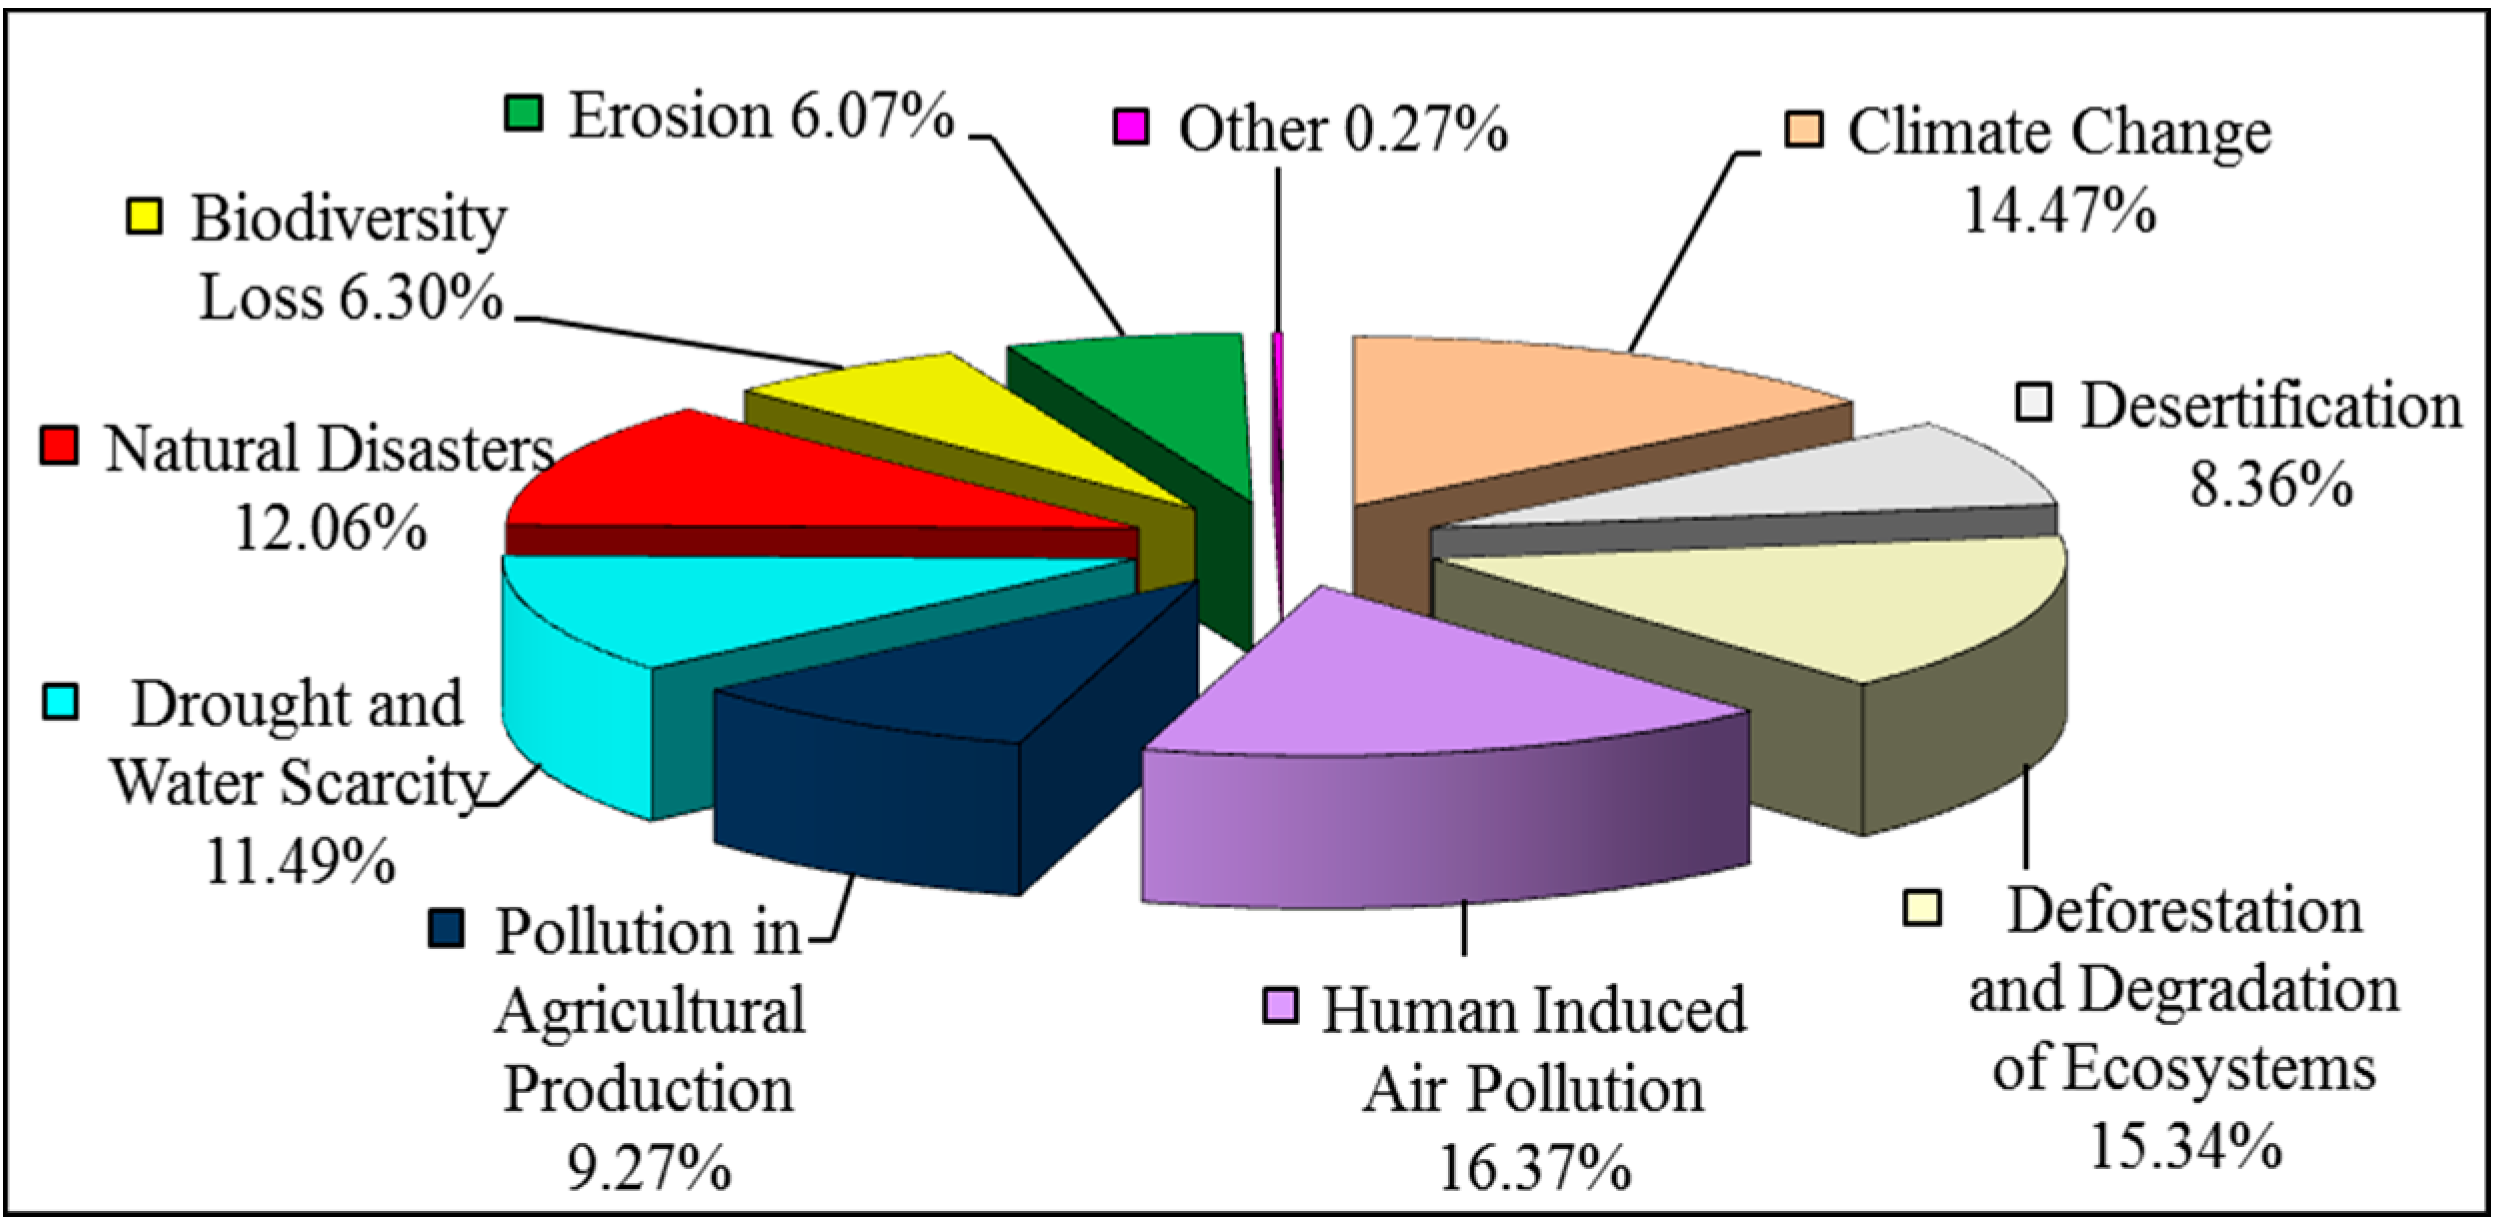
etc., might have an impact on respondents WTP. In this respect, respondents who do not attach any importance to environmental goods and services and current global environmental problems might give meaningless and unreliable answers to the questions. Therefore, at the beginning of the questionnaire, a question was raised to assess the perspectives, knowledge and interest levels of respondents regarding environmental problems. In this question, respondents were asked to evaluate the environmental problems experienced in Turkey and to prioritize them in importance (
Figure 1).
The most important environmental problems have been identified as human-induced environmental pollution (16.37%), deforestation and degradation of ecosystems (15.34%) and climate change (14.47%). Considering the responses provided, it is understood that the community is aware of the existing environmental problems, and it is believed that this has an impact on the WTP.
Figure 1.
Priority of the environmental problems experienced in Turkey.
Figure 1.
Priority of the environmental problems experienced in Turkey.
Thirty percent of the population in Turkey lives in Istanbul, Ankara and Izmir, due to employment opportunities. This leads to an increase in population and in the number of buildings and vehicles. Furthermore, there is an increase in the utilization of environmental resources and the use of energy and fossil fuel in places with a high population. This leads to an increase in greenhouse gas emissions and human-induced environmental pollution, among others. Therefore, the community sees human-induced environmental pollution as the most important environmental problem.
The rapid increase of urbanization along with industrial and economic growth and the deforestation and degradation of other ecosystems led the community to perceive deforestation and the degradation of other ecosystems as a major environmental problem. Again, climate change, which has been elaborated by scientists in recent years, with major studies being conducted to raise awareness in this direction, was also regarded as one of the most important environmental problems.
In the study, natural disasters, such as floods, inundations, fires, frost and storms were ranked fourth among environmental problems. However, in relation to the increase in the number of natural disasters in association with climate change in the upcoming years, it is believed that this priority in preference may rise to the first position.
3.4. Results Related to the Motives and Priorities of the Value Judgments of Respondents
In the questionnaire form, nine questions were asked for the purpose of learning the underlying motives and priorities of respondents towards climate change, carbon sequestration and the existence, bequest and option value of forest ecosystems.
As may be seen in
Table 4, the Likert scale, composed of five answers, namely “strongly agree, agree, neutral, disagree, strongly disagree”, was used to inquire whether the respondents agreed with the consideration presented in each question.
Table 4.
Scaling motives and priorities for non-use values of forest resources, climate change and carbon sequestration.
Table 4.
Scaling motives and priorities for non-use values of forest resources, climate change and carbon sequestration.
| Responses | Notions |
|---|
| Question 3 | Question 4 | Question 5 | Question 6 | Question 7 | Question 8 | Question 9 | Question 10 | Question 11 |
|---|
| Intrinsic Value | Bequest Value | Option Value | Existence Value | Information on Climate Change and Carbon Sequestration | Monetary Cost | Bequest Value | Importance of Forests | Avoid Climate Change Effects |
|---|
| Strongly Agree | 5 | 1 | 1 | 1 | 1 | 1 | 1 | 5 | 1 |
| Agree | 4 | 2 | 2 | 2 | 2 | 2 | 2 | 4 | 2 |
| Neutral | 3 | 3 | 3 | 3 | 3 | 3 | 3 | 3 | 3 |
| Disagree | 2 | 4 | 4 | 4 | 4 | 4 | 4 | 2 | 4 |
| Strongly Disagree | 1 | 5 | 5 | 5 | 5 | 5 | 5 | 1 | 5 |
The questions and the motives measured, as well as the value judgments are provided below.
The human-centered perspective of the damage to forest ecosystems was inquired by the judgment reading, “If I do not benefit from a forest resource, it is not important for me whether this forest resource is damaged or destroyed”. Those who accepted this notion believe that forests should not be damaged or destroyed only if people benefit from them or are harmed by such damage or destruction. At the same time, it shows for those who accept it that the presence of forest ecosystems does not have a value unless there are people [
59]. This value element was named the intrinsic value, and it shows that those who do not accept this notion do not have human-centric or selfish motives, that forest ecosystems have an intrinsic value and that they support its protection.
The presence of the heritage motive towards the bequest value, which is one of the passive use values, was inquired by the judgment reading, “It is important for me that forests are inherited by future generations (children, grandchildren, etc.)”. People may wish to bestow forests to future generations, so that the future generations may also use and benefit from forests and may display this with their WTP. The acceptance of this notion is the indicator of the presence of the motive to bestow.
The presence of the motive for the option (future) value, which is among the passive use values, was inquired by the judgment reading, “It is very important for me that, even if I don’t use them today, forests will produce goods and services that will be beneficial for me in the future”. Even if people do not obtain any direct or indirect benefit from forest resources today, they may expect to obtain a benefit in the future. This motive constitutes the source of the option (future) value of forest ecosystems. Those who accept this notion will also reflect WTP for the protection of their future values affiliated with forest ecosystems.
The motive towards the existence value, which is among the passive use values, was inquired by the judgment reading, “It is important for me that forests, such as tropical forests, continue their existence today and in the future, even if I will never go there, see them or use them”. People may wish that the forests in different parts of the world continue their existence today and in the future and show this with their WTP. The acceptance of this notion is the indicator of the existence motive.
It was inquired whether the community has any information on or awareness of the climate change and carbon sequestration service of forest ecosystems by the judgment reading, “I am informed about the climate regulation and carbon sequestration functions of forests”.
It was inquired whether the financial costs for increasing the carbon sequestered by forest ecosystems stand out by the judgment reading, “It is important to spend money for the protection and improvement of forests to increase carbon sequestration and the establishment of new forests”. People believe it is acceptable to spend money, not only by themselves, but also by the whole community, for the establishment of new forests and the preservation of the existing ones in order to achieve protection from the damages of climate change and to increase the carbon sequestration, and they may have the WTP for this. Those who accept this notion indicate that forests ecosystems are important in terms of climate change and carbon sequestration.
The presence of the heritage motive, which is among the passive use values, was inquired by the judgment reading, “Financial costs can already be tolerated now for the continuation of the carbon sequestration service of forests for ensuring that future generations live in a healthy manner”. People may tolerate financial costs to enable forests to sequester carbon for the purpose of enabling future generations to live in a healthy manner and may have the WTP for this. The acceptance of this notion is the indicator of the presence of the heritage motive.
Respondents were asked to make a choice between new techniques at lower cost and forest ecosystems with the judgment reading, “Forests will no longer have an importance if new carbon sequestration techniques and methods are developed at lower costs”. It is important to protect forest ecosystems for those who do not accept this judgment. Forest ecosystems carry an importance beyond the dimension of financial costs and the development of new technologies.
With the acceptability of the judgment reading, “I would like to be protected from various adverse effects of climate change, starting with those on human health, with the reduction of air pollution, especially around cities, upon the increase and improvement of forest areas”, it was inquired whether it is important for the community that forest areas are increased and improved for fighting against climate change and achieving protection from the adverse effects of climate change. The acceptance of this judgment by the community may ensure support of the theoretical scenario and also impact the amount in the WTP. The motives, value judgments and degrees of the relationship of the community with regard to climate change, carbon sequestration and non-use values of forest ecosystems are provided in
Table 5.
The acceptance rates for the abovementioned notions and motives were assessed as a percentage (%). In addition to the percentage rates, a scale was used to reflect the degree of the value judgment towards climate change, carbon sequestration and non-use values of forest ecosystems for all notions and to enable a comparison between the results, as indicated in
Table 6.
In the assessment of the value judgments of the community towards different motives, it was seen that the strongest motive was the heritage value of forests for future generations, with a very strong degree of relation of 1.225. The value judgment towards the existence value of forest resources was ranked in the third position with a very strong degree of relationship of 1.332; and the value judgment towards the option value was ranked in the fifth position with a very strong degree of relationship of 1.469.
The value judgments of the community towards the abovementioned motives constitute the passive use values within the framework of the TEV. The severity of the value judgments relating to the motives demonstrated that the community’s WTP for the new forest would be high.
Table 5.
The motives, value judgments and degrees of relationship of the community with regard to climate change, carbon sequestration and non-use values of forest ecosystems.
Table 5.
The motives, value judgments and degrees of relationship of the community with regard to climate change, carbon sequestration and non-use values of forest ecosystems.
| Motives | Value Judgment (%) | Degree of Relationship |
|---|
| Strongly Agree (1) | Agree (2) | Neutral (3) | Disagree (4) | Strongly Disagree (5) | (1 + 2) | (4 + 5) | |
|---|
| If I do not benefit from a forest resource, it is not important for me whether this forest resource is damaged or destroyed | 0.00 | 0.38 | 1.53 | 25.57 | 72.52 | 0.38 | 98.09 | 1.298 |
| It is important for me that forests are inherited by future generations (children, grandchildren, etc.). | 79.77 | 18.51 | 1.34 | 0.19 | 0.19 | 98.28 | 0.38 | 1.225 |
| It is very important for me that, even if I don’t use them today, forests will produce goods and services that will be beneficial for me in the future | 62.02 | 31.30 | 4.77 | 1.53 | 0.38 | 93.32 | 1.91 | 1.469 |
| It is important for me that forests, such as tropical forests, continue their existence today and in the future, even if I will never go there, see them or use them | 71,.56 | 24.43 | 3.44 | 0.38 | 0.19 | 95.99 | 0.57 | 1.332 |
| I’m informed about the climate regulation and carbon sequestration functions of forests | 43.70 | 41.03 | 11.64 | 2.48 | 1.15 | 84.73 | 3.63 | 1.763 |
| It is important to spend money for the protection and improvement of forests to increase the carbon sequestered by forests and the establishment of new forests | 56.68 | 34.16 | 7.82 | 0.38 | 0.95 | 90.84 | 1.34 | 1.548 |
| Financial costs can be tolerated already for the continuation of the carbon sequestration service of forests for ensuring that future generations live in a healthy manner | 44.08 | 41.79 | 9.54 | 3.05 | 1.53 | 85.88 | 4.58 | 1.761 |
| Forests will no longer have an importance if new carbon sequestration techniques and methods are developed at lower costs | 0.19 | 2.67 | 12.40 | 46.56 | 38.17 | 2.86 | 84.73 | 1.802 |
| I would like to be protected from various harms of climate change, starting with those on human health, with the reduction of air pollution, especially around cities, upon the increase and improvement of forest areas | 65.84 | 32.63 | 1.34 | 0.19 | 0.00 | 98.47 | 0.19 | 1.359 |
Table 6.
Scale values and degree of relationship of the motives of the respondents with regard to forest resources, climate change and carbon sequestration.
Table 6.
Scale values and degree of relationship of the motives of the respondents with regard to forest resources, climate change and carbon sequestration.
| Scale Value | Degree of Relationship |
|---|
| 1.00–1.79 | Very Strong |
| 1.80–2.59 | Strong |
| 2.60–3.39 | Medium |
| 3.40–4.19 | Low |
| 4.20–5.00 | Very Low |
3.6. Results Related to the Contingent Valuation Method (Consumer Surplus and Total Economic Value)
In order to detect whether the respondents have the WTP or not, a question, “Would you provide a financial contribution for the new forest via donation?” was asked of respondents. The assessment of the answers showed that 56.9% of the respondents said “yes”, 22.9% said “no” and 20.2% said “I don’t know/I have no idea”.
It was indicated that the absence of the WTP in the contingent valuation studies cannot always be evaluated as a protest answer, but as a “zero answer”
. One way to distinguish between zero answers and protest answers is to learn the reason [
48]. Therefore, a yes-no question was asked of the respondents who did not want to make a donation. Furthermore, respondents were given the opportunity to express themselves about the reasons for not making a donation with the “other”, open-ended yes-no option. Answers were analyzed to distinguish protest answers and zero answers.
The answer of 143 respondents who were really not interested in the topics of climate change and carbon sequestration due to economic reasons included insufficient income level, heavy payments, such as loans or taxes, the existence of more important problems in the country and that investments should be used for the settlement of more prioritized problems and, therefore, did not display a strategic behavior, was regarded as “zero WTP” and included in the contingent valuation analysis.
Those who would benefit from the new forest, but did not want to make a donation upon acting strategically were regarded as protesters and were excluded from the valuation analysis. It was detected in the evaluation that there were 83 protest answers, and these questionnaires were not added to the contingent valuation analysis. The cause analysis of the protest and zero WTP answers is given in
Table 7.
Table 7.
Zero willingness to pay (WTP) and protest answers.
Table 7.
Zero willingness to pay (WTP) and protest answers.
| Reasons | No. | % |
|---|
| Zero WTP | I’m not interested in this topic | 1 | 0.2 |
| | I have a lot of tax payments and similar payments | 51 | 9.7 |
| | My income level is insufficient | 73 | 13.9 |
| | There are more important problems in our country | 11 | 2.1 |
| | The investments should be used for more prioritized problems | 7 | 1.3 |
| Total | | 143 | 27.3 |
| Protest Answers | It is the duty of the state to grow forests | 21 | 4.0 |
| | I don’t think that the money collected will be used as indicated | 45 | 8.6 |
| | I don’t believe that the project will be successful | 6 | 1.1 |
| | Whoever is polluting it should pay for it | 4 | 0.8 |
| | There is no reason to establish such a forest | 0 | 0.0 |
| | The forest areas in our country are sufficient | 1 | 0.2 |
| | I will not use the forest to be established | 1 | 0.2 |
| | Other | 5 | 1.0 |
| Total | | 83 | 15.8 |
| General Total | 226 | 43.1 |
There is a perception in Turkey stating that the money collected within the scope of various activities is not used in line with its purpose or is not used correctly. The same result was also found by [
43]. It was indicated during the conducting of the questionnaires that the community did not want to pay because of these reasons.
In Turkey, forests are state-owned and managed by the state, and forestry activities are conducted and financed by the state. Therefore, the community has the perception that all people have the right to benefit and use forests freely. There was another perception that the state has a responsibility to establish, maintain and conserve forests. Furthermore, people pay taxes, and therefore, they did not want to pay more. Additionally, although the community, especially with the WTP, had strong motives with respect to the environmental problems, climate change, heritage, existence and option values of forest resources and the protection of these resources, their WTP was low due to the reasons mentioned above.
A correlation analysis (
Table 8) was conducted primarily for identifying the factors that had an impact on the acceptance of the value propositions with regard to the new forest, in other words that had an impact on the WTP.
Table 8.
Summary of the correlation analysis.
Table 8.
Summary of the correlation analysis.
| Independent Variables | Definition | WTP |
|---|
| Pearson Correlation Coefficient | Sig. | N |
|---|
| Climate change | Climate change | −0.106 | 0.026 * | 441 |
| Environmental pollution | Human-induced environmental pollution | 0.011 | 0.824 | 441 |
| Agricultural production | Pollution in agriculture production | 0.096 | 0.044 * | 441 |
| Natural disaster | Fire, flood, avalanche, etc. | 0.135 | 0.005 ** | 441 |
| Erosion | Erosion | −0.047 | 0.326 | 441 |
| Grazing | Utilization of forest for grazing | 0.180 | 0.000 ** | 441 |
| Biodiversity | Biodiversity protection | −0.113 | 0.017 * | 441 |
| Climate regulation | Climate regulation and avoid adverse effects of climate chance services of forests | −0.185 | 0.000 ** | 441 |
| Intrinsic value | If I do not benefit from a forest resource, it is not important for me whether this forest resource is damaged or destroyed | −0.169 | 0.000 ** | 441 |
| Carbon information | I am informed about the climate regulation and carbon sequestration functions of forests | −0.197 | 0.000 ** | 441 |
| Heritage | Financial costs can be tolerated already for the continuation of the carbon sequestration service of forests for ensuring that future generations live in a healthy manner | −0.195 | 0.000 ** | 441 |
| Climate protection | I would like to be protected from various adverse effects of climate change, starting with those on human health, with the reduction of air pollution, especially around cities, upon the increase and improvement of forest areas | −0.184 | 0.000 ** | 441 |
| Unplanned urbanization | Unplanned urbanization | −0.060 | 0.212 | 441 |
| Residence | Residence | −0.207 | 0.000 ** | 441 |
| Age | Ages of respondents | 0.113 | 0.018 * | 441 |
| Gender | Gender of respondents | −0.072 | 0.132 | 441 |
| Marital status | Marital status of respondents | −0.017 | 0.728 | 441 |
| Occupation | Occupation of respondents | 0.075 | 0.115 | 441 |
| No of household members | Number of household members | −0.187 | 0.000 ** | 441 |
| Income per capita | Per capita income of each respondent | 0.466 | 0.000 ** | 441 |
| Forest policy | This study results will provide new approaches for forest policy development | 0.086 | 0.070 | 441 |
Upon sorting out the protest answers, a multiple linear regression analysis was conducted with 441 questionnaires, including zero WTP. As a result of the multiple linear regression analysis, it was observed that the variables, climate change and biodiversity, were significant at the 95% confidence level; the age variable was significant at the 95% confidence level and indicated that older individuals were more willing to pay; the climate protection, climate regulation and per capita income variables were significant at the 99% confidence level and demonstrated that WTP increases as people attach value to the climate regulation service and would like to be protected from the various adverse effects of climate change and that WTP increases as income increases.
The number of household members variable was significant at the 99% confidence level, as expected, demonstrating that the WTP decreases while the number of household members increases.
The intrinsic value, carbon information, heritage and climate protection variables were significant at the 99% confidence level and were negative, as expected. The WTP will increase in relation to the increase in the level of the value judgments for the protection of forests, even if the community does not benefit from it, the transfer of forests to the next generation, the knowledge level of climate change and the carbon sequestration services of forest ecosystems and the demands for protection from the adverse effects of climate change.
The summary of the multiple linear regression analysis model related to the WTP and coefficients of the regression model are presented in
Table 9 and
Table 10, respectively. The estimated regression model was found significant at the 99% confidence level.
Multiple regression (R) = 0.557 resulted from the regression analysis model on the WTP, whereas R2 was determined as 0.311. Thus, it is understood that the description rate of the WTP, which is a dependent variable, by the independent variables was 31.1%.
Table 9.
Model summary b.
Table 9.
Model summary b.
| Model | R | R2 | Adjusted R2 | Standard Error | Change Statistics | Durbin–Watson |
|---|
| | | | | | R2 Change | F Change | Degrees of freedom1 | Degrees of freedom2 | Sig. F Change | |
| 1 | 0.557 a | 0.311 | 0.276 | 62.02350 | 0.311 | 8.996 | 21 | 419 | 0.000 | 1.869 |
In the model, sample size (N) was 441 and with 22 independent variables (n), degrees of freedom1 (df1) were determined as 21 (n − 1). In addition to df1, degrees of freedom2 (df2) was determined as 419 (N − n). According to analyses, F value (8.996) of the model, were significant at the 0.01 level.
Table 10.
Coefficients a.
Table 10.
Coefficients a.
| Variables | Unstandardized Coefficients | Standardized Coefficients | t | Sig. | 95% Confidence Interval for B |
|---|
| B | Standard Error | Beta | | | Lower Bound | Upper Bound |
|---|
| Constant | 41.938 | 42.926 | | 0.977 | 0.329 | –42.439 | 126.315 |
| Climate change * | –2.376 | 1.704 | –0.064 | –1.395 | 0.164 * | –5.725 | 0.973 |
| Environmental pollution | 2.930 | 1.793 | 0.076 | 1.634 | 0.103 | –0.594 | 6.453 |
| Agricultural production * | 2.780 | 2.009 | 0.062 | 1.384 | 0.167 * | –1.168 | 6.729 |
| Natural disaster ** | 2.004 | 1.892 | 0.047 | 1.059 | 0.290 ** | –1.716 | 5.723 |
| Erosion | –3.572 | 2.518 | –0.063 | –1.418 | 0.157 | –8.522 | 1.378 |
| Grazing ** | 2.509 | 2.029 | 0.055 | 1.236 | 0.217 ** | –1.480 | 6.497 |
| Biodiversity * | –0.410 | 1.664 | –0.011 | –0.247 | 0.805 * | –3.681 | 2.860 |
| Climate regulation ** | –0.823 | 1.316 | –0.028 | –0.625 | 0.532 ** | –3.409 | 1.763 |
| Intrinsic value ** | –7.483 | 6.286 | –0.053 | –1.190 | 0.235 ** | –19.840 | 4.873 |
| Carbon info ** | –3.880 | 4.162 | –0.045 | –0.932 | 0.352 ** | –12.062 | 4.301 |
| Heritage ** | –7.695 | 4.236 | –0.086 | –1.816 | 0.070 ** | –16.022 | 0.632 |
| Climate protection ** | –1.809 | 6.794 | –0.013 | –0.266 | 0.790 ** | –15.164 | 11.546 |
| Unplanned urbanization | –2.838 | 1.696 | –0.073 | –1.674 | 0.095 | –6.171 | 0.495 |
| Residence ** | –0.279 | 0.246 | –0.052 | –1.137 | 0.256 ** | –0.762 | 0.204 |
| Age * | 6.586 | 3.287 | 0.101 | 2.004 | 0.046 * | 0.125 | 13.048 |
| Gender | –9.087 | 6.490 | –0.060 | –1.400 | 0.162 | –21.844 | 3.669 |
| Marital status | –9.891 | 6.371 | –0.077 | –1.553 | 0.121 | –22.414 | 2.631 |
| Occupation | 3.279 | 1.114 | 0.126 | 2.942 | 0.003 | 1.088 | 5.470 |
| No of household members ** | –3.343 | 2.274 | –0.064 | –1.470 | 0.142 ** | –7.813 | 1.128 |
| Income per capita ** | 13.744 | 1.746 | 0.378 | 7.870 | 0.000 ** | 10.311 | 17.177 |
| Forest policy | 4.705 | 3.486 | 0.059 | 1.349 | 0.178 | –2.149 | 11.558 |
According to the multiple linear regression models, average WTP per household for the new forest was estimated as $23.52/year.
The number of households was calculated by dividing the total population of the cities where the survey was conducted by the number of people living in the household. Thus, the total annual economic value was estimated as $270,443,962.68 (
Table 11).
Table 11.
Total economic value.
Table 11.
Total economic value.
| WTP per Household ($) | Number of Houses | Total Economic Value ($) |
|---|
| WTP | ΣHS | TEV = WTP × ΣHS |
| 23.52 | 11,498,268.26 | 270,443,962.68 |
In the contingent valuation studies conducted throughout the world in relation to climate change and the carbon economy, WTP for offsetting greenhouse gases arising from air travel was estimated as £24 [
42]. The annual WTP per household was detected as £19.2 in the contingent valuation study conducted in Seoul, Korea, with regard to the prevention of climate change [
60].
In another study, average WTP, which will be paid to the Turkish fund for only Turkey, was estimated as $78.62. In the second scenario, the WTP question was asked again for all countries around the world, and the average WTP that will be paid to global fund for world was estimated as $72.21 [
61].
Since carbon is being traded in carbon markets as a commodity, the values obtained in this paper can be compared with data from “The Economics of Carbon Sequestration and Carbon Market in Forestry” [
62]. It was pointed out that the value has changed between $5.5 and $9.2 per metric ton of CO
2 equivalent in the current forest carbon markets around the world since 2010.
Meanwhile, in two studies conducted by [
63] and [
64], it was reported that 7.92 MtC was sequestered annually in Turkish forests; with a price of 20 $/tC, the value of the total carbon sequestration service was estimated as $158.4 M. When converted into tCO
2e, the price of CO
2e was $73.33, and the annual amount of carbon sequestered in Turkish forests was 29.04 MtCO
2e. Thus, the annual carbon sequestration service of Turkish forests amounted to $2129.5 M.
Considering that WTP calculated in this paper is equivalent to $23.52, it is apparently possible to obtain different magnitudes for the monetary values of CO2 equivalent using different methodologies.
It was observed that the value found within the scope of the study conducted with contingent valuation was lower than the values mentioned above, but higher than the carbon markets. The reason may be explained by the fact that the topics related to climate change and carbon sequestration in Turkey are newly being realized and that the degree of consciousness regarding this topic is not yet at the required level.
However, this estimated value was important in terms of knowing the value of the carbon sequestration service, which does not yet have a good market in Turkey, from the perspective of the community and increasing the awareness of the community towards this topic.
4. Conclusions
This paper highlighted important ecosystem services related to climate change and carbon sequestration. According to the multiple linear regression model, per capita consumer surplus or the maximum WTP for a new forest was estimated as $23.52 in Turkey. Meanwhile, total annual economic value was estimated as $270,443,962.68.
Considering the WTP of the community for a new forest in Turkey and the average carbon price in the emissions trading systems worldwide, it was observed that the WTP was higher than the average carbon price. The reason for the high level of the WTP was due to the importance placed by the community, not only on the active use values constituting the market price, but also on non-market passive use values.
The determination of an economic value of carbon sequestration services of forest ecosystems in the fight against climate change was important in terms of demonstrating that even non-market products and services have an economic value. This value should be included in economic indicators and taken into consideration for the policy process. In this respect, the survey provided reliable and valid information for future scientific studies, as well as decision-making processes, especially for units of the General Directorate of Forestry, which manages the forest resources in Turkey.
The dimension of the benefits through carbon sequestration in forest ecosystems was revealed to resource managers. Furthermore, the importance of including variables related to carbon sequestration into policies, plans, programs and projects for natural resource management was highlighted. Finally, the consideration of carbon sequestration as a service of functional natural resource management was demonstrated.
In this regard, forests can be conserved and established as carbon forests; production plans can be re-planned according to carbon sequestration; and carbon certificates and additional income could be generated from carbon forests.


