
Habitat Mapping of the Leopard Cat (Prionailurus bengalensis) in South Korea Using GIS


Abstract
:1. Introduction

2. Data
2.1. Leopard Cat Survey
2.2. Controlling Factors

| Category | Factors | Data Type | Scale |
|---|---|---|---|
| Habitat | Leopard cat | Point | - |
| Forest map a | Timber type Timber age | Polygon | 1:25,000 |
| Land Cover | Distance from road (m) Distance from water (m) Distance from forest (m) Land cover | Polygon | 1:25,000 |
| Topographic map b | Ground elevation (m) Slope gradient (°) Slope aspect | GRID | 1:5000 |
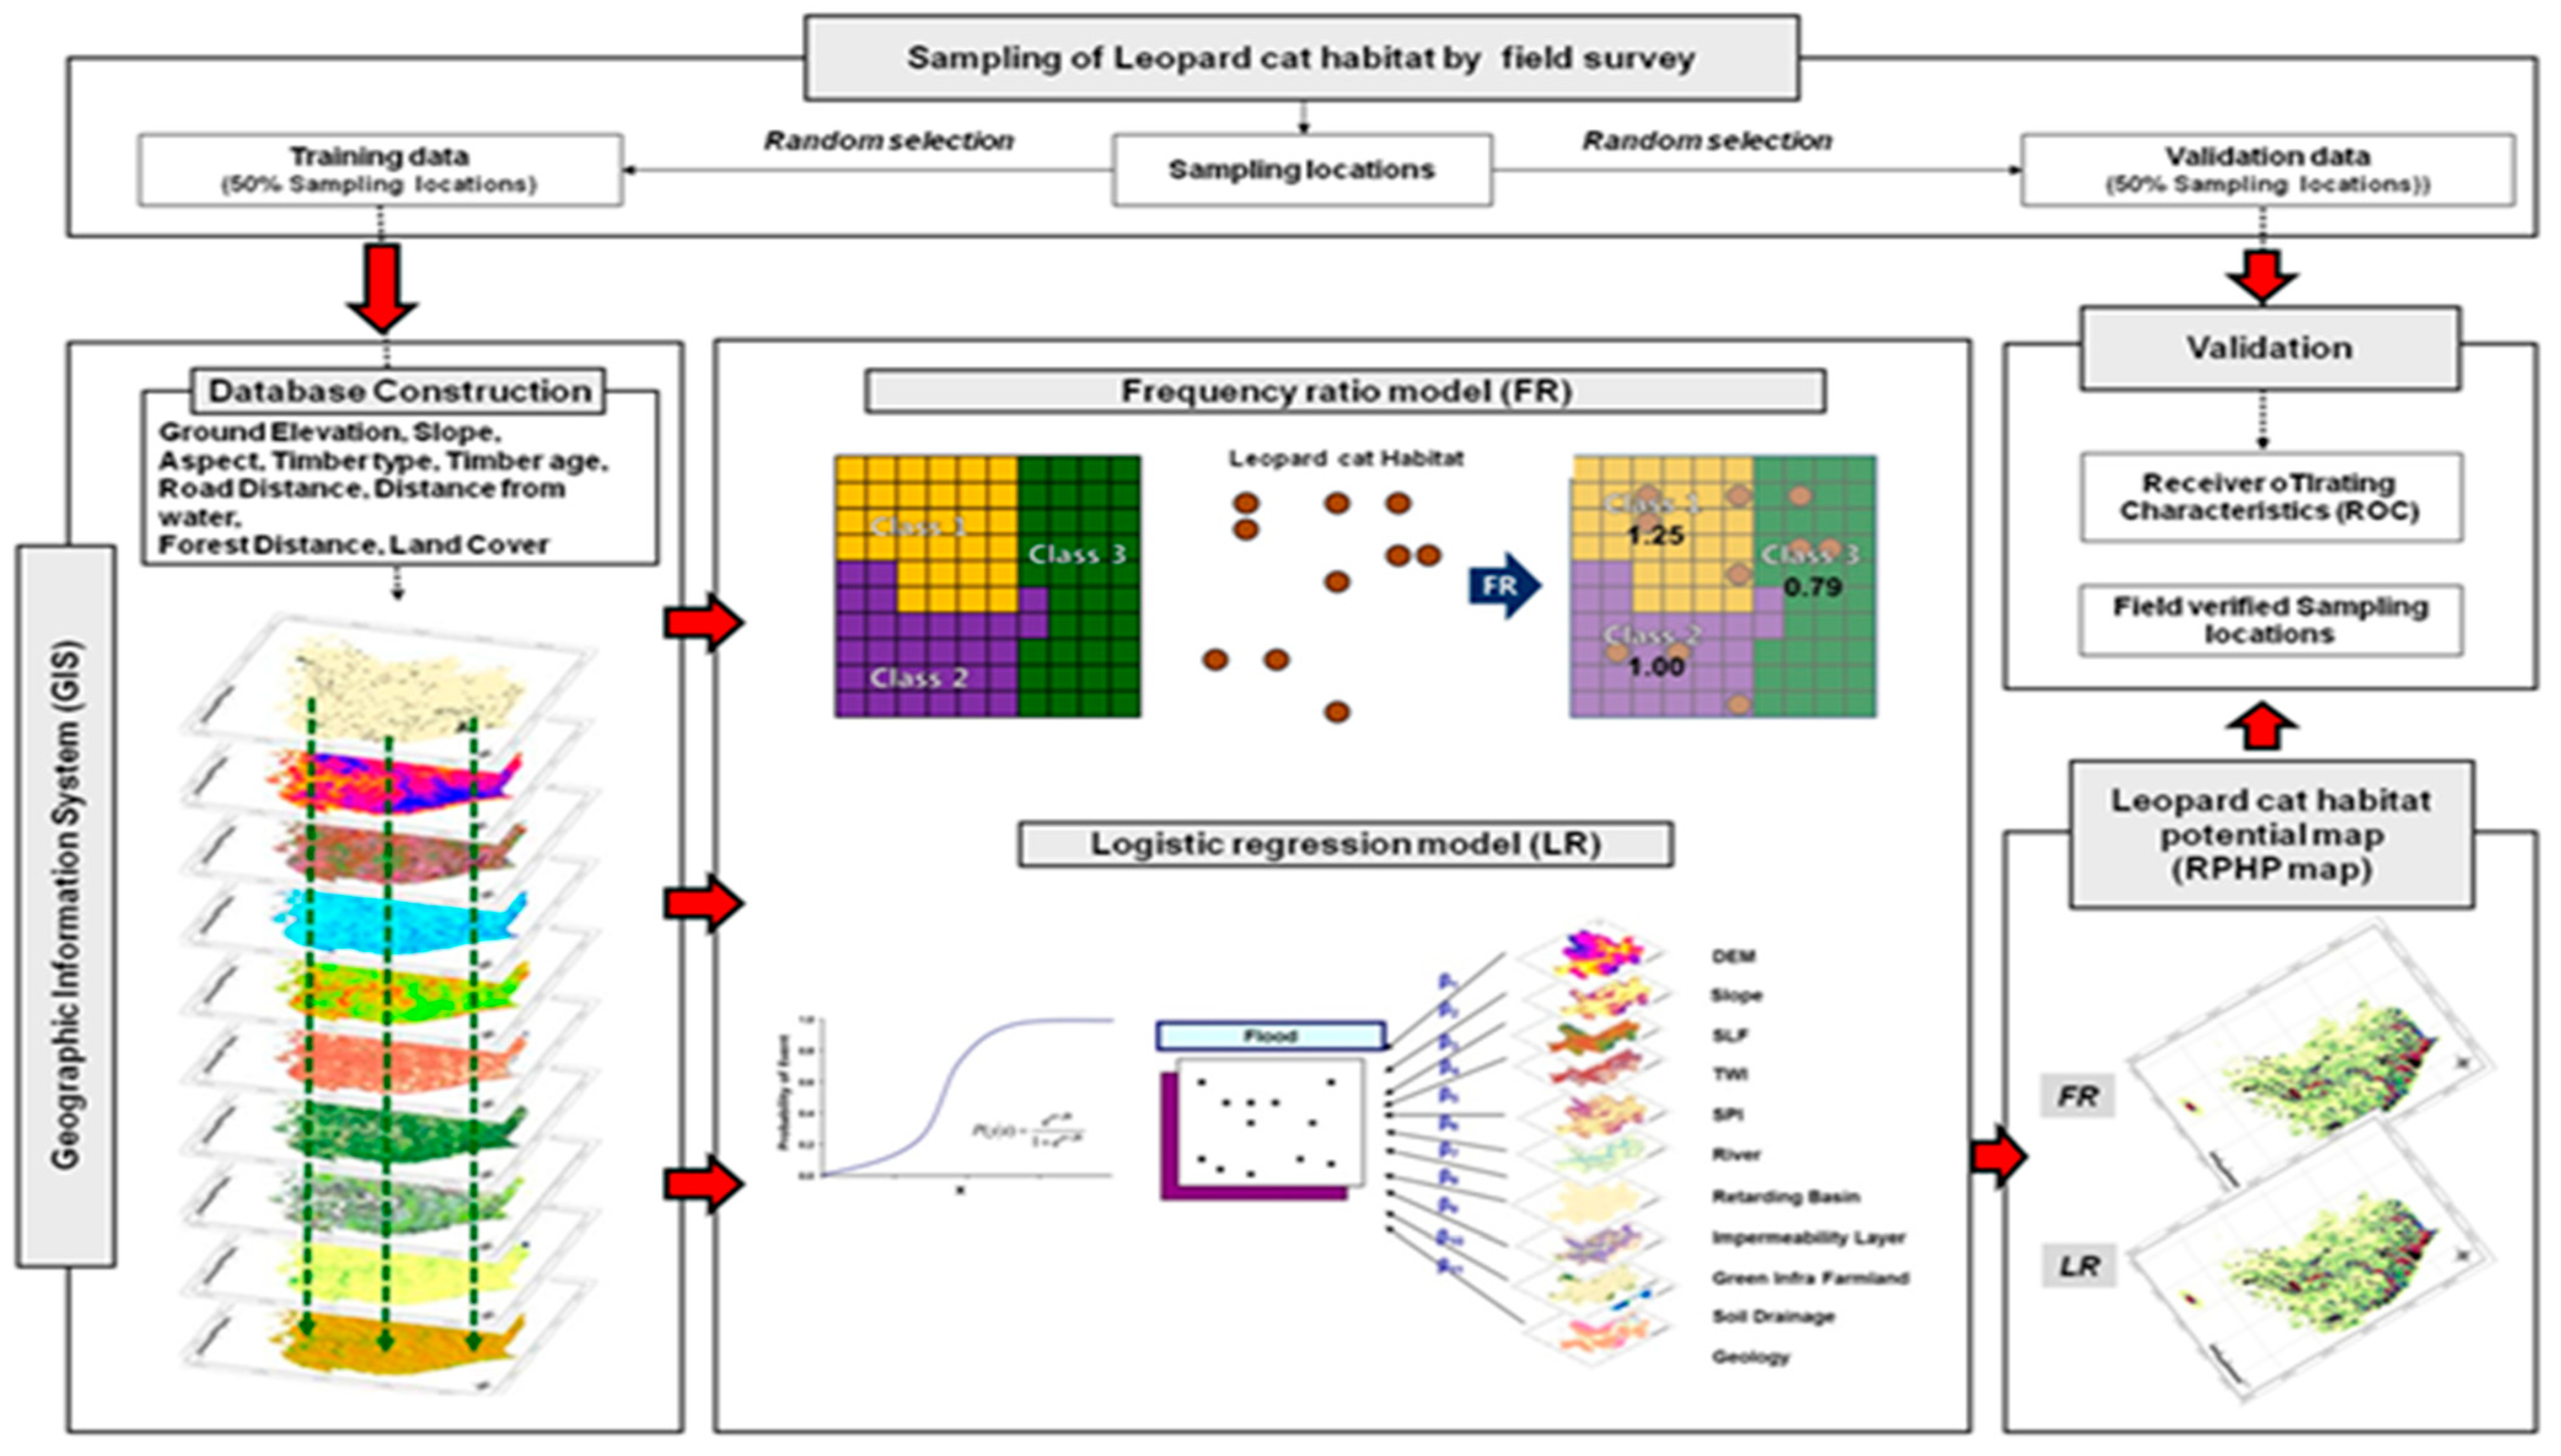
3. Methods

4. Results
4.1. Factors that Influence Leopard Cat Distributions
| Factor | Class | No. of Leopard Cat | % of Leopard Cat | No. of Pixels in Domain | % of Pixels in Domain | Frequency Ratio |
|---|---|---|---|---|---|---|
| Timber Type | No data | 13 | 6.05 | 4,804,101 | 39.03 | 0.15 |
| Farmland | 2 | 0.93 | 63,487 | 0.52 | 1.80 | |
| Larch | 7 | 3.26 | 583,520 | 4.74 | 0.69 | |
| Pinus rigida fores | 5 | 2.33 | 420,983 | 3.42 | 0.68 | |
| Non-stocked forest land | 0 | 0.00 | 17,862 | 0.15 | 0.00 | |
| Chestnut artificial forest | 0 | 0.00 | 57,592 | 0.47 | 0.00 | |
| Cut-over area | 0 | 0.00 | 44 | 0.00 | 0.00 | |
| Pinus densiflora Forests | 37 | 17.21 | 1,961,707 | 15.94 | 1.08 | |
| Pinus densiflora artificial forest | 0 | 0.00 | 17,996 | 0.15 | 0.00 | |
| Pinus koraiensis forest | 0 | 0.00 | 245,009 | 1.99 | 0.00 | |
| Left-over area | 3 | 1.40 | 75,377 | 0.61 | 2.28 | |
| Oak forest | 3 | 1.40 | 25,784 | 0.21 | 6.66 | |
| Oak artificial forest | 0 | 0.00 | 35 | 0.00 | 0.00 | |
| Grassland | 0 | 0.00 | 59,628 | 0.48 | 0.00 | |
| Conifer mixed forest | 0 | 0.00 | 928 | 0.01 | 0.00 | |
| Mixed forest of soft and hardwood | 45 | 20.93 | 1,971,628 | 16.02 | 1.31 | |
| Poplar forest | 7 | 3.26 | 154,432 | 1.25 | 2.59 | |
| Water | 0 | 0.00 | 10 | 0.00 | 0.00 | |
| Broadleaved forest | 93 | 43.26 | 1,838,135 | 14.94 | 2.90 | |
| Denuded land | 0 | 0.00 | 119 | 0.00 | 0.00 | |
| Bamboo stand | 0 | 0.00 | 8276 | 0.07 | 0.00 | |
| Other | 0 | 0.00 | 786 | 0.01 | 0.00 | |
| Timber age | Non forest area | 20 | 9.30 | 4,807,568 | 39.06 | 0.24 |
| 1st age | 8 | 3.72 | 348,170 | 2.83 | 1.31 | |
| 2nd age | 11 | 5.12 | 1,119,393 | 9.10 | 0.56 | |
| 3rd age | 73 | 33.95 | 3,093,566 | 25.14 | 1.35 | |
| 4th age | 60 | 27.91 | 2,229,052 | 18.11 | 1.54 | |
| 5th age | 24 | 11.16 | 558,152 | 4.54 | 2.46 | |
| 6th age | 19 | 8.84 | 151,538 | 1.23 | 7.18 | |
| Distance from forest (m) | 0 | 200 | 93.02 | 7,599,556 | 61.75 | 1.51 |
| 0–376 | 15 | 6.98 | 3,758,175 | 30.54 | 0.23 | |
| 376–752 | 0 | 0.00 | 590,022 | 4.79 | 0.00 | |
| 752–1129 | 0 | 0.00 | 173,595 | 1.41 | 0.00 | |
| 1129–1505 | 0 | 0.00 | 56,364 | 0.46 | 0.00 | |
| 1505–1881 | 0 | 0.00 | 47,662 | 0.39 | 0.00 | |
| 1881–2633 | 0 | 0.00 | 39,695 | 0.32 | 0.00 | |
| 2633–5266 | 0 | 0.00 | 17,803 | 0.14 | 0.00 | |
| 5266–9780 | 0 | 0.00 | 11,995 | 0.10 | 0.00 | |
| 9780–96,299 | 0 | 0.00 | 12,572 | 0.10 | 0.00 | |
| Distance from road (m) | 0 | 1 | 0.47 | 998,165 | 8.11 | 0.06 |
| 0–892 | 42 | 19.53 | 7,167,235 | 58.23 | 0.34 | |
| 892–1783 | 73 | 33.95 | 2,503,822 | 20.34 | 1.67 | |
| 1783–2675 | 56 | 26.05 | 878,584 | 7.14 | 3.65 | |
| 2675–3566 | 26 | 12.09 | 321,628 | 2.61 | 4.63 | |
| 3566–5346 | 12 | 5.58 | 204,622 | 1.66 | 3.36 | |
| 5346–8024 | 5 | 2.33 | 76,207 | 0.62 | 3.76 | |
| 8024–12,481 | 0 | 0.00 | 62,533 | 0.51 | 0.00 | |
| 12,481–21,396 | 0 | 0.00 | 50,792 | 0.41 | 0.00 | |
| 21,396–228,225 | 0 | 0.00 | 43,851 | 0.36 | 0.00 | |
| Distance from Water (m) | 0–300 | 49 | 22.79 | 6,341,839 | 51.53 | 0.44 |
| 300–600 | 132 | 61.40 | 4,277,696 | 34.76 | 1.77 | |
| 600–900 | 33 | 15.35 | 1,307,761 | 10.63 | 1.44 | |
| 900–1200 | 1 | 0.47 | 228,651 | 1.86 | 0.25 | |
| 1200–1500 | 0 | 0.00 | 75,739 | 0.62 | 0.00 | |
| 1500–1800 | 0 | 0.00 | 47,220 | 0.38 | 0.00 | |
| 1800–2200 | 0 | 0.00 | 7338 | 0.06 | 0.00 | |
| 2200–2900 | 0 | 0.00 | 3196 | 0.03 | 0.00 | |
| 2900–4100 | 0 | 0.00 | 9733 | 0.08 | 0.00 | |
| 4100–231,600 | 0 | 0.00 | 8266 | 0.07 | 0.00 | |
| Land Cover | No Data | 0 | 0.00 | 25,366 | 0.21 | 0.00 |
| Other | 0 | 0.00 | 6 | 0.00 | 0.00 | |
| Residential Area | 1 | 0.47 | 368,259 | 2.99 | 0.16 | |
| Manufacturing Area | 0 | 0.00 | 87,177 | 0.71 | 0.00 | |
| Commercial Area | 0 | 0.00 | 51,080 | 0.42 | 0.00 | |
| Recreational Area | 0 | 0.00 | 7266 | 0.06 | 0.00 | |
| Trafficker Area | 1 | 0.47 | 150,279 | 1.22 | 0.38 | |
| Public Area | 0 | 0.00 | 63,623 | 0.52 | 0.00 | |
| Agricultural Area | 0 | 0.00 | 30 | 0.00 | 0.00 | |
| Paddy | 4 | 1.86 | 1,673,342 | 13.60 | 0.14 | |
| Field | 7 | 3.26 | 1,086,507 | 8.83 | 0.37 | |
| Growing in Plastic Greenhouse | 0 | 0.00 | 55,590 | 0.45 | 0.00 | |
| Orchard | 0 | 0.00 | 166,213 | 1.35 | 0.00 | |
| Other Plantations | 0 | 0.00 | 44,730 | 0.36 | 0.00 | |
| Broadleaved Forest | 87 | 40.47 | 2,121,556 | 17.24 | 2.35 | |
| Coniferous Forest | 56 | 26.05 | 3,398,502 | 27.61 | 0.94 | |
| Mixed Forest | 57 | 26.51 | 2,038,541 | 16.56 | 1.6 | |
| Forest Area | 0 | 0.00 | 12 | 0.00 | 0.00 | |
| Natural Grassland | 0 | 0.00 | 64,109 | 0.52 | 0.00 | |
| Artificial Pasture | 0 | 0.00 | 14,778 | 0.12 | 0.00 | |
| Other Grassland | 1 | 0.47 | 201,126 | 1.63 | 0.29 | |
| Wetland | 0 | 0.00 | 4 | 0.00 | 0.00 | |
| Inland Wetland | 1 | 0.47 | 84,990 | 0.69 | 0.68 | |
| Coastal Wetland | 0 | 0.00 | 43,714 | 0.36 | 0.00 | |
| Bare Land | 0 | 0.00 | 20 | 0.00 | 0.00 | |
| Natural Bare Land | 0 | 0.00 | 10,630 | 0.09 | 0.00 | |
| Other Bare Land | 0 | 0.00 | 207,758 | 1.69 | 0.00 | |
| Beach | 0 | 0.00 | 1 | 0.00 | 0.00 | |
| Inland Water | 0 | 0.00 | 271,565 | 2.21 | 0.00 | |
| Marine Water | 0 | 0.00 | 70,665 | 0.57 | 0.00 | |
| Ground Elevation (m) | 1–20 | 1 | 0.47 | 1,477,428 | 12.00 | 0.04 |
| 20–60 | 3 | 1.40 | 1,528,017 | 12.42 | 0.11 | |
| 60–100 | 6 | 2.79 | 1,252,322 | 10.18 | 0.27 | |
| 100–149 | 10 | 4.65 | 1,162,504 | 9.45 | 0.49 | |
| 149–200 | 15 | 6.98 | 1,215,807 | 9.88 | 0.71 | |
| 200–264 | 9 | 4.19 | 1,145,797 | 9.31 | 0.45 | |
| 264–342 | 15 | 6.98 | 1,133,705 | 9.21 | 0.76 | |
| 342–456 | 42 | 19.53 | 1,135,628 | 9.23 | 2.12 | |
| 456–640 | 41 | 19.07 | 1,135,580 | 9.23 | 2.07 | |
| 640–1940 | 73 | 33.95 | 1,120,651 | 9.11 | 3.73 | |
| Slope gradient (°) | 0 | 0 | 0.00 | 1,598,779 | 12.99 | 0.00 |
| 0–2.7 | 6 | 2.79 | 1,221,822 | 9.93 | 0.28 | |
| 2.7–5.3 | 12 | 5.58 | 1,227,435 | 9.97 | 0.56 | |
| 5.3–8.0 | 16 | 7.44 | 1,187,745 | 9.65 | 0.77 | |
| 8.0–11.0 | 26 | 12.09 | 1,175,879 | 9.55 | 1.27 | |
| 11.0–13.8 | 28 | 13.02 | 1,166,970 | 9.48 | 1.37 | |
| 13.8–17.0 | 38 | 17.67 | 1,227,353 | 9.97 | 1.77 | |
| 17.0–20.0 | 20 | 9.3 | 1,188,780 | 9.66 | 0.96 | |
| 20.0–24.5 | 30 | 13.95 | 1,167,277 | 9.48 | 1.47 | |
| 24.5–56.6 | 39 | 18.14 | 1,145,399 | 9.31 | 1.95 | |
| Slope aspect | Flat | 0 | 0.00 | 1,598,779 | 12.99 | 0.00 |
| N | 21 | 9.77 | 1,212,664 | 9.85 | 0.99 | |
| NE | 36 | 16.74 | 1,358,789 | 11.04 | 1.52 | |
| E | 29 | 13.49 | 1,395,191 | 11.34 | 1.19 | |
| SE | 31 | 14.42 | 1,367,292 | 11.11 | 1.30 | |
| S | 16 | 7.44 | 1,235,557 | 10.04 | 0.74 | |
| SW | 24 | 11.16 | 1,389,112 | 11.29 | 0.99 | |
| W | 27 | 12.56 | 1,396,318 | 11.35 | 1.11 | |
| NW | 31 | 14.42 | 1,353,737 | 11.00 | 1.31 |
4.2. Habitat Potential Mapping
| Factor | Class | Logistic Regression Coefficient | Significance Level |
|---|---|---|---|
| Timber Type | No data | 0.000000 | 0.000 |
| Farmland | 2.147514 | ||
| Larch | 2.502028 | ||
| Pinus rigida fores | 0.948505 | ||
| Non-stocked forest land | 2.462551 | ||
| Chestnut artificial forest | 4.025706 | ||
| Cut-over area | 1.895348 | ||
| Pinus densiflora forest | −18.043562 | ||
| Pinus densiflora artificial forest | 3.942215 | ||
| Pinus koraiensis forest | −16.933439 | ||
| Left-over area | 0.000000 | ||
| Oak forest | 2.252224 | ||
| Oak artificial forest | 2.532997 | ||
| Grassland | −22.151046 | ||
| Conifer mixed forest | 2.291914 | ||
| Mixed forest of soft and hardwood | 0.000000 | ||
| Poplar forest | 0.000000 | ||
| Water | 0.000000 | ||
| Broadleaved forest | 0.000000 | ||
| Denuded land | 0.000000 | ||
| Bamboo stand | 0.000000 | ||
| Other | 0.000000 | ||
| Timber age | Non forest area | −0.305775 | 0.002 |
| 1st age | 0.874957 | ||
| 2nd age | −0.260902 | ||
| 3rd age | −0.081416 | ||
| 4th age | 0.087840 | ||
| 5th age | −0.655312 | ||
| 6th age | 0.000000 | ||
| Distance from forest (m) | - | 0.00442 | 0.935 |
| Distance from road (m) | - | −0.00026 | 0.480 |
| Distance from Water (m) | - | −0.000133 | 0.001 |
| Land Cover | No Data | 0.000000 | 0.722 |
| Other | 0.000000 | ||
| Residential Area | 1.252586 | ||
| Manufacturing Area | 2.305031 | ||
| Commercial Area | 2.030913 | ||
| Recreational Area | 2.078151 | ||
| Trafficker Area | 19.626055 | ||
| Public Area | 20.999587 | ||
| Agricultural Area | 0.000000 | ||
| Paddy | 18.571218 | ||
| Field | 18.817534 | ||
| Growing in Plastic Greenhouse | 0.000000 | ||
| Orchard | 1.801892 | ||
| Other Plantations | 3.061980 | ||
| Broadleaved Forest | 18.682290 | ||
| Coniferous Forest | 19.251522 | ||
| Mixed Forest | 19.127733 | ||
| Forest Area | 0.000000 | ||
| Natural Grassland | 17.532816 | ||
| Artificial Pasture | −0.795913 | ||
| Other Grassland | 17.843009 | ||
| Wetland | 0.000000 | ||
| Inland Wetland | 21.357972 | ||
| Coastal Wetland | 0.000000 | ||
| Bare Land | 0.000000 | ||
| Natural Bare Land | 0.442838 | ||
| Other Bare Land | 18.492102 | ||
| Beach | 0.000000 | ||
| Inland Water | 19.498249 | ||
| Marine Water | 0.000000 | ||
| Ground Elevation (m) | - | 0.003815 | 0.000 |
| Slope gradient (°) | - | −0.013209 | 0.130 |
| Slope aspect | - | −0.001690 | 0.004 |


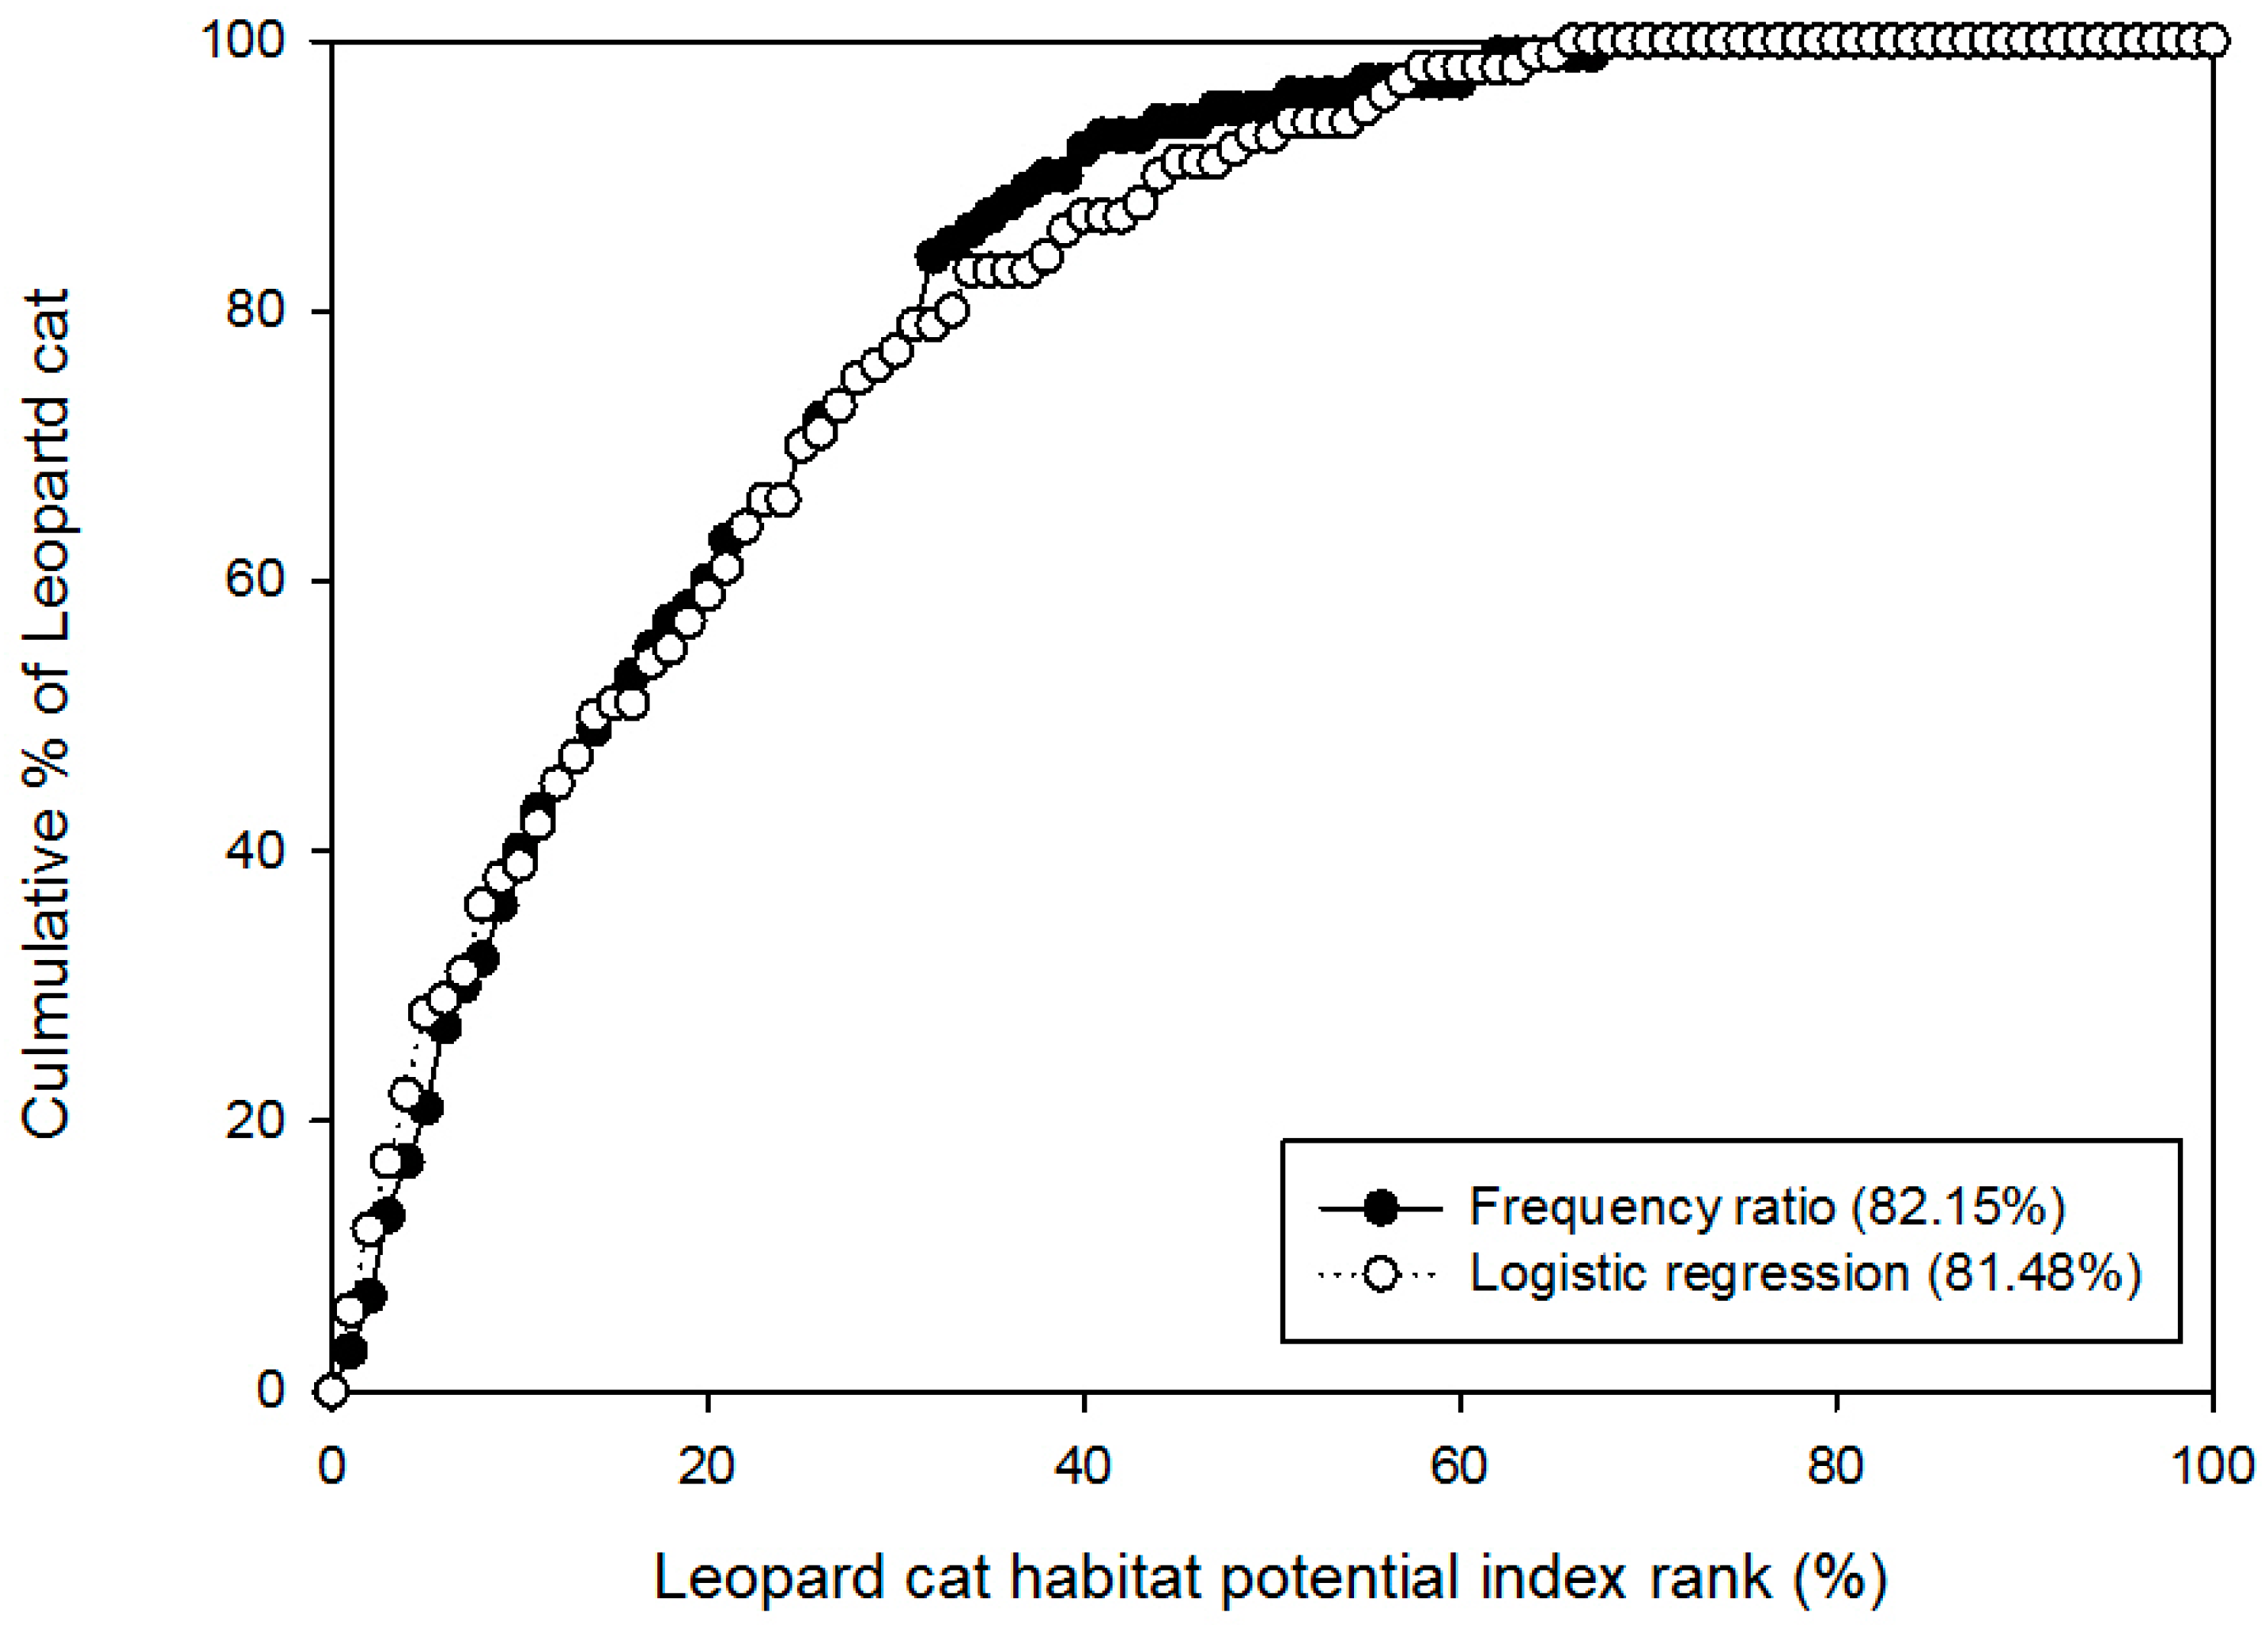
4.3. Validation

5. Conclusions and Discussion
- (1)
- The results of the frequency ratio model indicated that elevation, slope-related factors, and timber age had a positive correlation with locations used by the leopard cat. Areas closer to water and forest and farther from roads, oak forests, and broad-leaved forest classes showed the most positive correlations.
- (2)
- According to the logistic regression coefficients, the factors of slope gradient, timber type (Pinus densiflora and Pinus koraiensis forests, and Grassland), the distance from roads and distance from water were negatively correlated with the locations used by the leopard cat. In contrast, the factors of ground elevation and distance from a forest had a positive effect on leopard cat habitat potential. Some factors contrasted with the results of the frequency ratio, i.e., slope gradient and distance from water.
- (3)
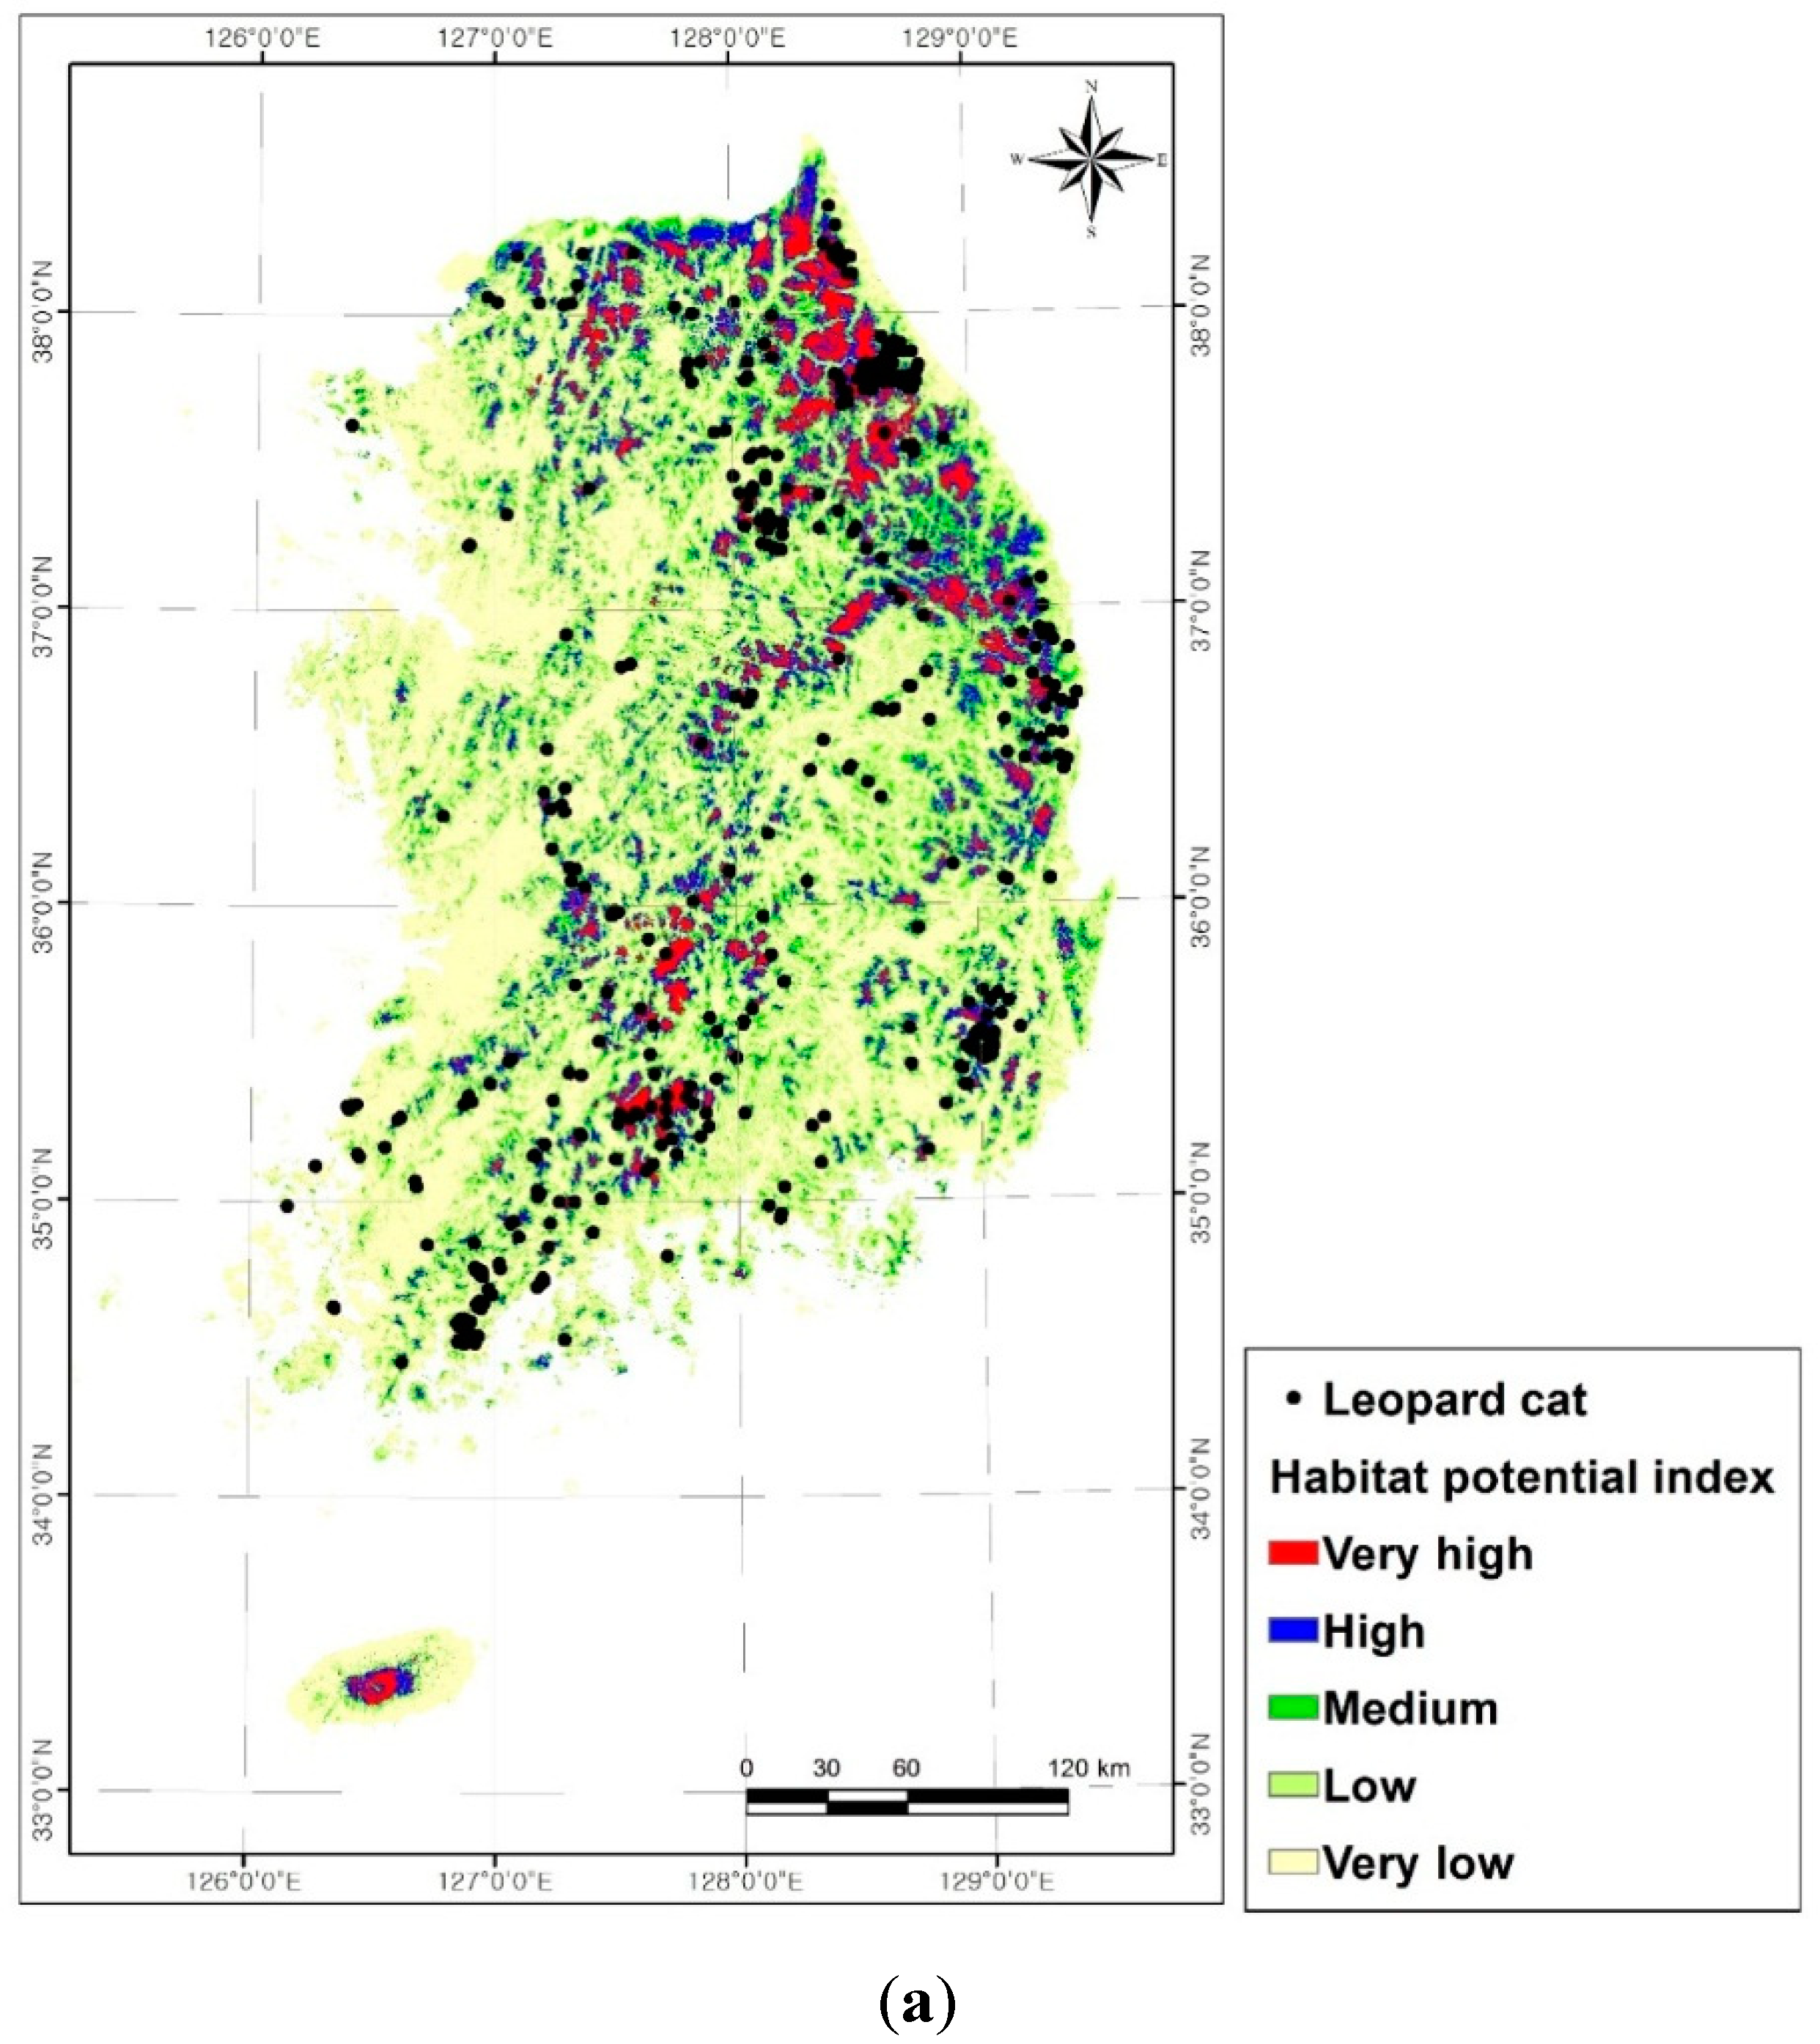
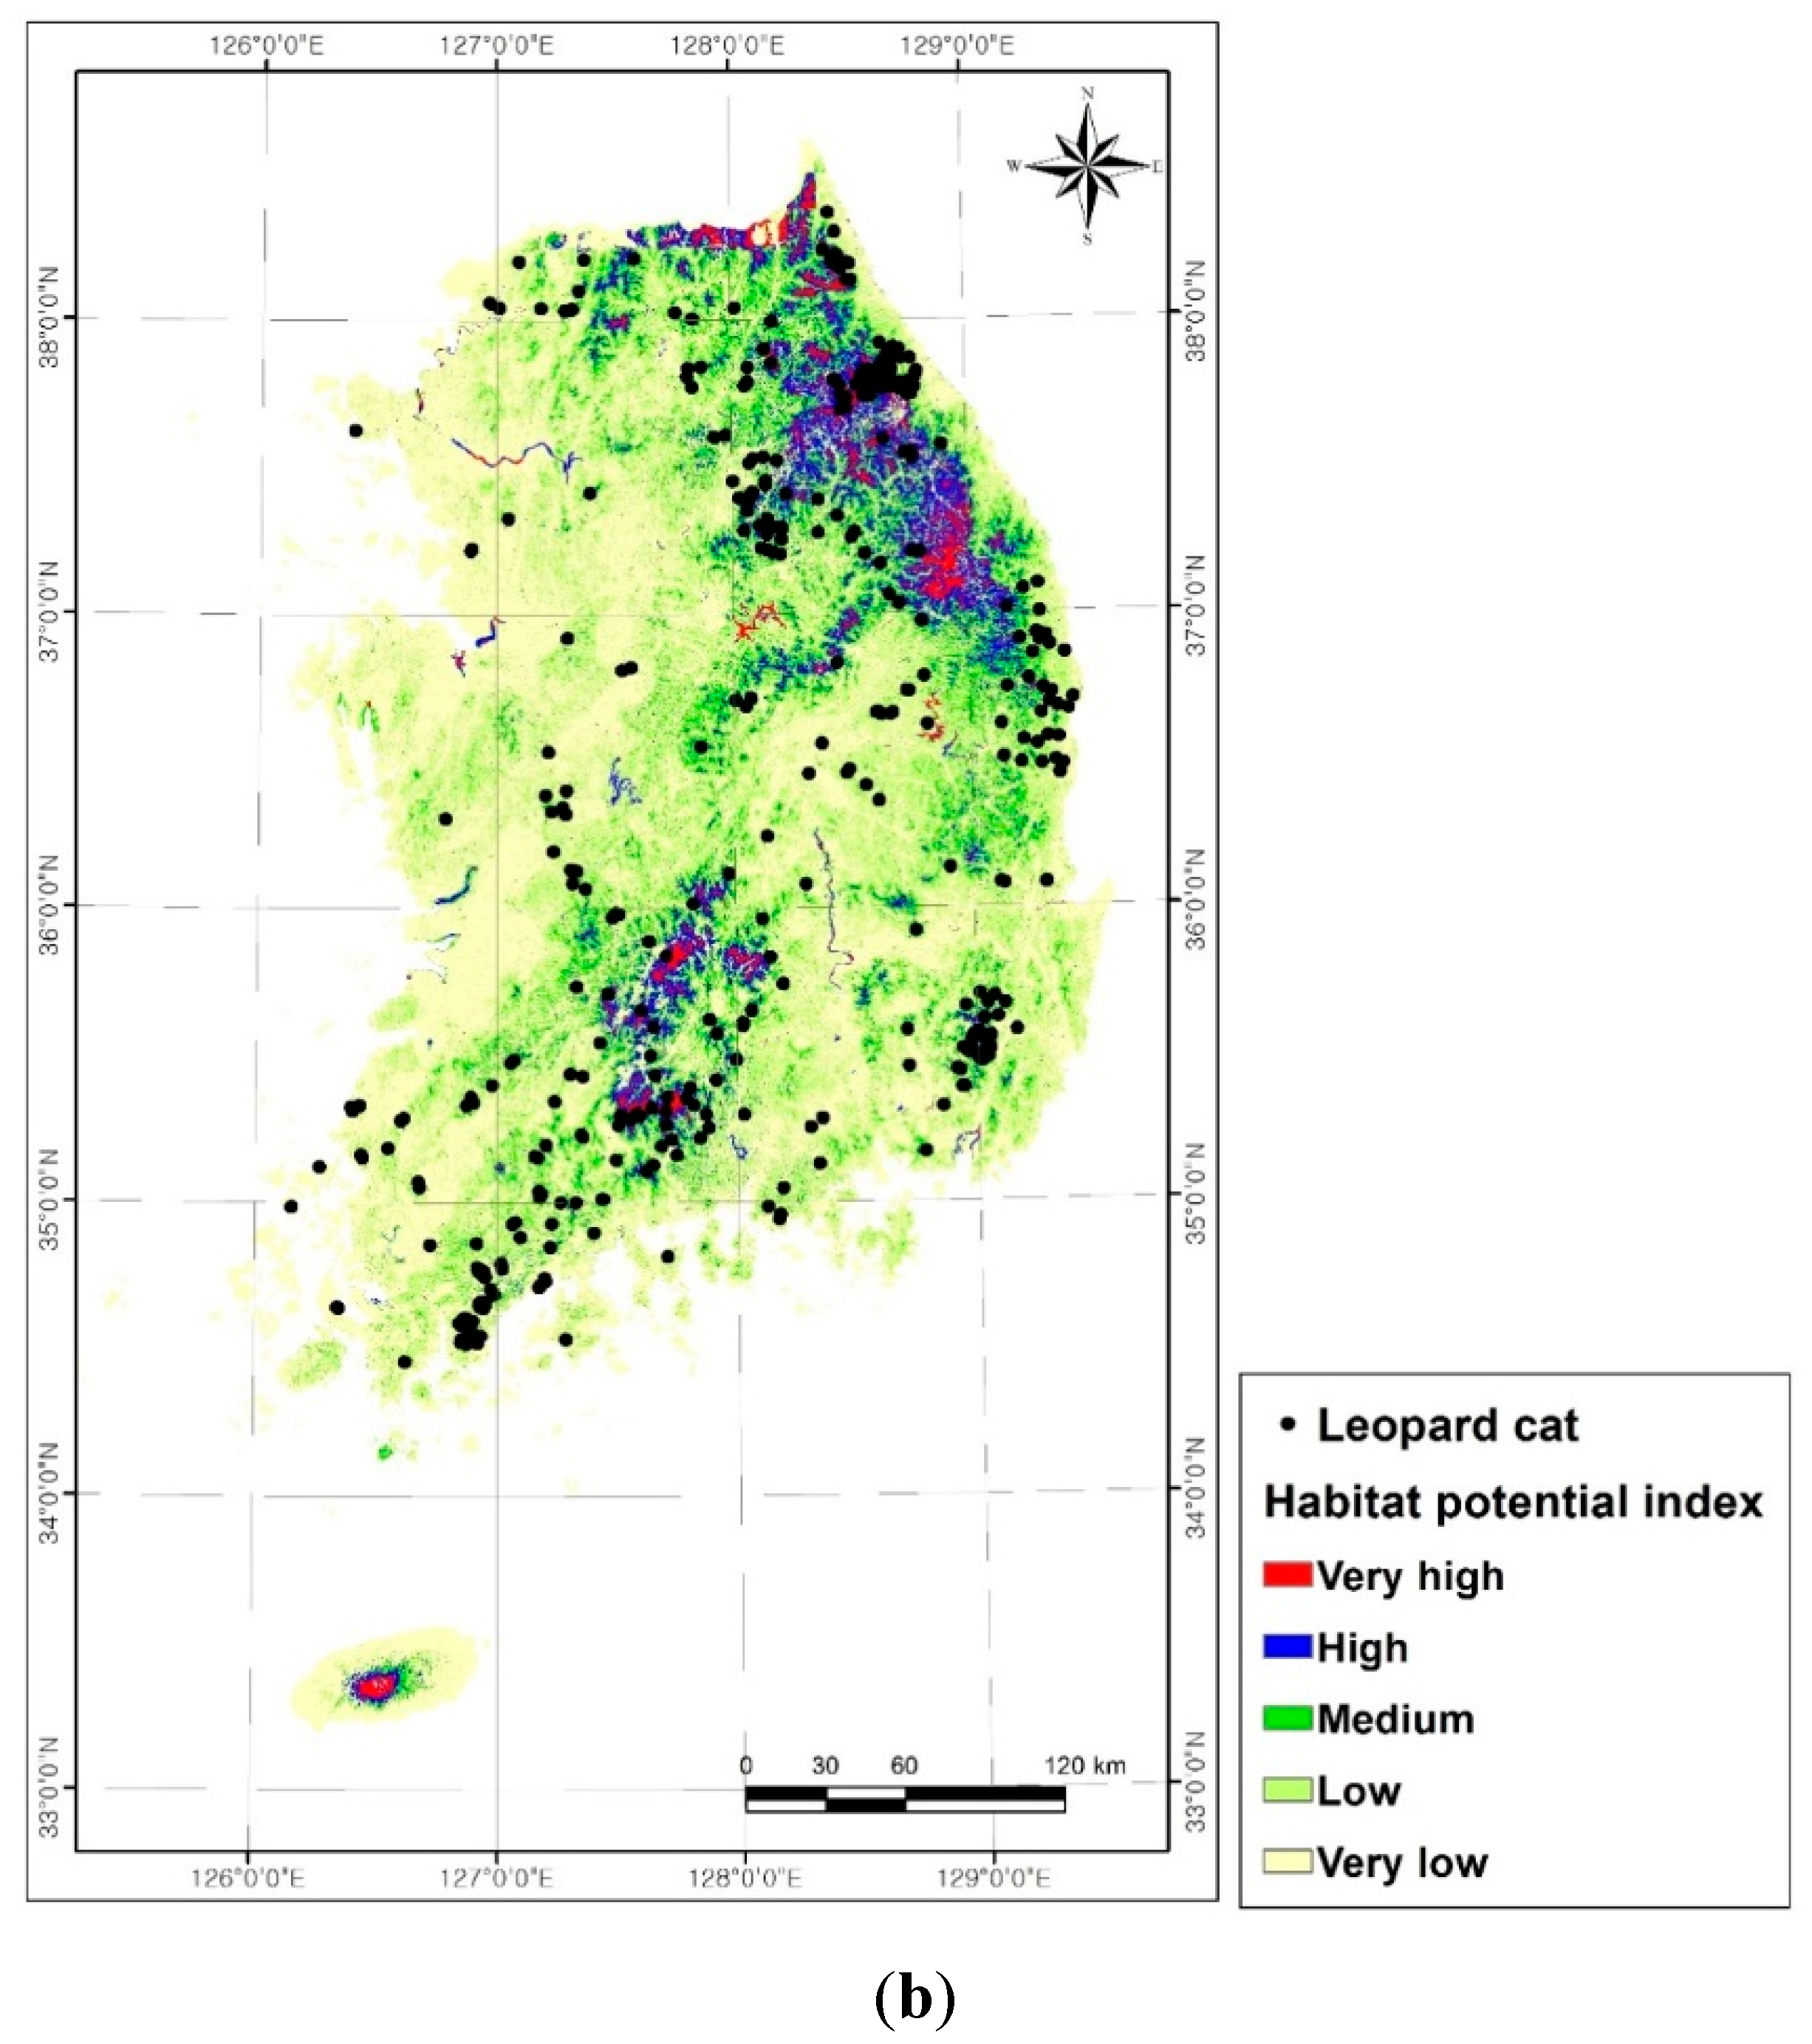
- Generally, the maps resulting from the frequency ratio and logistic regression models had similar spatial distribution patterns. The central south and northeastern parts of the inland area of South Korea and the central part of Jeju Island were expected to have high and very high potential. The results of this study can be used in future studies of predator reintroduction on Jeju Island. In particular, the reintroduction of the leopard cat is being considered because it can play the role of top predator on Jeju Island. This study indicated high availability of potential habitat. These areas have high elevation, steep slopes, and forest, and they are hilly or mountainous. Such areas of high and very high potential should be given priority during land-use or wildlife management planning. The western and eastern coastal parts of the site were shown to have low and very low potential in all of the habitat potential maps. Almost all areas in this region are low-lying, with coastal and non-forest habitat.
- (4)
- Using the frequency ratio and logistic regression models, we created leopard cat habitat potential maps. Half of known leopard cat locations were used as training data and the remaining half was used to validate the maps. The resulting frequency ratio and logistic regression models were 82.15 and 81.48% accurate, respectively. Therefore, the results had an overall agreement of more than 80%, which we regarded as satisfactory.
Acknowledgments
Author Contributions
Conflicts of Interest
References
- Minor, E.S.; Lookingbill, T.R. A multiscale network analysis of protected-area connectivity for mammals in the united states. Conserv. Biol. 2010, 24, 1549–1558. [Google Scholar] [CrossRef] [PubMed]
- Burton, P.; Balisky, A.; Coward, L.; Kneeshaw, D.; Cumming, S. The value of managing for biodiversity. For. Chron. 1992, 68, 225–237. [Google Scholar] [CrossRef]
- Myers, N.; Mittermeier, R.A.; Mittermeier, C.G.; da Fonseca, G.A.; Kent, J. Biodiversity hotspots for conservation priorities. Nature 2000, 403, 853–858. [Google Scholar] [CrossRef] [PubMed]
- Schmitz, O.J. Top predator control of plant biodiversity and productivity in an old-field ecosystem. Ecol. Lett. 2003, 6, 156–163. [Google Scholar] [CrossRef]
- Sergio, F.; Newton, I.; Marchesi, L. Conservation: Top predators and biodiversity. Nature 2005, 436, 192–192. [Google Scholar] [CrossRef] [PubMed]
- Gavashelishvili, A.; Lukarevskiy, V. Modelling the habitat requirements of leopard panthera pardus in west and central asia. J. Appl. Ecol. 2008, 45, 579–588. [Google Scholar] [CrossRef]
- Sanderson, J.; Sunarto, S.; Wilting, A.; Driscoll, C.; Lorica, R.; Ross, J.; Hearn, A.; Mujkherjee, S.; Khan, J.; Habib, B. Prionailurus bengalensis. In IUCN 2011; IUCN Red List of Threatened Species. Version 2011.2; IUCN: Gland, Switzerland, 2008. [Google Scholar]
- Kim, K.D.; Lee, S.; Oh, H.J.; Choi, J.K.; Won, J.S. Assessment of ground subsidence hazard near an abandoned underground coal mine using gis. Environ. Geol. 2006, 50, 1183–1191. [Google Scholar] [CrossRef]
- Lee, S.; Sambath, T. Landslide susceptibility mapping in the damrei romel area, Cambodia using frequency ratio and logistic regression models. Environ. Geol. 2006, 50, 847–855. [Google Scholar] [CrossRef]
- Matsuura, T.; Sugimura, K.; Miyamoto, A.; Tanaka, N. Knowledge-Based Estimation of Edible Fern Harvesting Sites in Mountainous Communities of Northeastern Japan. Sustainability 2014, 6, 175–192. [Google Scholar] [CrossRef]
- Choi, J.K.; Kim, K.D.; Lee, S.; Won, J.S. Application of a fuzzy operator to susceptibility estimations of coal mine subsidence in taebaek city, Korea. Environ. Earth Sci. 2010, 59, 1009–1022. [Google Scholar] [CrossRef]
- Song, J.; Wang, X.; Liao, Y.; Zhen, J.; Ishwaran, N.; Guo, H.; Yang, R.; Liu, C.; Chang, C.; Zong, X. An Improved Neural Network for Regional Giant Panda Habitat Suitability Mapping: A Case Study in Ya’an Prefecture. Sustainability 2014, 6, 4059–4076. [Google Scholar] [CrossRef]
- Poplar-Jeffers, I.O.; Petty, J.T.; Anderson, J.T.; Kite, S.J.; Strager, M.P.; Fortney, R.H. Culvert replacement and stream habitat restoration: Implications from brook trout management in an appalachian watershed, USA. Restor. Ecol. 2009, 17, 404–413. [Google Scholar] [CrossRef]
- Ottaviani, D.; Panzacchi, M.; Jona Lasinio, G.; Genovesi, P.; Boitani, L. Modelling semi-aquatic vertebrates’ distribution at the drainage basin scale: The case of the otter Lutra lutra in italy. Ecol. Model. 2009, 220, 111–121. [Google Scholar] [CrossRef]
- Newton-Cross, G.; White, P.C.; Harris, S. Modelling the distribution of badgers meles meles: Comparing predictions from field-based and remotely derived habitat data. Mamm. Rev. 2007, 37, 54–70. [Google Scholar] [CrossRef]
- Tien Bui, D.; Lofman, O.; Revhaung, I.; Dick, O. Landslide susceptibility analysis in the Hoa Binh province of Vietnam using statistical index and logistic regression. Nat. Hazards 2011, 59, 1413–1444. [Google Scholar] [CrossRef]
- Huck, M.; Davison, J.; Roper, T.J. Predicting european badger meles meles sett distribution in urban environments. Wildl. Biol. 2008, 14, 188–198. [Google Scholar] [CrossRef]
- Jaberg, C.; Guisan, A. Modelling the distribution of bats in relation to landscape structure in a temperate mountain environment. J. Appl. Ecol. 2001, 38, 1169–1181. [Google Scholar] [CrossRef]
- Greaves, G.J.; Mathieu, R.; Seddon, P.J. Predictive modelling and ground validation of the spatial distribution of the new zealand long-tailed bat (Chalinolobus tuberculatus). Biol. Conserv. 2006, 132, 211–221. [Google Scholar] [CrossRef]
- Clement, M.J.; Castleberry, S.B. Estimating density of a forest-dwelling bat: A predictive model for rafinesque’s big-eared bat. Popul. Ecol. 2013, 55, 205–215. [Google Scholar] [CrossRef]
- Northrup, J.; Stenhouse, G.; Boyce, M. Agricultural lands as ecological traps for grizzly bears. Anim. Conserv. 2012, 15, 369–377. [Google Scholar] [CrossRef]
- Kuemmerle, T.; Perzanowski, K.; Chaskovskyy, O.; Ostapowicz, K.; Halada, L.; Bashta, A.-T.; Kruhlov, I.; Hostert, P.; Waller, D.M.; Radeloff, V.C. European bison habitat in the carpathian mountains. Biol. Conserv. 2010, 143, 908–916. [Google Scholar] [CrossRef]
- Speed, J.D.; Woodin, S.J.; Tommervik, H.; Tamstorf, M.P.; van der Wal, R. Predicting habitat utilization and extent of ecosystem disturbance by an increasing herbivore population. Ecosystems 2009, 12, 349–359. [Google Scholar] [CrossRef]
- Kocev, D.; Džeroski, S.; White, M.D.; Newell, G.R.; Griffioen, P. Using single-and multi-target regression trees and ensembles to model a compound index of vegetation condition. Ecol. Model. 2009, 220, 1159–1168. [Google Scholar] [CrossRef]
- Meixler, M.S.; Bain, M.B.; Todd Walter, M. Predicting barrier passage and habitat suitability for migratory fish species. Ecol. Model. 2009, 220, 2782–2791. [Google Scholar] [CrossRef]
- Walker, B.K.; Jordan, L.K.; Spieler, R.E. Relationship of reef fish assemblages and topographic complexity on southeastern florida coral reef habitats. J. Coast. Res. 2009, 53, 39–48. [Google Scholar] [CrossRef]
- Walters, D.; Roy, A.; Leigh, D. Environmental indicators of macroinvertebrate and fish assemblage integrity in urbanizing watersheds. Ecol. Indic. 2009, 9, 1222–1233. [Google Scholar] [CrossRef]
- Bonham-Carter, G. Geographic Information Systems for Geoscientists: Modelling with GIS; Elsevier: Amsterdam, The Netherlands, 1994. [Google Scholar]
- Dai, F.; Lee, C. Landslide characteristics and slope instability modeling using GIS, Lantau Island, Hong Kong. Geomorphology 2002, 42, 213–228. [Google Scholar] [CrossRef]
- Lee, S.; Min, K. Statistical analysis of landslide susceptibility at Yongin, Korea. Environ. Geol. 2001, 40, 1095–1113. [Google Scholar] [CrossRef]
- Oh, H.J.; Lee, S.; Chotikasathien, W.; Kim, C.H.; Kwon, J.H. Predictive landslide susceptibility mapping using spatial information in the pechabun area of Thailand. Environ. Geol. 2009, 57, 641–651. [Google Scholar] [CrossRef]
- Adinarayana, J.; Krishna, N.R. Integration of multi-seasonal remotely-sensed images for improved landuse classification of a hilly watershed using geographical information systems. Int. J. Remote Sens. 1996, 17, 1679–1688. [Google Scholar] [CrossRef]
© 2015 by the authors; licensee MDPI, Basel, Switzerland. This article is an open access article distributed under the terms and conditions of the Creative Commons Attribution license (http://creativecommons.org/licenses/by/4.0/).
Share and Cite
Lee, M.-J.; Song, W.; Lee, S. Habitat Mapping of the Leopard Cat (Prionailurus bengalensis) in South Korea Using GIS. Sustainability 2015, 7, 4668-4688. https://0-doi-org.brum.beds.ac.uk/10.3390/su7044668
Lee M-J, Song W, Lee S. Habitat Mapping of the Leopard Cat (Prionailurus bengalensis) in South Korea Using GIS. Sustainability. 2015; 7(4):4668-4688. https://0-doi-org.brum.beds.ac.uk/10.3390/su7044668
Chicago/Turabian StyleLee, Moung-Jin, Wonkyong Song, and Saro Lee. 2015. "Habitat Mapping of the Leopard Cat (Prionailurus bengalensis) in South Korea Using GIS" Sustainability 7, no. 4: 4668-4688. https://0-doi-org.brum.beds.ac.uk/10.3390/su7044668