Article

The Establishment and Application of Environment Sustainability Evaluation Indicators for Ecotourism Environments

1
School of Health Diet and Industry Management, Chung Shan Medical University, No.110, Sec.1, Jianguo N. Rd. Taichung 40201, Taiwan
2
Department of Medical Management, Chung Shan Medical University Hospital, No.110, Sec.1, Jianguo N. Rd. Taichung 40201, Taiwan 
Sustainability 2015, 7(4), 4727-4746; https://0-doi-org.brum.beds.ac.uk/10.3390/su7044727
Submission received: 10 February 2015 / Revised: 2 April 2015 / Accepted: 15 April 2015 / Published: 21 April 2015

Abstract

:
Kinmen National Park is the only battle memorial-themed natural resource conservation park in Taiwan. With the rapid growth in tourism, Kinmen National Park faces the challenge of managing with the resulting environmental impact. For this study, we adopted the tourism ecological footprint (TEF) and tourism ecological capacity (TEC) to evaluate the ecological conditions of Kinmen National Park from 2002 to 2011. The empirical results indicated the following findings: (a) TEF increased by 8.03% over 10 years; (b) Regarding the environmental sustainability index (ESI), per capita tourism ecological deficit (PTED) yielded a deficit growth rate of 45.37%. In 2011, the ecological footprint index (EFI) was at Level 4 with 1.16, and the ESI was at Level 3 with 0.495. According to the aforementioned results, with the increased scale of tourism to Kinmen National Park, the pressure that ecological occupancy exerted on the national ecosystem exceeded its ecological capacity.

1. Introduction

With the ongoing economic development, people’s demands regarding quality of life, entertainment, and leisure are substantially increasing. To develop and upgrade the tourism industry, the Taiwanese government has considerably increased the convenience for foreign tourists to visit Taiwan by actively promoting policies such as opening up to visitors from China, liberalizing visa policies, simplifying entry and exit procedures, and expanding air routes. According to the World Tourism Barometer [1], Taiwan’s international tourism revenue increased by two digits annually between 2009 and 2011, with an average growth rate of 23.2%, exceeding that of Hong Kong (22.4%), Singapore (16.2%), and South Korea (8.3%). Accordingly, Taiwan was ranked first among the four Asian Tigers and among the main Asia-Pacific countries and regions. The average growth rate for the number of foreign tourists visiting Taiwan between 2009 and 2012 was 17.6%, exceeding the global rate by 2.8% and the Asia-Pacific rate by 6.2%. In the Travel and Tourism Competitiveness Report 2013 published by the World Economic Forum, Taiwan was ranked 33rd among 140 countries. Compared with its ranking in 2009 and 2011, Taiwan has advanced 10 and four places, respectively. These data demonstrate the substantial potential of Taiwan’s tourism industry and the rapid demands for related growth.
Regarding changing travel behavior, in recent years, tourists have exhibited a preference for ecotourism. Additionally, travelling to Taiwan has become a popular trend among foreign tourists. Consequently, the number of tourists who choose Taiwan’s national parks as recreation destinations has rapidly increased. According to data released by the Construction and Planning Agency, Ministry of the Interior [2], the number of tourists to Taiwan’s national parks increased by 77% from 9,750,000 in 1999 to 17,300,000 in 2011. In addition, both the Battle of Guningtou and the 823 Artillery War, which ultimately enhanced the stability of the Taiwan Strait, occurred in the Kinmen area. Therefore, the Kinmen area played a unique role and has significance in contemporary history. To preserve the battle relics, cultural heritage, and natural resources of this area appropriately, the Kinmen National Park was founded in 1995. This was the first war memorial-themed historical and cultural heritage and natural resource conservation site established in Taiwan. After the Taiwanese government trialed the “mini three links” proposal, the number of Chinese tourists who visited Kinmen National Park increased from 202,138 in 2004 to 735,218 in 2011. The total amount of tourists who visited Kinmen National Park increased from 1,095,236 in 2004 to 2,164,248 in 2011. However, a rapid growth in the tourist industry is accompanied by recurring environmental impacts in the process of tourism, such as traffic jams, overexploitation of natural resources and other problems arising from tourists’ improper behavior, which not only affect human life, the natural environment, and cultural heritage, but also accordingly give rise to a lot of pollution problems. Therefore, going by the premise that tourism resource development must ensure the sustainable development of ecology, economy, and society and meanwhile reduce the recreational impact, it is an urgent topic for this paper to (1) discuss how to ensure that tourism develops according to the principles of sustainable operation and in a way that aids the conservation of the environmental and ecological system; and (2) to consider the issues of environmental protection, such as biodiversity and climate change.
As the tourism industry continues to flourish, tourism-related environmental issues are becoming increasingly apparent every day. Tourism ecological capacity (TEC) has become the focus of tourism research. TEC refers to the maximum sum of productive land supplied for sustainable human use that has no harm on related ecosystem productive forces or the whole ecosystem. Tourist ecological capacity may be understood as the maximum ecological footprint in some natural and social conditions. Current domestic and foreign studies of TEC typically emphasize methods for evaluating and applying TEC, specifically, using quantified analysis approaches and directly or indirectly measuring TEC [3,4,5]. Under the wave of sustainable development, international society began to develop tools or indicators that can evaluate sustainable development one by one. They want to reasonably reflect the ecological environment, meanwhile analyzing resource consumption effectively and exploring the relationship among different kinds of environmental impact [6]. Generally speaking, the current evaluation indicators or measurement models of sustainable development established or developed internationally or domestically have their own features. Most of them can manage to include various sustainable development factors such as society, economy, ecology, and the environment [7]. However, when analyzing the aforementioned evaluation indicators and measurement models, the following concerns arose: (a) Certain evaluation indicators and measurement models are excessively complex to adequately reflect the connotations of sustainable development, and the dynamic indicators established for sustainable development are insufficient; (b) Several evaluation indicators or measurement models were developed based on comprehensive systems; thus, quantifying these indicators is difficult and even impossible, yielding low operability; (c) Some evaluation indicators and measurement models exhibit data accessibility problems and, thus, are challenging to apply. Zhang et al. [8] stated that although most existing sustainability evaluation methods can provide insight into the influence that human activities exert on various ecosystem functions, their applicability for evaluating relevant issues on a social and economic level is limited. In addition, most previous studies have not explored dynamic development trends. Hence, relevant literature has scope for improvement. Among the existing research, the ecological footprint (EF) concept proposed by Wackernagel and Rees [9] examines the index established for sustainability issues under the notion that human consumption behaviors depend on natural environments. The uniqueness of EF is its use of carrying capacity as the theoretical foundation and evaluation of environment sustainability with the assumption that all types of energy sources, material consumption, and waste production require the assimilation of productivity or absorption of land or water areas to transform human consumption behaviors and waste in certain areas into land size measurements of each person’s consumption. Rees [10] asserted that the size of EF is directly proportional to environmental impacts, implying that environmental impact increases in correlation to EF.
Since the EF concept and computation method were proposed, EF has become a vital indicator of sustainable development for quantitative evaluation research. Additionally, EF has been widely employed in various fields as a simple, comprehensive indicator that conforms to sustainable development rationales. Regarding the application of EF to tourism and travel, Wackernagel and Yount [11] conducted a preliminary analysis of international tourism EF and reported that tourism EF (TEF) accounted for 10% of global EF. Gössling et al. [12] adopted Seychelles, Africa, as an example to establish an EF computation model for tourist destinations. Hunter [13] proposed the concept of a touristic ecological footprint, as well as its classification and application in sustainable tourism development. Cole and Sinclair [14] analyzed the touristic ecological footprint of tourists visiting the Indian Himalayas and recommended several strategies for sustainable development, such as treating waste materials, reducing the use of fossil fuels, developing ecotourism, and cultivating tourists’ environmental protection awareness. Bagliani et al. [15] adopted EF to explore the influence that tourism activities in Venice, Italy, had on the local ecological environment. Patterson et al. [16] examined the differences between TEF and local biodiversity in Siena, Italy, to establish environment management improvement indicators. Kytzia et al. [17] considered the Alps resort Davos in Europe as an example, adopting a regional input-output model as an ecological footprint index (EFI) to examine how ecological efficiencies can be used to evaluate travel strategies. Li and Hou [18] calculated the TEF and TEC in the scenic zone of the Yellow Crane Tower on China for 2008. Their results indicated that the per capita TEF (PTEF) measured 0.0570 hm2; of this, the contributions from transportation (55.89%) and waste (33.20%) accounted for comparatively high proportions.
With global environmental changes and frequent natural disasters, the international community has started to recognize the threat that the environment poses to human survival and the urgency of this issue. The International Institute for Applied System Analysis (IASA) officially proposed the concept of ecological security in 1989. The IASA defined ecological security as the condition where people’s lives, health, wellbeing, basic rights, living necessities, essential resources, social order, and adaptability to environmental changes are not threatened. Ponsioen et al. [19] described ecological security as a state where the ecological environment required for the survival and development of a country is not or barely threatened. In other words, ecological security is when the natural ecological environment can satisfy the sustainable development requirements of individuals and communities, without damaging the natural ecological environment.
With numerous studies conducted on ecological security, the research methods employed vary. Scholars have investigated ecological security regarding the aspects of ecological risk assessments [20,21], ecological health [22,23], ecological models [24,25], and indicator systems [26,27]. However, most extant ecological security studies only provide quantitative descriptions based on literature reviews without implementing quantitative methods or introducing innovative strategies. For the studies that did conduct indicator system evaluations, the majority were static evaluations. Accordingly, ecological security management policies have remained passive for a long time and cannot be used to predict relevant trends. Warhurst [28] asserted that simplifying complex information and examining the factors influencing issues by using quantifying indicators can increase the objectivity of such indicators [29]. Rasul and Thapa [30] selected 12 indicators for evaluating the sustainable development of traditional agriculture and ecological security in Bangladesh. Bhandari and Grant [31] established an indicator system from three dimensions (i.e., economy, ecology, and society) to evaluate ecological security in Western Nepal. Siche et al. [32] used EF and the environmental sustainability index (ESI) to establish ecological security evaluation indicators. Liu and Borthwick [33] adopted EFI and the carrying capacity of the environment to investigate ecological security evaluations. Yuan [34] employed the pressure-state-response model to establish a land ecological security evaluation index system for Hangzhou in Zhejiang Province, China, based on the dimensions of nature, economy, and society. In conclusion, this paper seeks to apply EF to national park ecological security evaluation and construct a tourism biocapacity evaluation model that is applicable to national parks. We first adopted TEF and TEC to evaluate the ecological conditions of Kinmen National Park between 2002 and 2011. Subsequently, environmental sustainability indicators such as tourism ecological deficit (TED), tourism ecological remainder (TER), EFI, ESI, and EF per capita and per NT$10,000 gross domestic product (GDP) were employed to evaluate the ecological security and resource utilization efficiency of Kinmen National Park. Finally, the issues reflected in various indicator values were analyzed to establish a systematic measurement instrument for promoting sustainable development and assessing the progress trends of sustainable development.

2. Methods

2.1. Study Design

This study adopted the TEF concept proposed by Gössling et al. [10] and employed by Martin-Cejas and Sanchez [35] as the research framework for evaluating the EF of Kinmen National Park between 2002 and 2011. The evaluation items were divided into five categories: transportation ecological footprint (TREF), accommodation ecological footprint (ACCEF), activities ecological footprint (ACTEF), food and fiber consumption ecological footprint (FEF), and wastewater ecological footprint (WWEF). These EF evaluation items were then categorized into six types of biologically productive land to investigate the influence that EF exerts on the environment. The six types of productive lands comprised the ecological footprint of crop land (EFCL), ecological footprint of grazing land (EFGL), ecological footprint of forest land (EFFL), ecological footprint of fishing grounds (EFFG), ecological footprint of built-up land (EFBU), and ecological footprint of carbon uptake land (EFCU). The main evaluation items of each category and data sources are shown in Table 1.

2.2. Methods for Calculating Yield and Equivalence Factors

The Global Footprint Network has developed a national footprint account classifying biologically productive land into six types: crop, grazing, forest, fishing, carbon uptake, and built-up land. These land types have differing biological productivities, hence their areas are weighted to represent an equivalent area with the same biological productivity, i.e., the global hectare. Abbreviated as “gha”,the global hectare quantifies the biocapacity of the earth in a given year, where one global hectare measures the average productivity of biologically productive areas. The conversion calculation mainly adopts equivalence factor (EQF) and yield factor (YF).
EQF is the ratio of the potential biological productivity of a certain land type to the average potential biological productivity of all global lands and it is used to evaluate the difference between the six types of productive lands on the globe. As shown by Equation (1), the equivalence factor γk of type-k biologically productive land is the average productivity Y k ¯ of such a type of land on the globe divided by the average productivity Y ¯ of all types of land on the globe:
γ k = Y k ¯ Y ¯ k = 1 , 2 , , 6
Because different countries or regions have different resource endowments, the biological productivity varies according to different land types and even that of the same type of land varies from region to region. Therefore, in order for comparability and accumulativity between regions, it is required that the area of each type of land of research object be converted into an equivalent area with corresponding global average productivity and conversion factor, the YF. The YF λk of type-k land in a certain region is the ratio of the average productivity y k ¯ of this type of land in this region to the global average productivity Y k ¯ of the same type of land; the computational formula is Equation (2):
λ k = y k ¯ Y k ¯ k = 1 , 2 , , 6
Table 1. Evaluation items and data sources.
EF CategoryEvaluation IndicatorsEvaluation ItemsEvaluation ContentData Sources
TREFBuilt-up landRoad use areaRoad use areaGössling et al. [12]; Kinmen National Park Administration Office [36]
Parking lot areaLarge vehicles, small vehicles, motorcycles, and bicycles Gössling et al. [12]; Kinmen National Park Administration Office [36]; Equipment Management System of Taiwan National Parks [37]
Fossil energyResource usageTransportation energy consumptionGössling et al. [12]; Visitations and Revenues of National Parks [38]
ACCEFBuilt-up areaAccommodation areaHostel areas in national parksGössling et al. [12]; Kinmen National Park Administration Office [36]; Monthly Report of Home Stay Facilities [39]
Fossil energyAccommodation energy consumptionHostel energy consumption
ACTEFBuilt-up areaRecreation areaRecreation areaKinmen National Park Administration Office [36]
Fossil energyRecreation energy consumption Recreation energy expense
FEFCrop landFood and fiber consumption when traveling Grains, potatoes, sugar and honey, seeds and oilseeds, vegetables, fruits, fats, tobacco, and cotton Food Supply and Utilization, Council of Agriculture [40]
Grazing landMeat, eggs, and diary
Carbon landConiferous trees, broad-leaved trees, fuel wood, and faggots of wood
Fishing groundsAquatic products
WWEFBuilt-up areaWastewater equipment area Treatment plant areaKinmen National Park Administration Office [34]
Fossil energyWater purification energy consumptionWater purification energy expense
Data source: Compiled in this study.
As for a given region, the physical area of its type-k land multiplied by λk is the area with the global average productivity of such a type of land and, multiplied by rk, is the equivalent area with global average productivity, which has global comparability and the measurement unit of which is known as global hectare (gha). This work refers to the EQF and YF from the Ecological Footprint Atlas [41], as summarized in Table 2.
Table 2. Equivalence factors and yield factors for a given land type.
Land TypeEquivalence FactorYield Factor
Carbon uptake land1.261.2
Crop land2.511.15
Forestland1.261.2
Grazing land0.461.6
Built-up land2.511.15
Fishing ground0.370.9
Source: Global Footprint Network, Ecological Footprint Atlas (2010).

2.3. Model Computation Method

2.3.1. TEF Computation Model

TEF is composed of five elements: TREF, ACCEF, ACTEF, FEF, and WWEF. Relevant explanations are provided below:
T E F = T R E F + A C C E F + A C T E F + F E F + W W E F
(a) TREF Computation
The computation of TREF is divided into two aspects: (a) the built-up area of transportation facilities used to travel (i.e., road area and parking lot area); and (b) the transportation energy consumed during travel activities. The computation formula is shown below:
T R E F = ( S t r a n s p o r t + E t r a n s p o r t ) × F v
where TREF represents the transport ecological foot print; S transport represents the built-up area of transportation facilities; E transport represents the fossil energy area transformed through transportation energy consumption; and Fv (v = 1, 2, …, 6) represents the yield factor (YF) and equivalence factor (EQF) for the six types of biologically productive lands. Equation (4) was rewritten as Equation (5) according to the actual tourist traffic situation:
T R E F = [ ( s i × K i ) + ( N j × D j × e j / r ) ] × F v
where si represents the built-up area of the ith type of transportation facility; Ki represents the tourist utilization rate of the ith type of transportation facility; Nj represents the number of tourists in the jth type of vehicle; Dj represents the average travel distance for tourists using the jth type vehicle; ej represents the per capita unit energy consumption of the jth type vehicle; r represents the conversion factor of unit fossil fuel productive land area worldwide; and Fv represents the YF and EQF for the six types of biologically productive lands.
(b) ACCEF Computation
The computation of ACCEF involves two parts: (a) the accommodation construction land area provided to tourists; and (b) tourists’ energy consumption during residence (e.g., energy consumed by air conditioners and lighting):
A C C E F = ( S a c c o m mod a t i o n + E a c c o m mod a t i o n ) × F v
where ACCEF represents the accommodation ecological footprint; S accommodation represents the construction land area of accommodation facilities; E accommodation represents the fossil energy area transformed through accommodation energy consumption; and Fv represents the YF and EQF for the six types of biologically productive lands.
Because energy consumption approaches and items are complex, difficult to calculate, and vary between regions and accommodation types, this study referred to the global residential land usable area and energy usage statistics provided by the UNWTO [42] as the standard for evaluating the energy consumption per bed every night in Kinmen National Park. Thus, Equation (7) can be rewritten as:
A C C E F = [ ( S i × N i ) + ( 365 × N i × K i × e i / r ) ] × F v
where Si represents the construction land area of the ith type of accommodation facility bed; Ni represents the number of beds possessed by the ith type of accommodation facility; N′i represents the number of beds actually used in the ith type of accommodation facility; Ki represents the average annual guest room rental rate for the ith type of accommodation facility; ei represents the daily energy consumption for the ith accommodation facility; r represents the conversion factor of unit fossil fuel productive land area worldwide; and Fv represents the YF and EQF for the six types of biologically productive lands.
(c) ACTEF Computation
The computation of ACTEF involves two aspects: (a) the built-up land areas (e.g., tourist trails, highways, and scenic view spaces) within various types of scenic areas; and (b) the fossil energy area transformed through energy consumption, such as touring scenic sites by vehicle:
A C T E F = ( S v i s i t i n g + E v i s i t i n g ) × F v
where ACTEF represents the activities ecological footprint; Svisiting represents the built-up land area of tourism and sightseeing facilities; Evisiting represents the fossil energy area transformed through tourism and sightseeing energy consumption; and Fv represents the YF and EQF for the six types of biologically productive lands.
Because of the unique layout of Kinmen National Park, and the fact that the vehicles used to travel between subsidiary parks might have been included in the TREF, energy consumption was excluded from the calculation of ACTEF. Thus, Equation (9) can be rewritten as:
A C T E F = s i × F v
where si represents the built-up land area of scenic sightseeing facilities; and Fv represents the YF and EQF for the six types of biologically productive lands.
(d) FEF Computation
The computation of FEF involves three aspects: (a) the building land area of food and beverage service facilities (e.g., local cuisine, buffet, and beverages); (b) biologically productive land area transformed through the consumption of various foods by tourists; and (c) biologically productive land area transformed through the consumption of fiber by tourists:
F E F = ( S f o o d + C f o o d + F f o o d ) × F v
where FEF represents the food and fiber consumption ecological footprint; Sfood represents the building land area of food services; Cfood represents the biologically productive land area transformed through food consumption; Ffood represents the fossil energy land area transformed through fiber consumption; and Fv represents the YF and EQF for the six types of biologically productive lands.
According to the actual food consumption situation, Equation (11) can be rewritten as:
T E F f o o d = ( N × D × c i / p i ) × F v
where N represents the number of tourists; D represents the average days per trip; ci represents the daily consumption of the ith type of food by tourists; Pi represents the average annual productivity of the ith type of food for biologically productive lands; and Fv represents the YF and EQF for the six types of biologically productive lands.
(e) WWEF Computation
The computation of WWEF primarily involves calculating the wastewater purification energy consumption resulting from various tourist activities conducted in the park. In this study, the electricity consumed in wastewater treatment plant operations was transformed into a carbon footprint to facilitate the inclusion of the environmental impact of wastewater in EF computations. Because the building land areas of wastewater plant facilities are designated to regular control areas and included as an item of ACTEF, only the wastewater treatment carbon footprints established based on electricity consumption were incorporated in the WWEF calculation:
W W E F = E C × C F / F C S × F v
where WWEF represents the wastewater ecological footprint; EC represents the total electricity consumed by wastewater treatment plants; CF represents carbon dioxide conversion factors; FCS represents the CO2 absorption rate of forest land, which was 3.6666(tCO2/ha/year); and Fv represents the YF and EQF for the six types of biologically productive lands.

2.3.2. The TEC Computation Model

The computation of TEC mainly relied on data (e.g., region partition and land utilization plans) published by the Kinmen National Park Administration Office [36] to estimate the capacity areas of the six types of biologically productive land in Kinmen National Park:
T E C = N t e c = N i = 1 6 ( a i r i / y i )
where TEC represents the tourism ecological capacity; N represents the number of tourists; i represents the types of biologically productive land; tec represents the per capita TEC; ai represents the per capita biologically productive land area; ri represents EQF; and yi represents YF.

2.3.3. The Establishment of Sustainable Tourism Environment Evaluation Indicators

This study employed multiple quantitative indicators (e.g., TED, TER, EFI, ESI, and EF per capita and per NT$10,000 GDP) to establish a set of evaluation indicators regarding the tourism environment sustainability of national parks and provide the criteria for national parks to evaluate ecological security. The evaluation indicators employed in this study are introduced below.
(a) TED or TER
When the environmental carrying capacity of a region is less than necessitated by EF demands, an ecological deficit (ED) occurs, which indicates that the ecological carrying capacity of the region exceeds the ecological capacity. Consequently, the corresponding development model is comparatively less sustainable. When the environment carrying capacity of a region is greater than required by EF demands, an ecological remainder (ER) occurs, which indicates that the ecological carrying capacity of the region is sufficient to satisfy the corresponding carrying capacity and that the development model is comparatively more sustainable. Rees [43] stated that ED is caused by humans placing excessive demands on the ecosystem. Therefore, to maintain sustainable ecological development, ecological demands must be reduced. Moore et al. [44] adopted EF to examine ED/ER in Vancouver; the results indicated a severe deficit. The formulas for TED and TER are:
T E R = T E C T E F
T E D = T E F T E C
where TER represents tourism ecological remainder; TED represents tourism ecological deficit; TEC represents tourism ecological capacity; and TEF represents tourism ecological footprint.
(b) EFI
EFI involves comparing resource and energy expenditures with the ecological carrying capacity of a region to evaluate the resource utilization of the region or country and determine whether the resource and environment condition exhibits sustainable development characteristics. Xiao et al. [45] adopted EF as the criterion and employed EFI and the ecological occupancy index in ecological security evaluations and analysis to explore the corresponding ecological environment conditions. The EFI computation formula is expressed as Equation (16), and the EFI levels are shown in Table 3.
E F I = T E F / T E C
where EFI represents the ecological footprint index; TEF represents tourism ecological footprint; and TEC represents tourism ecological capacity.
Table 3. EFI levels and the corresponding conditions.
Level EFIEFI conditions
10.5Safe
20.5~0.8Moderately safe
30.8~1.0Threshold
4>1.0Unsafe
Resource: Wackernagel and Rees [7].
(c) ESI
ESI is an environmental sustainability evaluation index developed by the Yale Center for Environmental Law and Policy (YCELP), the Center for International Earth Science Information Network (CIESIN), and the World Economic Forum [46]. ESI primarily evaluates the extent to which the ecology of a region can satisfy humans’ ecological demands to assess whether the region can be developed sustainably. Cui et al. [47] adopted ESI to explore the development conditions of Shandong Province, China at that time. The ESI results indicated that the development conditions of Shandong Province were unsustainable. Siche et al. [32] claimed that both EF and ESI can be used as ecological security evaluation indicators. The ESI formula is presented as Equation (17), and the ESI levels are shown in Table 4.
E S I = T E C / ( T E C + T E F )
where ESI represents the environmental sustainability index; TEF represents tourism ecological footprint; and TEC represents tourism ecological capacity.
Table 4. ESI levels.
LevelESIRegional ecological sustainability extent
1>0.7High sustainability
20.50–0.70Low sustainability
30.30–0.50Low unsustainability
4<0.30High unsustainability
Resource: YCELP and CIESIN [46].
(d) EF Per Capita and Per NT$10,000 GDP
EF per capita and per NT$10,000 GD refers to the ecological space occupied by NT$10,000 GDP; in other words, the ratio of total EF to NT$10,000 GDP. High NT$10,000 GDP indicates low regional resource utilization efficiency. Conversely, low NT$10,000 GDP indicates high regional resource utilization efficiency. Meyfroidt et al. [48] used ecological footprints per NT $10,000 GDP to inspect the resource utilization conditions in forests. Their results indicated that the resource utilization efficiency in the region exhibited a declining trend due to the increase in EF and stagnation of GDP. The EF per capita and per NT$10,000 GDP computation formula is:
Ecological footprint per NT$10,000 GDP = TEF/GDP
where TEF represents tourism ecological footprint and GDP reflects the average incomes in the region.

3. Results and Discussion

3.1. TEF Computation and Analysis Results

Table 5 lists the five types of activities in Kinmen National Park and the TEF computation results. TEF decreased from 7747.17535 gha in 2002 to 7071.86588 gha in 2005 before gradually increasing to 8369.85782 gha between 2007 and 2011. Among the five types of activity EF, ACTEF accounted for the largest proportion at an average of 80.395%, followed by FEF at an average of 13.263%, then TREF (5.4%), ACCEF (0.8%), and WWEF (0.2%), which accounted for the smallest proportion.
Table 5. EF for the five types of activities and total EF (unit: gha).
YearTREFACCEFACTEFFEFWWEFTEF
2002394.5873121.211106188.078701128.5020814.796157747.17535
2003332.8216321.211106188.07870744.5091011.373367297.99389
2004363.3267121.211106188.07870703.5898111.470787287.67711
2005332.8429753.205336040.11671635.0942210.606657071.86588
2006324.6795565.508376040.11671651.6370310.236117092.17777
2007337.7000562.630996040.11671595.8931810.283467046.62440
2008357.1064872.903126040.11671898.1406810.885767379.15276
2009462.4819189.441216040.116711193.8030314.644777800.48764
2010550.1320091.953186040.116711566.8859518.824188267.91202
2011588.21509100.657215781.168801877.3821222.434618369.85782
Average proportion5.4%0.8%80.4%13.2 %0.2%100.000%
According to the empirical results, TREF increased from 337.70005 gha in 2007 to 588.21509 gha in 2011 because the increased number of tourists resulted in increased demand for vehicles, which further increased demands for liquefied fuel, thereby increasing TREF. ACCEF gradually increased from 62.63099 gha in 2007 to 100.65721 gha in 2011 primarily because changes in accommodation facilities and the number of tourists seeking accommodation influenced accommodation rates.
Because this study assumed that all recreational activities for tourists in Kinmen National Park were within the range of regular control zones, recreation areas, and heritage areas, the combination of these three area types were considered ACTEF. Based on construction statistics released by CPAMI (2012), the gross area of Kinmen National Park did not change substantially between 2002 and 2010; significant changes only occurred in 2011. ACTEF decreased from 6188.079 gha in 2002 to 5781.169 gha in 2011. FEF exhibited a decreasing trend from 2002 to 2007 before increasing from 595.8931833 gha in 2007 to 1877.3821159 gha in 2011, with an average annual growth rate of 20.8%. These changes in FEF were related to the increased number of tourists. WWEF increased annually from 2007 to 2011, reaching 22.43460596 gha (Figure 1).
Figure 1. EF for the five types of activities and total EF between 2002 and 2011 (unit: gha).
Sustainability 07 04727 g001
The results presented in Table 5 were divided by the number of tourists who visited Kinmen National Park during the research period to obtain values for the five types of activities and PTEF (Table 6). Generally, PTEF has exhibited a declining trend for nearly 10 years, decreasing by 28.27% from 0.005391 gha in 2002 to 0.003867 gha in 2011. Among the five activities, the per capita activities ecological footprint (PACTEF) was substantially influenced by the number of tourists. PACTEF decreased by 57.6% from 0.006304 gha in 2007 to 0.002671 gha in 2011. The per capita transport ecological footprint (PTREF) has exhibited a year-by-year declining trend of 22.7% since 2007. The per capita food and fiber consumption ecological footprint (PFEF) increased from 0.000622 gha in 2007 to 0.000867 gha in 2011, with an average annual growth rate of 39.4%. The most substantial factor influencing PFEF was the number of tourists; PFEF increased in correlation to the number of tourists.
Table 6. The five types of activities and PTEF (unit: gha per capita).
YearNumber of tourists visiting Kinmen National ParkPTREFPACCEFPACTEFPFEFPWWEFPTEF
20021,436,9530.0002750.0000150.0043060.0007850.0000100.005391
20031,088,8600.0003060.0000190.0056830.0006840.0000100.006702
20041,095,2360.0003320.0000190.0056500.0006420.0000100.006654
20051,002,0650.0003320.0000530.0060280.0006340.0000110.007057
2006958,3760.0003390.0000680.0063020.0006800.0000110.007400
2007958,1070.0003520.0000650.0063040.0006220.0000110.007355
20081,015,9770.0003510.0000720.0059450.0008840.0000110.007263
20091,386,7780.0003330.0000640.0043560.0008610.0000110.005625
20101,805,7540.0003050.0000510.0033450.0008680.0000100.004579
20112,164,2480.0002720.0000470.0026710.0008670.0000100.003867
Average proportion 5.2%0.8%81.6%12.2%0.2%100.000%
Although the number of tourists visiting the park increases annually, the per capita accommodation ecological footprint (PACCEF) exhibited a declining trend from 2008 to 2011. The primary reason for this phenomenon could be that the average duration of trips to Kinmen National Park was short. Taiwan has been open to travel for mainland Chinese tourists in recent years, and their visits to Kinmen National Park are typically scheduled as day trips. Hence, the influence exerted by PACCEF on Kinmen National Park was less than that of the other three items (e.g., PTREF, PACTEF, and PFEF). The per capita wastewater treatment ecological footprint (PWWEF) decreased from 0.000011 gha in 2007 to 0.000010 gha in 2011. Consequently, the proportion of PWWEF in PTEF was relatively small (Figure 2).
According to the aforementioned analysis, the primary resource consumption during trips was PACTEF consumption. Because Kinmen National Park is a national historic battlefield park, to maintain the historic battle culture, the reserved building land area in Kinmen National Park considerably exceeds that of other parks, resulting in comparatively higher ACTEF consumption. However, the per capita total EF began to decrease from 2007, primarily because of the increased number of tourists.
Figure 2. The five types of activities and PTEF between 2002 and 2011(unit: gha per capita).
Sustainability 07 04727 g002

3.2. Computation and Analysis Results for Sustainable Tourism Environment Evaluation Indicators

3.2.1. PTES/PTED

Table 7 shows the computation results for PTES/PTED. The per capita tourism ecological deficit (PTED) of Kinmen National Park increased by 45.37% from −0.000364 gha in 2002 to −0.000530 gha in 2011 primarily because of the increased number of tourists. Following the promotion of Project Vanguard for Excellence in Tourism starting in 2002, Taiwan implemented the Doubling Tourist Arrivals Plan and direct cross-Strait transportation in 2008. Additionally, mainland Chinese tourists have been allowed to travel independently in Taiwan since 2011. Consequently, Taiwan has attracted a greater number of tourists from mainland China, Southeast Asia, Europe, and the United States, increasing the number of tourist visitors to Kinmen National Park from 1,436,953 in 2002 to the peak value of 2,164,248 in 2011. Therefore, this study recommends that park authorities actively control the number of tourists in an effort to reduce TED.
Table 7. PTES/PTED and EFI (unit: gha per capita).
YearPTECPTEFPTES/PTEDEFI
IndexLevelRepresentation condition
20020.0050270.005391−0.0003641.074Unsafe
20030.0066340.006702−0.0000681.014Unsafe
20040.0065960.006654−0.0000581.014Unsafe
20050.0072090.0070570.0001520.983Barely safe
20060.0075370.0074000.0001370.983Barely safe
20070.0075400.0073550.0001850.983Barely safe
20080.0071100.007263−0.0001531.024Unsafe
20090.0052090.005625−0.0004161.084Unsafe
20100.0040000.004579−0.0005781.144Unsafe
20110.0033380.003867−0.0005301.164Unsafe

3.2.2. EFI

This study used EFI to measure the ecological security of the park; the results are shown in Table 7. EFI exhibited a declining trend from 1.07 in 2002 to 0.98 in 2007 before increasing from 1.02 in 2008 to 1.16 in 2011. This indicated that during that period, the level of ecological security in Kinmen National Park was unsafe, park development was deviating from sustainable development, and controls were required to improve the situation.

3.2.3. ESI

Table 7 shows the computation results of ESI. Between 2002 and 2009, ESI remained at Level 2, indicating low sustainability. However, since 2010, ESI has declined to Level 3, indicating unsustainability. If not controlled and improved, sustainable ecological development cannot be achieved.

3.2.4. Ecological Footprint Per Capita and Per NT$10,000 GDP

The analysis results of resource utilization efficiency in Kinmen National Park according to EF per NT$10,000 GDP are presented in Table 8. The EF per NT$10,000 GDP decreased from 7434.86 in 2002 to 5842.76 in 2009, indicating an increasing trend in resource utilization efficiency. However, the EF per NT$10,000 GDP increased from 5842.76 in 2009 to 6306.69 in 2011, indicating a decline in resource utilization efficiency.
Table 8. ESI and EF per NT$10,000 GDP.
YearTEFTECPer capita recurrent Income (NT$10,000)ESIEF per NT$10,000 GDP
IndexLevelRepresentational State
20027747.175358208.7391.0420080.5142Low sustainability7434.86
20037297.993898208.7391.0630470.5292Low sustainability6865.17
20047287.677118208.7391.0460240.5302Low sustainability6967.03
20057071.865888208.7391.1090190.5372Low sustainability6376.69
20067092.177778208.7391.1914440.5362Low sustainability5952.59
20077046.624408208.7391.3068850.5382Low sustainability5391.92
20087379.152768208.7391.2925420.5272Low sustainability5709.02
20097800.487648208.7391.3350680.5132Low sustainability5842.76
20108267.912028208.7391.3151370.4983Low unsustainability6286.73
20118369.857828208.7391.3271400.4953Low unsustainability6306.69

4. Conclusions and Recommendations

4.1. Conclusions

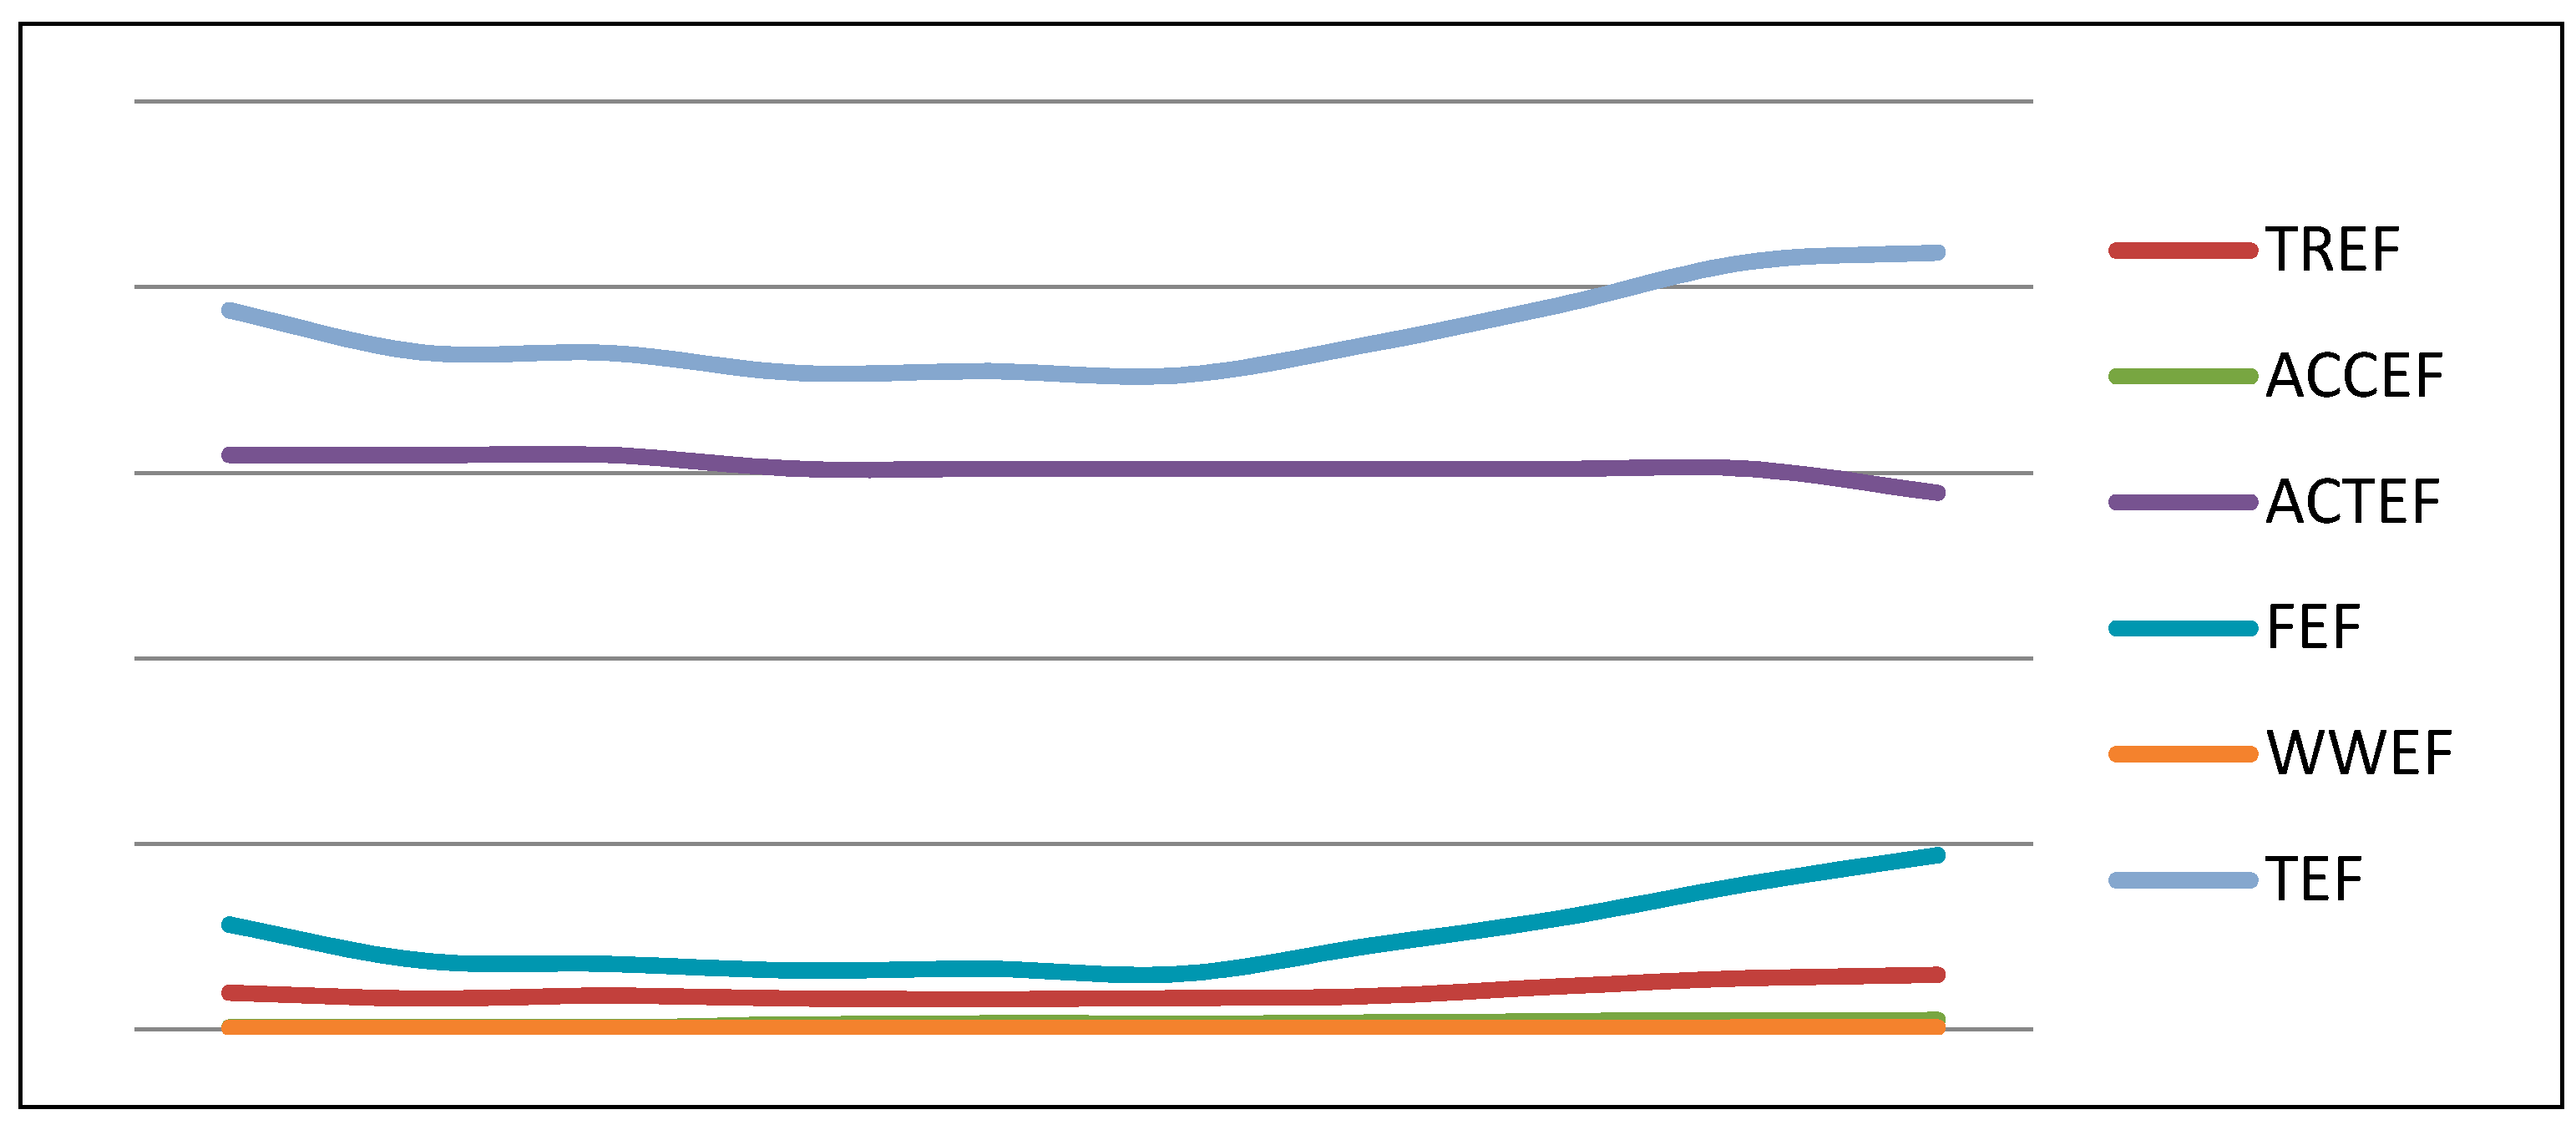
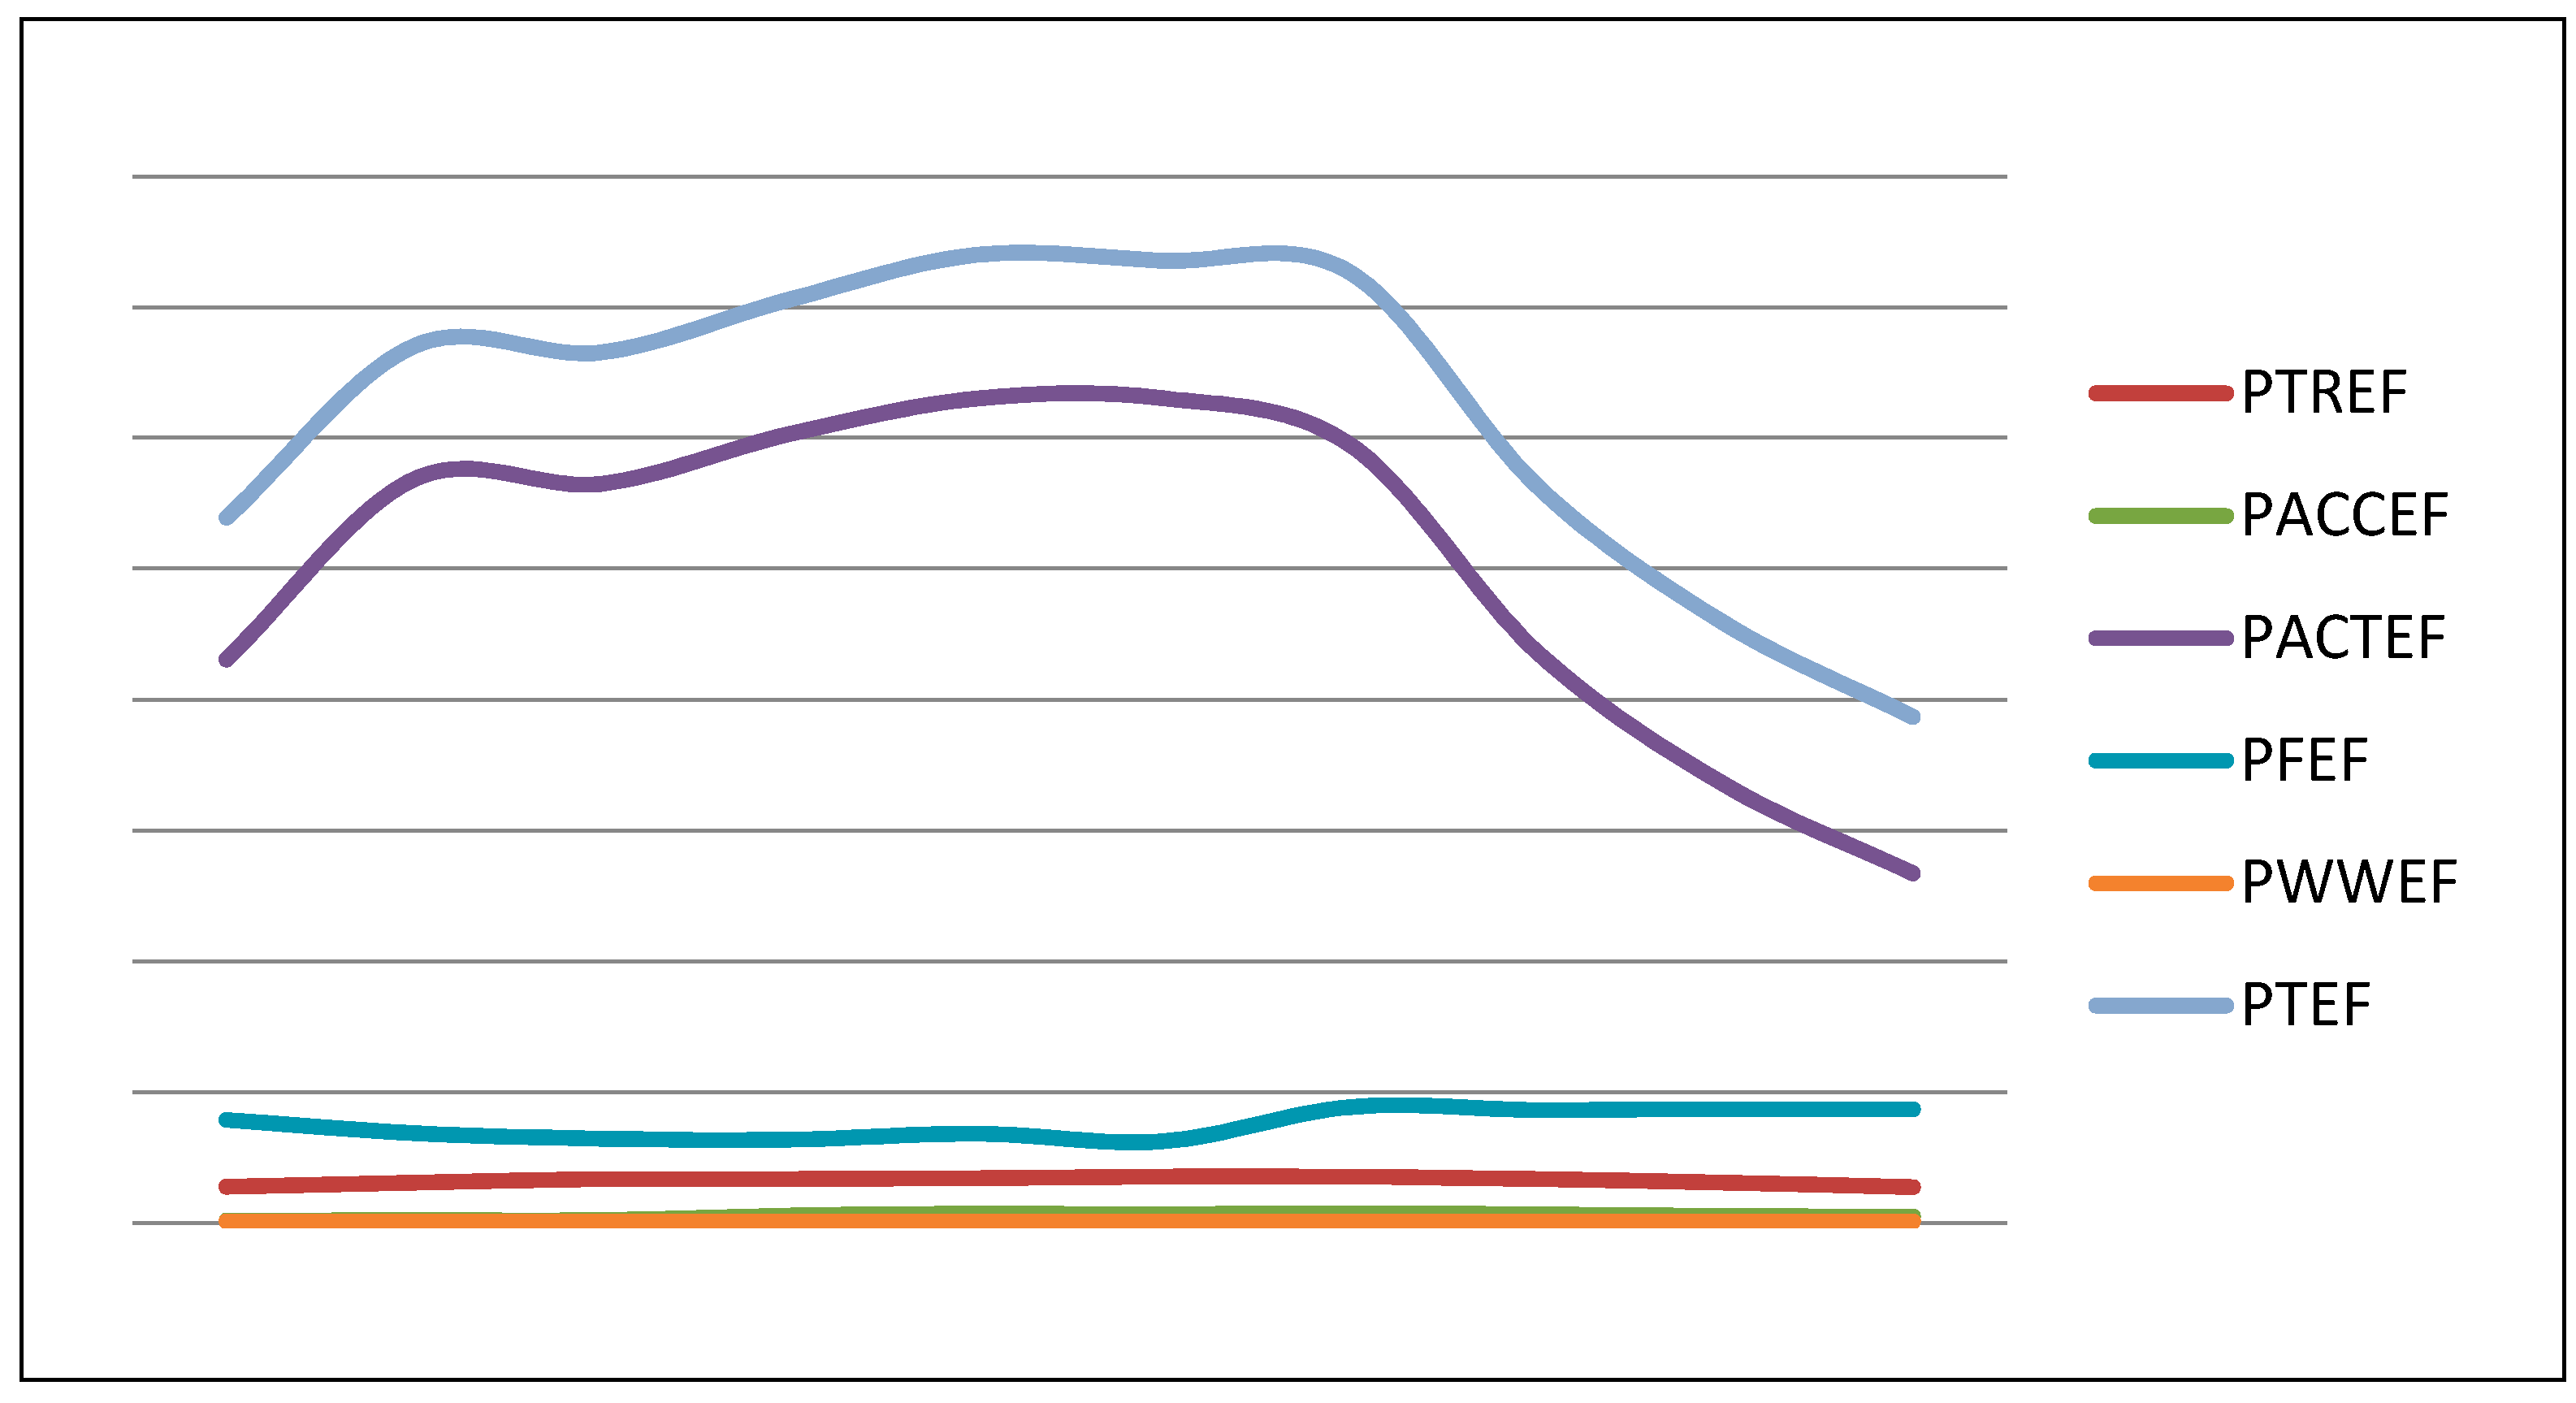
This study employed EF, ecological capacity, and environmental sustainability evaluation indicators to examine the ecological security and resource use efficiency of Kinmen National Park. The empirical results were as follows: (a) TEF increased by 8.03% over 10 years from 7747.175 gha in 2002 to 8369.858 gha in 2011. Among the five activity EFs, ACTEF accounted for the highest proportion (80.4%), followed by FEF (13.26%), TREF (5.37%), ACCEF (0.8%), and WWEF (0.18%), which accounted for the smallest proportion; (b) Regarding environmental sustainability evaluation indicators, PTED increased by approximately 45.37% from −0.000364 gha in 2002 to −0.000530 gha in 2011. In 2011, EFI was ranked Level 4 at 1.16, and ESI was ranked Level 3 at 0.495, indicating that the level of ecological security for Kinmen National Park during that period was unsafe. The EF per NT$10,000 GDP decreased from 7434.86 (gha/NT$10,000) in 2002 to 6306.69 (gha/NT$10,000) in 2011, indicating a decline in resource utilization efficiency. Based on the aforementioned results, with the expanded scale of tourism to Kinmen National Park, the pressure that ecological occupancy exerts on the national ecosystem has exceeded the ecological capacity. The development of Kinmen National Park is likely to deviate from sustainable development if the ecosystem is not improved.
According to the empirical analysis results, the primary factors influencing various types of activity EF are presented below.

4.1.1. Number of Tourists

The number of tourists exerts a positive influence on the total EF from all activities. When tourist numbers increased, EF increased, as did the impact on the environment. From the perspective of per capita EF, the space resource allocated to each person declined with the increase in tourist numbers.

4.1.2. Energy Utilization Efficiency

The increase in fossil energy utilization efficiency effectively reduced the influence that the number of tourists exerted on TREF. However, this influential factor cannot be improved by park managers or decision makers. Thus, an effective method for reducing carbon footprint is to reduce indirect influences and the use of fossil energies.

4.2. Recommendations

Based on the primary research findings, several recommendations were proposed as a reference for managers and relevant organizations. These recommendations are listed below.
(1)
Kinmen National Park authorities should closely monitor the negative influence that tourism development exerts on sustainable development of the ecosystem. The environmental consciousness of tourists should be enhanced to prevent damage to the ecological environment of the park resulting from an excessive number of tourists.
(2)
Kinmen National Park authorities should conduct statistical analysis regarding the number of tourists to estimate the influences that tourists exert on EF; the results can serve as a reference for the sustainable development of Kinmen National Park.
(3)
The empirical analysis results indicated that the fossil energy consumed for transportation EF of Kinmen National Park was the key factor contributing to TREF. Therefore, energy-saving and carbon-reduction approaches to tourism should be promoted. Tourists should be encouraged to use public transportation with low energy intensities and vehicles with low carbon consumption, low energy consumption, and low pollution emissions (e.g., by providing bicycle and electric motorcycle rental services). In addition, global positioning systems should be installed in rental vehicles to enable national parks to effectively monitor the proportion of tourists who engage in recreational activities. Relevant data can be employed to adjust the collection and drop-off schedules at public transportation stations, effectively reducing transportation carbon footprints and the overall amount of fossil energy consumed by transportation.

4.3. Future Suggestion

When the ecological footprint method is used to analyze and evaluate the sustainable development of a tourist area, as ecological footprint is calculated by the year, the environment problems as a result of uneven distribution of tourists in time and space are ignored. Being influenced by climate, holidays, celebrations, etc., tourists are characterized by seasonal fluctuations and the frequency of tourist activities and the concentration of tourists in a tourist area can both trigger special changes in some ecological resources of the tourist area (e.g., concentrated excessive emission of pollutants may cause permanent harm to flora and fauna in tourist areas) and cause permanent damage and such possible effects cannot be manifested in the process of ecological footprint calculation.
Water is one of the most consumed resources in human activities as it is involved in accommodation, catering, sanitation facilities, activities, etc. in the process of tourism. What is more, the ecological footprint of electricity consumption during wastewater treatment in Kinmen Park should also be taken into account. Different from previous research, this paper seeks to include the discharge and disposal of sewage and wastes into ecological footprint calculation. However, as relevant data are hard to obtain, this paper fails to include garbage disposal into the calculation; as a result, this paper may have underestimated the actual biocapacity of Kinmen National Park and it is suggested that follow-up studies incorporate sewage discharge and garbage disposal into the scope of discussion.

Acknowledgments

We thank the Chung Shan Medical University for providing financial support for this research project under grant number CSMU-INT-101-26.

Conflicts of Interest

The author declares no conflict of interest.

References

  1. United Nations World Tourism Organization (UNWTO) World Tourism Barometer (English Verison). Available online: http://www.e-unwto.org/content/h51h370763/?p=e612873b0ad64992b6d7d8921ba9a519&pi=0 (accessed on 1 February 2012).
  2. Construction and Planning Agency, Ministry of the Interior (CPAMI). The Statistical Yearbook of Construction and Planning Agency Ministry of Interior. Available online: http://www.cpami.gov.tw/chinese/index.php?option=com_content&view=article&id=7716&Itemid=103 (accessed on 21 March 2012).
  3. Mark, T.; Brown, S.U. Energy measures of carrying capacity to evaluate economic investments. Popul. Environ. 2001, 22, 471–472. [Google Scholar] [CrossRef]
  4. Xu, L.; Kang, P.; Wei, J. Evaluation of urban ecological carrying capacity: A case study of Beijing, China. Energy Policy 2010, 2, 1873–1880. [Google Scholar]
  5. Zeng, C.; Liu, Y.; Liu, Y.; Hu, J.; Bai, X.; Yang, X. An integrated approach for assessing aquatic ecological carrying capacity: A case study of Wujin District in the Tai Lake Basin, China. Int. J. Environ. Res. Public Health 2011, 8, 264–280. [Google Scholar] [CrossRef] [PubMed]
  6. Chen, Y.; Chen, C.Y.; Hsieh, T. Establishment and applied research on environmental sustainability assessment indicators in Taiwan. Environ. Monit. Assess. 2009, 155, 407–417. [Google Scholar] [CrossRef] [PubMed]
  7. Chen, Y.; Chen, C.Y.; Hsieh, T. Exploration of sustainable development by applying green economy indicators. Environ. Monit. Assess. 2011, 182, 279–289. [Google Scholar] [CrossRef] [PubMed]
  8. Zhang, Y.; Yang, Z.; Yu, X. Measurement and evaluation of interactions in complex urban ecosystem. Ecol. Model. 2006, 96, 77–89. [Google Scholar] [CrossRef]
  9. Wackernagel, M.; Rees, W.E. Our Ecological Footprin: Reducing Human Impact on the Earth; New Society Publishers: Gabriola Island, BC, Canada, 1996. [Google Scholar]
  10. Rees, W.E. Eco-footprint analysis: Merits and brickbats. Ecol. Econ. 2000, 32, 371–374. [Google Scholar] [CrossRef]
  11. Wackernagel, M.; Yount, J.D. Footprints for sustainability: The next steps. Environ. Dev. Sustain. 2000, 2, 23–44. [Google Scholar] [CrossRef]
  12. Gössling, S.; Hansson, C.B.; Hörstmeier, O.; Saggel, S. Ecological footprint analysis as a tool to assess tourism sustainability. Ecol. Econ. 2002, 43, 199–211. [Google Scholar] [CrossRef]
  13. Hunter, C. Sustainable tourism and the touristic ecological footprint. Environ. Dev. Sustain. 2002, 4, 7–20. [Google Scholar] [CrossRef]
  14. Cole, V.; Sinclair, A.J. Measuring the ecological footprint of a Himalayan Tourist Center. Mt. Res. Dev. 2002, 22, 132–141. [Google Scholar] [CrossRef]
  15. Bagliani, M.; Da Villa, E.; Gattolin, M.; Niccolucci, V.; Patterson, T.; Tiezzi, E. The ecological footprint analysis for the Province of Venice and the relevance of tourism. In The Sustainable City III. Urban Regeneration and Sustainability; Marchettini, N., Brebbia, C.A., Tiezzi, E., Wadhwa, L.C., Eds.; WIT Press: Southampthon, UK, 2004; pp. 123–131. [Google Scholar]
  16. Patterson, T.M.; Niccolucci, V.; Bastianoni, S. Beyond “more is better”: Ecological footprint accounting for tourism and consumption in Val di Merse, Italy. Ecol. Econ. 2007, 62, 747–756. [Google Scholar] [CrossRef]
  17. Kytzia, S.; Walz, A.; Wegmann, M. How can tourism use land more efficiently? A model–based approach to land–use efficiency for tourist destinations. Tour. Manag. 2011, 32, 629–640. [Google Scholar] [CrossRef]
  18. Li, H.; Hou, L. Evaluation on sustainable development of scenic zone based on tourism ecological footprint: Case study of Yellow Crane Tower in Hubei Province, China. Energy Procedia 2011, 5, 145–151. [Google Scholar] [CrossRef]
  19. Ponsioen, T.C.; Hengsdijk, H.; Wolf, J.; Ittersum, M.K.; Rötter, R.P.; Son, T.T.; Laborte, A.G. TechnoGIN, a tool for exploring and evaluating resource use efficiency of cropping systems in East and Southeast Asia. Agric. Syst. 2006, 87, 80–100. [Google Scholar] [CrossRef]
  20. Fernándeza, M.D.; Cagigal, E.; Vega, M.M. Ecological risk assessment of contaminated soils through direct toxicity assessment. Ecotoxicol. Environ. Safety 2005, 62, 174–184. [Google Scholar] [CrossRef] [PubMed]
  21. Critto, A.; Torresan, S.; Semenzin, E. Development of a site–specific ecological risk assessment for contaminated sites: Part I. A multi–criteria based system for the selection of ecotoxicological tests and ecological observations. Sci. Total Environ. 2007, 379, 16–33. [Google Scholar] [CrossRef] [PubMed]
  22. Bouyer, J.; Sana, Y.; Samandoulgou, Y. Identification of ecological indicators for monitoring ecosystem health in the trans–boundary W Regional Park: A pilot study. Biol. Conserv. 2007, 138, 73–88. [Google Scholar] [CrossRef]
  23. Pollino, C.A.; Woodberry, O.; Nicholson, A. Parameterisation and evaluation of a Bayesian network for use in an ecological risk assessment. Environ. Model. Softw. 2007, 22, 1140–1152. [Google Scholar] [CrossRef]
  24. Luijten, J.C.; Knappb, E.B.; Jonesa, J.W. A tool for community based assessment of the implications of development on water security in hillside watersheds. Agric. Syst. 2001, 70, 603–622. [Google Scholar] [CrossRef]
  25. Voinov, A.; Fitz, C.; Boumans, R. Modular ecosystem modeling. Environ. Model. Softw. 2004, 19, 285–304. [Google Scholar] [CrossRef]
  26. Bousquet, F.; Le Page, C. Multiagent simulations and ecosystem management: A review. Ecol. Model. 2004, 176, 313–332. [Google Scholar] [CrossRef]
  27. Robinson, J.; Bradley, M.; Busby, P.; Connor, D.; Murray, A.; Sampson, B.; Soper, B.W. Climate change and sustainable development: Realizing the opportunity. Ambio 2006, 35, 2–8. [Google Scholar] [PubMed]
  28. Warhurst, A. Mining, mineral processing, and extractive metallurgy: An overview of the technologies and their impact on the physical environment. In Environmental Policy in Mining: Corporate Strategy and Planning for Closure; Warhurst, A., Noronha, L., Eds.; CRC Press LLC: Boca Raton, FL, USA, 2000. [Google Scholar]
  29. Singh, R.K.; Murty, H.R.; Gupta, S.K.; Dikshit, A.K. An overview of sustainability assessment methodologies. Ecol. Indic. 2012, 15, 281–299. [Google Scholar] [CrossRef]
  30. Rasul, G.; Thapa, G.B. Sustainability analysis of ecological and conventional agricultural systems in Bangladesh. World Dev. 2003, 31, 1721–1741. [Google Scholar] [CrossRef]
  31. Bhandari, B.S.; Grant, M. Analysis of livelihood security: A case study in the Kali–Khola watershed of Nepal. J. Environ. Manag. 2007, 85, 17–26. [Google Scholar] [CrossRef]
  32. Siche, J.R.; Agostinho, F.; Ortega, E.; Romeiro, A. Sustainability of nations by indices: Comparative study between environmental sustainability index, ecological footprint and the energy performance indices. Ecol. Econ. 2008, 66, 628–637. [Google Scholar] [CrossRef]
  33. Liu, R.Z.; Borthwick, A.G.L. Measurement and assessment of carrying capacity of the environment in Ningbo, China. J. Environ. Manag. 2011, 92, 2047–2053. [Google Scholar] [CrossRef]
  34. Yuan, S.F. Study on regional land ecological security evolvement: A case of Hangzhou. J. Camb. Stud. 2011, 6, 30–40. [Google Scholar]
  35. Martin-Cejas, R.R.; Sanchez, P.P.R. Ecological footprint analysis of road transport related to tourism activity: The case for Lanzarote Island. Tour. Manag. 2010, 31, 98–103. [Google Scholar] [CrossRef]
  36. Kinmen National Park Administration Office. Visitor Number Statistics. Available online: http://www.kmnp.gov.tw/ct/index.php?option=com_openinfo&view=openinfo&Itemid=313 (accessed on 5 February 2013).
  37. The Equipment Management System of Taiwan National Park. The Statistical Table of Public Facility Classification, Kinmen National Park Administration Office. Available online: http://nppw.cpami.gov.tw/index.php (accessed on 10 February 2013).
  38. Construction and Planning Agency, Ministry of the Interior. Visitations and Revenues of National Parks. Available online: http://np.cpami.gov.tw/chinese/index.php?option=com_statistics&view=statistics&Itemid=182&gp=1 (accessed on 12 February 2013).
  39. Tourism Bureau, M.O.T.C. Republic of China. Monthly Report of Home Stay Facilities. Available online: http://admin.taiwan.net.tw/statistics/month2.aspx?no=194 (accessed on 10 March 2013).
  40. Council of Agriculture. Food Supply and Utilization. Available online: http://agrstat.coa.gov.tw/sdweb/public/book/Book.aspx (accessed on 6 March 2013).
  41. Global Footprint Network. Ecological Footprint Atlas 2010. Available online: http://www.footprintnetwork.org/en/index.php/GFN/page/ecological_footprint_atlas_2010 (accessed on 18 March 2012).
  42. United Nations World Tourism Organization (UNWTO). Compendium of Tourism Statistics; UNWTO: Madrid, Spain, 2001. [Google Scholar]
  43. Rees, W.E. Getting Serious about Urban Sustainability: Eco-Footprints and the Vulnerability of 21st Century Cities. In Canadian Cities in Transition: New Directions in the Twenty–first Century; Oxford University Press: Toronto, ON, Canada, 2011; pp. 70–86. [Google Scholar]
  44. Moore, J.; Kissinger, M.; Rees, W.E. An urban metabolism and ecological footprint assessment of Metro Vancouver. J. Environ. Manag. 2013, 124, 51–61. [Google Scholar] [CrossRef]
  45. Xiao, L.; Dong, L.L.; Lan, Y.X.; Zhao, X.G.; Wang, Y.M. Ecological security assessment in Jiangxi Province based on Ecological Tension Index. Areal Res. Dev. 2008, 27, 117–120. [Google Scholar]
  46. World Economic Forum; Yale Center for Environmental Law and Policy; Center for International Earth Science Information Network (CIESIN) of Columbia University; Joint Research Centre of the European Commission. Environmental Sustainability Index, 2005. Available online: http://www.ciesin.columbia.edu/indicators/ESI/ (accessed on 9 August 2010).
  47. Cui, Y.; Hens, L.; Zhu, Y.; Zhao, J. Environmental sustainability index of Shandong Province, China. Int. J. Sustain. Dev. World Ecol. 2004, 11, 227–233. [Google Scholar] [CrossRef]
  48. Meyfroidt, P.; Rudel, T.K.; Lambina, E.F. Forest transitions, trade, and the global displacement of land use. Proc. Natl. Acad. Sci. USA 2010, 107, 20917–20922. [Google Scholar] [CrossRef] [PubMed]

